Churn analytics gap
18
1 Drivers of Customer Churn in Wireless Telecom
-
Upload
global-analytics-partners -
Category
Data & Analytics
-
view
86 -
download
0
Transcript of Churn analytics gap

1
Drivers of Customer Churn in Wireless Telecom
2
2
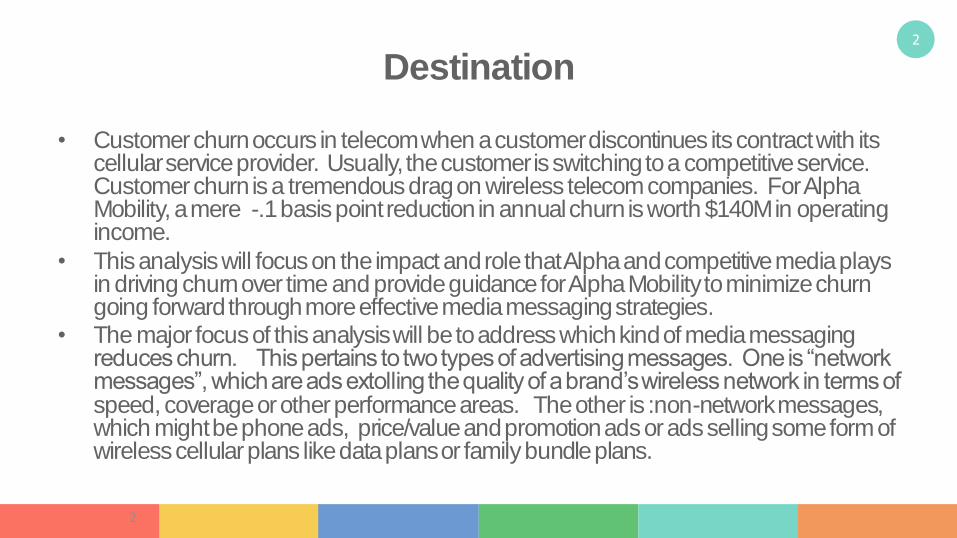
Destination
• Customer churn occurs in telecom when a customer discontinues its contract with its cellular service provider. Usually, the customer is switching to a competitive service. Customer churn is a tremendous drag on wireless telecom companies. For Alpha Mobility, a mere -.1 basis point reduction in annual churn is worth $140M in operating income.
• This analysis will focus on the impact and role that Alpha and competitive media plays in driving churn over time and provide guidance for Alpha Mobility to minimize churn going forward through more effective media messaging strategies.
• The major focus of this analysis will be to address which kind of media messaging reduces churn. This pertains to two types of advertising messages. One is “network messages”, which are ads extolling the quality of a brand’s wireless network in terms of speed, coverage or other performance areas. The other is :non-network messages, which might be phone ads, price/value and promotion ads or ads selling some form of wireless cellular plans like data plans or family bundle plans.

3
3
Model Architecture
Network Message GRPsNon-Network Message GRPs
NationalMedia
CompetitiveMedia
Beta Corp. GRPsGamma Corp. GRPs
Seasonality
Market Pooled Dummy Var.
Churn Jan05-Mar07 Region(4)
Model architecture was a multivariate model pooled by market within region (4
models), from Jan05-Mar07, driven by national Alpha Mobility GRPs by message,
competitive GRPs and seasonality. Data source was Telephia Market-Metrics
monthly churn
4
4
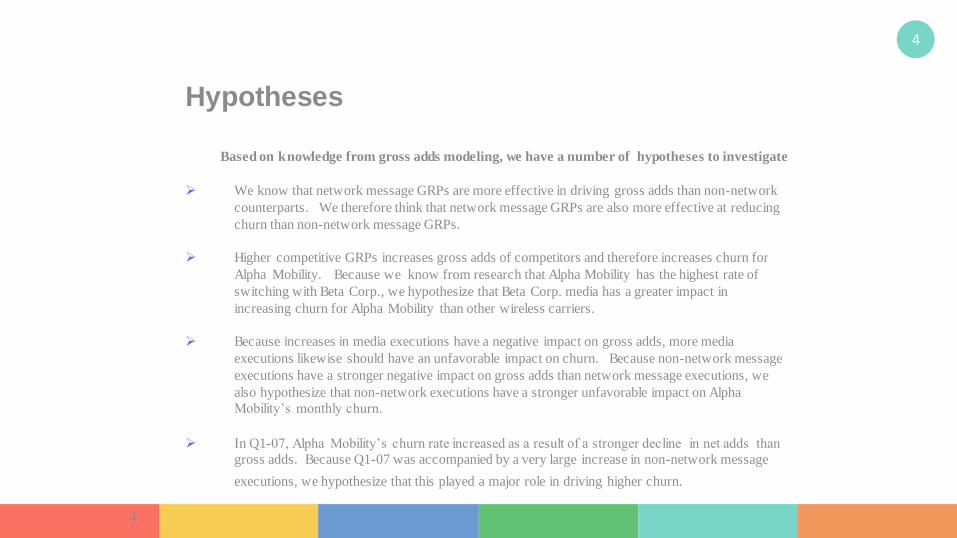
Hypotheses
Based on knowledge from gross adds modeling, we have a number of hypotheses to investigate
We know that network message GRPs are more effective in driving gross adds than non-network
counterparts. We therefore think that network message GRPs are also more effective at reducing
churn than non-network message GRPs.
Higher competitive GRPs increases gross adds of competitors and therefore increases churn for
Alpha Mobility. Because we know from research that Alpha Mobility has the highest rate of
switching with Beta Corp., we hypothesize that Beta Corp. media has a greater impact in
increasing churn for Alpha Mobility than other wireless carriers.
Because increases in media executions have a negative impact on gross adds, more media
executions likewise should have an unfavorable impact on churn. Because non-network message
executions have a stronger negative impact on gross adds than network message executions, we
also hypothesize that non-network executions have a stronger unfavorable impact on Alpha
Mobility’s monthly churn.
In Q1-07, Alpha Mobility’s churn rate increased as a result of a stronger decline in net adds than
gross adds. Because Q1-07 was accompanied by a very large increase in non-network message
executions, we hypothesize that this played a major role in driving higher churn.
5
5
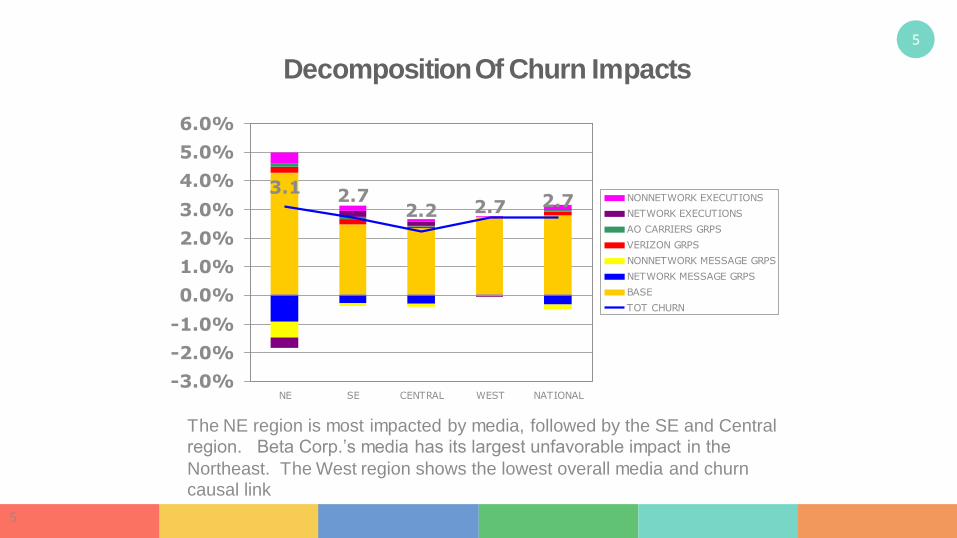
Decomposition Of Churn Impacts
3.1 2.72.2 2.7 2.7
-3.0%
-2.0%
-1.0%
0.0%
1.0%
2.0%
3.0%
4.0%
5.0%
6.0%
NE SE CENTRAL WEST NATIONAL
NONNETWORK EXECUTIONS
NETWORK EXECUTIONS
AO CARRIERS GRPS
VERIZON GRPS
NONNETWORK MESSAGE GRPS
NETWORK MESSAGE GRPS
BASE
TOT CHURN
The NE region is most impacted by media, followed by the SE and Central region. Beta Corp.’s media has its largest unfavorable impact in the
Northeast. The West region shows the lowest overall media and churn causal link
6
6
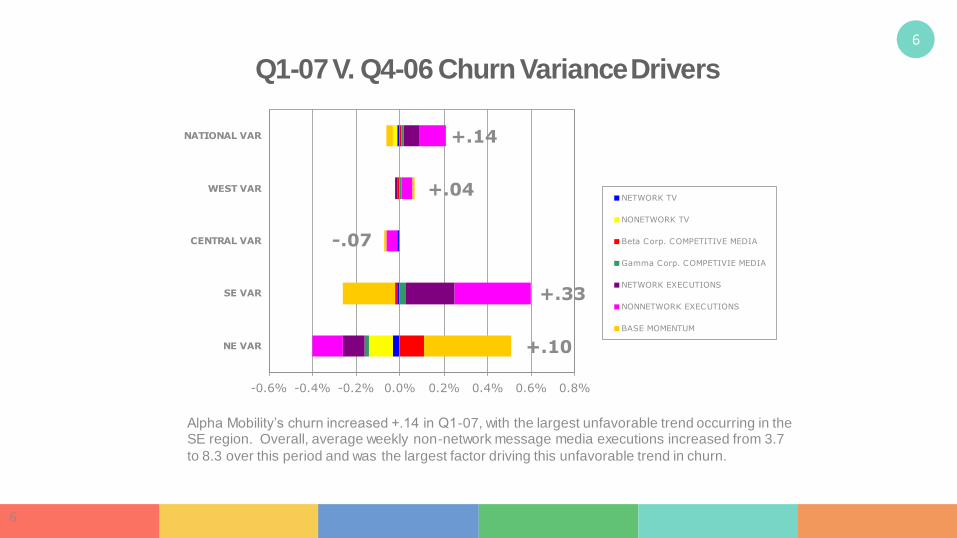
Q1-07 V. Q4-06 Churn Variance Drivers
-.07
+.33
+.14
+.10
+.04
-0.6% -0.4% -0.2% 0.0% 0.2% 0.4% 0.6% 0.8%
NE VAR
SE VAR
CENTRAL VAR
WEST VAR
NATIONAL VAR
NETWORK TV
NONETWORK TV
Beta Corp. COMPETITIVE MEDIA
Gamma Corp. COMPETIVIE MEDIA
NETWORK EXECUTIONS
NONNETWORK EXECUTIONS
BASE MOMENTUM
Alpha Mobility’s churn increased +.14 in Q1-07, with the largest unfavorable trend occurring in the SE region. Overall, average weekly non-network message media executions increased from 3.7
to 8.3 over this period and was the largest factor driving this unfavorable trend in churn.
7
7
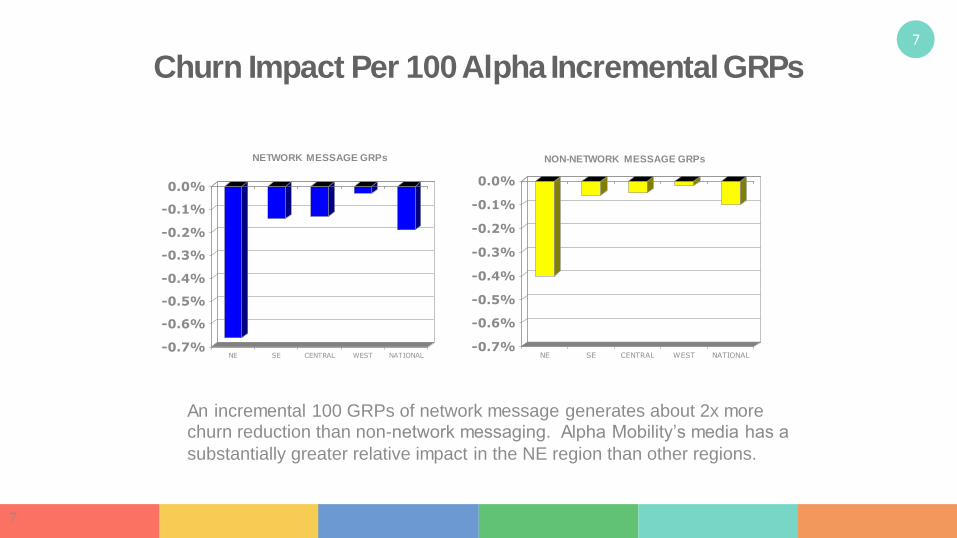
Churn Impact Per 100 Alpha Incremental GRPs
-0.7%
-0.6%
-0.5%
-0.4%
-0.3%
-0.2%
-0.1%
0.0%
NE SE CENTRAL WEST NATIONAL-0.7%
-0.6%
-0.5%
-0.4%
-0.3%
-0.2%
-0.1%
0.0%
NE SE CENTRAL WEST NATIONAL
NETWORK MESSAGE GRPs NON-NETWORK MESSAGE GRPs
An incremental 100 GRPs of network message generates about 2x more churn reduction than non-network messaging. Alpha Mobility’s media has a
substantially greater relative impact in the NE region than other regions.

8
8
Churn Impact Per 100 Competitive Incremental GRPs
0.00%
0.01%
0.02%
0.03%
0.04%
0.05%
NE SE CENTRAL WEST NATIONAL
0.00%
0.01%
0.02%
0.03%
0.04%
0.05%
NE SE CENTRAL WEST NATIONAL
Beta Corp. MESSAGE GRPs AO CARRIERS MESSAGE GRPs
An incremental 100 GRPs for Beta Corp. has a 4x greater and detrimental impact on Alpha churn than all other carriers’ GRPs combined. Overall, it
takes about 100 GRPs per week to counter the impact of competitive media
9
9
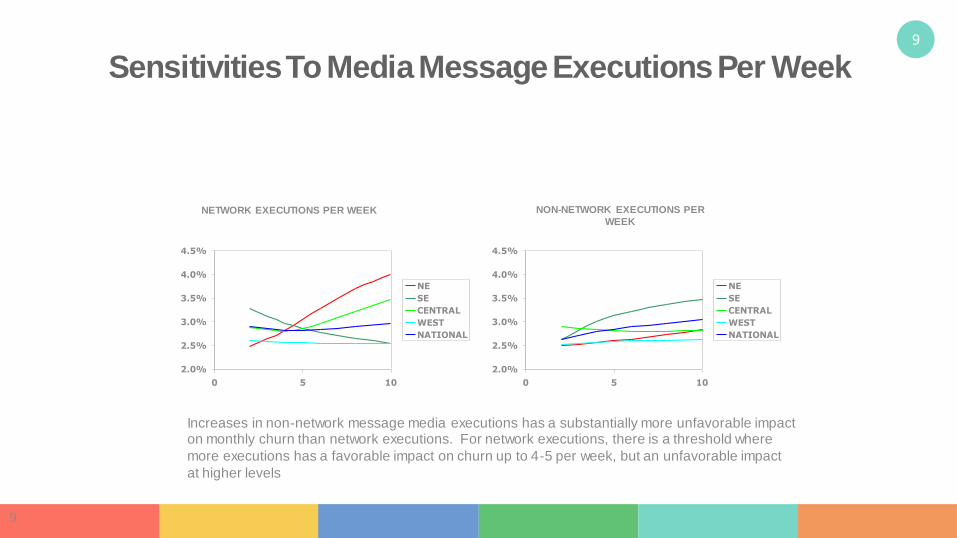
Sensitivities To Media Message Executions Per Week
2.0%
2.5%
3.0%
3.5%
4.0%
4.5%
0 5 10
NE
SE
CENTRAL
WEST
NATIONAL
2.0%
2.5%
3.0%
3.5%
4.0%
4.5%
0 5 10
NE
SE
CENTRAL
WEST
NATIONAL
NETWORK EXECUTIONS PER WEEK NON-NETWORK EXECUTIONS PER
WEEK
Increases in non-network message media executions has a substantially more unfavorable impact on monthly churn than network executions. For network executions, there is a threshold where
more executions has a favorable impact on churn up to 4-5 per week, but an unfavorable impact
at higher levels
10
10
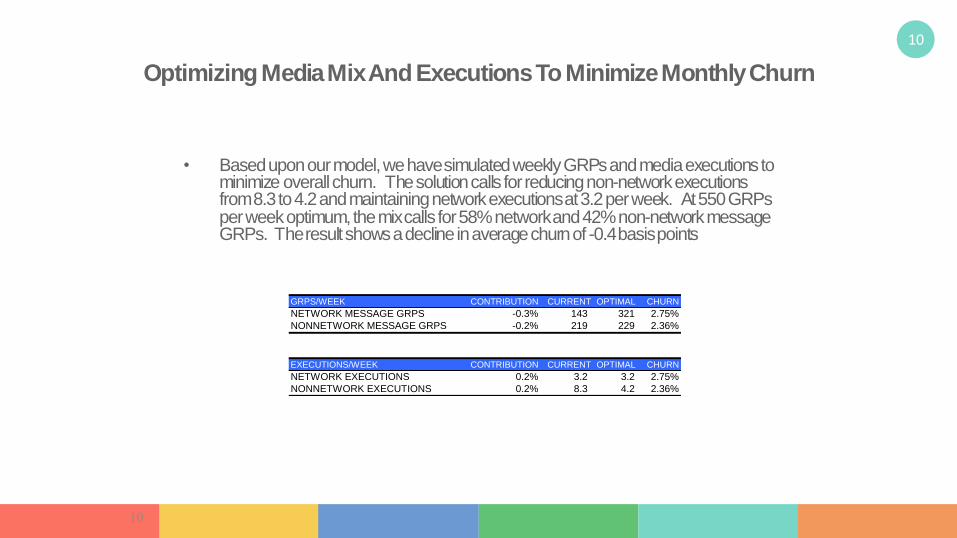
Optimizing Media Mix And Executions To Minimize Monthly Churn
• Based upon our model, we have simulated weekly GRPs and media executions to minimize overall churn. The solution calls for reducing non-network executions from 8.3 to 4.2 and maintaining network executions at 3.2 per week. At 550 GRPs per week optimum, the mix calls for 58% network and 42% non-network message GRPs. The result shows a decline in average churn of -0.4 basis points
GRPS/WEEK CONTRIBUTION CURRENT OPTIMAL CHURN
NETWORK MESSAGE GRPS -0.3% 143 321 2.75%
NONNETWORK MESSAGE GRPS -0.2% 219 229 2.36%
EXECUTIONS/WEEK CONTRIBUTION CURRENT OPTIMAL CHURN
NETWORK EXECUTIONS 0.2% 3.2 3.2 2.75%
NONNETWORK EXECUTIONS 0.2% 8.3 4.2 2.36%
11
11
Key Principles
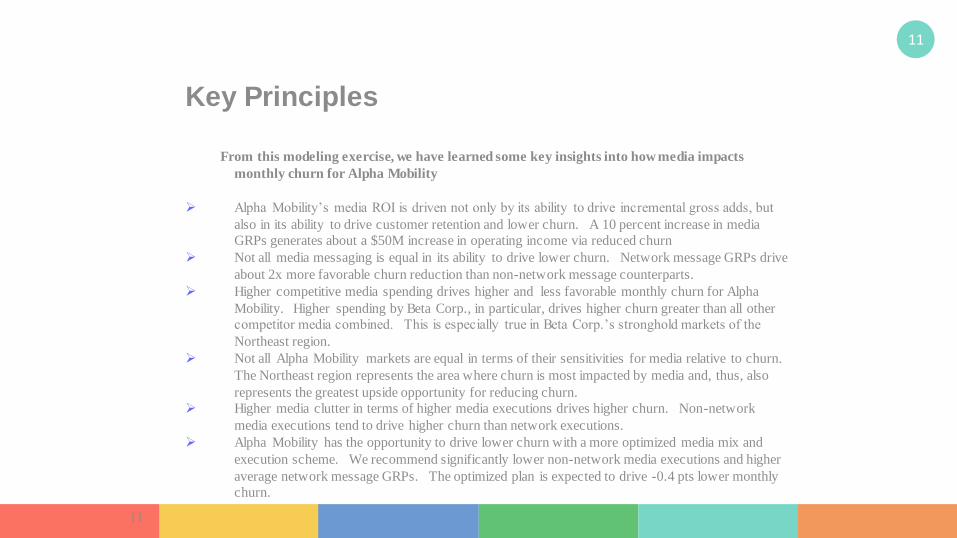
From this modeling exercise, we have learned some key insights into how media impacts
monthly churn for Alpha Mobility
Alpha Mobility’s media ROI is driven not only by its ability to drive incremental gross adds, but
also in its ability to drive customer retention and lower churn. A 10 percent increase in media
GRPs generates about a $50M increase in operating income via reduced churn
Not all media messaging is equal in its ability to drive lower churn. Network message GRPs drive
about 2x more favorable churn reduction than non-network message counterparts.
Higher competitive media spending drives higher and less favorable monthly churn for Alpha
Mobility. Higher spending by Beta Corp., in particular, drives higher churn greater than all other
competitor media combined. This is especially true in Beta Corp.’s stronghold markets of the
Northeast region.
Not all Alpha Mobility markets are equal in terms of their sensitivities for media relative to churn.
The Northeast region represents the area where churn is most impacted by media and, thus, also
represents the greatest upside opportunity for reducing churn.
Higher media clutter in terms of higher media executions drives higher churn. Non-network
media executions tend to drive higher churn than network executions.
Alpha Mobility has the opportunity to drive lower churn with a more optimized media mix and
execution scheme. We recommend significantly lower non-network media executions and higher
average network message GRPs. The optimized plan is expected to drive -0.4 pts lower monthly
churn.
12
12
Model Validations
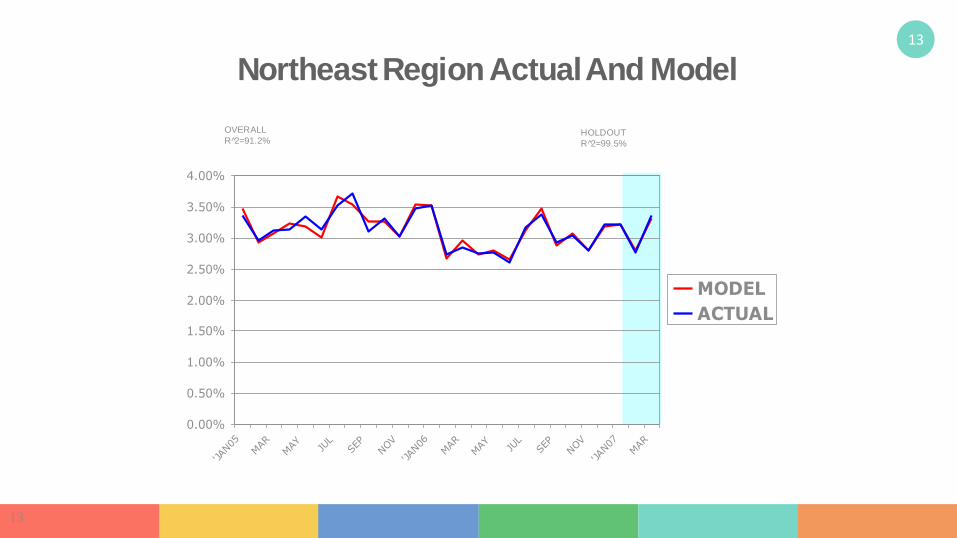
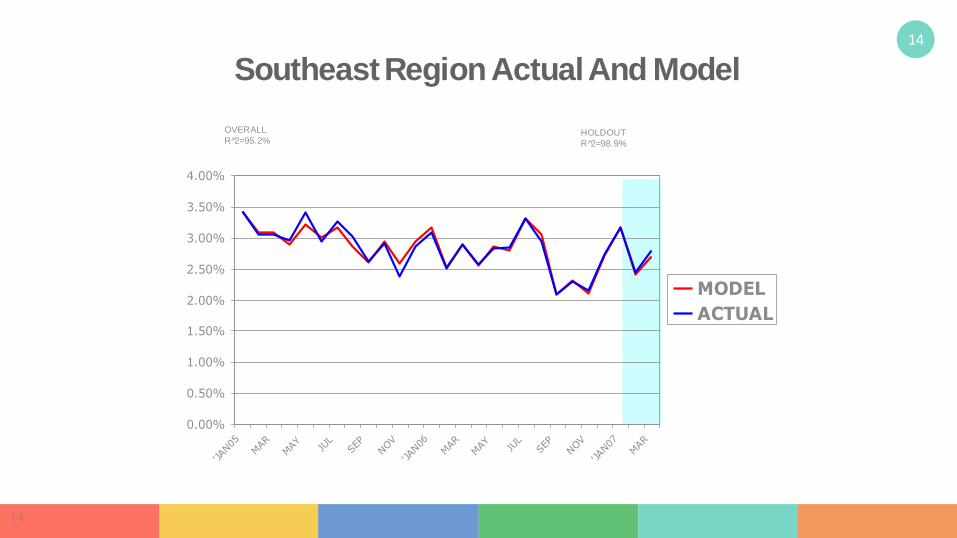
• The following four charts show actual and modeled churn from the four regions. Overall R squared fits average over 90 percent and blind holdout fits over 98 percent indicate very robust models with excellent predictive capabilities.
13
13
0.00%
0.50%
1.00%
1.50%
2.00%
2.50%
3.00%
3.50%
4.00%
'JAN05
MAR
MAY
JUL
SEP
NOV
'JAN06
MAR
MAY
JUL
SEP
NOV
'JAN07
MAR
MODEL
ACTUAL
Northeast Region Actual And Model
HOLDOUT
R 2̂=99.5%
OVERALL
R 2̂=91.2%
14
14
0.00%
0.50%
1.00%
1.50%
2.00%
2.50%
3.00%
3.50%
4.00%
'JAN05
MAR
MAY
JUL
SEP
NOV
'JAN06
MAR
MAY
JUL
SEP
NOV
'JAN07
MAR
MODEL
ACTUAL
Southeast Region Actual And Model
HOLDOUT
R 2̂=98.9%
OVERALL
R 2̂=95.2%

15
15
0.00%
0.50%
1.00%
1.50%
2.00%
2.50%
3.00%
3.50%
'JAN05
MAR
MAY
JUL
SEP
NOV
'JAN06
MAR
MAY
JUL
SEP
NOV
'JAN07
MAR
MODEL
ACTUAL
Central Region Actual And Model
HOLDOUT
R 2̂=99.8%
OVERALL
R 2̂=87.8%

16
16
0.00%
0.50%
1.00%
1.50%
2.00%
2.50%
3.00%
3.50%
'JAN05
MAR
MAY
JUL
SEP
NOV
'JAN06
MAR
MAY
JUL
SEP
NOV
'JAN07
MAR
MODEL
ACTUAL
West Region Actual And Model
HOLDOUT
R 2̂=99.9%
OVERALL
R 2̂=88.4%
17
17
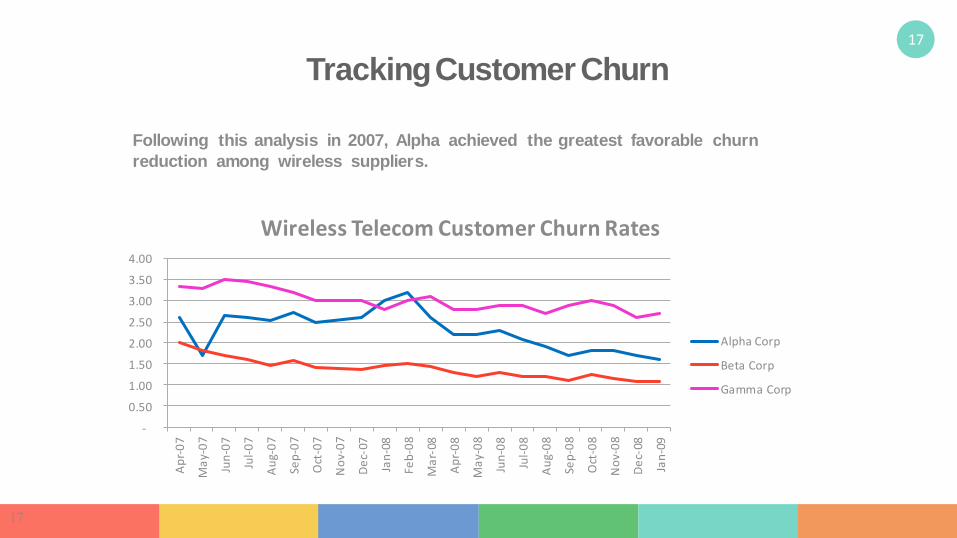
Tracking Customer Churn
-
0.50
1.00
1.50
2.00
2.50
3.00
3.50
4.00
Ap
r-0
7
Ma
y-0
7
Jun
-07
Jul-
07
Au
g-0
7
Sep
-07
Oct
-07
No
v-0
7
De
c-07
Jan
-08
Feb
-08
Ma
r-08
Ap
r-0
8
Ma
y-0
8
Jun
-08
Jul-
08
Au
g-0
8
Sep
-08
Oct
-08
No
v-0
8
De
c-08
Jan
-09
Wireless Telecom Customer Churn Rates
Alpha Corp
Beta Corp
Gamma Corp
Following this analysis in 2007, Alpha achieved the greatest favorable churn
reduction among wireless suppliers.

18
Bangalore, IN Office:
No. 141, 2nd Cross, 2nd Main,Domlur, 2nd Stage, Bangalore 560071Phone: +91 80 40917572, +91 80 [email protected]
Contact Us US Office:
Suite 100, 1780 Chadds Lake Dr, NE
Marietta, Georgia, 30068-1608
Atlanta, USA


![Filling the learning analytics gap for high-stakes exams€¦ · HERDSA Conference, Melbourne, 6-9 July 2015 [Refereed, abstract] 1 Filling the learning analytics gap for high-stakes](https://static.fdocuments.us/doc/165x107/5f1f6e0025d39e3da305c510/filling-the-learning-analytics-gap-for-high-stakes-exams-herdsa-conference-melbourne.jpg)