Churchill High School - livoniapublicschools.org · AP EXAMS Churchill State 2016-2017 2015-2016...
45
Marjorie Moore, Principal 2017-2018 Annual Education Report Kevin Etue, Principal 8900 Newburgh Road Livonia, MI 48150 734-744-2650 LIVONIA PUBLIC SCHOOLS Churchill High School http://churchill.livoniapublicschools.org BOARD OF EDUCATION 2017-18 Colleen Burton, President Mark Johnson, Vice President Dan Centers, Secretary Tammy Bonifield, Trustee Karen Bradford, Trustee Crystal Frank, Trustee Liz Jarvis, Trustee ____________ Andrea L. Oquist, Superintendent
-
Upload
truongkien -
Category
Documents
-
view
212 -
download
0
Transcript of Churchill High School - livoniapublicschools.org · AP EXAMS Churchill State 2016-2017 2015-2016...
Marjorie Moore, Principal
2017-2018 Annual Education Report
Kevin Etue, Principal
8900 Newburgh Road Livonia, MI 48150
734-744-2650
LIVONIA PUBLIC SCHOOLS
Churchill High School http://churchill.livoniapublicschools.org
BOARD OF EDUCATION 2017-18
Colleen Burton, President Mark Johnson, Vice President
Dan Centers, Secretary Tammy Bonifield, Trustee Karen Bradford, Trustee Crystal Frank, Trustee
Liz Jarvis, Trustee ____________
Andrea L. Oquist, Superintendent

May 23, 2018 Dear Parents and Community Members: I am pleased to present you with the Annual Education Report (AER) which provides key information about the continuous improvement goals and educational progress of Churchill High School students based on 2016-17 assessment results. The AER addresses the complex reporting information required by federal and state laws. The school’s report contains information about student assessment, accountability and teacher quality. If you have any questions about the AER, please contact me, John Stanton, Principal of Churchill High School, for assistance. The AER is available for you to review electronically by visiting the following web site http://churchill.livoniapublicschools.org or you may review a copy in the main office of our school. Schools have been identified using new definitions and labels as required in the Every Student Succeeds Act (ESSA) based on their 2016-17 State Testing Results. A Target Support and Improvement (TSI) school is one that has at least one underperforming student group. An Additional Targeted Support (ATS) school is one that has three or more underperforming student subgroups. A Comprehensive Support and Improvement (CSI) school is one whose performance is in the lowest 5% of all schools in the state. Some schools are not identified with any of these labels. In these cases, no label is given. Our school has not been given one of these labels. The AER has two major sections to it that are required by state law. The information contained in the first section was compiled by district staff. It presents relevant information about our district, our academic programs, school improvement efforts, two years of results on district developed assessments and nationally norm-referenced assessments. It also includes the district’s parent involvement policy and specialized programs. The second section of the report contains information provided by the Michigan Department of Education. At Churchill High School we have several key challenges we are facing as it pertains to our State test scores. The challenges are to improve our subgroup test scores and bring the students in those groups to the levels they need to be so they are meeting the State proficiency targets. The three largest target groups for Churchill High School are the bottom 30%, students with disabilities, and black or African American students. We are instituting or continuing the following initiatives to help address the scoring gap between our proficient students and the bottom 30%, our students with disabilities, and our black or African American students. We are working to address these issues in the following ways:
• Continuing to refine Churchill’s school improvement plan to meet the needs of all Churchill students.
• Continuing Algebra Lab, supported by i-Ready, to help freshmen who need to increase math skills.
• Utilizing i-Ready to improve reading levels for students in Academic Prep. • Continuing the liaison model for supporting resource room students. • Continuing to run classes for struggling learners such as Academic Prep, Educational
Strategies, and Academic Success Strategies. • Expanding our before- and after-school programs to include more peer tutoring and staff
interaction with students in classrooms and computer labs.
15125 Farmington Road • Livonia • MI • 48154 Phone (734) 744-2500
2
• Implementing math reinforcement course • Implementing ELA reinforcement course
These initiatives are intended to accelerate the student achievement of subgroups, including the bottom 30%, students with disabilities, and black and African American students that are not meeting our school’s proficiency targets. Our collaborative efforts positively impact our school’s success and student achievement. Sincerely, Kevin Etue Principal
Livonia Public Schools prohibits unlawful discrimination on the basis of race, color, religion, sex, national origin, age, height, weight, marital status, handicap or disability in any of its educational programs or activities. The following person has been designated to handle inquiries and grievances regarding discrimination based on race, color, religion, sex, national origin, age, height, weight, and marital status-Director of Human Resources, 15125 Farmington Road, Livonia, MI 48154 at (734) 744-2501 . The following person has been designated to handle inquiries and grievances regarding discrimination based on handicap or disability-Director of Student Services, 15125 Farmington Road, Livonia, MI 48154 at (734) 744-2524. MISSION STATEMENT
The Churchill High School staff is committed to providing a safe, positive and challenging learning environment, motivating all students to reach their greatest potential.
SCHOOL PROFILE CHURCHILL HIGH SCHOOL serves just under 1.500 students in grades 9-12. The principal of Churchill High School is Kevin Etue and the assistant principals are Karla Halvangis, Nichole Hunter and Bruce Rivera. There are 86 professional teaching staff members, one media specialist and six counselors. In addition, there is the following professional support staff: school psychologist, school social worker, student assistance person, speech and language therapist, resource classroom teachers, teacher consultant outreach, occupational and physical therapist, and homebound or hospitalized services. Assisting all of us in keeping the building operating in an organized manner, keeping the building clean, serving nutritious food and helping teachers and students are: custodians, secretaries, paraprofessionals, and lunchroom personnel.
3

GRADUATION REQUIREMENTS The Board of Education has established a specific core curriculum that requires 23 units in grades 9-12. Graduation Requirements for Classes 2016 and Beyond: 4.0 units in language arts; 4.0 units in mathematics; 3.0 units in science; 3.0 units in social studies; 1.0 unit in physical education and health; 1.0 unit in visual performing and/or applied arts; 2.0 units in World Language; 20 hours of on-line experience provided in core courses; 7.0 units in electives
State law requires that we report the following additional information.
ASSIGNING PUPILS TO THE SCHOOL All students are assigned to Churchill High School based upon attendance within the geographic boundaries of the school as well as participation in magnet programs. SCHOOL IMPROVEMENT School improvement is a process by which stakeholders in a school community work cooperatively to improve student achievement in core curricular areas. This process relies on staff, parents, and students’ participation in collaborative decision making to formulate and implement an effective school improvement plan. At Churchill High School, we are pleased to participate in the District Accreditation model for North Central Association (NCA), and its parent company AdvancED. The District Accreditation framework fosters greater communication and support across grade levels and academic disciplines, as we work together to gather, analyze and make data-driven decisions to increase academic achievement in the target goal areas. Currently, staff at Churchill High School is focused on improving student achievement in the target areas of reading, writing and mathematics. Churchill High School’s academic goals during 2016-2017 and 2017-18 are as follows:
1. All students will be proficient in reading. 2. All students will be proficient in writing. 3. All students will be proficient in mathematics. 4. All staff and students will utilize new technology.
Each curricular area at Churchill High School has developed an individualized School Improvement Action Plan outlining how teachers will assist students in meeting the reading, writing, and mathematics goals in ways relevant to each particular subject area. Progress in the goal areas will be measured through a variety of local, state and national standardized assessments. The Livonia Public Schools School District has had its District Level accreditation through AdvancED. Through the district accreditation process, Churchill High School also received AdvancED accreditation. The AdvancED accreditation process supports and validates district and school level improvement efforts.
4
SPECIALIZED SCHOOLS OR PROGRAMS
In addition to the regular 9-12 program, our high school students may be enrolled in the Career Intern Program; vocational study at the Livonia Career Technical Center; International Baccalaureate (IB) program at Franklin; Mathematics, Science and Computer (MSC) program at Churchill; Creative and Performing Arts (CAPA) program at Churchill; Global Education program at Stevenson; the special education, pre-vocational and vocational education program for students with disabilities at Franklin and Churchill; and our post high school program at Western Wayne Skill Center and the Livonia Transition Program (LTP) at Schoolcraft College. Other special education programs for high school students are available in western Wayne County for our students with disabilities based upon their individual needs. Specific information about these programs is available on the district Web site at www.livoniapublicschools.org.
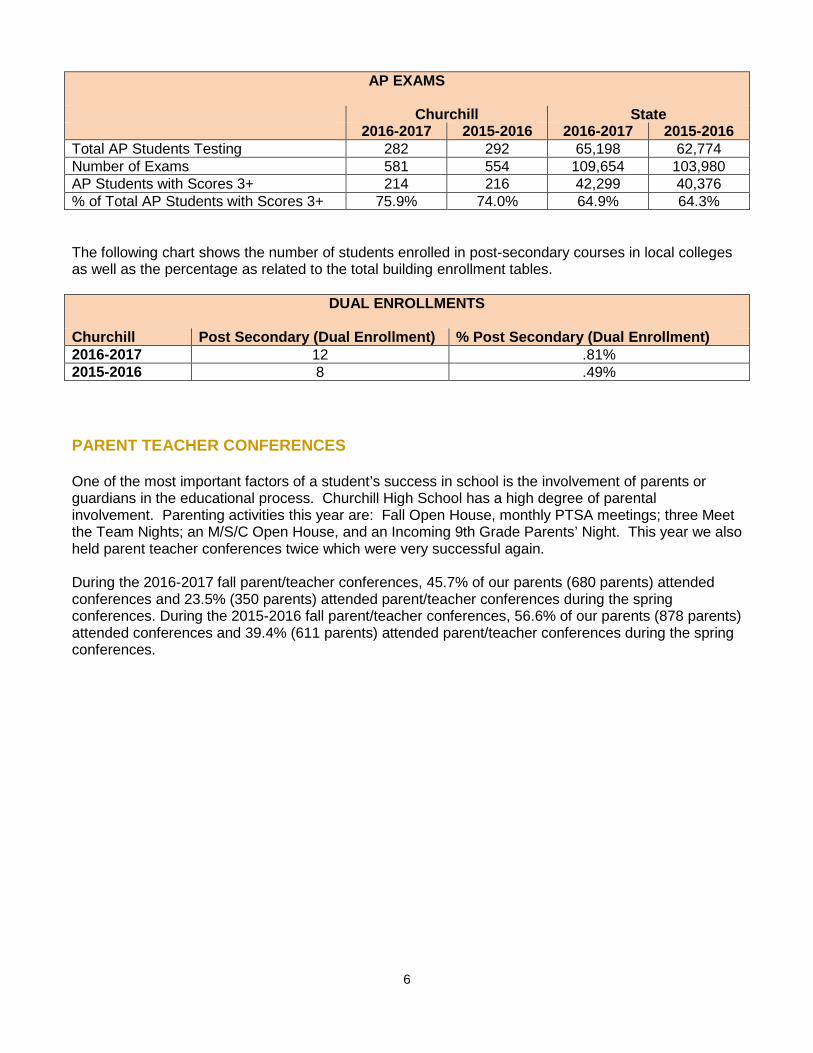
CORE CURRICULUM The core curriculum at Churchill High School provides learning experiences in all areas of language arts (reading, writing, speaking, listening), mathematics, social studies, science, health, physical education, art, vocal and instrumental music, computer instruction, business, world language, family life, industrial technology, vocational education, and career and educational planning. The goal of education is to provide all learners with a solid foundation of skills, knowledge, and understandings that are necessary for their continual growth and success as students within the school setting, and as adults in society. As a result of sound K-12 education based on well-defined educational outcomes, a Livonia Public Schools graduate will: • Respect self, others, and the environment. • Communicate effectively. • Know how to learn and work productively. • Acquire and process information. • Use critical and creative thinking to make decisions and solve problems. • Work and participate independently and cooperatively. • Acquire a core of understandings and competencies within the content areas. A copy of the core curriculum may be obtained from the district’s Academic Services Department. ENROLLMENT IN AP/COLLEGE LEVEL COURSES During the 2016-2017 school year, 346 students were enrolled in 14 different Advanced Placement (AP) courses taught at Churchill High School. This is 23.3% of the building enrollment. The following chart shows two years of data at the school and state levels. Listed are the overall total exams, total unique students and both the number and percentage of AP students with one or more scores of 3 or higher (demonstrated college-level achievement through AP courses and exams).
5
AP EXAMS
Churchill State 2016-2017 2015-2016 2016-2017 2015-2016 Total AP Students Testing 282 292 65,198 62,774 Number of Exams 581 554 109,654 103,980 AP Students with Scores 3+ 214 216 42,299 40,376 % of Total AP Students with Scores 3+ 75.9% 74.0% 64.9% 64.3% The following chart shows the number of students enrolled in post-secondary courses in local colleges as well as the percentage as related to the total building enrollment tables.
DUAL ENROLLMENTS
Churchill Post Secondary (Dual Enrollment) % Post Secondary (Dual Enrollment) 2016-2017 12 .81% 2015-2016 8 .49% PARENT TEACHER CONFERENCES One of the most important factors of a student’s success in school is the involvement of parents or guardians in the educational process. Churchill High School has a high degree of parental involvement. Parenting activities this year are: Fall Open House, monthly PTSA meetings; three Meet the Team Nights; an M/S/C Open House, and an Incoming 9th Grade Parents’ Night. This year we also held parent teacher conferences twice which were very successful again. During the 2016-2017 fall parent/teacher conferences, 45.7% of our parents (680 parents) attended conferences and 23.5% (350 parents) attended parent/teacher conferences during the spring conferences. During the 2015-2016 fall parent/teacher conferences, 56.6% of our parents (878 parents) attended conferences and 39.4% (611 parents) attended parent/teacher conferences during the spring conferences.
6
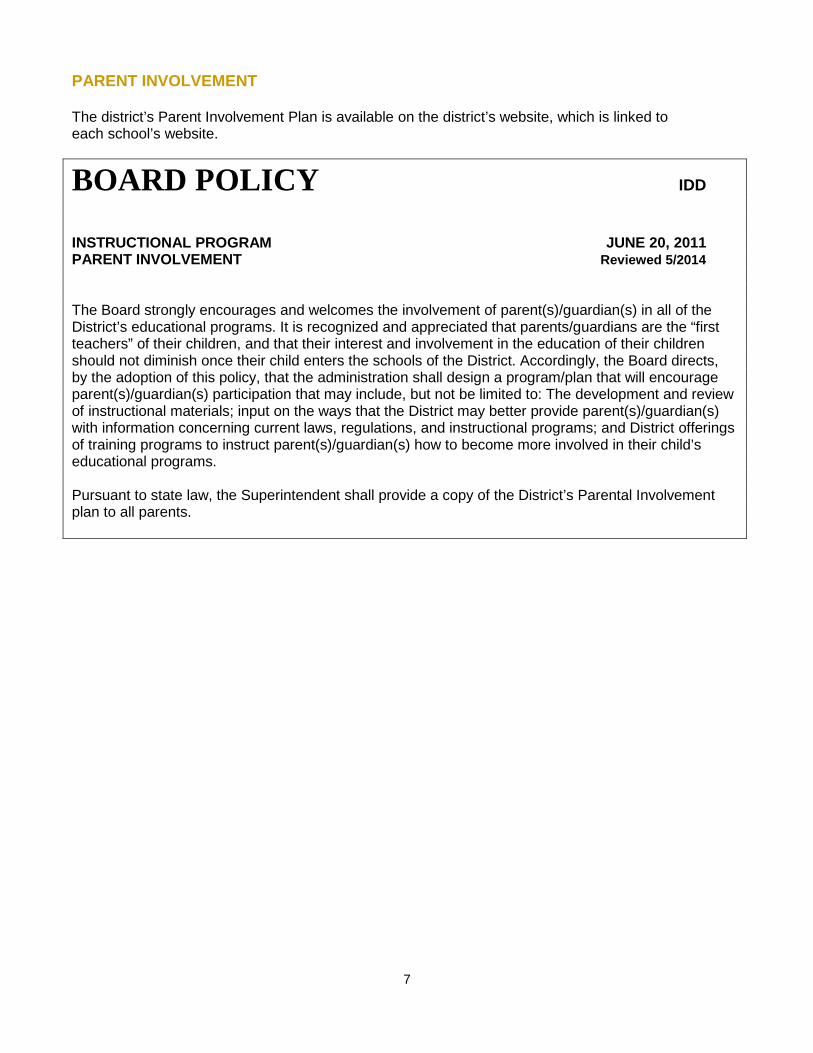
PARENT INVOLVEMENT The district’s Parent Involvement Plan is available on the district’s website, which is linked to each school’s website.
BOARD POLICY IDD INSTRUCTIONAL PROGRAM JUNE 20, 2011 PARENT INVOLVEMENT Reviewed 5/2014 The Board strongly encourages and welcomes the involvement of parent(s)/guardian(s) in all of the District’s educational programs. It is recognized and appreciated that parents/guardians are the “first teachers” of their children, and that their interest and involvement in the education of their children should not diminish once their child enters the schools of the District. Accordingly, the Board directs, by the adoption of this policy, that the administration shall design a program/plan that will encourage parent(s)/guardian(s) participation that may include, but not be limited to: The development and review of instructional materials; input on the ways that the District may better provide parent(s)/guardian(s) with information concerning current laws, regulations, and instructional programs; and District offerings of training programs to instruct parent(s)/guardian(s) how to become more involved in their child’s educational programs. Pursuant to state law, the Superintendent shall provide a copy of the District’s Parental Involvement plan to all parents.
7

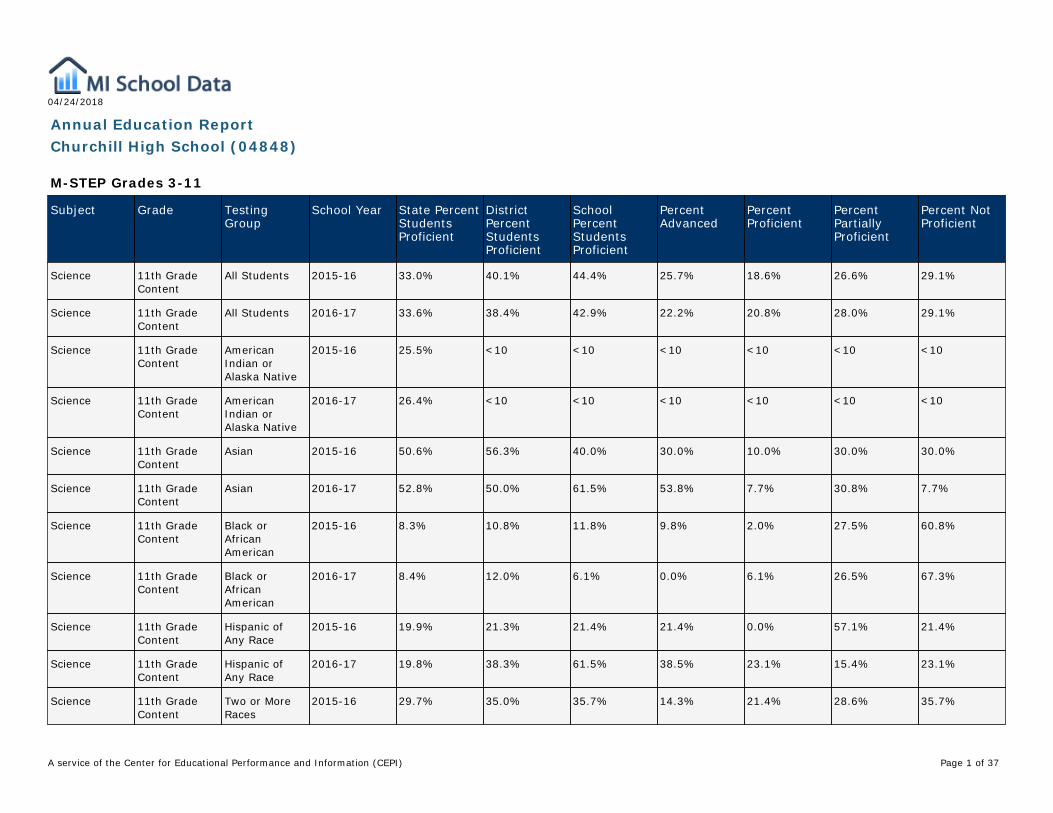
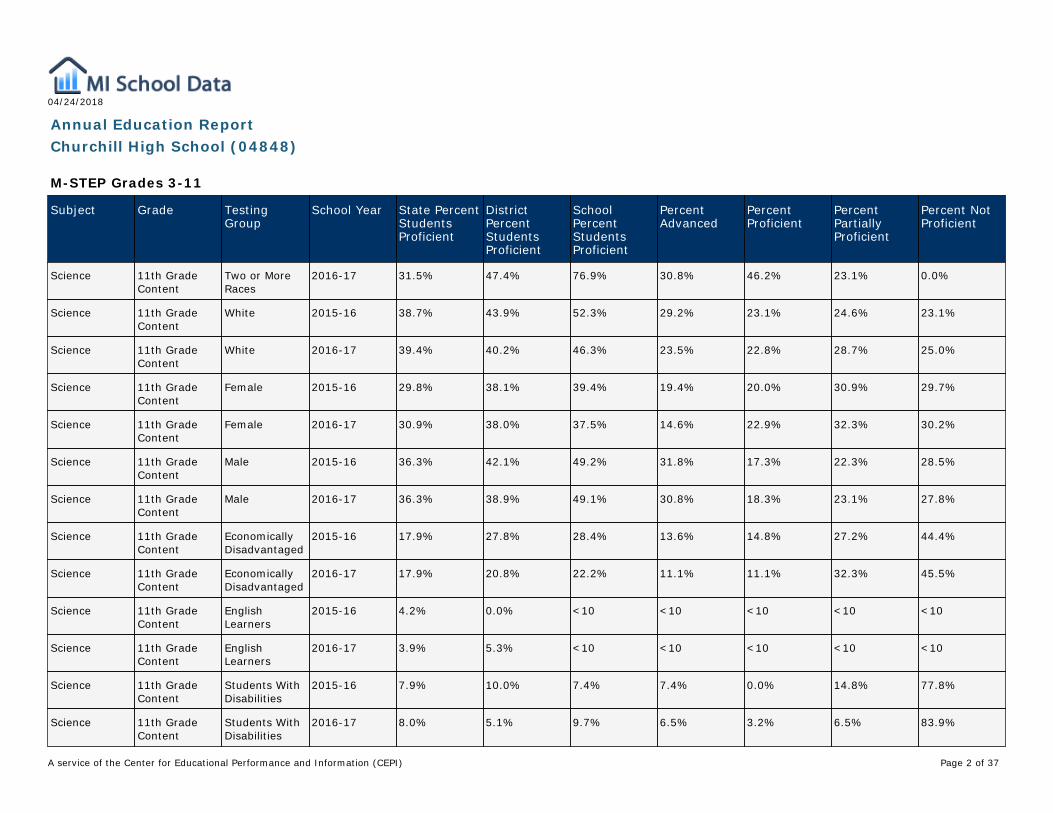
DATA FROM MICHIGAN DEPARTMENT OF EDUCATION
These reports contain the following information: Student Assessment Data – Includes the following three assessments: M-STEP (Michigan Student Test of Educational Progress), MI-Access (Alternate Assessment), and College Board SAT. Presents assessment information for English language arts and mathematics for grades 3 to 8 and 11, and science for grades 4, 7, and 11, compared to state averages for all students as well as subgroups of students. The report helps users to understand achievement performance within grades and schools, and to make comparisons to district, state, and national achievement benchmarks. Accountability – Detail Data and Status The accountability portion of the AER includes assessment proficiency and participation rates, graduation or attendance rates, as well as accountability index values showing school performance on a 0-100 scale. Teacher Qualification Data
• Identifies teacher qualifications at district and school levels • Reports percentage of core academic classes taught by teachers not considered highly qualified
to teach such classes NAEP Data (National Assessment of Educational Progress)
• Provides state results of the national assessment in mathematics and reading every other year in grades 4 and 8
The link https://goo.gl/Wpv4nC will take you to the reports provided by the Michigan Department of Education for Churchill High School. The reports are also printed on the following pages.
8
04/24/2018
Annual Education ReportChurchill High School (04848)
M-STEP Grades 3-11
Subject Grade TestingGroup
School Year State PercentStudentsProficient
DistrictPercentStudentsProficient
SchoolPercentStudentsProficient
PercentAdvanced
PercentProficient
PercentPartiallyProficient
Percent NotProficient
Science 11th GradeContent
All Students 2015-16 33.0% 40.1% 44.4% 25.7% 18.6% 26.6% 29.1%
Science 11th GradeContent
All Students 2016-17 33.6% 38.4% 42.9% 22.2% 20.8% 28.0% 29.1%
Science 11th GradeContent
AmericanIndian orAlaska Native
2015-16 25.5% <10 <10 <10 <10 <10 <10
Science 11th GradeContent
AmericanIndian orAlaska Native
2016-17 26.4% <10 <10 <10 <10 <10 <10
Science 11th GradeContent
Asian 2015-16 50.6% 56.3% 40.0% 30.0% 10.0% 30.0% 30.0%
Science 11th GradeContent
Asian 2016-17 52.8% 50.0% 61.5% 53.8% 7.7% 30.8% 7.7%
Science 11th GradeContent
Black orAfricanAmerican
2015-16 8.3% 10.8% 11.8% 9.8% 2.0% 27.5% 60.8%
Science 11th GradeContent
Black orAfricanAmerican
2016-17 8.4% 12.0% 6.1% 0.0% 6.1% 26.5% 67.3%
Science 11th GradeContent
Hispanic ofAny Race
2015-16 19.9% 21.3% 21.4% 21.4% 0.0% 57.1% 21.4%
Science 11th GradeContent
Hispanic ofAny Race
2016-17 19.8% 38.3% 61.5% 38.5% 23.1% 15.4% 23.1%
Science 11th GradeContent
Two or MoreRaces
2015-16 29.7% 35.0% 35.7% 14.3% 21.4% 28.6% 35.7%
Page 1 of A service of the Center for Educational Performance and Information (CEPI) 37
04/24/2018
Annual Education ReportChurchill High School (04848)
M-STEP Grades 3-11
Subject Grade TestingGroup
School Year State PercentStudentsProficient
DistrictPercentStudentsProficient
SchoolPercentStudentsProficient
PercentAdvanced
PercentProficient
PercentPartiallyProficient
Percent NotProficient
Science 11th GradeContent
Two or MoreRaces
2016-17 31.5% 47.4% 76.9% 30.8% 46.2% 23.1% 0.0%
Science 11th GradeContent
White 2015-16 38.7% 43.9% 52.3% 29.2% 23.1% 24.6% 23.1%
Science 11th GradeContent
White 2016-17 39.4% 40.2% 46.3% 23.5% 22.8% 28.7% 25.0%
Science 11th GradeContent
Female 2015-16 29.8% 38.1% 39.4% 19.4% 20.0% 30.9% 29.7%
Science 11th GradeContent
Female 2016-17 30.9% 38.0% 37.5% 14.6% 22.9% 32.3% 30.2%
Science 11th GradeContent
Male 2015-16 36.3% 42.1% 49.2% 31.8% 17.3% 22.3% 28.5%
Science 11th GradeContent
Male 2016-17 36.3% 38.9% 49.1% 30.8% 18.3% 23.1% 27.8%
Science 11th GradeContent
EconomicallyDisadvantaged
2015-16 17.9% 27.8% 28.4% 13.6% 14.8% 27.2% 44.4%
Science 11th GradeContent
EconomicallyDisadvantaged
2016-17 17.9% 20.8% 22.2% 11.1% 11.1% 32.3% 45.5%
Science 11th GradeContent
EnglishLearners
2015-16 4.2% 0.0% <10 <10 <10 <10 <10
Science 11th GradeContent
EnglishLearners
2016-17 3.9% 5.3% <10 <10 <10 <10 <10
Science 11th GradeContent
Students WithDisabilities
2015-16 7.9% 10.0% 7.4% 7.4% 0.0% 14.8% 77.8%
Science 11th GradeContent
Students WithDisabilities
2016-17 8.0% 5.1% 9.7% 6.5% 3.2% 6.5% 83.9%
Page 2 of A service of the Center for Educational Performance and Information (CEPI) 37

04/24/2018
Annual Education ReportChurchill High School (04848)
M-STEP Grades 3-11
Subject Grade TestingGroup
School Year State PercentStudentsProficient
DistrictPercentStudentsProficient
SchoolPercentStudentsProficient
PercentAdvanced
PercentProficient
PercentPartiallyProficient
Percent NotProficient
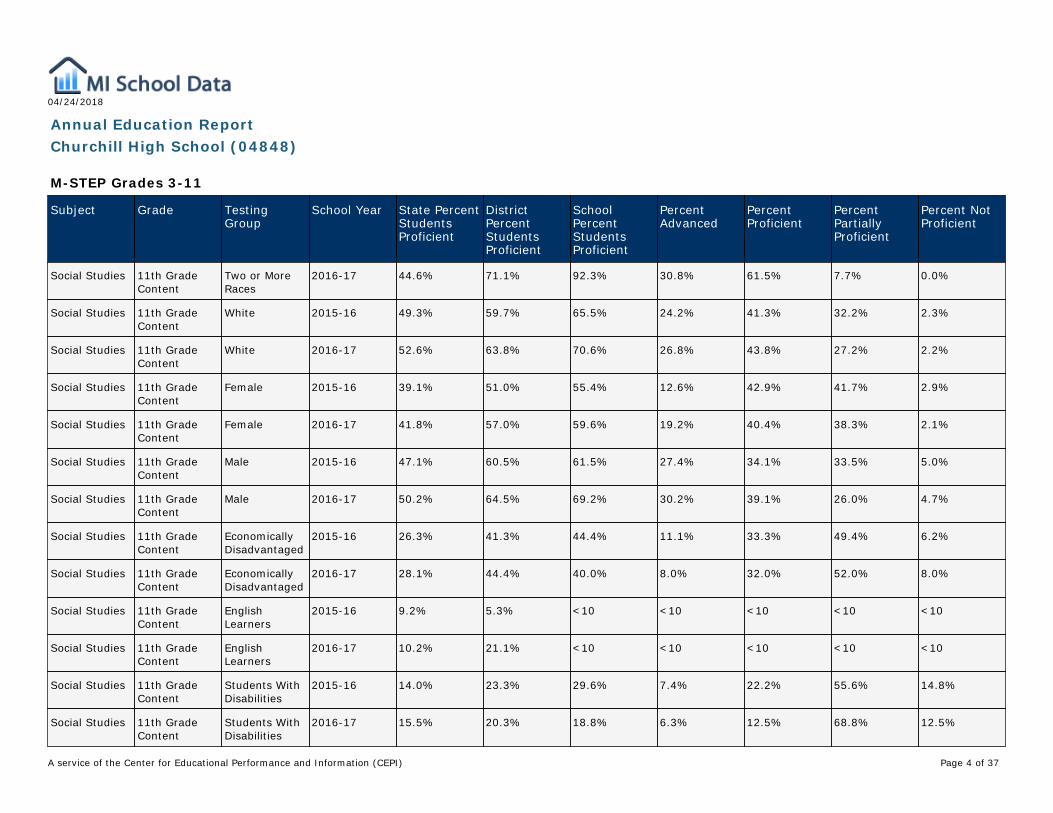
Social Studies 11th GradeContent
All Students 2015-16 43.1% 55.8% 58.5% 20.1% 38.4% 37.6% 4.0%
Social Studies 11th GradeContent
All Students 2016-17 46.0% 60.6% 64.1% 24.3% 39.8% 32.6% 3.3%
Social Studies 11th GradeContent
AmericanIndian orAlaska Native
2015-16 35.9% <10 <10 <10 <10 <10 <10
Social Studies 11th GradeContent
AmericanIndian orAlaska Native
2016-17 37.5% <10 <10 <10 <10 <10 <10
Social Studies 11th GradeContent
Asian 2015-16 59.8% 75.0% 60.0% 20.0% 40.0% 30.0% 10.0%
Social Studies 11th GradeContent
Asian 2016-17 62.4% 73.3% 76.9% 46.2% 30.8% 15.4% 7.7%
Social Studies 11th GradeContent
Black orAfricanAmerican
2015-16 15.6% 18.6% 21.6% 0.0% 21.6% 70.6% 7.8%
Social Studies 11th GradeContent
Black orAfricanAmerican
2016-17 17.8% 28.7% 16.0% 0.0% 16.0% 74.0% 10.0%
Social Studies 11th GradeContent
Hispanic ofAny Race
2015-16 30.6% 48.9% 57.1% 7.1% 50.0% 35.7% 7.1%
Social Studies 11th GradeContent
Hispanic ofAny Race
2016-17 32.8% 46.8% 76.9% 38.5% 38.5% 23.1% 0.0%
Social Studies 11th GradeContent
Two or MoreRaces
2015-16 40.2% 52.5% 57.1% 21.4% 35.7% 28.6% 14.3%
Page 3 of A service of the Center for Educational Performance and Information (CEPI) 37
04/24/2018
Annual Education ReportChurchill High School (04848)
M-STEP Grades 3-11
Subject Grade TestingGroup
School Year State PercentStudentsProficient
DistrictPercentStudentsProficient
SchoolPercentStudentsProficient
PercentAdvanced
PercentProficient
PercentPartiallyProficient
Percent NotProficient
Social Studies 11th GradeContent
Two or MoreRaces
2016-17 44.6% 71.1% 92.3% 30.8% 61.5% 7.7% 0.0%
Social Studies 11th GradeContent
White 2015-16 49.3% 59.7% 65.5% 24.2% 41.3% 32.2% 2.3%
Social Studies 11th GradeContent
White 2016-17 52.6% 63.8% 70.6% 26.8% 43.8% 27.2% 2.2%
Social Studies 11th GradeContent
Female 2015-16 39.1% 51.0% 55.4% 12.6% 42.9% 41.7% 2.9%
Social Studies 11th GradeContent
Female 2016-17 41.8% 57.0% 59.6% 19.2% 40.4% 38.3% 2.1%
Social Studies 11th GradeContent
Male 2015-16 47.1% 60.5% 61.5% 27.4% 34.1% 33.5% 5.0%
Social Studies 11th GradeContent
Male 2016-17 50.2% 64.5% 69.2% 30.2% 39.1% 26.0% 4.7%
Social Studies 11th GradeContent
EconomicallyDisadvantaged
2015-16 26.3% 41.3% 44.4% 11.1% 33.3% 49.4% 6.2%
Social Studies 11th GradeContent
EconomicallyDisadvantaged
2016-17 28.1% 44.4% 40.0% 8.0% 32.0% 52.0% 8.0%
Social Studies 11th GradeContent
EnglishLearners
2015-16 9.2% 5.3% <10 <10 <10 <10 <10
Social Studies 11th GradeContent
EnglishLearners
2016-17 10.2% 21.1% <10 <10 <10 <10 <10
Social Studies 11th GradeContent
Students WithDisabilities
2015-16 14.0% 23.3% 29.6% 7.4% 22.2% 55.6% 14.8%
Social Studies 11th GradeContent
Students WithDisabilities
2016-17 15.5% 20.3% 18.8% 6.3% 12.5% 68.8% 12.5%
Page 4 of A service of the Center for Educational Performance and Information (CEPI) 37
04/24/2018
Annual Education ReportChurchill High School (04848)
SAT
LocationName
School Year Subject StudentGroup
Mean SATScore
Benchmark Met orExceeded
% Met orExceeded
Did Not Meet % Did NotMeet
NumberAssessed
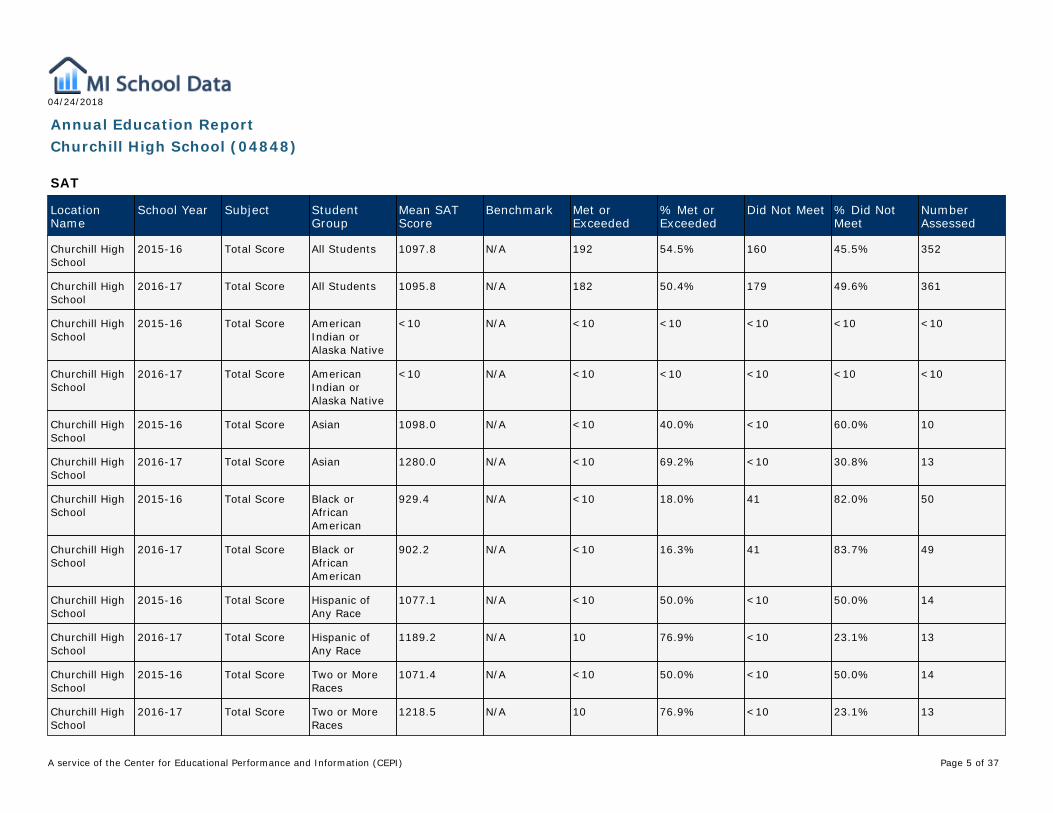
Churchill HighSchool
2015-16 Total Score All Students 1097.8 N/A 192 54.5% 160 45.5% 352
Churchill HighSchool
2016-17 Total Score All Students 1095.8 N/A 182 50.4% 179 49.6% 361
Churchill HighSchool
2015-16 Total Score AmericanIndian orAlaska Native
<10 N/A <10 <10 <10 <10 <10
Churchill HighSchool
2016-17 Total Score AmericanIndian orAlaska Native
<10 N/A <10 <10 <10 <10 <10
Churchill HighSchool
2015-16 Total Score Asian 1098.0 N/A <10 40.0% <10 60.0% 10
Churchill HighSchool
2016-17 Total Score Asian 1280.0 N/A <10 69.2% <10 30.8% 13
Churchill HighSchool
2015-16 Total Score Black orAfricanAmerican
929.4 N/A <10 18.0% 41 82.0% 50
Churchill HighSchool
2016-17 Total Score Black orAfricanAmerican
902.2 N/A <10 16.3% 41 83.7% 49
Churchill HighSchool
2015-16 Total Score Hispanic ofAny Race
1077.1 N/A <10 50.0% <10 50.0% 14
Churchill HighSchool
2016-17 Total Score Hispanic ofAny Race
1189.2 N/A 10 76.9% <10 23.1% 13
Churchill HighSchool
2015-16 Total Score Two or MoreRaces
1071.4 N/A <10 50.0% <10 50.0% 14
Churchill HighSchool
2016-17 Total Score Two or MoreRaces
1218.5 N/A 10 76.9% <10 23.1% 13
Page 5 of A service of the Center for Educational Performance and Information (CEPI) 37

04/24/2018
Annual Education ReportChurchill High School (04848)
SAT
LocationName
School Year Subject StudentGroup
Mean SATScore
Benchmark Met orExceeded
% Met orExceeded
Did Not Meet % Did NotMeet
NumberAssessed
Churchill HighSchool
2015-16 Total Score White 1131.7 N/A 164 62.4% 99 37.6% 263
Churchill HighSchool
2016-17 Total Score White 1111.7 N/A 144 52.9% 128 47.1% 272
Churchill HighSchool
2015-16 Total Score Female 1096.3 N/A 94 54.0% 80 46.0% 174
Churchill HighSchool
2016-17 Total Score Female 1095.3 N/A 94 48.7% 99 51.3% 193
Churchill HighSchool
2015-16 Total Score Male 1099.4 N/A 98 55.1% 80 44.9% 178
Churchill HighSchool
2016-17 Total Score Male 1096.4 N/A 88 52.4% 80 47.6% 168
Churchill HighSchool
2015-16 Total Score EconomicallyDisadvantaged
998.4 N/A 29 36.7% 50 63.3% 79
Churchill HighSchool
2016-17 Total Score EconomicallyDisadvantaged
987.1 N/A 29 29.0% 71 71.0% 100
Churchill HighSchool
2015-16 Total Score NotEconomicallyDisadvantaged
1126.6 N/A 163 59.7% 110 40.3% 273
Churchill HighSchool
2016-17 Total Score NotEconomicallyDisadvantaged
1137.4 N/A 153 58.6% 108 41.4% 261
Churchill HighSchool
2015-16 Total Score EnglishLearners
<10 N/A <10 <10 <10 <10 <10
Churchill HighSchool
2016-17 Total Score EnglishLearners
<10 N/A <10 <10 <10 <10 <10
Churchill HighSchool
2015-16 Total Score Not EnglishLearners
1104.8 N/A 191 55.5% 153 44.5% 344
Page 6 of A service of the Center for Educational Performance and Information (CEPI) 37
04/24/2018
Annual Education ReportChurchill High School (04848)
SAT
LocationName
School Year Subject StudentGroup
Mean SATScore
Benchmark Met orExceeded
% Met orExceeded
Did Not Meet % Did NotMeet
NumberAssessed
Churchill HighSchool
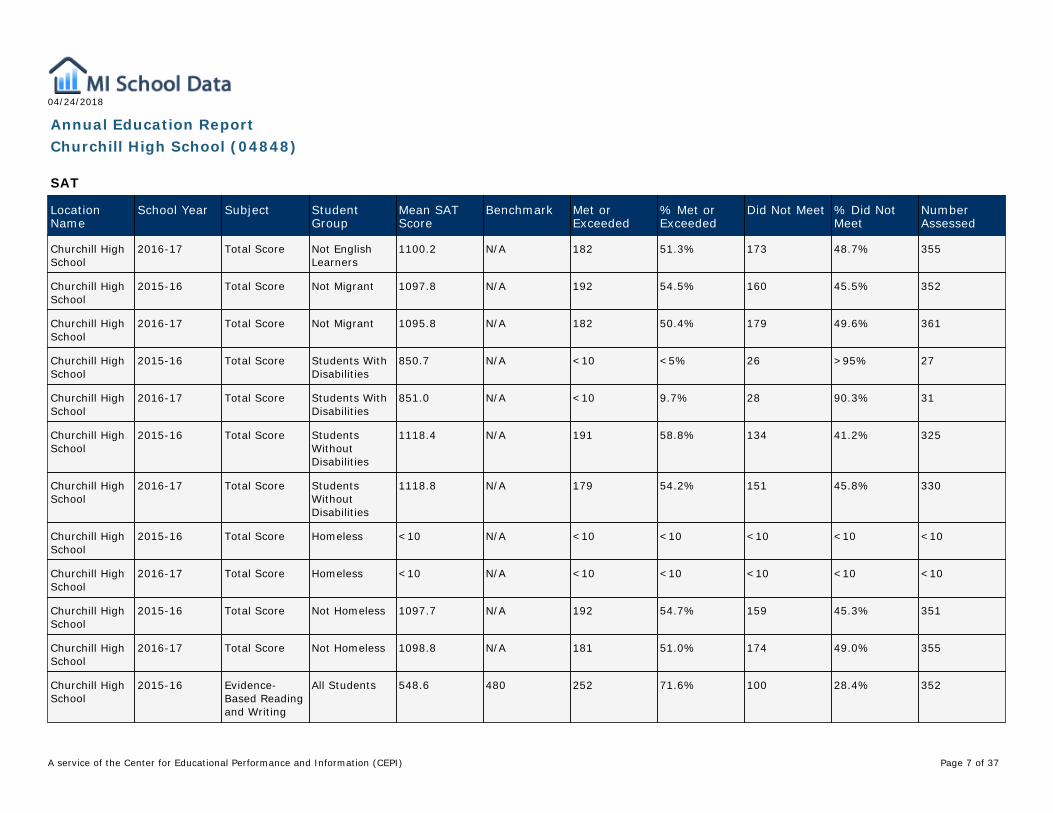
2016-17 Total Score Not EnglishLearners
1100.2 N/A 182 51.3% 173 48.7% 355
Churchill HighSchool
2015-16 Total Score Not Migrant 1097.8 N/A 192 54.5% 160 45.5% 352
Churchill HighSchool
2016-17 Total Score Not Migrant 1095.8 N/A 182 50.4% 179 49.6% 361
Churchill HighSchool
2015-16 Total Score Students WithDisabilities
850.7 N/A <10 <5% 26 >95% 27
Churchill HighSchool
2016-17 Total Score Students WithDisabilities
851.0 N/A <10 9.7% 28 90.3% 31
Churchill HighSchool
2015-16 Total Score StudentsWithoutDisabilities
1118.4 N/A 191 58.8% 134 41.2% 325
Churchill HighSchool
2016-17 Total Score StudentsWithoutDisabilities
1118.8 N/A 179 54.2% 151 45.8% 330
Churchill HighSchool
2015-16 Total Score Homeless <10 N/A <10 <10 <10 <10 <10
Churchill HighSchool
2016-17 Total Score Homeless <10 N/A <10 <10 <10 <10 <10
Churchill HighSchool
2015-16 Total Score Not Homeless 1097.7 N/A 192 54.7% 159 45.3% 351
Churchill HighSchool
2016-17 Total Score Not Homeless 1098.8 N/A 181 51.0% 174 49.0% 355
Churchill HighSchool
2015-16 Evidence-Based Readingand Writing
All Students 548.6 480 252 71.6% 100 28.4% 352
Page 7 of A service of the Center for Educational Performance and Information (CEPI) 37

04/24/2018
Annual Education ReportChurchill High School (04848)
SAT
LocationName
School Year Subject StudentGroup
Mean SATScore
Benchmark Met orExceeded
% Met orExceeded
Did Not Meet % Did NotMeet
NumberAssessed
Churchill HighSchool
2016-17 Evidence-Based Readingand Writing
All Students 551.0 480 266 73.7% 95 26.3% 361
Churchill HighSchool
2015-16 Evidence-Based Readingand Writing
AmericanIndian orAlaska Native
<10 480 <10 <10 <10 <10 <10
Churchill HighSchool
2016-17 Evidence-Based Readingand Writing
AmericanIndian orAlaska Native
<10 480 <10 <10 <10 <10 <10
Churchill HighSchool
2015-16 Evidence-Based Readingand Writing
Asian 539.0 480 <10 60.0% <10 40.0% 10
Churchill HighSchool
2016-17 Evidence-Based Readingand Writing
Asian 618.5 480 11 84.6% <10 15.4% 13
Churchill HighSchool
2015-16 Evidence-Based Readingand Writing
Black orAfricanAmerican
471.6 480 20 40.0% 30 60.0% 50
Churchill HighSchool
2016-17 Evidence-Based Readingand Writing
Black orAfricanAmerican
457.8 480 19 38.8% 30 61.2% 49
Churchill HighSchool
2015-16 Evidence-Based Readingand Writing
Hispanic ofAny Race
536.4 480 10 71.4% <10 28.6% 14
Churchill HighSchool
2016-17 Evidence-Based Readingand Writing
Hispanic ofAny Race
596.9 480 11 84.6% <10 15.4% 13
Churchill HighSchool
2015-16 Evidence-Based Readingand Writing
Two or MoreRaces
527.9 480 <10 57.1% <10 42.9% 14
Page 8 of A service of the Center for Educational Performance and Information (CEPI) 37
04/24/2018
Annual Education ReportChurchill High School (04848)
SAT
LocationName
School Year Subject StudentGroup
Mean SATScore
Benchmark Met orExceeded
% Met orExceeded
Did Not Meet % Did NotMeet
NumberAssessed
Churchill HighSchool
2016-17 Evidence-Based Readingand Writing
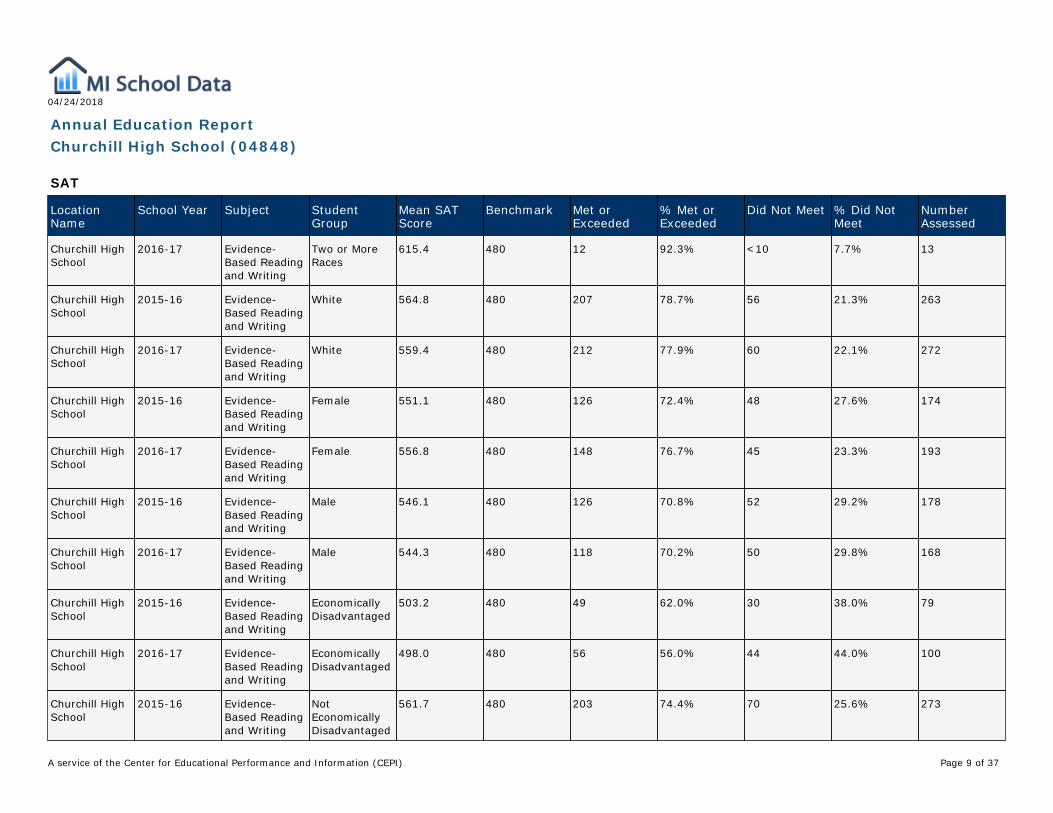
Two or MoreRaces
615.4 480 12 92.3% <10 7.7% 13
Churchill HighSchool
2015-16 Evidence-Based Readingand Writing
White 564.8 480 207 78.7% 56 21.3% 263
Churchill HighSchool
2016-17 Evidence-Based Readingand Writing
White 559.4 480 212 77.9% 60 22.1% 272
Churchill HighSchool
2015-16 Evidence-Based Readingand Writing
Female 551.1 480 126 72.4% 48 27.6% 174
Churchill HighSchool
2016-17 Evidence-Based Readingand Writing
Female 556.8 480 148 76.7% 45 23.3% 193
Churchill HighSchool
2015-16 Evidence-Based Readingand Writing
Male 546.1 480 126 70.8% 52 29.2% 178
Churchill HighSchool
2016-17 Evidence-Based Readingand Writing
Male 544.3 480 118 70.2% 50 29.8% 168
Churchill HighSchool
2015-16 Evidence-Based Readingand Writing
EconomicallyDisadvantaged
503.2 480 49 62.0% 30 38.0% 79
Churchill HighSchool
2016-17 Evidence-Based Readingand Writing
EconomicallyDisadvantaged
498.0 480 56 56.0% 44 44.0% 100
Churchill HighSchool
2015-16 Evidence-Based Readingand Writing
NotEconomicallyDisadvantaged
561.7 480 203 74.4% 70 25.6% 273
Page 9 of A service of the Center for Educational Performance and Information (CEPI) 37

04/24/2018
Annual Education ReportChurchill High School (04848)
SAT
LocationName
School Year Subject StudentGroup
Mean SATScore
Benchmark Met orExceeded
% Met orExceeded
Did Not Meet % Did NotMeet
NumberAssessed
Churchill HighSchool
2016-17 Evidence-Based Readingand Writing
NotEconomicallyDisadvantaged
571.3 480 210 80.5% 51 19.5% 261
Churchill HighSchool
2015-16 Evidence-Based Readingand Writing
EnglishLearners
<10 480 <10 <10 <10 <10 <10
Churchill HighSchool
2016-17 Evidence-Based Readingand Writing
EnglishLearners
<10 480 <10 <10 <10 <10 <10
Churchill HighSchool
2015-16 Evidence-Based Readingand Writing
Not EnglishLearners
551.8 480 251 73.0% 93 27.0% 344
Churchill HighSchool
2016-17 Evidence-Based Readingand Writing
Not EnglishLearners
553.2 480 265 74.6% 90 25.4% 355
Churchill HighSchool
2015-16 Evidence-Based Readingand Writing
Not Migrant 548.6 480 252 71.6% 100 28.4% 352
Churchill HighSchool
2016-17 Evidence-Based Readingand Writing
Not Migrant 551.0 480 266 73.7% 95 26.3% 361
Churchill HighSchool
2015-16 Evidence-Based Readingand Writing
Students WithDisabilities
429.6 480 <10 18.5% 22 81.5% 27
Churchill HighSchool
2016-17 Evidence-Based Readingand Writing
Students WithDisabilities
438.1 480 <10 22.6% 24 77.4% 31
Churchill HighSchool
2015-16 Evidence-Based Readingand Writing
StudentsWithoutDisabilities
558.5 480 247 76.0% 78 24.0% 325
Page 10 of A service of the Center for Educational Performance and Information (CEPI) 37

04/24/2018
Annual Education ReportChurchill High School (04848)
SAT
LocationName
School Year Subject StudentGroup
Mean SATScore
Benchmark Met orExceeded
% Met orExceeded
Did Not Meet % Did NotMeet
NumberAssessed
Churchill HighSchool
2016-17 Evidence-Based Readingand Writing
StudentsWithoutDisabilities
561.6 480 259 78.5% 71 21.5% 330
Churchill HighSchool
2015-16 Evidence-Based Readingand Writing
Homeless <10 480 <10 <10 <10 <10 <10
Churchill HighSchool
2016-17 Evidence-Based Readingand Writing
Homeless <10 480 <10 <10 <10 <10 <10
Churchill HighSchool
2015-16 Evidence-Based Readingand Writing
Not Homeless 548.4 480 251 71.5% 100 28.5% 351
Churchill HighSchool
2016-17 Evidence-Based Readingand Writing
Not Homeless 552.1 480 262 73.8% 93 26.2% 355
Churchill HighSchool
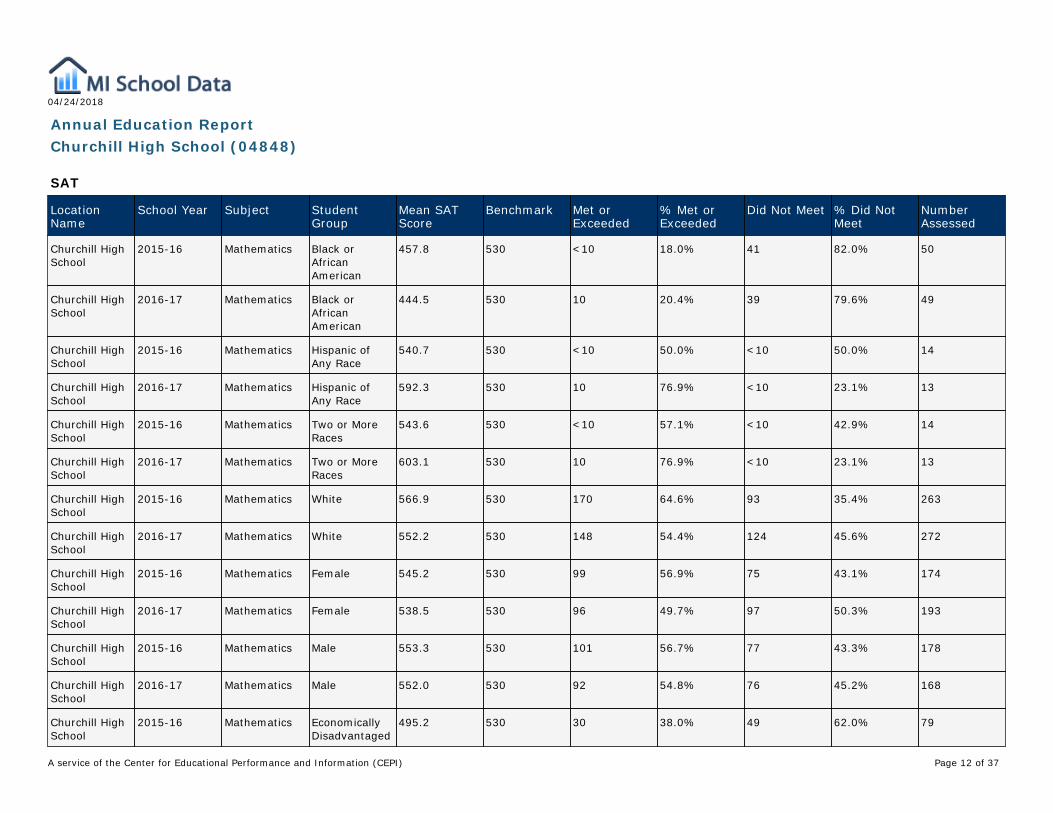
2015-16 Mathematics All Students 549.3 530 200 56.8% 152 43.2% 352
Churchill HighSchool
2016-17 Mathematics All Students 544.8 530 188 52.1% 173 47.9% 361
Churchill HighSchool
2015-16 Mathematics AmericanIndian orAlaska Native
<10 530 <10 <10 <10 <10 <10
Churchill HighSchool
2016-17 Mathematics AmericanIndian orAlaska Native
<10 530 <10 <10 <10 <10 <10
Churchill HighSchool
2015-16 Mathematics Asian 559.0 530 <10 50.0% <10 50.0% 10
Churchill HighSchool
2016-17 Mathematics Asian 661.5 530 <10 69.2% <10 30.8% 13
Page 11 of A service of the Center for Educational Performance and Information (CEPI) 37
04/24/2018
Annual Education ReportChurchill High School (04848)
SAT
LocationName
School Year Subject StudentGroup
Mean SATScore
Benchmark Met orExceeded
% Met orExceeded
Did Not Meet % Did NotMeet
NumberAssessed
Churchill HighSchool
2015-16 Mathematics Black orAfricanAmerican
457.8 530 <10 18.0% 41 82.0% 50
Churchill HighSchool
2016-17 Mathematics Black orAfricanAmerican
444.5 530 10 20.4% 39 79.6% 49
Churchill HighSchool
2015-16 Mathematics Hispanic ofAny Race
540.7 530 <10 50.0% <10 50.0% 14
Churchill HighSchool
2016-17 Mathematics Hispanic ofAny Race
592.3 530 10 76.9% <10 23.1% 13
Churchill HighSchool
2015-16 Mathematics Two or MoreRaces
543.6 530 <10 57.1% <10 42.9% 14
Churchill HighSchool
2016-17 Mathematics Two or MoreRaces
603.1 530 10 76.9% <10 23.1% 13
Churchill HighSchool
2015-16 Mathematics White 566.9 530 170 64.6% 93 35.4% 263
Churchill HighSchool
2016-17 Mathematics White 552.2 530 148 54.4% 124 45.6% 272
Churchill HighSchool
2015-16 Mathematics Female 545.2 530 99 56.9% 75 43.1% 174
Churchill HighSchool
2016-17 Mathematics Female 538.5 530 96 49.7% 97 50.3% 193
Churchill HighSchool
2015-16 Mathematics Male 553.3 530 101 56.7% 77 43.3% 178
Churchill HighSchool
2016-17 Mathematics Male 552.0 530 92 54.8% 76 45.2% 168
Churchill HighSchool
2015-16 Mathematics EconomicallyDisadvantaged
495.2 530 30 38.0% 49 62.0% 79
Page 12 of A service of the Center for Educational Performance and Information (CEPI) 37
04/24/2018
Annual Education ReportChurchill High School (04848)
SAT
LocationName
School Year Subject StudentGroup
Mean SATScore
Benchmark Met orExceeded
% Met orExceeded
Did Not Meet % Did NotMeet
NumberAssessed
Churchill HighSchool
2016-17 Mathematics EconomicallyDisadvantaged
489.1 530 32 32.0% 68 68.0% 100
Churchill HighSchool
2015-16 Mathematics NotEconomicallyDisadvantaged
564.9 530 170 62.3% 103 37.7% 273
Churchill HighSchool
2016-17 Mathematics NotEconomicallyDisadvantaged
566.1 530 156 59.8% 105 40.2% 261
Churchill HighSchool
2015-16 Mathematics EnglishLearners
<10 530 <10 <10 <10 <10 <10
Churchill HighSchool
2016-17 Mathematics EnglishLearners
<10 530 <10 <10 <10 <10 <10
Churchill HighSchool
2015-16 Mathematics Not EnglishLearners
553.0 530 199 57.8% 145 42.2% 344
Churchill HighSchool
2016-17 Mathematics Not EnglishLearners
547.0 530 188 53.0% 167 47.0% 355
Churchill HighSchool
2015-16 Mathematics Not Migrant 549.3 530 200 56.8% 152 43.2% 352
Churchill HighSchool
2016-17 Mathematics Not Migrant 544.8 530 188 52.1% 173 47.9% 361
Churchill HighSchool
2015-16 Mathematics Students WithDisabilities
421.1 530 <10 7.4% 25 92.6% 27
Churchill HighSchool
2016-17 Mathematics Students WithDisabilities
412.9 530 <10 9.7% 28 90.3% 31
Churchill HighSchool
2015-16 Mathematics StudentsWithoutDisabilities
559.9 530 198 60.9% 127 39.1% 325
Page 13 of A service of the Center for Educational Performance and Information (CEPI) 37

04/24/2018
Annual Education ReportChurchill High School (04848)
SAT
LocationName
School Year Subject StudentGroup
Mean SATScore
Benchmark Met orExceeded
% Met orExceeded
Did Not Meet % Did NotMeet
NumberAssessed
Churchill HighSchool
2016-17 Mathematics StudentsWithoutDisabilities
557.2 530 185 56.1% 145 43.9% 330
Churchill HighSchool
2015-16 Mathematics Homeless <10 530 <10 <10 <10 <10 <10
Churchill HighSchool
2016-17 Mathematics Homeless <10 530 <10 <10 <10 <10 <10
Churchill HighSchool
2015-16 Mathematics Not Homeless 549.4 530 200 57.0% 151 43.0% 351
Churchill HighSchool
2016-17 Mathematics Not Homeless 546.7 530 187 52.7% 168 47.3% 355
Page 14 of A service of the Center for Educational Performance and Information (CEPI) 37

04/24/2018
Annual Education ReportChurchill High School (04848)
MI-Access Functional Independence
Subject Grade Testing Group School Year State PercentStudentsProficient
DistrictPercentStudentsProficient
School PercentStudentsProficient
PercentSurpassed
PercentAttained
PercentEmerging
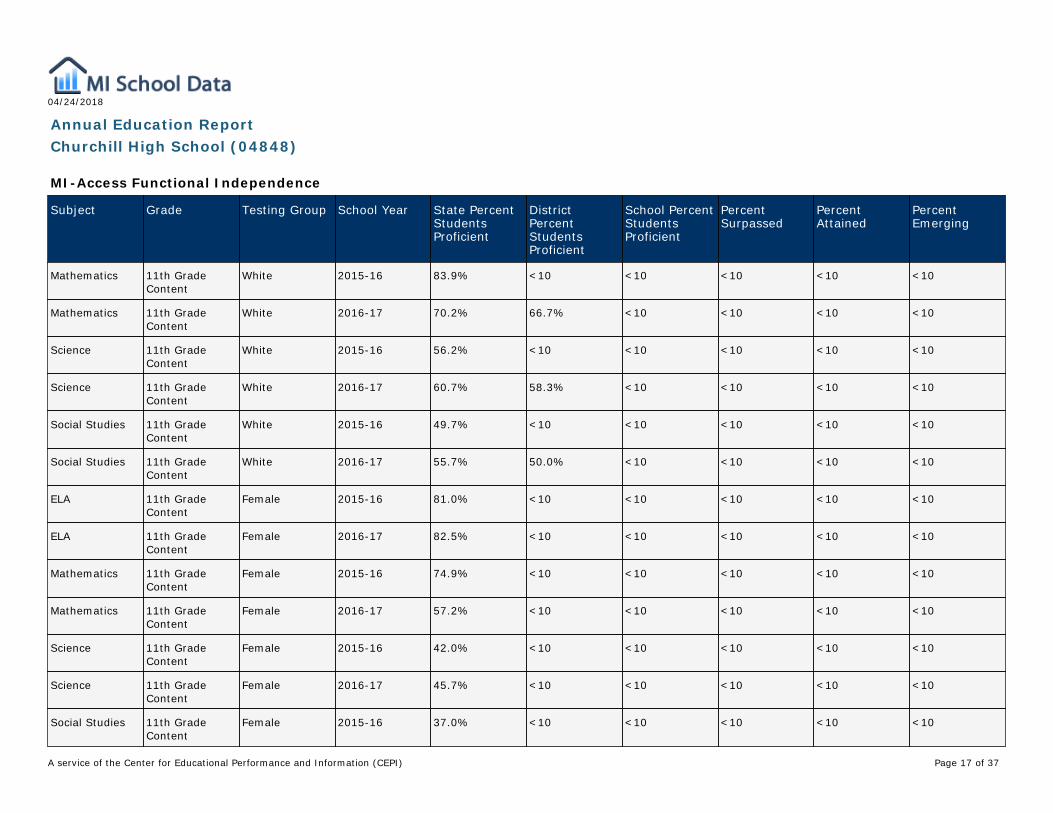
ELA 11th GradeContent
All Students 2015-16 81.0% <10 <10 <10 <10 <10
ELA 11th GradeContent
All Students 2016-17 83.0% 81.3% 76.9% 69.2% 7.7% 23.1%
Mathematics 11th GradeContent
All Students 2015-16 79.7% <10 <10 <10 <10 <10
Mathematics 11th GradeContent
All Students 2016-17 63.2% 68.8% 61.5% 38.5% 23.1% 38.5%
Science 11th GradeContent
All Students 2015-16 47.4% <10 <10 <10 <10 <10
Science 11th GradeContent
All Students 2016-17 51.1% 43.8% 30.8% 15.4% 15.4% 69.2%
Social Studies 11th GradeContent
All Students 2015-16 43.1% <10 <10 <10 <10 <10
Social Studies 11th GradeContent
All Students 2016-17 47.7% 43.8% 38.5% 23.1% 15.4% 61.5%
ELA 11th GradeContent
Asian 2015-16 57.9% <10 <10 <10 <10 <10
ELA 11th GradeContent
Asian 2016-17 62.5% <10 <10 <10 <10 <10
Mathematics 11th GradeContent
Asian 2015-16 76.2% <10 <10 <10 <10 <10
Mathematics 11th GradeContent
Asian 2016-17 52.9% <10 <10 <10 <10 <10
Science 11th GradeContent
Asian 2015-16 38.1% <10 <10 <10 <10 <10
Page 15 of A service of the Center for Educational Performance and Information (CEPI) 37

04/24/2018
Annual Education ReportChurchill High School (04848)
MI-Access Functional Independence
Subject Grade Testing Group School Year State PercentStudentsProficient
DistrictPercentStudentsProficient
School PercentStudentsProficient
PercentSurpassed
PercentAttained
PercentEmerging
Science 11th GradeContent
Asian 2016-17 17.6% <10 <10 <10 <10 <10
Social Studies 11th GradeContent
Asian 2015-16 38.1% <10 <10 <10 <10 <10
Social Studies 11th GradeContent
Asian 2016-17 25.0% <10 <10 <10 <10 <10
ELA 11th GradeContent
Black or AfricanAmerican
2016-17 72.0% <10 <10 <10 <10 <10
Mathematics 11th GradeContent
Black or AfricanAmerican
2016-17 44.7% <10 <10 <10 <10 <10
Science 11th GradeContent
Black or AfricanAmerican
2016-17 28.6% <10 <10 <10 <10 <10
Social Studies 11th GradeContent
Black or AfricanAmerican
2016-17 29.8% <10 <10 <10 <10 <10
ELA 11th GradeContent
Hispanic of AnyRace
2016-17 80.9% <10 <10 <10 <10 <10
Mathematics 11th GradeContent
Hispanic of AnyRace
2016-17 66.7% <10 <10 <10 <10 <10
Science 11th GradeContent
Hispanic of AnyRace
2016-17 43.7% <10 <10 <10 <10 <10
Social Studies 11th GradeContent
Hispanic of AnyRace
2016-17 42.9% <10 <10 <10 <10 <10
ELA 11th GradeContent
White 2015-16 84.4% <10 <10 <10 <10 <10
ELA 11th GradeContent
White 2016-17 87.9% 83.3% <10 <10 <10 <10
Page 16 of A service of the Center for Educational Performance and Information (CEPI) 37
04/24/2018
Annual Education ReportChurchill High School (04848)
MI-Access Functional Independence
Subject Grade Testing Group School Year State PercentStudentsProficient
DistrictPercentStudentsProficient
School PercentStudentsProficient
PercentSurpassed
PercentAttained
PercentEmerging
Mathematics 11th GradeContent
White 2015-16 83.9% <10 <10 <10 <10 <10
Mathematics 11th GradeContent
White 2016-17 70.2% 66.7% <10 <10 <10 <10
Science 11th GradeContent
White 2015-16 56.2% <10 <10 <10 <10 <10
Science 11th GradeContent
White 2016-17 60.7% 58.3% <10 <10 <10 <10
Social Studies 11th GradeContent
White 2015-16 49.7% <10 <10 <10 <10 <10
Social Studies 11th GradeContent
White 2016-17 55.7% 50.0% <10 <10 <10 <10
ELA 11th GradeContent
Female 2015-16 81.0% <10 <10 <10 <10 <10
ELA 11th GradeContent
Female 2016-17 82.5% <10 <10 <10 <10 <10
Mathematics 11th GradeContent
Female 2015-16 74.9% <10 <10 <10 <10 <10
Mathematics 11th GradeContent
Female 2016-17 57.2% <10 <10 <10 <10 <10
Science 11th GradeContent
Female 2015-16 42.0% <10 <10 <10 <10 <10
Science 11th GradeContent
Female 2016-17 45.7% <10 <10 <10 <10 <10
Social Studies 11th GradeContent
Female 2015-16 37.0% <10 <10 <10 <10 <10
Page 17 of A service of the Center for Educational Performance and Information (CEPI) 37
04/24/2018
Annual Education ReportChurchill High School (04848)
MI-Access Functional Independence
Subject Grade Testing Group School Year State PercentStudentsProficient
DistrictPercentStudentsProficient
School PercentStudentsProficient
PercentSurpassed
PercentAttained
PercentEmerging
Social Studies 11th GradeContent
Female 2016-17 42.0% <10 <10 <10 <10 <10
ELA 11th GradeContent
Male 2015-16 81.0% <10 <10 <10 <10 <10
ELA 11th GradeContent
Male 2016-17 83.3% 90.0% <10 <10 <10 <10
Mathematics 11th GradeContent
Male 2015-16 82.3% <10 <10 <10 <10 <10
Mathematics 11th GradeContent
Male 2016-17 66.3% 80.0% <10 <10 <10 <10
Science 11th GradeContent
Male 2015-16 50.3% <10 <10 <10 <10 <10
Science 11th GradeContent
Male 2016-17 53.8% 50.0% <10 <10 <10 <10
Social Studies 11th GradeContent
Male 2015-16 46.3% <10 <10 <10 <10 <10
Social Studies 11th GradeContent
Male 2016-17 50.7% 50.0% <10 <10 <10 <10
ELA 11th GradeContent
EconomicallyDisadvantaged
2016-17 83.0% <10 <10 <10 <10 <10
Mathematics 11th GradeContent
EconomicallyDisadvantaged
2016-17 63.4% <10 <10 <10 <10 <10
Science 11th GradeContent
EconomicallyDisadvantaged
2016-17 51.5% <10 <10 <10 <10 <10
Social Studies 11th GradeContent
EconomicallyDisadvantaged
2016-17 47.5% <10 <10 <10 <10 <10
Page 18 of A service of the Center for Educational Performance and Information (CEPI) 37

04/24/2018
Annual Education ReportChurchill High School (04848)
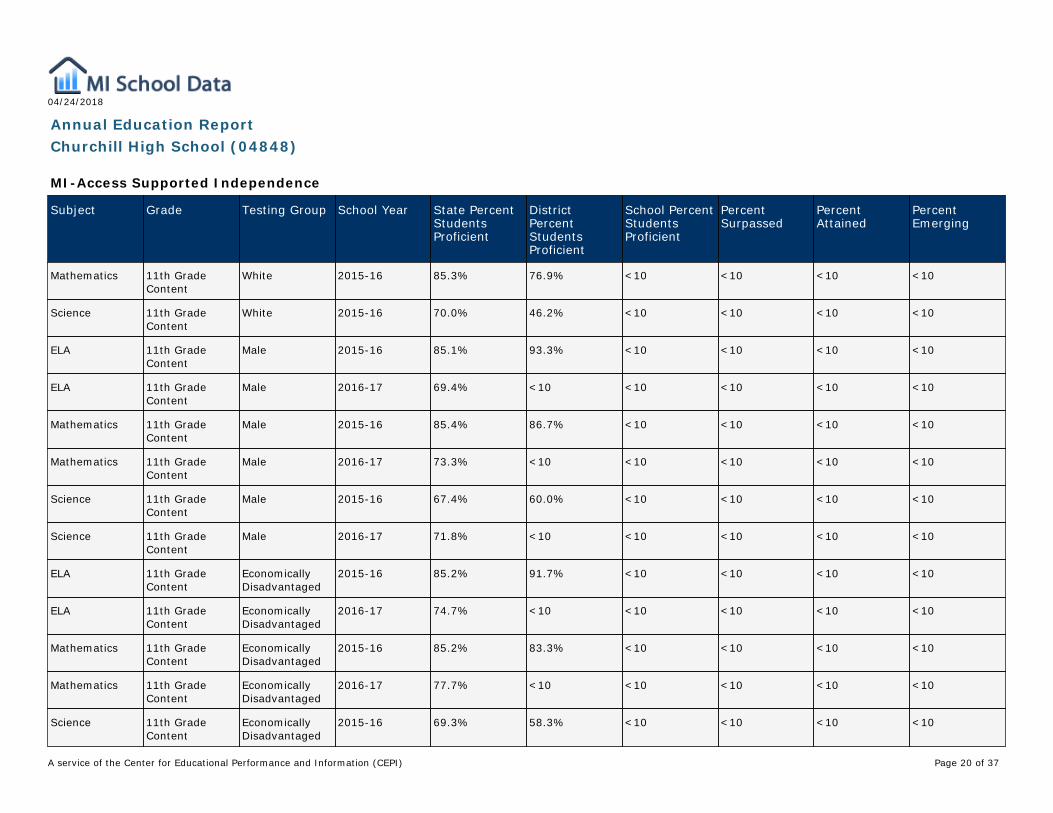
MI-Access Supported Independence
Subject Grade Testing Group School Year State PercentStudentsProficient
DistrictPercentStudentsProficient
School PercentStudentsProficient
PercentSurpassed
PercentAttained
PercentEmerging
ELA 11th GradeContent
All Students 2015-16 86.5% 89.5% <10 <10 <10 <10
ELA 11th GradeContent
All Students 2016-17 69.6% 58.3% <10 <10 <10 <10
Mathematics 11th GradeContent
All Students 2015-16 86.7% 84.2% <10 <10 <10 <10
Mathematics 11th GradeContent
All Students 2016-17 73.7% 50.0% <10 <10 <10 <10
Science 11th GradeContent
All Students 2015-16 68.7% 57.9% <10 <10 <10 <10
Science 11th GradeContent
All Students 2016-17 71.4% 58.3% <10 <10 <10 <10
ELA 11th GradeContent
Asian 2016-17 70.0% <10 <10 <10 <10 <10
Mathematics 11th GradeContent
Asian 2016-17 100.0% <10 <10 <10 <10 <10
Science 11th GradeContent
Asian 2016-17 70.0% <10 <10 <10 <10 <10
ELA 11th GradeContent
Black or AfricanAmerican
2016-17 66.9% <10 <10 <10 <10 <10
Mathematics 11th GradeContent
Black or AfricanAmerican
2016-17 72.5% <10 <10 <10 <10 <10
Science 11th GradeContent
Black or AfricanAmerican
2016-17 74.4% <10 <10 <10 <10 <10
ELA 11th GradeContent
White 2015-16 86.3% 84.6% <10 <10 <10 <10
Page 19 of A service of the Center for Educational Performance and Information (CEPI) 37
04/24/2018
Annual Education ReportChurchill High School (04848)
MI-Access Supported Independence
Subject Grade Testing Group School Year State PercentStudentsProficient
DistrictPercentStudentsProficient
School PercentStudentsProficient
PercentSurpassed
PercentAttained
PercentEmerging
Mathematics 11th GradeContent
White 2015-16 85.3% 76.9% <10 <10 <10 <10
Science 11th GradeContent
White 2015-16 70.0% 46.2% <10 <10 <10 <10
ELA 11th GradeContent
Male 2015-16 85.1% 93.3% <10 <10 <10 <10
ELA 11th GradeContent
Male 2016-17 69.4% <10 <10 <10 <10 <10
Mathematics 11th GradeContent
Male 2015-16 85.4% 86.7% <10 <10 <10 <10
Mathematics 11th GradeContent
Male 2016-17 73.3% <10 <10 <10 <10 <10
Science 11th GradeContent
Male 2015-16 67.4% 60.0% <10 <10 <10 <10
Science 11th GradeContent
Male 2016-17 71.8% <10 <10 <10 <10 <10
ELA 11th GradeContent
EconomicallyDisadvantaged
2015-16 85.2% 91.7% <10 <10 <10 <10
ELA 11th GradeContent
EconomicallyDisadvantaged
2016-17 74.7% <10 <10 <10 <10 <10
Mathematics 11th GradeContent
EconomicallyDisadvantaged
2015-16 85.2% 83.3% <10 <10 <10 <10
Mathematics 11th GradeContent
EconomicallyDisadvantaged
2016-17 77.7% <10 <10 <10 <10 <10
Science 11th GradeContent
EconomicallyDisadvantaged
2015-16 69.3% 58.3% <10 <10 <10 <10
Page 20 of A service of the Center for Educational Performance and Information (CEPI) 37
04/24/2018
Annual Education ReportChurchill High School (04848)
MI-Access Supported Independence
Subject Grade Testing Group School Year State PercentStudentsProficient
DistrictPercentStudentsProficient
School PercentStudentsProficient
PercentSurpassed
PercentAttained
PercentEmerging
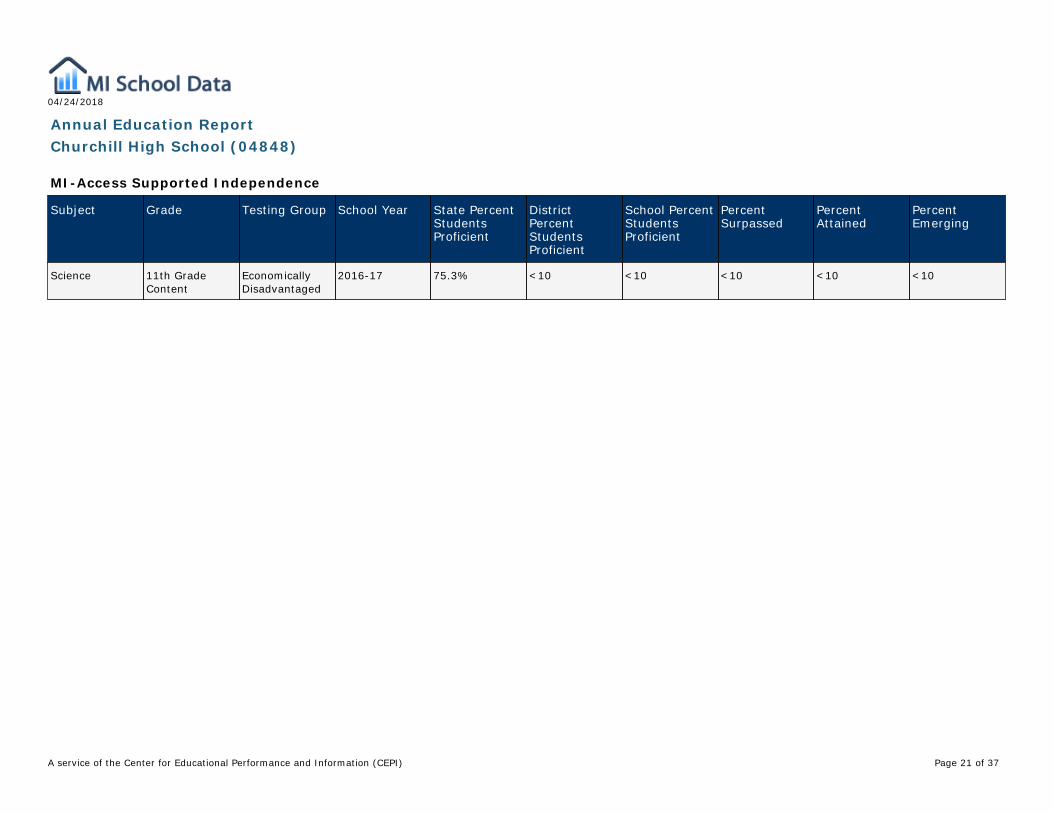
Science 11th GradeContent
EconomicallyDisadvantaged
2016-17 75.3% <10 <10 <10 <10 <10
Page 21 of A service of the Center for Educational Performance and Information (CEPI) 37

04/24/2018
Annual Education ReportChurchill High School (04848)
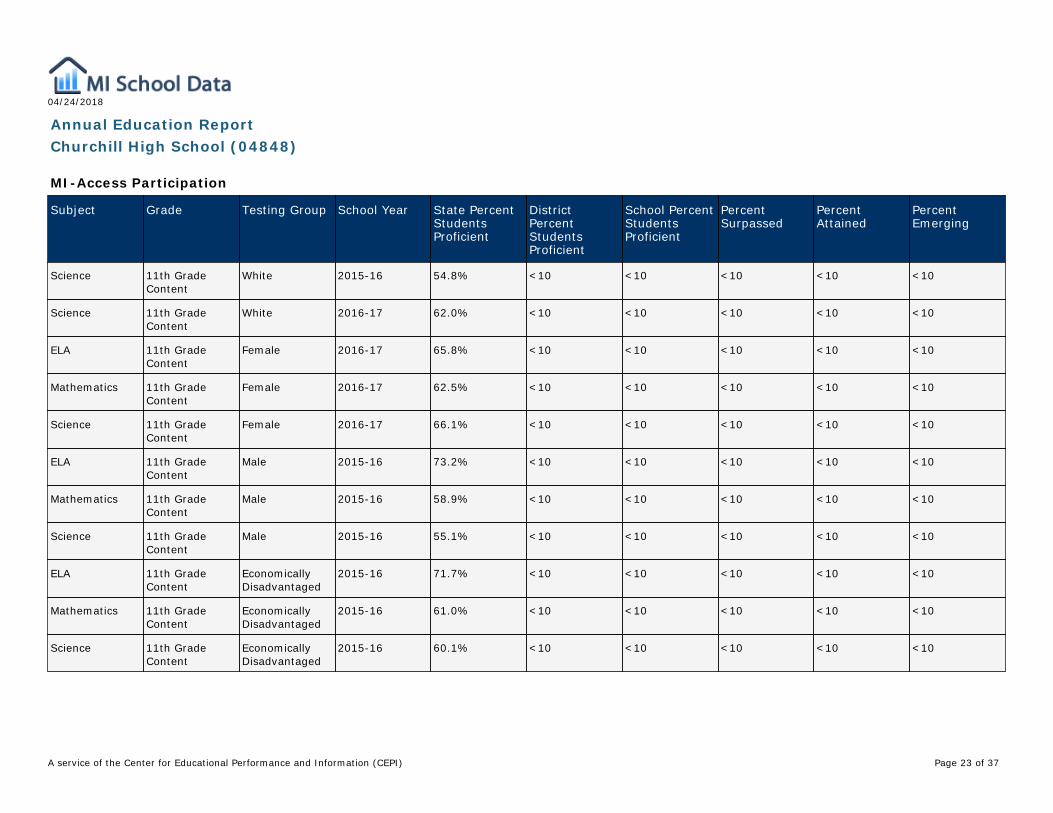
MI-Access Participation
Subject Grade Testing Group School Year State PercentStudentsProficient
DistrictPercentStudentsProficient
School PercentStudentsProficient
PercentSurpassed
PercentAttained
PercentEmerging
ELA 11th GradeContent
All Students 2015-16 72.0% <10 <10 <10 <10 <10
ELA 11th GradeContent
All Students 2016-17 61.4% <10 <10 <10 <10 <10
Mathematics 11th GradeContent
All Students 2015-16 58.6% <10 <10 <10 <10 <10
Mathematics 11th GradeContent
All Students 2016-17 58.6% <10 <10 <10 <10 <10
Science 11th GradeContent
All Students 2015-16 56.7% <10 <10 <10 <10 <10
Science 11th GradeContent
All Students 2016-17 60.7% <10 <10 <10 <10 <10
ELA 11th GradeContent
Black or AfricanAmerican
2015-16 71.6% <10 <10 <10 <10 <10
Mathematics 11th GradeContent
Black or AfricanAmerican
2015-16 64.0% <10 <10 <10 <10 <10
Science 11th GradeContent
Black or AfricanAmerican
2015-16 60.2% <10 <10 <10 <10 <10
ELA 11th GradeContent
White 2015-16 71.4% <10 <10 <10 <10 <10
ELA 11th GradeContent
White 2016-17 63.0% <10 <10 <10 <10 <10
Mathematics 11th GradeContent
White 2015-16 55.7% <10 <10 <10 <10 <10
Mathematics 11th GradeContent
White 2016-17 57.5% <10 <10 <10 <10 <10
Page 22 of A service of the Center for Educational Performance and Information (CEPI) 37
04/24/2018
Annual Education ReportChurchill High School (04848)
MI-Access Participation
Subject Grade Testing Group School Year State PercentStudentsProficient
DistrictPercentStudentsProficient
School PercentStudentsProficient
PercentSurpassed
PercentAttained
PercentEmerging
Science 11th GradeContent
White 2015-16 54.8% <10 <10 <10 <10 <10
Science 11th GradeContent
White 2016-17 62.0% <10 <10 <10 <10 <10
ELA 11th GradeContent
Female 2016-17 65.8% <10 <10 <10 <10 <10
Mathematics 11th GradeContent
Female 2016-17 62.5% <10 <10 <10 <10 <10
Science 11th GradeContent
Female 2016-17 66.1% <10 <10 <10 <10 <10
ELA 11th GradeContent
Male 2015-16 73.2% <10 <10 <10 <10 <10
Mathematics 11th GradeContent
Male 2015-16 58.9% <10 <10 <10 <10 <10
Science 11th GradeContent
Male 2015-16 55.1% <10 <10 <10 <10 <10
ELA 11th GradeContent
EconomicallyDisadvantaged
2015-16 71.7% <10 <10 <10 <10 <10
Mathematics 11th GradeContent
EconomicallyDisadvantaged
2015-16 61.0% <10 <10 <10 <10 <10
Science 11th GradeContent
EconomicallyDisadvantaged
2015-16 60.1% <10 <10 <10 <10 <10
Page 23 of A service of the Center for Educational Performance and Information (CEPI) 37
04/24/2018
Annual Education ReportChurchill High School (04848)
Accountability Details Subject Data
TestingGroup
Subject State TestedTotal
State PercentProficient
DistrictTested Total
DistrictPercentProficient*
School TestedTotal
SchoolPercentProficient**
All Students ELA 98.6% 49.5% 99.4% 58.3% 99.0% 74.1%
All Students Mathematics 98.7% 39.1% 99.3% 51.9% 99.0% 52.4%
All Students Science 97.9% 24.9% 99.0% 30.4% 98.7% 42.6%
All Students Social Studies 97.8% 33.7% 99.2% 42.5% 99.0% 64.5%
Bottom 30% ELA N/A 3.8% N/A 1.6% N/A 14.2%
Bottom 30% Mathematics N/A 1.5% N/A 0.7% N/A 0.9%
Bottom 30% Science N/A 0.4% N/A 0.6% N/A 0.0%
Bottom 30% Social Studies N/A 0.6% N/A 0.0% N/A 0.0%
AmericanIndian orAlaska Native
ELA 97.6% 40.5% <30 <30 <30 <30
AmericanIndian orAlaska Native
Mathematics 97.8% 28.8% <30 <30 <30 <30
AmericanIndian orAlaska Native
Science 96.8% 19.1% <30 <30 <30 <30
AmericanIndian orAlaska Native
Social Studies 96.4% 28.9% <30 <30 <30 <30
Asian ELA 99.1% 70.5% 99.3% 72.6% <30 <30
Asian Mathematics 99.3% 68.9% 99.3% 75.3% <30 <30
Asian Science 99.1% 41.4% 97.6% 34.5% <30 <30
Asian Social Studies 98.9% 51.9% 98.5% 51.2% <30 <30
Black or AfricanAmerican
ELA 97.6% 25.0% 98.2% 35.1% 98.2% 39.2%
Black or AfricanAmerican
Mathematics 97.5% 14.2% 98.2% 25.0% 98.2% 19.6%
Black or AfricanAmerican
Science 96.0% 7.0% 97.7% 12.8% 98.2% 5.9%
Black or AfricanAmerican
Social Studies 95.9% 11.2% 98.5% 19.0% 100.0% 19.2%
Hispanic of AnyRace
ELA 98.6% 36.9% 99.7% 54.4% <30 <30
Hispanic of AnyRace
Mathematics 98.7% 25.1% 99.2% 44.5% <30 <30
Page 24 of A service of the Center for Educational Performance and Information (CEPI) 37

04/24/2018
Annual Education ReportChurchill High School (04848)
Accountability Details Subject Data
TestingGroup
Subject State TestedTotal
State PercentProficient
DistrictTested Total
DistrictPercentProficient*
School TestedTotal
SchoolPercentProficient**
Hispanic of AnyRace
Science 97.7% 13.5% 100.0% 27.0% <30 <30
Hispanic of AnyRace
Social Studies 97.8% 21.1% 99.3% 33.3% <30 <30
NativeHawaiian orOther PacificIslander
ELA 97.7% 54.8% N/A N/A N/A N/A
NativeHawaiian orOther PacificIslander
Mathematics 98.1% 43.4% N/A N/A N/A N/A
NativeHawaiian orOther PacificIslander
Science 97.6% 28.3% N/A N/A N/A N/A
NativeHawaiian orOther PacificIslander
Social Studies 98.1% 38.8% N/A N/A N/A N/A
Two or MoreRaces
ELA 98.7% 46.6% 98.8% 55.1% <30 <30
Two or MoreRaces
Mathematics 98.6% 35.1% 98.4% 45.9% <30 <30
Two or MoreRaces
Science 97.7% 21.9% 98.2% 33.0% <30 <30
Two or MoreRaces
Social Studies 97.7% 29.7% 98.2% 42.2% <30 <30
White ELA 98.9% 56.1% 99.5% 60.4% 99.0% 78.2%
White Mathematics 99.0% 45.6% 99.5% 54.2% 99.0% 54.6%
White Science 98.4% 29.7% 99.2% 32.1% 98.6% 47.0%
White Social Studies 98.3% 39.7% 99.3% 44.9% 98.6% 70.9%
EconomicallyDisadvantaged
ELA 98.2% 33.5% 99.2% 42.3% 98.2% 58.7%
EconomicallyDisadvantaged
Mathematics 98.3% 23.3% 99.0% 34.7% 98.2% 33.7%
EconomicallyDisadvantaged
Science 97.2% 13.0% 98.5% 17.8% 97.3% 22.3%
EconomicallyDisadvantaged
Social Studies 97.0% 18.3% 98.4% 28.1% 98.2% 44.7%
Page 25 of A service of the Center for Educational Performance and Information (CEPI) 37

04/24/2018
Annual Education ReportChurchill High School (04848)
Accountability Details Subject Data
TestingGroup
Subject State TestedTotal
State PercentProficient
DistrictTested Total
DistrictPercentProficient*
School TestedTotal
SchoolPercentProficient**
EnglishLearners
ELA 98.6% 24.0% 99.7% 33.7% <30 <30
EnglishLearners
Mathematics 99.0% 23.0% 99.0% 38.1% <30 <30
EnglishLearners
Science 98.4% 5.0% 98.0% 8.0% <30 <30
EnglishLearners
Social Studies 98.2% 7.8% 97.8% 13.8% <30 <30
Students WithDisabilities
ELA 97.5% 26.0% 97.5% 30.3% 94.2% 40.4%
Students WithDisabilities
Mathematics 97.9% 20.7% 97.6% 25.8% 94.2% 27.7%
Students WithDisabilities
Science 96.9% 15.8% 97.7% 20.1% 92.3% 17.4%
Students WithDisabilities
Social Studies 95.9% 14.2% 96.2% 15.6% 93.9% 26.7%
Page 26 of A service of the Center for Educational Performance and Information (CEPI) 37
04/24/2018
Annual Education ReportChurchill High School (04848)
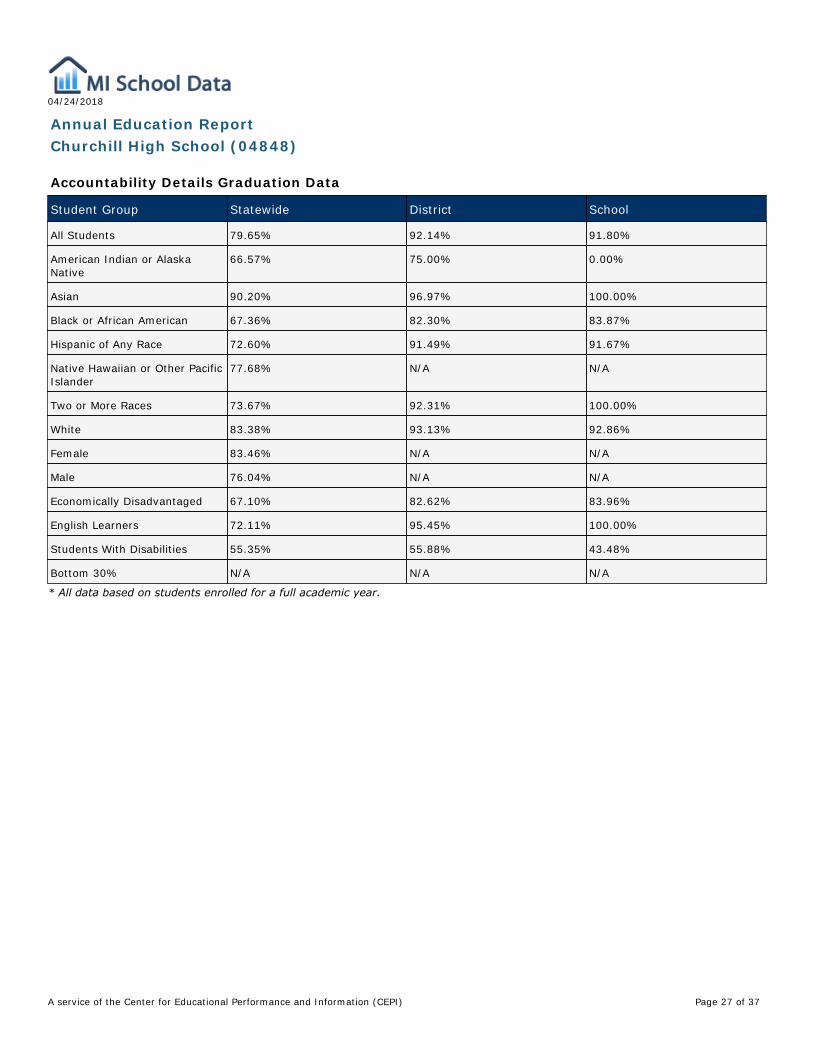
Accountability Details Graduation Data
Student Group Statewide District School
All Students 79.65% 92.14% 91.80%
American Indian or AlaskaNative
66.57% 75.00% 0.00%
Asian 90.20% 96.97% 100.00%
Black or African American 67.36% 82.30% 83.87%
Hispanic of Any Race 72.60% 91.49% 91.67%
Native Hawaiian or Other PacificIslander
77.68% N/A N/A
Two or More Races 73.67% 92.31% 100.00%
White 83.38% 93.13% 92.86%
Female 83.46% N/A N/A
Male 76.04% N/A N/A
Economically Disadvantaged 67.10% 82.62% 83.96%
English Learners 72.11% 95.45% 100.00%
Students With Disabilities 55.35% 55.88% 43.48%
Bottom 30% N/A N/A N/A
* All data based on students enrolled for a full academic year.
Page 27 of A service of the Center for Educational Performance and Information (CEPI) 37
04/24/2018
Annual Education ReportChurchill High School (04848)
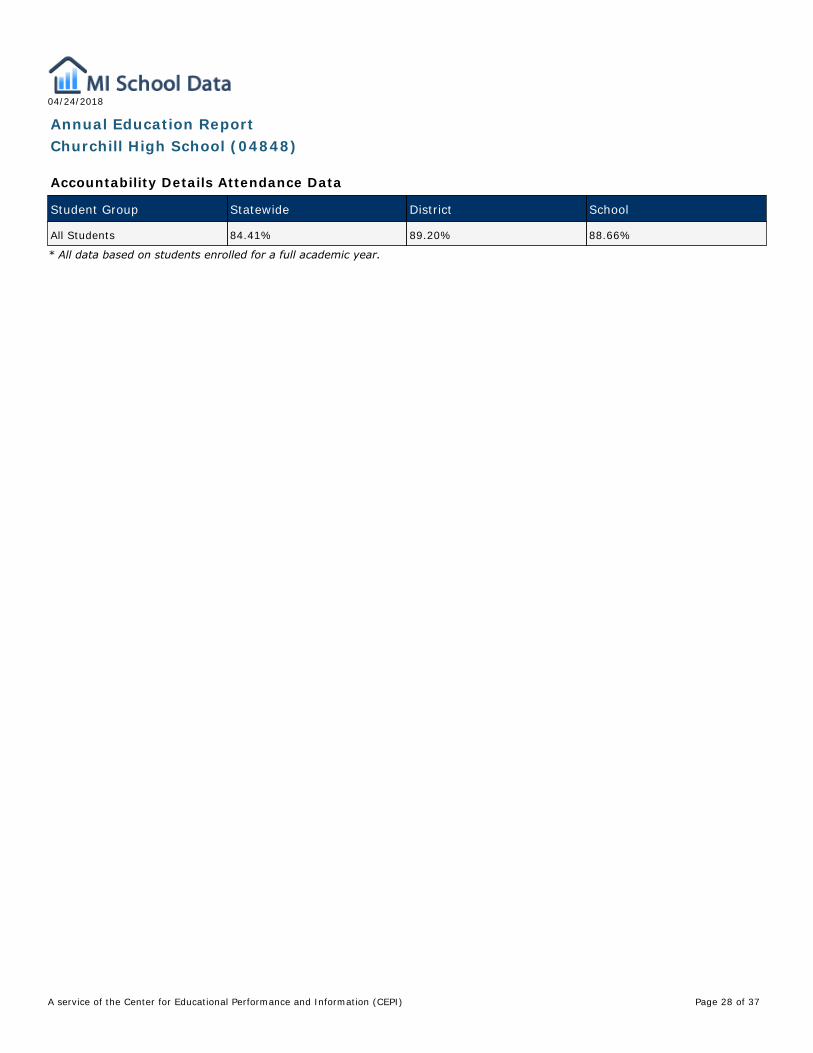
Accountability Details Attendance Data
Student Group Statewide District School
All Students 84.41% 89.20% 88.66%
* All data based on students enrolled for a full academic year.
Page 28 of A service of the Center for Educational Performance and Information (CEPI) 37
04/24/2018
Annual Education ReportChurchill High School (04848)
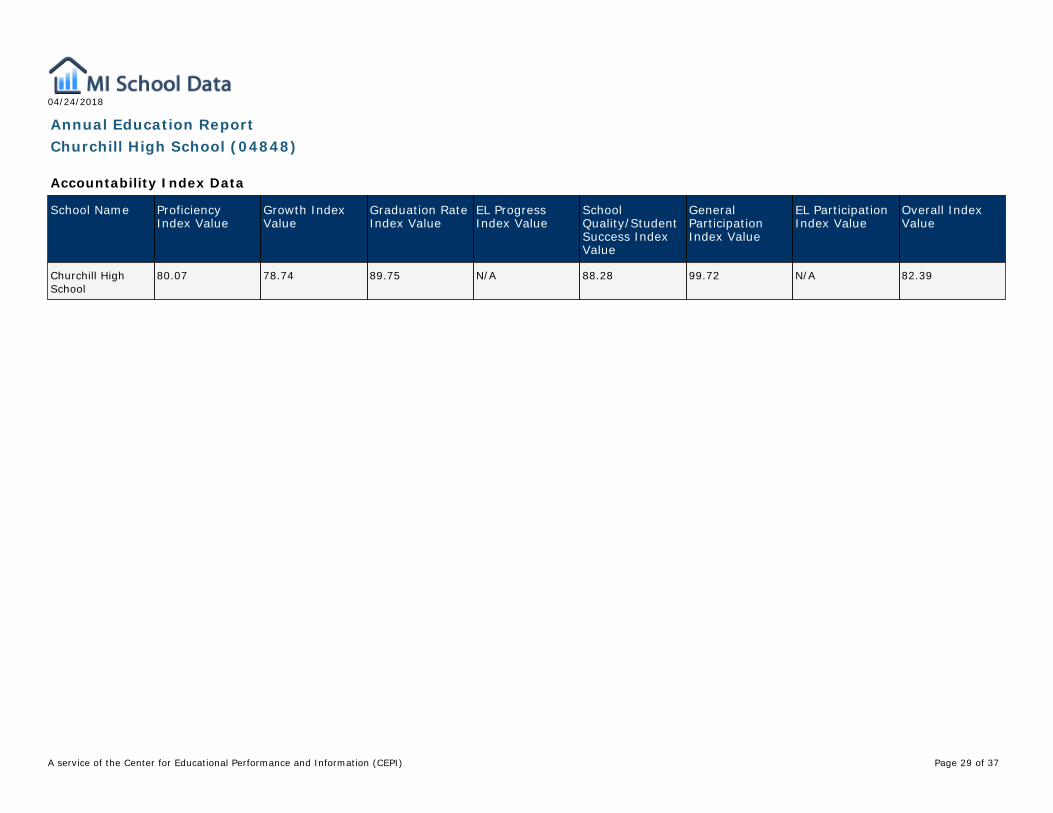
Accountability Index Data
School Name ProficiencyIndex Value
Growth IndexValue
Graduation RateIndex Value
EL ProgressIndex Value
SchoolQuality/StudentSuccess IndexValue
GeneralParticipationIndex Value
EL ParticipationIndex Value
Overall IndexValue
Churchill HighSchool
80.07 78.74 89.75 N/A 88.28 99.72 N/A 82.39
Page 29 of A service of the Center for Educational Performance and Information (CEPI) 37
04/24/2018
Annual Education ReportChurchill High School (04848)
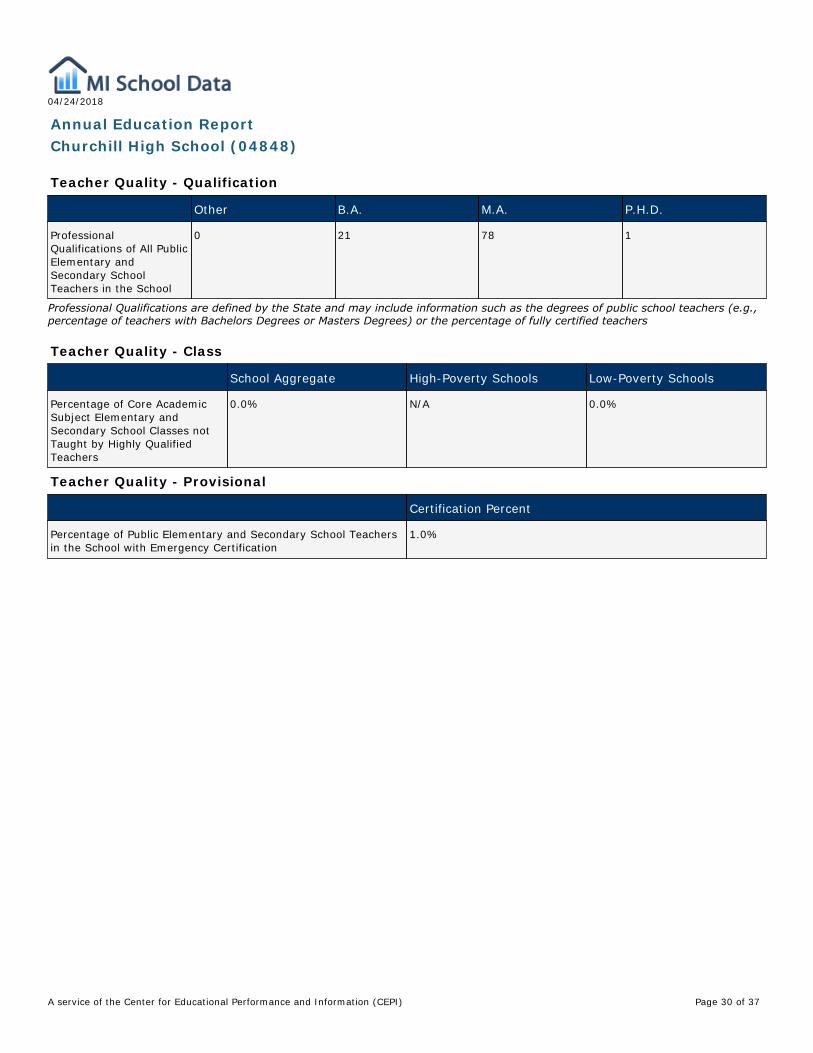
Teacher Quality - Qualification
Other B.A. M.A. P.H.D.
ProfessionalQualifications of All PublicElementary andSecondary SchoolTeachers in the School
0 21 78 1
Professional Qualifications are defined by the State and may include information such as the degrees of public school teachers (e.g.,percentage of teachers with Bachelors Degrees or Masters Degrees) or the percentage of fully certified teachers
Teacher Quality - Class
School Aggregate High-Poverty Schools Low-Poverty Schools
Percentage of Core AcademicSubject Elementary andSecondary School Classes notTaught by Highly QualifiedTeachers
0.0% N/A 0.0%
Teacher Quality - Provisional
Certification Percent
Percentage of Public Elementary and Secondary School Teachersin the School with Emergency Certification
1.0%
Page 30 of A service of the Center for Educational Performance and Information (CEPI) 37

04/24/2018
Annual Education ReportChurchill High School (04848)
NAEP Grade 4 Math
Percent ofStudents
Percent belowBasic
Percent Basic Percent Proficient Percent Advanced
All Students 100 23 77 34 5
MaleFemale
5149
2223
7877
3632
64
National LunchProgram EligibilityEligibleNot EligibleInfo not available
4753#
3610‡
6490‡
1749‡
19‡
Race/EthnicityWhiteBlack or AfricanAmericanHispanicAsianAmerican Indian orAlaska NativeNative Hawaiian orOther PacificIslanderTwo or More Races
7215641#3
15533811‡‡‡
85476289‡‡‡
39102158‡‡‡
5觷‡‡‡
Student classified ashaving a disabilitySDNot SD
1288
4719
5381
1437
15
Student is an EnglishLanguage LearnerELLNot ELL
595
4222
5878
1635
15
‡ Reporting Standards not met. Note: Observed differences are not necessarily statistically significant. Detail may not sum to totalbecause of rounding. SOURCE: U.S. Department of Education. Institute for Education Sciences. National Center for EducationStatistics. National Assessment of Educational Progress (NAEP) 2015 Mathematics Achievement.
Page 31 of A service of the Center for Educational Performance and Information (CEPI) 37

04/24/2018
Annual Education ReportChurchill High School (04848)
NAEP Grade 8 Math
Percent ofStudents
Percent belowBasic
Percent Basic Percent Proficient Percent Advanced
All Students 100 32 39 22 7
MaleFemale
5149
3134
3939
2321
76
National LunchProgram EligibilityEligibleNot EligibleInfo not available
4555#
4819‡
3940‡
1230‡
211‡
Race/EthnicityWhiteBlack or AfricanAmericanHispanicAsianAmerican Indian orAlaska NativeNative Hawaiian orOther PacificIslanderTwo or More Races
6920431#2
23663811‡‡‡
43294418‡‡‡
2651539‡‡‡
7#432‡‡‡
Student classified ashaving a disabilitySDNot SD
1189
7727
1941
324
#7
Student is an EnglishLanguage LearnerELLNot ELL
397
5432
3339
1122
27
‡ Reporting Standards not met. NOTE: Observed differences are not necessarily statistically significant. Detail may not sum to totalbecause of rounding. SOURCE: U.S. Department of Education. Institute for Education Sciences. National Center for EducationStatistics. National Assessment of Educational Progress (NAEP) 2015 Mathematics Achievement.
Page 32 of A service of the Center for Educational Performance and Information (CEPI) 37
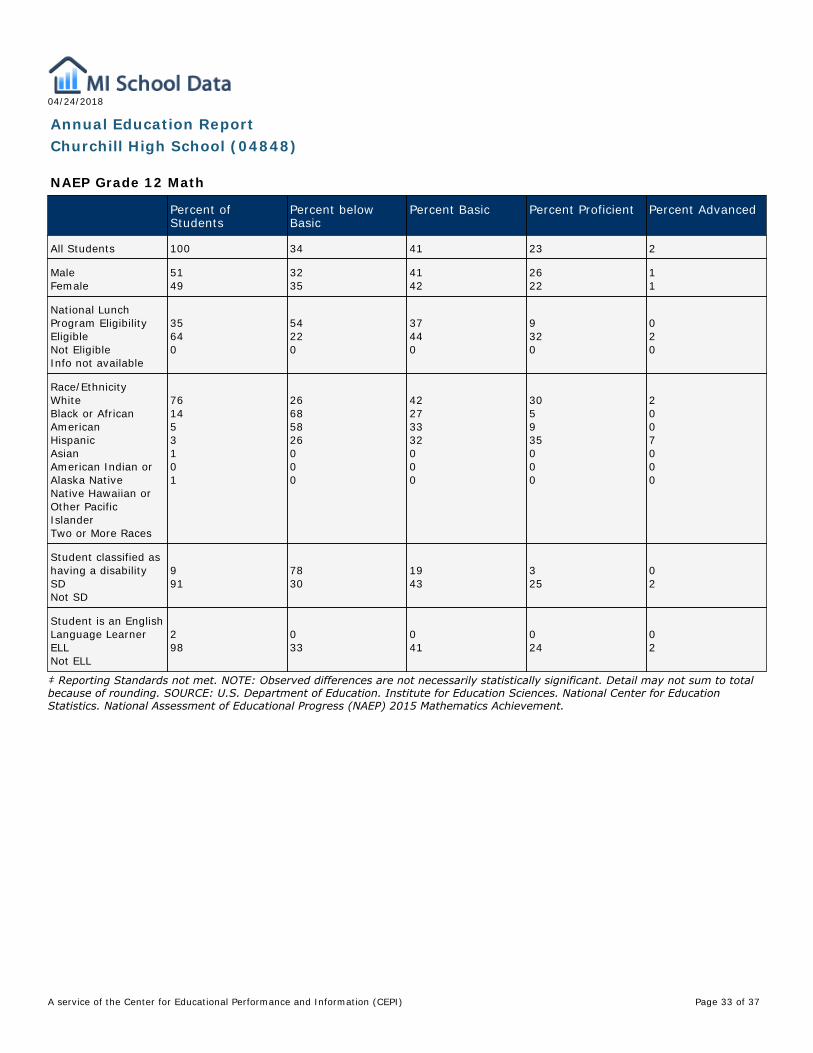
04/24/2018
Annual Education ReportChurchill High School (04848)
NAEP Grade 12 Math
Percent ofStudents
Percent belowBasic
Percent Basic Percent Proficient Percent Advanced
All Students 100 34 41 23 2
MaleFemale
5149
3235
4142
2622
11
National LunchProgram EligibilityEligibleNot EligibleInfo not available
35640
54220
37440
9320
020
Race/EthnicityWhiteBlack or AfricanAmericanHispanicAsianAmerican Indian orAlaska NativeNative Hawaiian orOther PacificIslanderTwo or More Races
761453101
26685826000
42273332000
305935000
2007000
Student classified ashaving a disabilitySDNot SD
991
7830
1943
325
02
Student is an EnglishLanguage LearnerELLNot ELL
298
033
041
024
02
‡ Reporting Standards not met. NOTE: Observed differences are not necessarily statistically significant. Detail may not sum to totalbecause of rounding. SOURCE: U.S. Department of Education. Institute for Education Sciences. National Center for EducationStatistics. National Assessment of Educational Progress (NAEP) 2015 Mathematics Achievement.
Page 33 of A service of the Center for Educational Performance and Information (CEPI) 37

04/24/2018
Annual Education ReportChurchill High School (04848)
NAEP Grade 4 Reading
Percent ofStudents
Percent belowBasic
Percent Basic Percent Proficient Percent Advanced
All Students 100 37 63 29 5
MaleFemale
5050
3934
6166
2631
56
National LunchProgram EligibilityEligibleNot EligibleInfo not available
4852#
5024‡
5076‡
1640‡
18‡
Race/EthnicityWhiteBlack or AfricanAmericanHispanicAsianAmerican Indian orAlaska NativeNative Hawaiian orOther PacificIslanderTwo or More Races
7214641#3
32664916‡‡30
68345184‡‡70
3291749‡‡37
61115‡‡8
Student classified ashaving a disabilitySDNot SD
1288
7632
2468
731
#6
Student is an EnglishLanguage LearnerELLNot ELL
496
5236
4864
1629
25
# Rounds to zero‡ Reporting Standards not met. NOTE: Observed differences are not necessarily statistically significant. Detail may not sum to totalbecause of rounding. SOURCE: U.S. Department of Education, Institute of Education Sciences, National Center for EducationStatistics, National Assessment of Educational Progress (NAEP), 2015 Reading Assessment.
Page 34 of A service of the Center for Educational Performance and Information (CEPI) 37

04/24/2018
Annual Education ReportChurchill High School (04848)
NAEP Grade 8 Reading
Percent ofStudents
Percent belowBasic
Percent Basic Percent Proficient Percent Advanced
All Students 100 24 44 29 3
MaleFemale
5149
2920
4542
2534
24
National LunchProgram EligibilityEligibleNot EligibleInfo not available
4555#
3714‡
4543‡
1739‡
14‡
Race/EthnicityWhiteBlack or AficanAmericanHispanicAsian/NativeHawaiian or PacificIslanderAmerican Indian orAlaska NativeTwo or More Races
69204312
18472713‡‡
44444135‡‡
3492941‡‡
3觮‡‡
Student classified ashaving a disabilitySDNot SD
1090
6420
3045
532
#3
Student is an EnglishLanguage LearnerELLNot ELL
397
5723
3744
630
#3
# Rounds to zero‡ Reporting Standards not met. NOTE: Observed differences are not necessarily statistically significant. Detail may not sum to totalbecause of rounding. SOURCE: U.S. Department of Education, Institute of Education Sciences, National Center for EducationStatistics, National Assessment of Educational Progress (NAEP), 2015 Reading Assessment.
Page 35 of A service of the Center for Educational Performance and Information (CEPI) 37
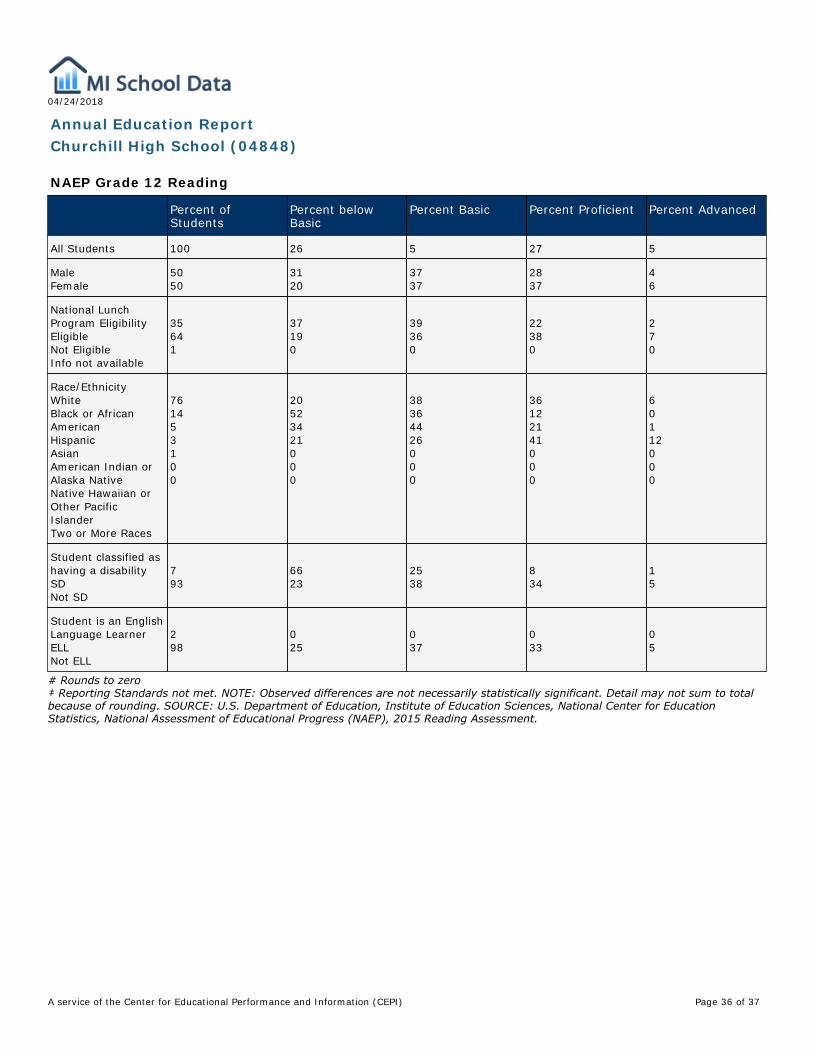
04/24/2018
Annual Education ReportChurchill High School (04848)
NAEP Grade 12 Reading
Percent ofStudents
Percent belowBasic
Percent Basic Percent Proficient Percent Advanced
All Students 100 26 5 27 5
MaleFemale
5050
3120
3737
2837
46
National LunchProgram EligibilityEligibleNot EligibleInfo not available
35641
37190
39360
22380
270
Race/EthnicityWhiteBlack or AfricanAmericanHispanicAsianAmerican Indian orAlaska NativeNative Hawaiian orOther PacificIslanderTwo or More Races
761453100
20523421000
38364426000
36122141000
60112000
Student classified ashaving a disabilitySDNot SD
793
6623
2538
834
15
Student is an EnglishLanguage LearnerELLNot ELL
298
025
037
033
05
# Rounds to zero‡ Reporting Standards not met. NOTE: Observed differences are not necessarily statistically significant. Detail may not sum to totalbecause of rounding. SOURCE: U.S. Department of Education, Institute of Education Sciences, National Center for EducationStatistics, National Assessment of Educational Progress (NAEP), 2015 Reading Assessment.
Page 36 of A service of the Center for Educational Performance and Information (CEPI) 37

04/24/2018
Annual Education ReportChurchill High School (04848)
NAEP Participation Data
Grade Subject Participation Ratefor Students withDisabilities
Standard Error Participation Ratefor Limited EnglishProficient Students
Standard Error
4 MathReading
8773
1.93.7
9590
2.02.5
8 MathReading
8476
3.63.3
8483
5.24.0
Page 37 of A service of the Center for Educational Performance and Information (CEPI) 37


![Index [] · Edward Tudor 2016 Churchill Fellow The Jack Brockhoff Foundation Churchill Fellowship to investigate programs that support the transition of young Indigenous or disadvantaged](https://static.fdocuments.us/doc/165x107/5e57af64c2cafc3b326a3437/index-edward-tudor-2016-churchill-fellow-the-jack-brockhoff-foundation-churchill.jpg)