Chronicling Socioeconomic Achievements of the Unity …s3.amazonaws.com/zanran_storage/ Progress by...
62
Transcript of Chronicling Socioeconomic Achievements of the Unity …s3.amazonaws.com/zanran_storage/ Progress by...

Chronicling Socioeconomic Achievements of the Unity Party Government 2006-2011 Page 2
ACRONYMS
AFI Alliance of Financial Inclusion
AFL Armed Forces of Liberia
ALP Accelerated Learning Program
ASRP Agriculture Sector Rehabilitation Program
BPHS Basic Package of Health Services
CAADP Comprehensive African Agriculture Development Program
CARI Central Agriculture Research Institute
CPI Consumer Price Index
CWIQ Core Welfare Indicator Questionnaire
FDI Foreign direct investment
FYS Farmer Yield School
GDP Gross Domestics Product
GEF Global Environment Facility
GER Gross Enrollment Ratio
GIABA Inter-Governmental Action Group against Money Laundering and Terrorist Financing
GPI Gender Parity Index

Chronicling Socioeconomic Achievements of the Unity Party Government 2006-2011 Page 3
HDI Human Development Index
HIPC Heavily Indebted Poor Country Initiative
ACRONYMS
HIV/AIDS Human Immune Deficiency Disease
ILO International Labor Organization
IMF International Monetary Fund
IPRS Interim Poverty Reduction Strategy
LASIP Liberia Agriculture Sector Investment Program
LDHS Liberia Demographic Health Survey
LPREF Liberia Primary Education Recovery Program
LRDC Liberia Reconstruction Development Committee
LTA Liberia Telecommunications Authority
MDA Mineral Development Agreement
MDGs Millennium Development Goals
NER Net Enrollment Ratio
NGDP Nominal Gross Domestic Product
NGOs Non Governmental Organizations
NSCR National School Census Report
Chronicling Socioeconomic Achievements of the Unity Party Government 2006-2011 Page 4
NSCR National School Census Report
NTPS National Transportation Policy and Strategy
PNC Postnatal Care
PPP Purchasing power parity
PRS Poverty Reduction Strategy
RTTI Rural Teachers Training Institute
RTTIs Rural Teachers Training Institute
SMEs Small Medium Enterprise
UNDP United Nations Development Program
UNHCR United Nations High Commission for Refugees
UP Unity Party
USAID United States Agency for International Development
WATSAN Water and Sanitation Action
WB World Bank

Chronicling Socioeconomic Achievements of the Unity Party Government 2006-2011 Page 5
Table of Contents
Introduction ................................................................................................................................................................................................................... 9
Election Issues ............................................................................................................................................................................................................ 9
Measuring Progress by the Numbers....................................................................................................................................................................... 11
Challenges to Dissemination of Information ........................................................................................................................................................... 12
Baseline 2006: Effects of War and Bad Governance .................................................................................................................................................. 12
Development Context .............................................................................................................................................................................................. 12
Economic Collapse ....................................................................................................................................................................................................... 14
Increased Poverty .................................................................................................................................................................................................... 14
Demographics of Poverty and Low Income ............................................................................................................................................................. 16
Effects on Health and Education Indicators due to Population Displacement ........................................................................................................ 17
Destroyed Infrastructure ......................................................................................................................................................................................... 18
2006-2011 and Beyond: Pro-Growth Strategies for Socioeconomic Development ................................................................................................... 19
Strategic Interventions in Poverty Reduction .............................................................................................................................................................. 21
Proof that Poverty is Declining Amidst Grave Challenges ........................................................................................................................................... 22

Chronicling Socioeconomic Achievements of the Unity Party Government 2006-2011 Page 6
Exogenous Factors Inhibiting Growth and Development ........................................................................................................................................ 23
Proof that Healthcare is Improving .............................................................................................................................................................................. 27
Basic Package of Health Services (BPHS) ................................................................................................................................................................. 29
Delivery and Postnatal Care (PNC) ........................................................................................................................................................................... 30
Maternal and Child Health ....................................................................................................................................................................................... 33
Educational Attainment is Improving due to Systematic Interventions ...................................................................................................................... 34
Main Interventions and Programs in Education ...................................................................................................................................................... 37
The Liberia Primary Education Recovery Program (LPERP) of 2007 .................................................................................................................... 37
The Accelerated Learning Program (ALP) ............................................................................................................................................................ 37
Infrastructure Expansion ...................................................................................................................................................................................... 38
Instructional Materials Provision ......................................................................................................................................................................... 38
Teacher Development .......................................................................................................................................................................................... 38
Girls Education Program ...................................................................................................................................................................................... 39
Early Childhood Development and Education Program ...................................................................................................................................... 39
School Health, HIV and Handicapped Students ................................................................................................................................................... 40
Macroeconomic Improvements ................................................................................................................................................................................... 40
Infrastructural Development ....................................................................................................................................................................................... 50
Telecommunications ................................................................................................................................................................................................ 54

Chronicling Socioeconomic Achievements of the Unity Party Government 2006-2011 Page 7
Support to Agriculture ................................................................................................................................................................................................. 56
Summary and Conclusions ........................................................................................................................................................................................... 59
SOCIOEONCOMIC INDICATORS AT A GLANCE
Economic Indicators 2006 2011 Sources Real GDP Growth Rate (%) 9.4 7.1 MOPEA Real GDP est (US million) 433 988 MOPEA Nominal GDP (US million) 603.8 1,153 IMF, World Bank Public Sector workforce (active duty civil servant) 45,0000 34,000 LISGIS, MOL Informal Sector employment 470,000 672,352 LISGIS, MOL GDP per capita ( Current US$) Estimate 150 260 MOPEA Inflation Rate ( est. average %) 7.4 7.9 CBL External debt ( US $ Million) 3,203 224.3 CBL
Domestics Debt ( US Million) 302 281 CBL National Budget ( US $ Million) 80 516 MOPEA Mobile Telephony Users 586,716 1,569,708 LTA Size of Labor Force (Millions) N/A 1,133 MOL Number of Employed N/A 1,091 MOL Imports (US $ Million) 551.1 CBL Exports (US $ Million) 148.8 CBL Trade balance deficit -39.7 -46% CBL Land use for Rice Production (Hectares) 130,000 190,000 World Bank Indicators Banking Sector Highlights Number of Commercial Banks in 2006 5 11 CBL

Chronicling Socioeconomic Achievements of the Unity Party Government 2006-2011 Page 8
Capital Adequacy Ratio of the banking Sector 12.0% 27.4 CBL Number of Bank Branches CBL Average Lending Rate (%) 15.20 13.39 CBL Number of Micro-Finance Institutions CBL Number of Micro-Finance Loans 300 CBL Socio-Demographic Indicators Population size ( in Millions) N/A 3,689,403 LISGIS Population growth rate (%) N/A 2.1 LISGIS Percentage of population under 15 yrs 42% LISGIS Life Expectancy at birth N/A 52.7 UNDP HDR Literacy rate of 15-24 72.4 World Bank Data Base Percentage of population with access to education 31.46 World Bank Data Base Infant Mortality Rate ( per 100,00 live births) 78 73 MOHSW Under Five Mortality Rate 235 110 MOHSW Maternal Mortality Rate ( per 100,000 live births) 994 890 MOHSW Proportion of births attended by health 46% 64.7% MOHSW % of Population below poverty line ( < us $ per day) 76.2% 56% CWIQ Access to Improved Drinking Water 34% 77% WATSAN HIV/AIDS prevalence rate 1.9 1.5 MOHW Human Development Index 182 162 UNDP HDR

Chronicling Socioeconomic Achievements of the Unity Party Government 2006-2011 Page 9
Introduction
This document is written to provide convincing empirical evidence that the human condition in Liberia is far
better today than it was in January of 2006, when the Unity Party Government under the leadership of Madam
Ellen Johnson Sirleaf took over the reins of government. Liberians are healthier, better fed, have more income,
consume more, are more literate and enjoy the greatest amount of freedom ever in the history of the country.
Citizens and residents enjoy the highest level of infrastructural development in over 20 years. As a consequence
of these developments, Liberians enjoy economic and social freedom unmatched in the country’s history. There is
unprecedented social mobility, gender equality and economic egalitarianism, which are propelling massive
improvements in the demographics of the country.
Election Issues
The outcome of the 2011 election will be a critical factor to determine the fate and future of the Liberian nation.
The gains and future aspirations of the Liberian people could be damaged if decisions to elect a president and
other national leaders are made on the basis of ephemeral passions not borne out by facts and figures. The Unity
Party Government under the stewardship of Her Excellency, Madam Ellen Johnson Sirleaf Administration has

Chronicling Socioeconomic Achievements of the Unity Party Government 2006-2011 Page 10
made quantifiable progress in socioeconomic development. However, the number and magnitude of the
achievements have not been effectively communicated to the electorate.
As a result of the lack of effective communication, and for other reasons, the current presidential contest is, as in
2005, a “beauty” contest, pitting the popularity of candidates against each other. Although the current
incumbent is a true and tested international civil servant with credentials and achievements unmatched in the
history of the country, the elections are becoming a replay of 2005, but this time, political adversaries of the
President are using demagoguery to play on an unwitting electorate by undervaluing the achievements of the
President.
To counter the ephemeral passions of the voting public, it is necessary to make the election as one of ideas,
policies and achievements and not a “beauty contest”. That can only be done if the socioeconomic achievements
of the incumbent are catalogued and broadly disseminated using different forms of communication to reach key
voting blocs, so as to make this an election about policies. Otherwise, unnecessary ad hominem attacks,
injection of a personality cult, and other spurious and irrelevant interjections could make the elections
acrimonious and place the outcome in doubt. Such a situation could lead to chaos and instability.

Chronicling Socioeconomic Achievements of the Unity Party Government 2006-2011 Page 11
Measuring Progress by the Numbers
Thus, this document is a catalogue of the quantifiable impressive socioeconomic indicators using internationally
accepted methods from established credible sources. The report provides an overview of baseline
circumstances as of 2006 which characterized the state of the Liberian economy and infrastructural challenges;
status of major socioeconomic indicators at the beginning of 2006; domestic and global challenges faced during
the last six years, and provides convincing proof of the quantifiable improvements in the standard of living of
Liberians.
The report provides clear evidence that the four pillars of the Poverty Reduction Strategy (PRS), improved
governance and constructive engagement with international partners consolidated the gains and peace during
the fragile post conflict circumstances of the past six years. The report discusses key socioeconomic indicators by
reviewing the following areas:
A. Decreases to poverty indices;
B. Access to Healthcare;
C. Support to agriculture;
D. Educational attainment;
E. Macroeconomic Improvements; and
F. Infrastructure

Chronicling Socioeconomic Achievements of the Unity Party Government 2006-2011 Page 12
Challenges to Dissemination of Information
The challenge in using the information within these pages will be the form, content, context and method of
communication to voting blocs. The form of communication must be dictated by the targeted audience. If
properly communicated to the electorate in a manner and language they understand, it could reap significant
political capital for the Unity Party and its candidates.
Baseline 2006: Effects of War and Bad Governance
Progress in socioeconomic development over the last six years cannot be fully appreciated without an
understanding of the dire post war circumstances 2006. Due to effects of the civil conflict, the country had been
reduced to ruins and its population was among the poorest on the planet with all social indicators at the bottom
of the Human Development Index (HDI). At the beginning of 2006, Liberia was near the bottom of the HDI, but
by 2009, it had jumped ahead of countries like Mozambique and Ethiopia to 169th place out of 182 in just under
three years1
Development Context
.
Recent progress under the Administration of Madam Ellen Johnson Sirleaf must also be viewed within the
development context reviewing both systemic and dynamic factors. The systemic factors consists of lingering
1 United Nations Development Program Human Development Report 2009

Chronicling Socioeconomic Achievements of the Unity Party Government 2006-2011 Page 13
effects of the country’s long years of conflict which eroded governance structures, impeded the rule of law, broke
down culture and tradition (Archibald and Mulbah, 2008)2
Figure 1: Pre and post conflict (1970-2008) Decline and Growth in per capita GDP in Liberia
Source: World Development Indicators
, and destroyed institutions and the national economy.
The dynamic factors which constrained or slowed progress toward accelerated socioeconomic development consist largely of exogenous ones, such as the food and fuel crisis of mid 2008, and the global financial crisis which culminated into a credit meltdown in the world’s financial system in the latter part of the same year.
2 National Conflict Mapping Study

Chronicling Socioeconomic Achievements of the Unity Party Government 2006-2011 Page 14
However, with the implementation of sound macroeconomic policies, which will be enumerated in details within these pages, Liberia managed to continue on a growth trajectory with increases in GDP over the crisis period.
Real GDP Growth (Percentage Point)
2006-2007 9.4 2007-2008 7.1 2008-2009 4.6 2009-2010 7.7 Source: Ministry of Finance
Economic Collapse
Liberia’s GDP per capita, a measurement of the value of goods and services produced in the country divided by
the total headcount had been sliding downhill since the late 1970’s, but the decline was dramatically more
pronounced during the conflict years: 1989-2003. Liberia’s GDP per capita declined by more than 90 percent
over a thirty year period and by 2006, it was well below two hundred United States dollars3
Increased Poverty
.
With the massive collapse in personal income, poverty indices deteriorated. At the end of 2003, the proportion
of Liberia’s population living on less than a dollar a day had reached 76.24
3 World Development Indicators 4 UN Human Development Report 2004
percent, with all indicators of poverty
Chronicling Socioeconomic Achievements of the Unity Party Government 2006-2011 Page 15
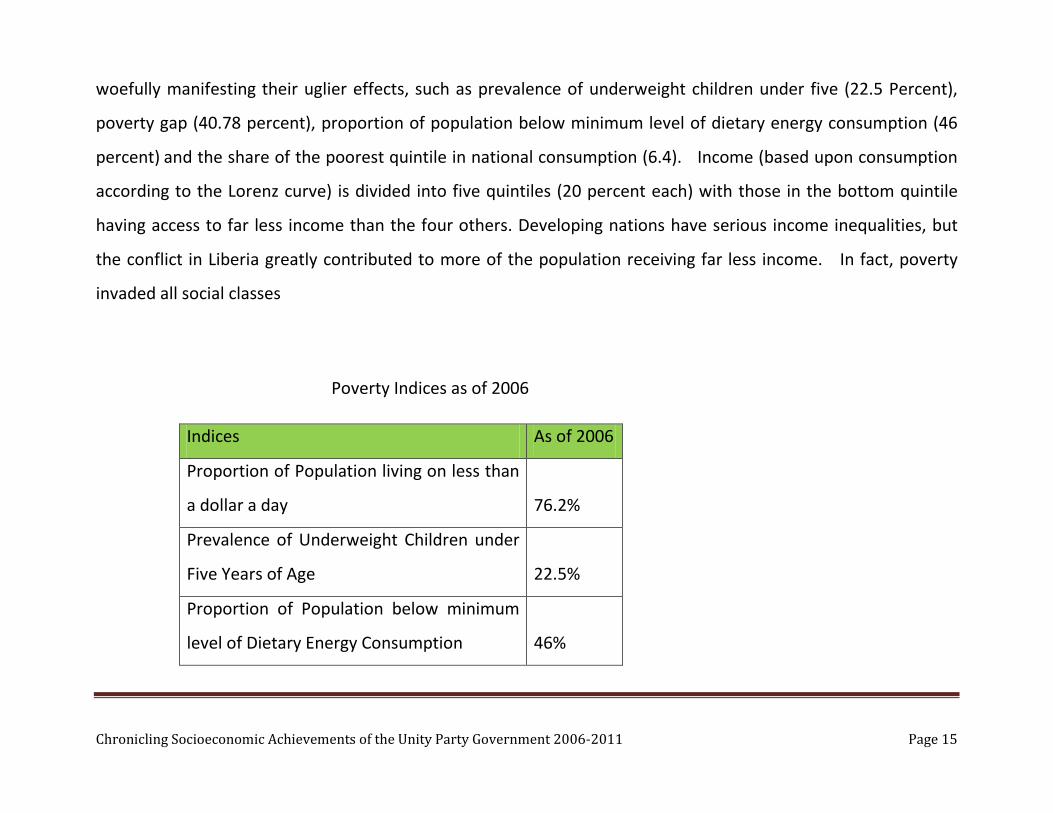
woefully manifesting their uglier effects, such as prevalence of underweight children under five (22.5 Percent),
poverty gap (40.78 percent), proportion of population below minimum level of dietary energy consumption (46
percent) and the share of the poorest quintile in national consumption (6.4). Income (based upon consumption
according to the Lorenz curve) is divided into five quintiles (20 percent each) with those in the bottom quintile
having access to far less income than the four others. Developing nations have serious income inequalities, but
the conflict in Liberia greatly contributed to more of the population receiving far less income. In fact, poverty
invaded all social classes
Poverty Indices as of 2006
Indices As of 2006
Proportion of Population living on less than
a dollar a day
76.2%
Prevalence of Underweight Children under
Five Years of Age
22.5%
Proportion of Population below minimum
level of Dietary Energy Consumption
46%

Chronicling Socioeconomic Achievements of the Unity Party Government 2006-2011 Page 16
Poverty Gap 40.78%
Share of Poorest Quintile in National
Consumption
6.4%
Sources: 2000: World Bank Database, 2004: Liberia MDG Report 2008: CWIQ
The universal standard is to determine what percentage of the population carries the largest share of income or
national consumption. In Liberia, circa 2006, far less than 20 percent of the population had more than 80 percent
of total income. In fact, the poorest 20 percent of the population only shared 6.45
Demographics of Poverty and Low Income
percent of total consumption.
The accession to power of the Unity Party in 2006 put the grave problems of underdevelopment and societal
dysfunctions into the palms of Presdient Ellen Johnson Sirleaf. The challenges were many, but too was the
resolve to dramatically alter the misfortunes of Liberians. Thus, the Unity Party Government realized it had
inherited a country, where most of its population had been reduced to low socioeconomic status, with near zero
skills base, low educational attainment and therefore limited opportunities for advancement. With a youthful
5 Liberia 2010 Millennium Development Goals (MDG) Report

Chronicling Socioeconomic Achievements of the Unity Party Government 2006-2011 Page 17
population mostly under 30 years of age6
Effects on Health and Education Indicators due to Population Displacement
, it meant that the majority of those in the bottom of the income scale
were impatient youths, with a significant number being ex-combatants.
Massive displacement of the population occurred during the conflict. It is estimated that more than three
quarters of the country’s citizens were displaced internally or externally. According to World Vision Policy
Advisor, Rory E. Anderson, in testimony to the US congress, said that 700,000 of the country’s population fled to
neighboring countries, while more than a million were displaced internally. The population shifts that occurred
effectively depopulated some counties and increased urbanization. The Monrovia, Kakata, Gbarnga, Ganta,
Zwedru, Fishtown, Pleebo, Harper corridor increased in population dramatically, while essentially decreasing the
number of the country’s productive farmers with devastating effects on rural economies. Thus rural poverty
increased substantially more than urban, and reflected other socioeconomic indicators, such as disparity in access
to health, education and governance structures.7
6 National Population and Housing Census 2008 7 Core Welfare Indicator Questionnaire (CWIQ) 2007
Light, water and security in urban centers were effectively
nonexistent and the population increases especially in Monrovia, the seat of government put severe pressures on
social services.

Chronicling Socioeconomic Achievements of the Unity Party Government 2006-2011 Page 18
With a fall in personal income, educational attainment suffered. Liberia’s literacy rate, which had been trending
upwards during most of the 70’s stagnated. 80 percent8
Basic health care evaporated, except for minimal care provided by mostly nongovernmental organizations
(NGOs). At the beginning of 2006 most Liberians did not have access to basic health care. During the war years,
health indicators declined due to the massive outward displacement of trained health workers, who sought
refuge in neighboring countries and further abroad. Most health centers were destroyed. Resultantly the ratio of
doctors to patients declined; infant mortality soared; and maternal mortality sky rocketed to 994 out of 100,000
births
of the country’s educational institutions were destroyed
during the war, resulting in limited spaces for school age children. School dropout rates soared. Gender disparity
ensued, increasing the rates at which girls dropped out of school, mainly due to tradition, teen pregnancy and
general economic hardship.
9
Destroyed Infrastructure
.
Liberia’s basic infrastructure was almost completely destroyed. The country’s hydroelectric dam at Mount Coffee
was reduced to ruins; Liberia’s telecommunications network of fixed telephony was destroyed; large swathe of
the country’s rural road network became forest areas; urban paved roads were reduced to patches of holes. As a
8 Education Sector Plan 2010-2020 9 Liberia Demographic Health Survey 2007

Chronicling Socioeconomic Achievements of the Unity Party Government 2006-2011 Page 19
result of the country’s poor infrastructure, the general economy suffered and rural farmers could not get their
products to markets.
2006-2011 and Beyond: Pro-Growth Strategies for Socioeconomic Development
The Government of Madam Ellen Johnson Sirleaf was challenged by the enormity of the problems it faced in January of 2006. Yet the President resolved to move forward in a methodical way. In order to attack the vast array of challenges, it would be prudent to set strategic goals with clear and quantifiable bench marks. The government realized that appreciable progress in the lives of people must be accomplished by plans, and then by gathering both domestic and international support, instituting effective short, medium and long term goals and aggressively leading the nation.
As a means of achieving results through the institution of quick impact methods, the government immediately launched the 150 Day Action Plan, as a precursor to the larger and more detailed Interim Poverty Reduction Strategy (iPRS). The 150 Day Action Plan was meant to set the tone of comprehensive strategies for socioeconomic development. The 150 Day Action Plan provided a list of deliverables based upon the most urgent and vexing challenges facing the new administration:
• Provide support to the police and security forces; • Compensate former Armed Forces of Liberia (AFL) soldiers; • Create a sustainable package of compensation to ex-combatants; • Begin the process to recruit and train 2000 new soldiers of the AFL; • Extend coverage of small arms collection;

Chronicling Socioeconomic Achievements of the Unity Party Government 2006-2011 Page 20
• Cancel forest concession illegally granted during the regime of Charles Taylor; • Renegotiate concession agreements granted during the National Transitional Government of Liberia; • Establish sound financial management and budgeting ahead of the 2006/2007 budget; • Strengthen management of the Central Bank
The 150 day Action Plan was hugely successful and led to the launching of the iPRS in July of 2006. The government outlined four priority areas under the Liberia Reconstruction Development Committee (LRDC):
1. Enhancing national security; 2. Revitalizing economic growth; 3. Strengthening governance and the rule of law 4. Rehabilitating infrastructure and proving basic services
The priority areas of the iPRS would be accomplished by:
a) Building constructive partnerships; b) Ensuring effective mobilization and use of resources; c) Monitoring and evaluating the strategy implementation process; and d) Managing potential risks
The iPRS lasted for two years and was integrated into the medium term plan of the Poverty Reduction Strategy (PRS) with essentially the same pillars, but with more detailed goals. Thus, the strategic goals of the administration from its inception in January of 2006 had been essentially the same: secure the physical environment; revitalize the economy; improve governance and the rule of law; and rehabilitate infrastructure and provide essential services all with the singular motive to attack the high level of abject poverty in the country.

Chronicling Socioeconomic Achievements of the Unity Party Government 2006-2011 Page 21
Thus, if the government is to be graded upon its achievements or lack thereof over the last 6 years, the pillars of the PRS, which are broadly aligned to the Millennium Development Goals (MDGs) must be examined to determine the level of progress. The rest of this document will chronicle the major quantifiable socioeconomic achievements based upon the strategic designs of the Unity Party Government from January 2006 to the present.
Strategic Interventions in Poverty Reduction
Poverty is multidimensional. It is responsible for ill health, lack of educational attainment, social dysfunctions and ultimately determines the level of peace and stability in a nation. The administration took cognizance of the multidimensional nature of poverty and its many negative consequences when it took over the reins of power in January of 2006. Its initial 150 Day Action Plan, iPRS and the expanded PRS were all designed to attack poverty in all of its dimensions so as to protect the nation from imploding. The peace the country enjoys is highly susceptible to negative influences if poverty is allowed to linger. The administration’s strategy of improving security within the country’s borders, maintaining peace with neighboring countries, and aggressively courting partnerships with the international community provided the atmosphere for economic growth and development. Domestic capital formation and the attraction of foreign direct investments (FDI) were prioritized as any development agenda had to be private sector driven with the prime objective of supporting SMEs which will create jobs, increase income and reduce poverty.
The strategy paid handsome dividends. In addition to improved governance, constructive engagement of international partners, aggressive pursuit of debt forgiveness through the Heavily Indebted Poor Country Initiative (HIPC), a pathway of sustainable economic development that would lead to revitalization of the nation’s

Chronicling Socioeconomic Achievements of the Unity Party Government 2006-2011 Page 22
tattered economy was constructed. That pathway is the foundation that is leading to the irreversible decline in poverty and deprivation.
Proof that Poverty is Declining Amidst Grave Challenges
Poverty is declining in Liberia, but at rates dictated by both domestic and exogenous factors. In 2006 when the UP Government came to power, the proportion of population living below the poverty line was 76.2 percent as per indications from the World Bank Database. Up to date baseline studies to determine the level of socioeconomic development were mostly nonexistent due to data challenges. In order to determine the baseline of socioeconomic development by gathering and interpreting data, two major scientific surveys were conducted: The Core Welfare Indicator Questionnaire (CWIQ) at the end of 2007 and the Liberia Demographic Health Survey (LDHS) over the same period. The CWIQ discovered that consumption poverty had declined to 63.810 percent of the population from the 76.2 percent from earlier established sources before democratic governance. That is, the proportion of population living on less than a dollar a day at purchasing power parity (PPP) had decreased substantially. It showed a decline in consumption poverty of 16 percent, which can be largely attributed to postwar democratic governance and sound macroeconomic policies.
Measurable Decrease in Poverty Proportion of Population Living on less than a Dollar at PPP
10 CWIQ 2007

Chronicling Socioeconomic Achievements of the Unity Party Government 2006-2011 Page 23
Period Prior to 2006 End of 2007 76.2 Percent 63.8 Percent
CCNA, CWIQ
The CWIQ measured consumption poverty rather than income. According to the CWIQ, the experts “focused on consumption (per equivalent adult) rather than income, for two reasons. First, consumption is better measured in household surveys than income, especially since net income is difficult to measure where most of the population works in the informal sector. Second, consumption is a better indicator than income of welfare and a household’s standard of living”.11
Although the decline was impressive, the rate of poverty in Liberia at the end of 2007 still left 1.7 million people living in poverty with 1.3 million (48 percent of the population) living in abject poverty.
12
Exogenous Factors Inhibiting Growth and Development
The sheer number of people living in abject poverty, no matter how impressive a decline from prior periods made for a more determined and aggressive approach to tackling the multi dimensions of poverty.
In 2008, Liberia faced significant challenges to growth and development. The economy grew only at a modest 4.6 percent due to exogenous factors. In the middle of 2008, there was a global food and fuel crisis brought about by declining agricultural outputs in China, India and most of South East Asia. The fuel crisis was propelled by increasing prices unrelated to economic growth, purely from speculators. Later that year, the housing bubble in the United States burst with cataclysmic consequences for the global economy. From Iceland to Ireland, Greece to Spain, capital markets reeled from a liquidity crunch that had not been seen in the global economy since the 11 CWIQ 2007 12 CWIQ 2007

Chronicling Socioeconomic Achievements of the Unity Party Government 2006-2011 Page 24
great depression. Stock markets lost hundreds of billions of dollars in capitalization. The credit crunch froze liquidity to consumers in the United States and caused global aggregate demand to dive to levels unseen in generations.
The impact of the global financial crisis on Liberia was frightening. Although the country’s financial sector was not connected to the global system in any significant manner (absence of holdings in debt or equity from abroad), yet the drop in aggregate demand affected Liberian exports, with prices dropping precipitously. Rubber, a commodity that is responsible for 80 percent of export earnings saw prices halved, and investments in the country’s extractive industries, principally iron ore were postponed. Inward remittances dropped. If not for sound macroeconomic policies to help absorb the shock of the global financial crisis, the economy would have contracted. The government had to find creative means of dealing with reduced revenues.
According to the ILO Rapid Assessment of the Global Economic Crisis on Liberia (Heintz, 2009), a survey of employers found that most had planned or lay off more than 20 percent of their work force. The Assessment also found that hundreds of thousands of workers in the informal sector would be affected in the long term, and 60,000 small holder farmers in the rubber industry had their livelihoods at risk. In large enterprises, the survey concluded that workers in the rubber and iron ore concessions would be subjected to massive layoffs.
According to the Assessment, there would be other broad ranging consequences including socioeconomic indicators, such as poverty levels and educational attainment. The Assessment stated that “on average, businesses interviewed have reported about a 20 percent decrease in turnover from the previous year. For small scale enterprises and informal workers, many of which operate in the service sector catering to domestic markets, the fall in demand will decrease earnings and productivity. This decline in the domestic market will

Chronicling Socioeconomic Achievements of the Unity Party Government 2006-2011 Page 25
directly affect many own-accounts and contributing family workers in terms of their contributions to household incomes and family well-being.”13
13 ILO Rapid Assessment of the Global Economic Crisis on Liberia (2009)
Based upon the circumstances from the global financial crisis, Liberia’s projected growth rates, which relied upon rapid economic revitalization as envisioned in the PRS had to be revised, with the attendant effects on socioeconomic indicators. Fortuitously, most of the negative effects of the global financial crisis did not linger much beyond 2009, and respectable growth rates returned, but not before impacting the country’s development agenda, which was to achieve the MDGs in 2015. Yet still, the global economy has not recovered fully, and some economists are predicting a “double dip” recession, coming on what is euphemistically called a “jobless recovery” which could impact Liberia’s growth and development. Remarkably, with the challenges of the global financial crisis, climate change, low absorptive capacity, yet the competitive advantages of Liberia, coupled with improved governance have made economic growth and development sustained over the last three years and caused more improvements in poverty indices. According to raw figures from the latest CWIQ, Liberia’s poverty rate as a measure of consumption in addition to multidimensional attributes has further declined to 56.6 percent, which is the proportion of population living on less than US$1.25 a day, based upon purchasing power parity, adjusted for inflation! This is remarkable considering the challenges mentioned. Therefore in absolute terms, poverty has declined from a high of 76.2 percent at the end of 2005 to a level of 56.6 percent in 2011, which is a 25 percent decrease.

Chronicling Socioeconomic Achievements of the Unity Party Government 2006-2011 Page 26
76.263.8 56.6
020406080
100
2006 2007 2011
Proportion of Population Living Below Poverty Line2006-2011
Sources: World Bank Indicators, LDHS, CWIQ The decline of poverty in Liberia during the last 5 ½ years, though impressive must not be taken as a victory over the insidiousness of poverty. Liberia still is largely an impoverished country, and more needs to be done to make an appreciable dent, but the Unity Party Government has proved that with sound macroeconomic policies, good governance and the rule of law, a public-private partnership can tackle poverty and make substantial gains. Major obstacles to poverty reduction persist: the effects of climate change, structure of the Liberian economy, lack of basic infrastructure, instability in the sub-region and low absorptive capacity. The Liberian economy is growing slower than expected due to inherited structural problems, such as the composition of output and level of absorptive capacity in addition to the slowness of aggregate demand in the global economy for Liberian goods and services. The country still relies heavily on the export of primary products with rubber accounting for more than 80 percent. The war induced low skills base of the country’s labor force and the damage to infrastructure which has reduced productive capacity makes accelerating growth a major challenge under any circumstance. In order for most Liberians to feel the effects of poverty reduction, more needs to be accomplished.

Chronicling Socioeconomic Achievements of the Unity Party Government 2006-2011 Page 27
The economy must grow at double digit rates for sustained periods to make an appreciable dent in abject poverty. That will happen in the next few years when revitalization of the economy, which began by strategic moves such as economic liberalization, improved governance, rationalization of the mineral industry, support to agriculture, robust incentives to the SME sector, and an attractive investment code begin to bear fruits. According to the IMF, growth rates for Liberia from 2012-2017 are predicted to be a combined 67 percent, which will further reduce poverty provided the country continues on the current pathway to sustainable economic development and growth.
Proof that Healthcare is Improving
Due to the civil crisis and bad governance the state of healthcare in Liberia had been nothing short of horrific. However since 2006, although challenged by inadequate manpower and equipment, there have been remarkable improvements. For example, while still high, the under-5 child mortality rate has declined from 220 per 1,000 live births in 1986 to 110 per 1,000 live births in 2007. Malaria prevalence in children has also declined from 64 to 32 percent and access to prompt and effective treatment for malaria has increased. However, the maternal mortality rate remains very high (994 per 100,000), full immunization coverage remains inadequate (51 percent) and the HIV prevalence (1.5 percent) poses a potential threat to the population (3,476,608), of which 52 percent are 19 years of age or younger and 47 percent live in urban areas. The 2007 Health Policy commits the Government of Liberia to increasing financing for healthcare at the highest level possible taking into consideration its revenues and competing interest. As a result of that policy Government health expenditure has increased from U$12,352,584 in the 2006/2007 budget to USD$32,480,992 in the 2010/2011 budget. That is an increase of more than 262 percent over five years

Chronicling Socioeconomic Achievements of the Unity Party Government 2006-2011 Page 28
Government Health Expenditure 2006-2011
12,352,58418,705,242 21,406,608
27,322,03032,480,992
0
5,000,000
10,000,000
15,000,000
20,000,000
25,000,000
30,000,000
35,000,000
FY2006/07 FY2007/08 FY2008/09 FY2009/10 FY2010/11
Appropriations
Since 2006, there has been measurable progress in the country’s health care delivery system. Strong budgetary support and international engagement via donor support have all contributed to the improvements in health care. No one can deny that Liberians still face dire health consequences due to years of war, but it cannot be said that the Government has not committed substantive financial and human resources to improve the health of Liberians, which is causing significant improvements in healthcare. IMPROVEMENTS IN HEALTHCARE

Chronicling Socioeconomic Achievements of the Unity Party Government 2006-2011 Page 29
INDICATORS 2006 2011 %Improvement SOURCE Birth attended by skilled attendant
46
64.7
41%
LDHS, MOHSW
Maternal Mortality 994 880 11.4% LDHS, NPHC14 Home Births 63% 36.1% 42% LDHS MOHSW Health Work Force 3,966 9,196 231% MOHSW Other significant achievements occurred over the period when data was available, such as infant mortality which was 144 per 1,000 births prewar, but has declined substantially with the reconstitution of democratic governance since 2006. The under five mortality has also declined from 220 to 110 over the same period.
Basic Package of Health Services (BPHS) In 2007 the Ministry established the Basic Package of Health Services (BPHS) with the ultimate intention of jumpstarting a health care delivery system for all Liberians. The BPHS became the cornerstone of the National Health Policy and Plan that was drafted and made operational in 2007. The BPHS established basic preventive and curative services needed to improve access and health care. By 2010, the BPHS demonstrated significant success. For the first time in many years, Liberia’s hospitals, clinics and health centers were required to provide a minimum standard of health care. In January 2010, the BPHS accreditation assessed a total of 550 government and private facilities (378 government and 172 private facilities). According to the results of the accreditation, 80.2% of the Government facilities were implementing the BPHS (defined as a score of 75% or greater) surpassing the national target by 10.2%. The 10.2% jump in the BPHS implementation is attributed to the recruitment and deployment of
14 National Population and Housing Census Data released in 2011

Chronicling Socioeconomic Achievements of the Unity Party Government 2006-2011 Page 30
additional critical health workers (for example certified midwife, Physician Assistant, Medical Doctor, etc) and the supply of basic equipment and commodities to health facilities.
306346
379
4891
172
354
437
551
0
100
200
300
400
500
600
2006 2009 2010
Health Facility Trends by Ownership
public
private
Total
Delivery and Postnatal Care (PNC)

Chronicling Socioeconomic Achievements of the Unity Party Government 2006-2011 Page 31
A total of 59,631 deliveries were registered, with home delivery accounting for 36.1%. The highest home delivery occurred in Grand Bassa (65.4%) and Grand Cape Mount (60.5%) counties. The proportion of deliveries attended by skilled personnel has increased from 46.3% in 2009 to 64.7% in 2010.
3745.3
63.863.963
54.7
36.2 36.1
0
20
40
60
80
LDHS 2007 HMIS 2008 HMIS 2009 HMIS 2010
Delivery by Locations
Institutional Home

Chronicling Socioeconomic Achievements of the Unity Party Government 2006-2011 Page 32
91
50.9 4646.3
64.7
97
0
20
40
60
80
100
120
LDHS 1986 LDHS 2000 LDHS 2007 HMIS 2009 HMIS2010 Target 2015
Births Attended by Skilled Health Workers
Curative consultation services increased over the last three years from 1,705,386 visits in 2008 to 3,132,073 visits in 2010 due to increasing number of facilities and workers since 2006.

Chronicling Socioeconomic Achievements of the Unity Party Government 2006-2011 Page 33
17053862134692
3132073
0
1000000
2000000
3000000
4000000
2008 2009 2010
Curative Consultation from 2008 -2010
Source: MOHSW As evidenced of Liberia’s commitment to improving maternal health for national development, President Ellen Johnson Sirleaf in 2010 declared maternal death a reportable medical condition in 48 hours. As a result of this mandate, regular health facilities reporting of maternal deaths commenced in July 2010.
Maternal and Child Health
Over the past two years, Liberia has made significant progress to improve maternal and child health by steadily
reducing home-based delivery. Comparative analysis of the delivery data shows 34% reduction in home delivery
from 54.7% in 2008 to 36.1% in 2010. One of the most challenging socioeconomic indicators in the Health MDGs
is the level of maternal mortality in Liberia. In 2007, it was reported to be 994 out of 100,000 births. However,

Chronicling Socioeconomic Achievements of the Unity Party Government 2006-2011 Page 34
newly released data from the National Population and Housing Census in 2008 reveals the rate is now 890, which
indicates an improvement, but substantially more must be done to achieve the MDG of lowering maternal
mortality.
Educational Attainment is Improving due to Systematic Interventions
Liberia’s education system bore the brunt of the decades of civil strife. A significant percentage of the country’s
schools were damaged and/or destroyed, causing decreases in the gross and net enrollment ratios, increasing
drop out ratios across gender, and necessitating the need for massive interventions by international non
governmental organizations (NGOs), government and the private sector. A review of the education sector at the
end of 2007, two years into the administration showed that indeed interventions were showing marked
improvements as depicted below:

Chronicling Socioeconomic Achievements of the Unity Party Government 2006-2011 Page 35
Education Indicators
Indicators 1989/2000 2001/02 2007/2008
Net enrolment ratio in primary education (%)
32.0(1989) 34.7(2001/2) 37.3
Boys 19.3 (2000) 20.3 (2002) 37.5 Girls 18.7 ( 2000) 14.5 (2002) 37.1 Gross enrolment in primary education (%)
78.0 (1989) 56.2 (2001/2) 86.3
Boys 72.9(2000) 48.5(2002) 88.0 Girls 72.5 (2000) 35.5(2002) 84.5 Primary Completion rates Literacy rates of 15-24 year olds (%)
32.9 (1989) 34.7 (2001/2) 72.4 (2007)
Male 80.3 Female 64.7
Sources: Liberia MDG Report,2004, UN Statistical Database 2006, CWIQ 2007
The administration of Madam Ellen Johnson Sirleaf made education a priority in its PRS indicating that “only
through the relevant and appropriate education of the populace can real and sustained poverty reduction be
achieved.” That was in a foreword to the “System in Transition” compilation of data from the country’s school

Chronicling Socioeconomic Achievements of the Unity Party Government 2006-2011 Page 36
system. The Government sought to determine the baseline of the country’s education system. That effort would
result in the kinds of interventions to improve the country’s crumbled educational system. By the end of 2010,
education indicators had risen with attendance levels, gross enrollment and net enrollment figures reflecting the
effects of the resources deployed into the sector:
Summary of School Statistics
2008 2010
Total Number of Students Pre-primary through Senior High School
1,265,513
1,406,659
Public 736,957 803,385
Private 224,545 271,099
Mission 150,517 190,061
Community 153,496 142,016
Junior High School (GER) 40% 48%
Junior High School (NER) 5% 7%
Senior High School (GER) 24% 30%
Senior High School ( NER) 6% 7%
Source: National School Census Reports, 2008, 2010

Chronicling Socioeconomic Achievements of the Unity Party Government 2006-2011 Page 37
Main Interventions and Programs in Education
Significant interventions have improved indicators in the education sector, although significant challenges remain. As a result, a number of important interventions and programs have been embarked upon in the last three years (2007-2010). Presented below are summaries of the key interventions that have improved the quality of education in Liberia:
The Liberia Primary Education Recovery Program (LPERP) of 2007
Following many years of civil conflicts and destruction, the Government of Liberia developed an action oriented document called the “Liberia Primary Education Recovery Program (LPREP). The program is intended to take the primary education sub-sector from an emergency status to a recovery status, after which the Ministry of Education can begin to concentrate on long term development of the subsector. Thus the three year plan was considered as the Government’s program to rebuild the education system of Liberia ensuring that all children in Liberia receive high-quality primary education for free.
The Accelerated Learning Program (ALP)
Under the ALP, the primary school curriculum is completed in three instead of the normal six years to fast track the education of students beyond the elementary school age. The ALP also seeks to provide adult learners with marketable skills.

Chronicling Socioeconomic Achievements of the Unity Party Government 2006-2011 Page 38
Infrastructure Expansion
Educational institutions in Liberia were seemingly targeted during the civil conflict. According to the National Education Sector Plan, 2010-2020, 31 percent of public and 24 percent of community schools were destroyed while 16 percent of public and community schools were permanently damaged. In order to fix the problem, the Government embarked upon a large scale rehabilitation and reconstruction of educational institutions. Under the program, three Rural Teachers Training Institute (RTTIs) have been rebuilt and refurbished as have many primary and secondary schools.
Instructional Materials Provision
When the administration of Madam Ellen Johnson Sirleaf took the reins of power in January of 2006, a baseline study completed in 2008, but with data from 200615 revealed that the ratio of textbooks to students in primary schools was estimated at 3:1. Most of the books were outdated and not written with Liberians in mind. Procurement of textbooks for the primary level took place in 2008 using Pooled Fund resources and brought the ratio down to 2:1 at the end of 2008.16
Teacher Development
According to the National School Census Report (NSCR) of 2008, 60 percent of all teachers at the primary level were untrained and only 12 percent were female. Further the report indicated that the pupil to trained teacher 15 National School Census Report 2008 16 Ministry of Education

Chronicling Socioeconomic Achievements of the Unity Party Government 2006-2011 Page 39
ratio at the primary level was 59:1. This was due to the lack of teacher training institutes during the war years. With funds from USAID and UNHCR the three RTTIs have now been rehabilitated and refurbished and were opened during the 2008/2009 school year.
Girls Education Program
In 2008, the NSCR of 2008 reported that girl’s education was lagging behind boys in a significant manner. For example it found that the Gender Parity Index (GPI, which is the ratio of girls to boys) was .088 at the primary level but only .69 at the senior high school level. This means that for every ten boys in primary school, there were nearly nine in primary school and only about seven in high schools. It indicated a high drop out rate for girls, due to tradition, teen pregnancy and economic hardship. As a result of the data, the Government of Liberia established a Girl’s Division at the Ministry of Education with the publication of a Girl’s Education Policy.
Early Childhood Development and Education Program
Due to effects of war, enrollment in pre-primary education relative to those of official primary school age is higher in Liberia than in any of the other countries in the region. However, many of those in primary school are not only above the age for pre-primary, but are also above age for primary. In order to address this problem, the Ministry of Education has established an Early Childhood Education Division that will seek to cater to the needs of these special students.

Chronicling Socioeconomic Achievements of the Unity Party Government 2006-2011 Page 40
School Health, HIV and Handicapped Students
A school Health Division to cater to the health needs of special students has been re-established and begun to make appreciable progress in dealing with the problems of special students. The unit is responsible for de-worming, hygiene, sanitation, reproductive health, skill based education and HIV/AIDS/STI prevention education.
Macroeconomic Improvements
The GOL instituted many reforms and interventions over the last six years which are promoting macroeconomic growth and stability. Key among these are:
• Reaching the completion point for debt forgiveness under the Heavily Indebted Poor Country Initiative (HIPC);
• Increased capital requirements of commercial banks from two to ten million dollars, which has resulted in strengthening the financial sector;
• Transparent auction of foreign currencies to promote exchange rate stability;
• Fiscal prudence by insisting upon a balanced budget;
• Revision of the Investment Code to improve the country’s competitive edge in the face of increased globalization; and
• Improvements of public procurement procedures to ensure transparency
Chronicling Socioeconomic Achievements of the Unity Party Government 2006-2011 Page 41
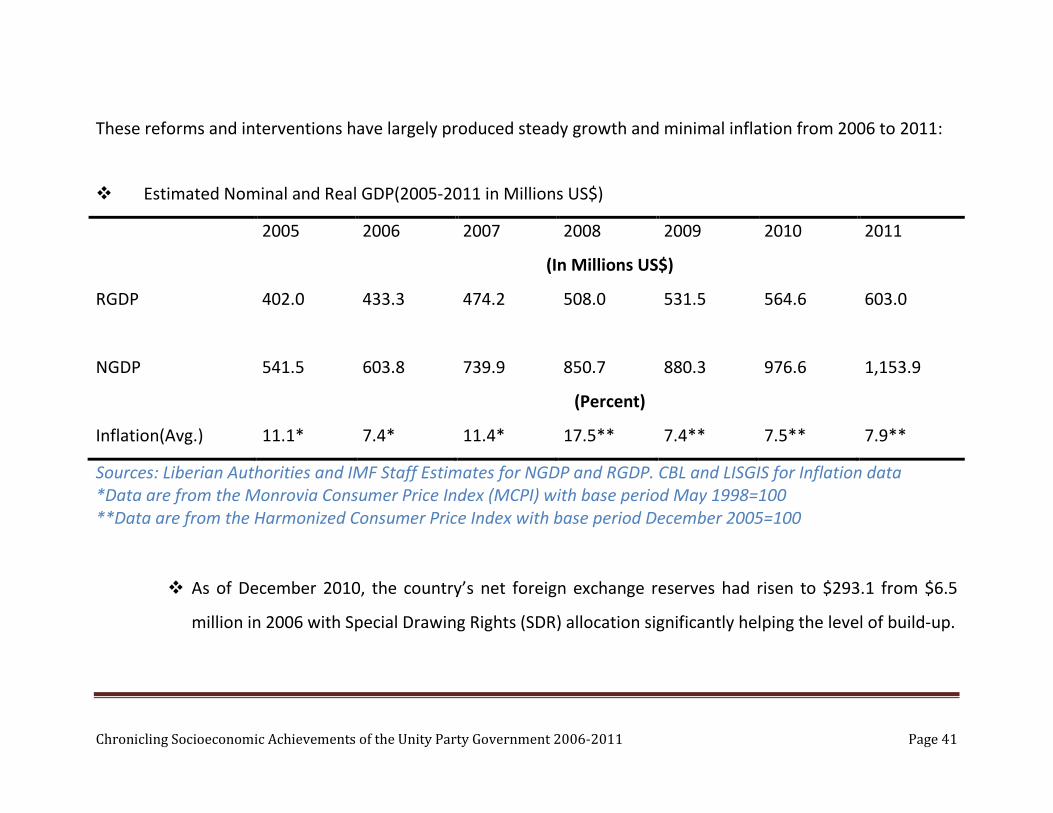
These reforms and interventions have largely produced steady growth and minimal inflation from 2006 to 2011:
Estimated Nominal and Real GDP(2005-2011 in Millions US$)
2005 2006 2007 2008 2009 2010 2011
(In Millions US$)
RGDP 402.0 433.3 474.2 508.0 531.5 564.6 603.0
NGDP 541.5 603.8 739.9 850.7 880.3 976.6 1,153.9
(Percent)
Inflation(Avg.) 11.1* 7.4* 11.4* 17.5** 7.4** 7.5** 7.9**
Sources: Liberian Authorities and IMF Staff Estimates for NGDP and RGDP. CBL and LISGIS for Inflation data *Data are from the Monrovia Consumer Price Index (MCPI) with base period May 1998=100 **Data are from the Harmonized Consumer Price Index with base period December 2005=100
As of December 2010, the country’s net foreign exchange reserves had risen to $293.1 from $6.5
million in 2006 with Special Drawing Rights (SDR) allocation significantly helping the level of build-up.

Chronicling Socioeconomic Achievements of the Unity Party Government 2006-2011 Page 42
INCREASE IN FOREIGN EXCHANGE RESERVE POSITION
2006 2011
$6.5 Million $293.1 Million
Source: CBL
Commercial banks operating in the country increased from 5 in 2006 to 9 in 2011 with bank branches rising
from 11 to 72 and banking services expanded from 4 to 9 counties during the same period. In ensuring a
safe and credible banking sector, recapitalization of banks has been significantly strengthened. The
minimum capital requirement has been increased from US$2.0 million in 2006 to US$8.0 million in 2009
with all of the banks in compliance. This amount increased to US$10.0 million at end-December 2010.
The contribution of the banking sector towards the recovery of the economy has been improving since
2006 with the ratio of total credit to nominal GDP rising from 10.0 percent in 2006 to 18.2 percent in
201017
17 Figure for total credit to the private sector is at end-September, 2010
. The introduction of new financial products, including ATMs, SMS banking, and branch banking, is
reflective of the important role financial innovation plays in banking sector development and the
deepening of the financial system.

Chronicling Socioeconomic Achievements of the Unity Party Government 2006-2011 Page 43
Despite the challenging operating environment, banks’ balance sheets have shown strong growth
compared with the recent past. The capital adequacy ratio (ratio of a bank’s capital to its risks) at end-
September 2010 stood at 27.4 percent, from 12.0 percent at end-December, 2006. The ratio of non-
performing loans to total loans declined to 25.1 percent, from 42.0 percent; total assets rising to
L$35,570.3 million, from L$9,211.0 million; and deposits increasing to L$25,409.0 million, from L$6,407.6
million during the same period. Risk management in banks has now taken the center stage with the
issuance of a comprehensive risk management framework by banks in response to the CBL’s drive to
transition from compliance- to risk-based supervision. Total employment in the banking industry rose
markedly from 531 in 2006 to 1,362 at the end of 2010.
Over the last 5 ½ years, Liberia has experienced exchange rate stability. The Liberian-US dollar exchange
rate remained broadly stable at L$71.0/US$1 for buying and L$72.0/US$1 for selling. The stability in the
exchange rate was largely influenced by CBL’s aggressive intervention in the market for foreign exchange.
During 2010, a total of US$44.6 million was sold through the auction, compared with US$31.8 million and
US$4.9 million during the same period in 2009 and 2006, respectively. The stability in the exchange rate
has contributed to the low inflation experienced over the period 2006-2011, except in 2008 due to the ,
food and fuel crisis when it approached 17 percent.

Chronicling Socioeconomic Achievements of the Unity Party Government 2006-2011 Page 44
Cognizance of the needs of the informal sector and the great potentials microfinance, the Management of
the CBL established a Microfinance Unit in 2006. Since then, the Bank continues to collaborate with foreign
partners in building capacities of financial services providers in order to significantly strengthen the
economic base of the poor and low income self-employed people, through increased access to credit and
other financial services in line with the Poverty Reduction Strategy of the Government of Liberia (GoL). The
number of microfinance institutions (MFIs) operating in the country stood at 7 in 2011, from 2 in 2006
with the number of clients rising from under 300 to 51,489 and total loan portfolio growing from US$0.25
million to US$7.9 million for the same period. Regarding a strategic developmental approach to financial
inclusion, the CBL developed a National Strategy for Financial Inclusion and a Microfinance Policy,
Regulatory and Supervisory Framework with a view to enhance the provision of financial services
(microfinance) to positively affect the lives of low income entrepreneurs. Also, the CBL has been admitted
into the Alliance of Financial Inclusion (AFI), an independent network of policy makers in developing and
emerging markets that provides its members with the tools and resources to share experiences of success
story of financial inclusion policies that are working.

Chronicling Socioeconomic Achievements of the Unity Party Government 2006-2011 Page 45
IMPROVEMENTS IN MICRO-FINANCE SECTOR
2006 2011
Number of Micro-Finance Institutions 2
7
Total Amount of Loans to Micro-Finance
Sector
USD250,000 USD$7,900,000
Number of Borrowers in Micro-Finance
Sector
300
51,489
Source: CBL
As part of its effort to improve the credit environment that will provide security to lenders and make
available finance to borrowers, including SMEs, the CBL, supported by the IFC and World Bank, sponsored a
the drafting of a Commercial Code of Liberia and the procedures and rules for the operation of a

Chronicling Socioeconomic Achievements of the Unity Party Government 2006-2011 Page 46
Commercial Court in Liberia, which were finally passed into law by the National Legislature in 2010. In
taking the credibility of the financial system a step further, the CBL has been leading the fight in Liberia
against money laundering and terrorist financing and has succeeded, through strong partner support, in
drafting a comprehensive Anti Money Laundering Bill for subsequent enactment by the National
Legislature. It is against the aforementioned that the Inter-Governmental Action Group against Money
Laundering and Terrorist Financing (GIABA) categorized Liberia as cooperating in the global fight against
money laundering and terrorist financing.
As a result of the prudent management of the economy, improved rule of law and security sector reforms, in
addition to aggressive courting of investments, FDI continues to flow at a rate unprecedented in recent history.
FDI rose from 127 million in 2007, to 272.4 million in 2008, and by the end of 2010, it had risen to more than 400
million dollars.

Chronicling Socioeconomic Achievements of the Unity Party Government 2006-2011 Page 47
Source: Ministry of Planning and Economic Affairs
Contrary to misconceptions, the rise in FDI has been across sectors in the economy. As of the end of August 2011, projected foreign investments in the country had surpassed 17 billion US dollars, with mining, forestry, and agriculture leading the rise:

Chronicling Socioeconomic Achievements of the Unity Party Government 2006-2011 Page 48
SECTOR PROJECT COUNTRY OF
ORIGIN TENURE DATE
SIGNED LOCATION INVESTMENT
SIZE
JOB CREAT
ION
Agriculture Maryland Oil Palm Plantation/Decoris Ivory Coast 33yrs 2011 Maryland $64 M
1,000
Agriculture Equatorial Palm Oil
2007 Grand Bassa $100 M
10,000
Agriculture Sime Darby Gurthrie Plantation Malaysia
2009 Bomi/Cape Mount/Gbarpolu $800 M
30,000
Agriculture Golden Veroleum/Southeast Plantations Indonesia
2010 Rivercess/Grnad Kru $1.6 B
40,000
Agriculture ADA/LAP Commercial
2007 Lofa $30 M
200
Agriculture Novel Rice
- Cape Mount $2 M
20 Agriculture Liberia Cocoa Corporation Liberia
-
$12M
Agriculture Cocopa Nimba Development Corporation Belgium
- Nimba $20M Agriculture Salala Rubber Corporation
-
Agriculture Sinoe Rubber Corporation Malaysia
- Sinoe $15M
Agriculture Liberia Agriculture Corporation Belgium
- Grand Bassa $87 M
1,000
Agriculture Cavalla Rubber Plantation Rehabilitation Ivory Coast 50yrs 2011 Maryland $78M
1,000
Total: $2.81B
83,220
Finance Liberia Enterprise Development Fund
2007 Montserrado $8 M
10
Finance UBA Bank
2008 Montserrado $8 M
100
Finance Guarantee Trust Bank
2009 Montserrado $8 M
100
Finance Access Bank
2009 Montserrado $6 M
100
Finance Global Bank/PHP
- Montserrado $8 M
100 Total: $38M

Chronicling Socioeconomic Achievements of the Unity Party Government 2006-2011 Page 49
410
Forestry 5 Timber Sale Contracts
2009 Bopolu, Bomi $20 M
500
Forestry 4 Forest Management Contracts
2010 G. Gedeh, C.Mount $60 M
2,000
Total: $80M
2,500
Hotels Libyan Holding Company/Ducor Hotel Libya
- Montserrado $40 M
300
Hotels Robert L. Johnson/Kendeja Hotel Liberia/USA
2007 Montserrado $10 M
160
Hotels Golden Gate Hotel/SKD Stadium
2008 Montserrado $8 M
100
Hotels Cape Hotel, Golden Key, Palm Springs, Royal
2006-10 Montserrado $50 M
400
Total: $108M
960
Industries BRE/Vattenfall Wood Ship Export Canada/USA 2007 Mont/Marg/Bassa $24.2 M
700
Industries Premier Flour Mill
- Montserrado $10 M
70
Industries BR Power 35MW Power Plants Canada/USA - Grand Bassa $25 M
300
Industries Liberia Materials Limited, New Cement Factory
- Montserrado $30 M 200+
Infrastructure CEMENCO New Mill
- Montserrado $20 M
100
Total: $109.2M
1,170
Infrastructure Port of Monrovia, Privatization
2010 Montserrado $100 M
250
Infrastructure VALE - BSGR/Trans Liberia Rail and Port
- Nimba/Grand Bassa/Mont $3 B
1,500
Total: $3.1B
1,750
Mining Africa Aura (Gola Konneh)
2008 Cape Mount $150 M
200
Mining AmLib (Kokoya and Cestos) USA
2010 Mont/Rivercess&Marg $150 M
200 Mining Mittal Steel (Revised Agreement) India 25yrs 2006 Bong/Nimba/Bassa $1.6 B

Chronicling Socioeconomic Achievements of the Unity Party Government 2006-2011 Page 50
3,000
Mining China Union/Bong Mines MDA China 25yrs 2009 Bong $2.6 B
3,000
Mining Elenilto/Western Cluster/ MDA Anguilla 25yrs 2011 Bomi, Cape Mt & Gbarpolu $2.6 B
2,500
Mining Putu/Severstal/ MDA Russia 25yrs 2010 Grand Gedeh $2.0 B
2,000
Mining BHP Billiton/Kitoma, Goe Fantro MDA Australia 25yrs 2010 Nimba/Rivercess $1.5B
2,500
Total: $10.2B
13,400
Petroleum Anadarko/Repsol/Oranto/Africa Petroleum/European Hydrocarbon
- Off Shore $500 M+
200
Petroleum 20 New Total Stations France
2009 Various County $20 M
1,000
Total: $520M
1,200
Grand Total: $17.24B
104,610 Source: National Investment Commission
Infrastructural Development
Infrastructural development has been a key priority of the government since its inception. Beginning with the 150 Day Action Plan up to the PRS, GOL has deployed significant resources to improve the country’s broken infrastructure. In 2006, most roads were impassable. Some had become forest areas, especially in rural Liberia. In the urban areas, previously asphalt roads had deteriorated to dirt roads. Water and electricity were non existent in all parts of the country. In order to accelerate the rebuilding of the country’s infrastructure, GOL constructively engaged multilateral institutions to support the country’s redevelopment efforts and also used tax revenues to propel the efforts. The budgetary allocation of the Ministry of Public Works was 33,282,456 million in 2010-2011.

Chronicling Socioeconomic Achievements of the Unity Party Government 2006-2011 Page 51
Budgetary allocation to the Ministry of Public Works FY2008 – FY2010
Budget year Approved allocation
FY 2007/2008 N/a
FY2008/2009 US$22,183,100.00
FY 2009/2010 US$30,854,604.00
FY 2010/2011 US$33,282,456.00
Roads and bridges infrastructure intervention progress 2008 – 2011
According to the National Transport Policy & Strategy (NTPS), published by the Government in 2009, of 6,161.5 miles of primary and secondary roads, only 45.9 miles or 7.4% was paved while 5,705.4 miles or 92.6% was unpaved. Most, if not all, of the unpaved section had depreciated due to neglect and lack of maintenance for protracted periods. The Poverty Reduction Strategy (PRS), launched in 2008, set the following 3-year implementation targets for the Ministry of Public Works: rehabilitate 100 miles of paved primary roads, 1,187 miles of primary laterite roads, 300 miles of secondary roads, 400 miles of feeder roads, 69 miles of urban paved roads and 150 miles of urban laterite roads. Together, all roads earmarked for rehabilitation by the PRS sum up to 2,206 miles or 35.6% of the damaged 6,161.5 miles.

Chronicling Socioeconomic Achievements of the Unity Party Government 2006-2011 Page 52
Roads Status of roads in Liberia as at 2008 PRS commitments: Construct,
rehabilitate and/or maintain Progress against PRS commitments as at 2011
Category Paved Laterite Totals Paved Laterite Totals Paved Laterite Totals
Primary roads 456 miles 702 miles 1,158 miles 100 miles 1,187 miles 1,320 miles 50 miles 1,500 miles 1,550 miles
Urban/neighborhood roads
14 miles 50 miles 64 miles 69 miles 150 miles 219 miles 40 miles 200 miles 240 miles
Secondary roads 0 miles 1,460 miles 1,460 miles 0 miles 300 miles 300 miles 0 miles 500 miles 500 miles
Feeder roads 0 miles 3,543 miles 3,543 miles 0 miles 400 miles 400 miles 0 miles 1,200 miles 1,200 miles
Bridges N/a Install 37 bailey bridges 28 bailey bridges installed
Over 25 RC bridges constructed
Over 20 RC box culverts installed
As of 2011, progress against PRS commitment shows that 50 miles of roads were paved in addition to more than 1,500 miles of laterite roads. Additionally, GOL paved 40 miles of neighborhood roads, and 200 miles of laterite. More than 28 bailey bridges were installed, and over 25 RC bridges constructed, while over 200 RC box culverts were also installed.

Chronicling Socioeconomic Achievements of the Unity Party Government 2006-2011 Page 53
Ministry of Public Works Five year strategic plans for roads and bridges infrastructure
The government has made it a Strategic Objective to construct and rehabilitate 2,763 miles of primary, secondary, urban and feeder roads at acceptable international standards during the period 2012 - 2016.
Road category Paved Laterite Totals
Primary roads 288 miles 875 miles 1,163 miles
Urban/neighborhood roads 50 miles 300 miles 350 miles
Secondary roads 0 miles 500 miles 500 miles
Feeder roads 0 miles 750 miles 750 miles
Totals 338 miles 2,425 2,763 miles
Bridges Install 5 remaining bailey bridges Construct 15 concrete bridges Rehabilitate 25 bridges nation-wide Maintain 125 bridges annually

Chronicling Socioeconomic Achievements of the Unity Party Government 2006-2011 Page 54
Construction companies vs. construction permits: 2007 – 2011
Year Number of registered construction companies Number of construction permits issued
2007 136 N/a
2008 194 41
2009 154 133
2010 362 66
2011 244 135
Telecommunications
Statistics submitted by major operators in Liberia revealed that there has been a tremendous increase in sector growth in terms of mobile telephony. Between 2007 and 2008, the sector experienced an increase in mobile subscribers of 45%. There was a drop in subscriber growth rate between 2008 and 2009 with the sector experiencing a 27% growth rate. However the sector bounced back and again experienced a 45% growth rate during 2010.

Chronicling Socioeconomic Achievements of the Unity Party Government 2006-2011 Page 55
MOBILE TELEPHONY SUBSCRIBERS DATA
PREPAID SUBSRCIBERS
2007 2008 2009 2010
LIBERCELL 27,332 29,159
LIBTELCO 1,800 4,463
CONMIUM 63,734 64,373 60,343 134,401
CELLCOM 201,000 282,500 363,500 639,526
LONE STAR 321,982 501,385 630,307 762,159
TOTAL PREPAID SUBSCRIBERS 586,716 851,258 1,083,282 1,569,708
Source: LTA
Total domestic traffic in minutes increased from 645,297,002 in 2007 to 1,964,275,399 at the end of 2010. The average monthly revenue on each user was USD$13.66 over the same period. These stats indicate tremendous use of telephony by the population.

Chronicling Socioeconomic Achievements of the Unity Party Government 2006-2011 Page 56
Support to Agriculture
Land use for rice and crop production has increased from 130,000 in 2006 to 190,000 hectares in 2010, according to World Bank Indicators. The agriculture sector continues to experience strong growth on account of the global demand for rubber, coffee, cocoa and palm products. In 2008, the Rubber Planters Association reported that 60,000 small holder farmers and employees were involved in rubber production. The Ministry of Agriculture continues to deploy more resources to the sector with the objective of improving food security and income.
2006/2007
National budget for agriculture sector increased from USD$642,763 in 2005/2006 to USD1.06 million in 2006/2007.
Ten metric tons of agro agro-chemicals purchased and distributed to 49,150 small farmers throughout the country.
Distributed USD 1 million assorted farming tools to farmers throughout the country to jumpstart the revitalization of the rice sub-sector.
Commenced rehabilitation of the Central Agricultural Research Institute (CARI) in Suakoko, Bong County-9 new Newrica and 4 high-yielding local rice and 19 IITA cassava cultivars introduced under the leadership of world class Liberian scientist that the government negotiated with ECOWAS to assign to the country.
19,300 farmers and 8,000 field level technicians benefitted from an integrated pest management training to combat pests and diseases.

Chronicling Socioeconomic Achievements of the Unity Party Government 2006-2011 Page 57
2007/2008
National budget increased for agriculture from 1.06 million US dollars to 3.76 million.
Held first National Agriculture Fair in 27 years in Tubmanburg, Bomi County.
Established the Central Veterinary Diagnostic Laboratory at UL, Fendell.
Distributed 2,000 metric tons of rice seeds to 31,000 new farmers around the country.
Distributed assorted farming tools to 1,000 farm families.
Draft fisheries policy developed
2008/2009
National Budget increased from USD 3.7 million to 5.47 million.
Held National Agriculture Fair in Voinjama, Lofa County.
20,000 farmers benefitted from assorted tools.
Established the first Technology Transfer Center in Lofa County enabling 95,000 farmers to have access to processing equipment, storage facilities at the center.
2009/2010
National budget for agriculture sector increased from USD5.4 million to 7 million.

Chronicling Socioeconomic Achievements of the Unity Party Government 2006-2011 Page 58
Comprehensive African Agricultural Development Program (CAADP) Compact signed with the Government of Liberia and its development partners.
Liberia Agriculture Sector Investment Program (LASIP)-the strategic framework for agricultural development in Liberia was endorsed by Government of Liberia and its development partners under the auspices of the CAADP Compact.
Constructed a US5.8 million Agriculture Technology Demonstration Center at the Central Agriculture Research Institute (CARI) under funding from the Chinese Government.
2010/2011
An outreach program to 24,300 farmers or a deliverable of 12.15 percent of the 200,000 target. Programs with the greatest impacts were the School Gardening with an average of 10,705 students in Grand Bassa, Grand Gedeh and River Gee Counties; the Farmer Yield School (FYS) with 1,500 farm students in 12 counties that exclude Maryland, Grand Kru and Nimba; Peri-urban Agricultural Development Program with 285 farmers in Montserrado County; and the Monitoring Initiative of the National Food Security Union-an output of the National Farmers’ Conference-with 450 farmers disaggregated of 30 farmers in each of the 15 counties.
New fisheries regulations gazetted into law-Government of Liberian and the World Bank (WB) and Global Environmental Facility (GEF).
Trained 30 fisheries observers.
US 24 million dollar Liberia Agriculture Sector Rehabilitation Project (ASRP) was launched in March 2010 in eight counties: Bomi, Cape Mount, Grand Bassa, Montserrado, Grand Gedeh, Grand Kru, Maryland and

Chronicling Socioeconomic Achievements of the Unity Party Government 2006-2011 Page 59
River Gee Counties. This project will benefit 19,000 households directly. Household income is expected to rise by 300 percent upon successful completion of the project. An estimated 1,620 hectares of irrigable swamps to be rehabilitated and 7,000 irrigable swamps to be designed for future development.
Summary and Conclusions
Despite tremendous challenges, Liberia is making remarkable progress under the administration of the Unity Party Government due to good governance, reinstitution of the rule of law and constructive engagement with international partners. Major socioeconomic indicators continue to rise due to the adept handling of the macro-economy through the institution of sound policy prescriptions and the implementation of poverty reduction strategies, beginning with the 150 Day Action Plan in early 2006 to the iPRS in the middle of that year, which was transformed into the larger PRS in 2008. All of the strategies were implemented after consultations with both domestic and international stakeholders.
The strategies are promoting stable and steady economic growth and development despite challenges, such as climate change which impacts agricultural development; the food and fuel crises of mid 2008, and the global economic crisis during the same year. Although Liberia’s growth rate was cut nearly in half to 4.1 percent during 2009, yet the economy has rebounded and continues to climb at an average rate of 7 percent.
As a result of the steady growth and development, socioeconomic indicators are rising. Poverty indices continue to show improvements. For example, the proportion of population living under a dollar a day at PPP has dropped from 76.2 percent in the period before 2006, to 63.8 percent in 2007, and now down to 56 percent in 2011. Poverty is multidimensional, and accordingly the decline in associated indices is also improving other socioeconomic indicators.

Chronicling Socioeconomic Achievements of the Unity Party Government 2006-2011 Page 60
School attendance has risen dramatically at all levels, with the ratio of girls to boys increasing. The numbers of trained teachers, textbook to students, gross enrollment ratios and net enrollment ratios have been improving. The improvements in education have been due to strategic approaches in addition to increased budgetary support to the sector.
Liberia’s health care system has seen dramatic improvements. With the creation of the basic package of health services (BPHS), curative consultations have risen dramatically. Maternal health is being prioritized and has resulted in the decline in the maternal mortality rate from 994 per 100,000 to 890 over the six years of the government. However, more needs to be done. Infant mortality rates have also fallen. The number of births attended by skilled health attendants has increased dramatically by more than 40 percent. The improvements have been brought about largely by deploying significant resources to the sector, increasing the number of accredited health facilities and the training of more health care professionals.
Macroeconomic stability has been the hallmark of the Unity Party led Government. Strategic interventions in the financial sector, through the implementation of sound policies, have led to the dramatic rise in foreign exchange reserves from a low of 6.5 million dollars in 2006 to 293.1 million dollars at the end of 2010. A stable exchange rate regime has accompanied the transparent open market auctions of foreign currencies, with the Liberian dollar trading at the average rate of 71 to 1 US dollar over 5 ½ years. Accordingly inflation has been at manageable levels, keeping the CPI from wide swings. Under these conditions, Liberia has attracted more than 17 billion dollars in planned foreign direct investments. The investments cover a wide range of sectors, with mining, agro forestry and financial services leading the rise.
Infrastructural development has been a key priority of the government. Although challenges remain in securing affordable energy, yet the government through the collaboration with international partners has revitalized the Liberia Electricity Corporation to the point where it is beginning to provide minimal service to consumers in

Chronicling Socioeconomic Achievements of the Unity Party Government 2006-2011 Page 61
Montserrado Country. By the end of 2012, the West African Power Pool will be providing significant amount of electricity to many parts of rural Liberia. A medium term plan for hydro power is in the works.
Many miles of paved and laterite roads have been constructed, rebuilt or repaired during the 5 ½ years of the government. The PRS goal of 100 miles of paved roads and more than 1300 miles of laterite has been mostly achieved.
The government continues to provide support to agriculture. The support has increased the number of farmland acreage under cultivation for rice and other crops from 130,000 hectares in 2006 to 190,000 in 2010. Support through the provision of extension services, such as rice seeds and crop spraying are improving the livelihood of farmers.
Mobile telephony substantially increased. From a total of 586,716 prepaid customers in 2007, the number of mobile subscribers has increased to 1,569,708. The number of Internet users are .5 percent per 100 persons, which means approximately 80,000 people use the technology in Liberia.
As a result of the tremendous improvements in the lives of Liberians, the Unity Party can boast that Liberia is a much better nation today than it was 5 ½ years ago. We are healthier, better fed, have more income, freer and a lot safer. We as a country have done so much, yet we have so much more to do to make Liberia better for all Liberians.

Chronicling Socioeconomic Achievements of the Unity Party Government 2006-2011 Page 62