Chronic Kidney Disease - A Window into Understanding Health Disparities · 2016-03-08 · Chronic...
59
Chronic Kidney Disease – A Window into Understanding Health Disparities Neil R. Powe, MD, MPH, MBA Chief of Medicine, Zuckerberg San Francisco General Hospital Constance B. Wofsy Distinguished Professor and Vice-Chair of Medicine, University of California San Francisco
Transcript of Chronic Kidney Disease - A Window into Understanding Health Disparities · 2016-03-08 · Chronic...
Chronic Kidney Disease – A Window into Understanding Health Disparities
Neil R. Powe, MD, MPH, MBA Chief of Medicine, Zuckerberg San Francisco General Hospital
Constance B. Wofsy Distinguished Professor and Vice-Chair of Medicine, University of California San Francisco

Overview • Case illustrating racial/ethnic disparities in kidney
disease • A premise about disparities as a focal point in
science and medicine • Definitions & framework for understanding
disparities • Science of disparities
– Why kidney disease occurs more often in minorities
– Glimpse of my research and others

A Patient
• Chief Complaint: 46 year old African American male presents to Emergency Room for generalized weakness, nausea and vomiting
• History of Present Illness: Increasing lower extremity edema for 2 months. Seen by private physician (primary care physician of his mother). No lab work done, but placed on furosemide. Edema improved, but worsening weakness with 15 pound weight loss over 2 months. Presented to Emergency Room with nausea and vomiting of 3 days duration
• Past Medical History: No diagnosis of kidney disease; no other significant past history (no HTN, DM, CVD)
• Family History: Diabetes and Hypertension run in family • Medications: No prescription or over the counter meds

A Patient
• Physical Examination: Chronically ill appearing young man in no acute distress
T 97.4F; HR 96; RR 16 BP 141/76; O2 Saturation: 99% (room air)
HEENT: pale conjunctiva, no icterus, no JVP lungs clear, CV exam within normal limits, abdomen
soft, nontender, nondistended, remainder of exam normal.
• Laboratory findings: Na 137, K 4.4, bicarbonate 19, chloride 90, AG 28, calcium 5.8, phos 13, BUN 240, creatinine 28
• Hospital Course: Admitted, seen by nephrology service. Temporary catheter placed, hemodialysis started on admission.

Key features
• African American patient with kidney failure • Late presentation for care • Poorly prepared for kidney failure • Urgent initiation of hemodialysis possibly
limiting optimal treatment

Premise Science on disparities …
clinical care with diverse patients… and education about disparities…
enhances all of Medicine and human health.
Learning about disparities allows the examination of complex interactions that contribute (often unequally for
different clinical problems) to human health
Biology-environment interactions
Environment-social interactions
Biology and
Genetics
Clinical, Environmental
and Occupational
Social and
Behavioral
Biology-social interactions
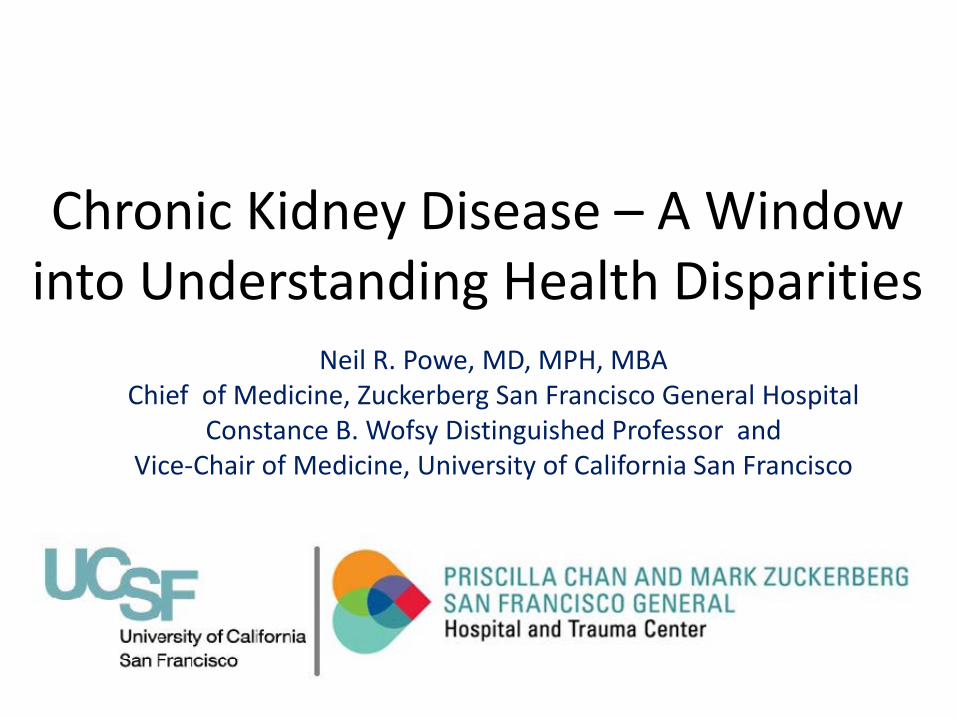
Race/Ethnic Composition United States, California and ZSFG
69 47 49.2 44
25
12
13 6 8 20
13 29 28
12 30
4 9 12 32 20
2 2 3 4 5
0%10%20%30%40%50%60%70%80%90%
100%
OtherAsian/Pacific IslanderLatinoAfrican AmericanCaucasian
ZSFG = Zuckerberg San Francisco General Hospital
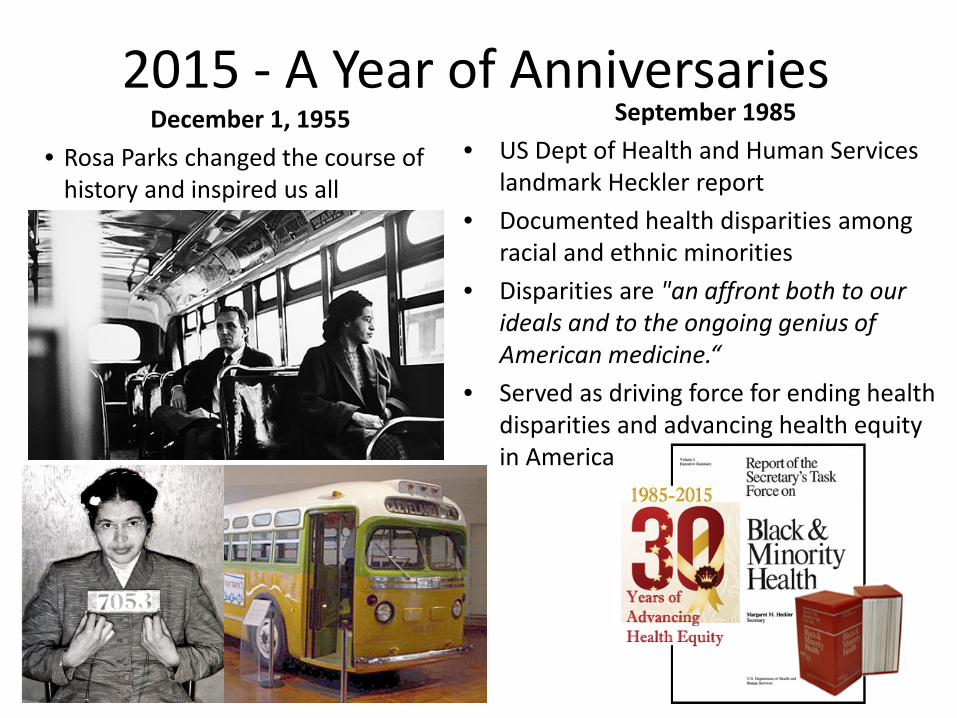
2015 - A Year of Anniversaries December 1, 1955
• Rosa Parks changed the course of history and inspired us all
September 1985 • US Dept of Health and Human Services
landmark Heckler report • Documented health disparities among
racial and ethnic minorities • Disparities are "an affront both to our
ideals and to the ongoing genius of American medicine.“
• Served as driving force for ending health disparities and advancing health equity in America
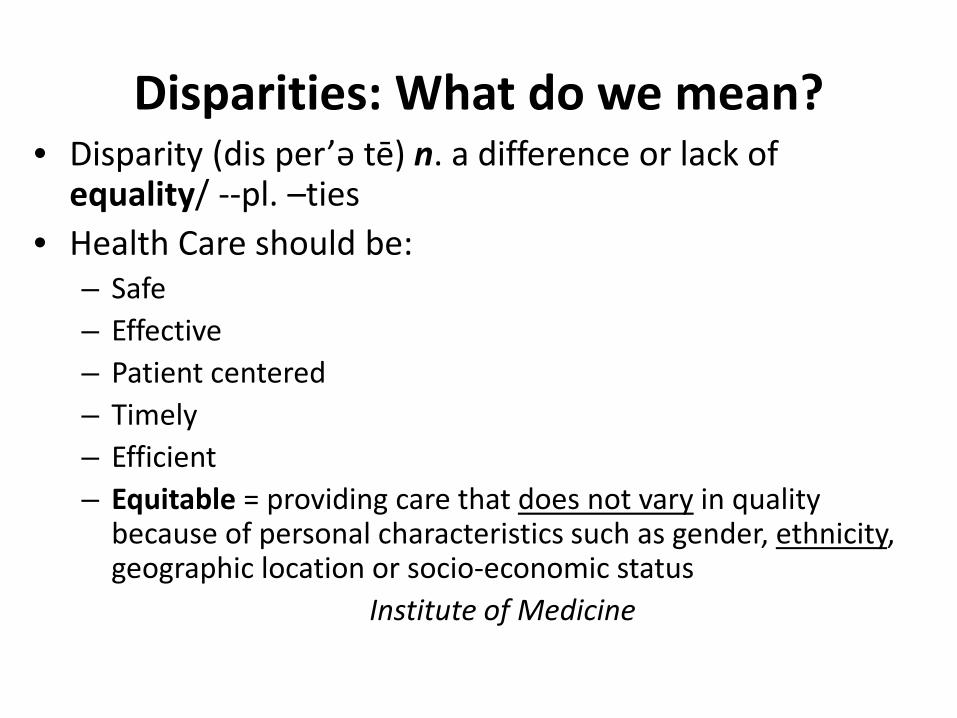
Disparities: What do we mean? • Disparity (dis per’ә tē) n. a difference or lack of
equality/ --pl. –ties • Health Care should be:
– Safe – Effective – Patient centered – Timely – Efficient – Equitable = providing care that does not vary in quality
because of personal characteristics such as gender, ethnicity, geographic location or socio-economic status
Institute of Medicine

Race: What do we mean? • Race (rās) n. a group of people united or classified
together on the basis of common history, nationality, or geographic distribution
Webster’s New World Dictionary, Revised Edition, 1996
• “a construct of human variability based on perceived differences in biology, physical appearance and behavior”,-- not a biological reality. Institute of Medicine, United States
• “Information about genetic group membership captured by notions of race is, in general, less than that obtained by making inferences of ancestry from geographic or explicit genetic data” Bamshad M.
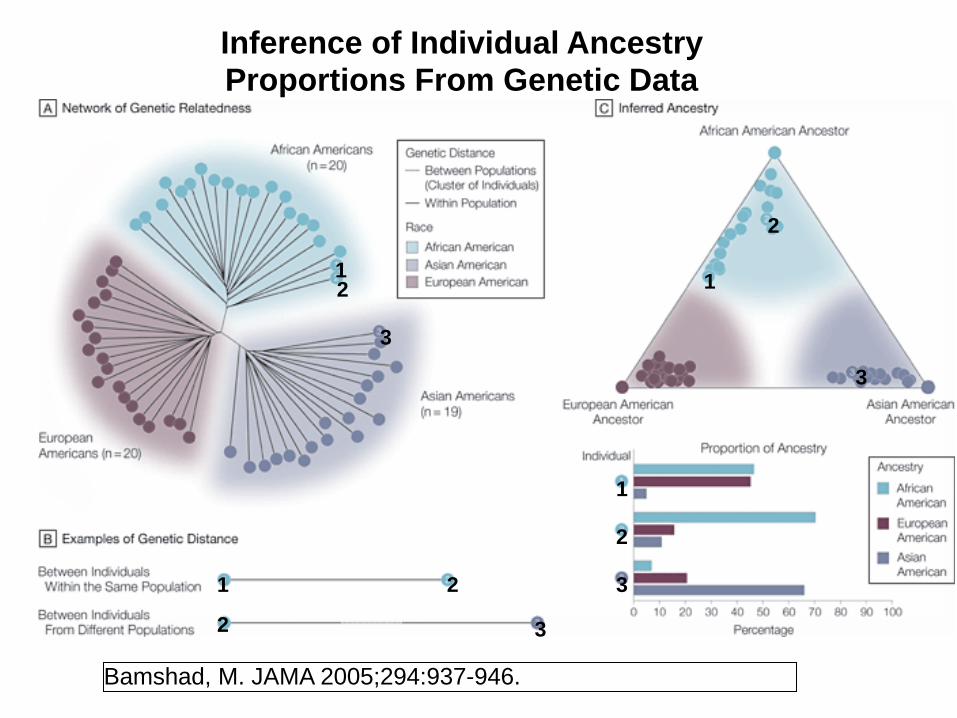
Bamshad, M. JAMA 2005;294:937-946.
Inference of Individual Ancestry Proportions From Genetic Data
1 2
2
2 1
3
3
1
2
3
1
2
3
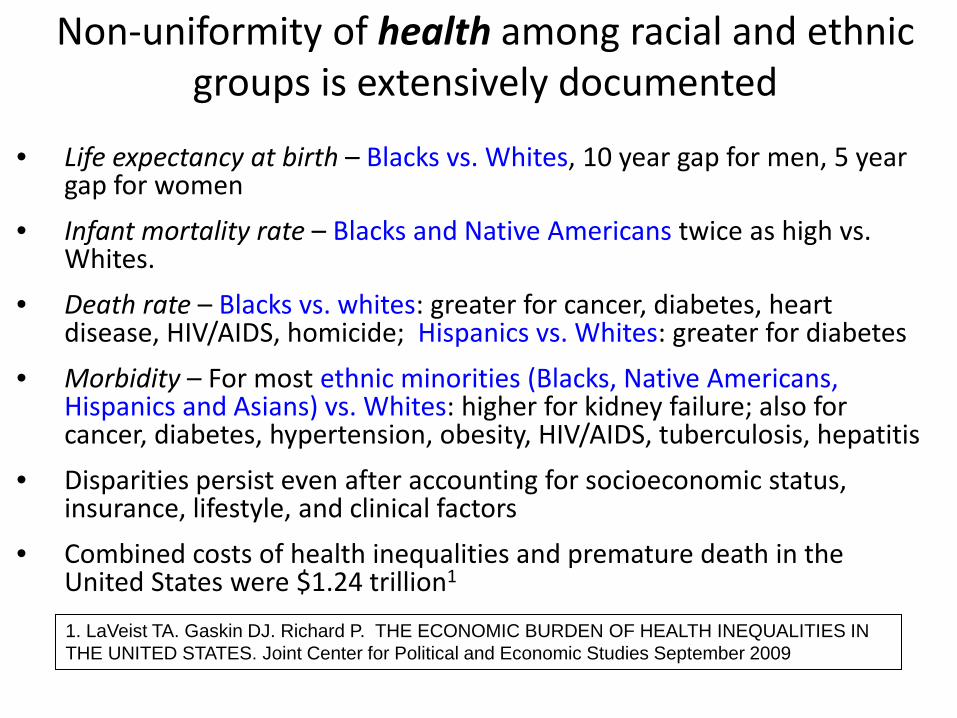
Non-uniformity of health among racial and ethnic groups is extensively documented
• Life expectancy at birth – Blacks vs. Whites, 10 year gap for men, 5 year gap for women
• Infant mortality rate – Blacks and Native Americans twice as high vs. Whites.
• Death rate – Blacks vs. whites: greater for cancer, diabetes, heart disease, HIV/AIDS, homicide; Hispanics vs. Whites: greater for diabetes
• Morbidity – For most ethnic minorities (Blacks, Native Americans, Hispanics and Asians) vs. Whites: higher for kidney failure; also for cancer, diabetes, hypertension, obesity, HIV/AIDS, tuberculosis, hepatitis
• Disparities persist even after accounting for socioeconomic status, insurance, lifestyle, and clinical factors
• Combined costs of health inequalities and premature death in the United States were $1.24 trillion1 1. LaVeist TA. Gaskin DJ. Richard P. THE ECONOMIC BURDEN OF HEALTH INEQUALITIES IN THE UNITED STATES. Joint Center for Political and Economic Studies September 2009
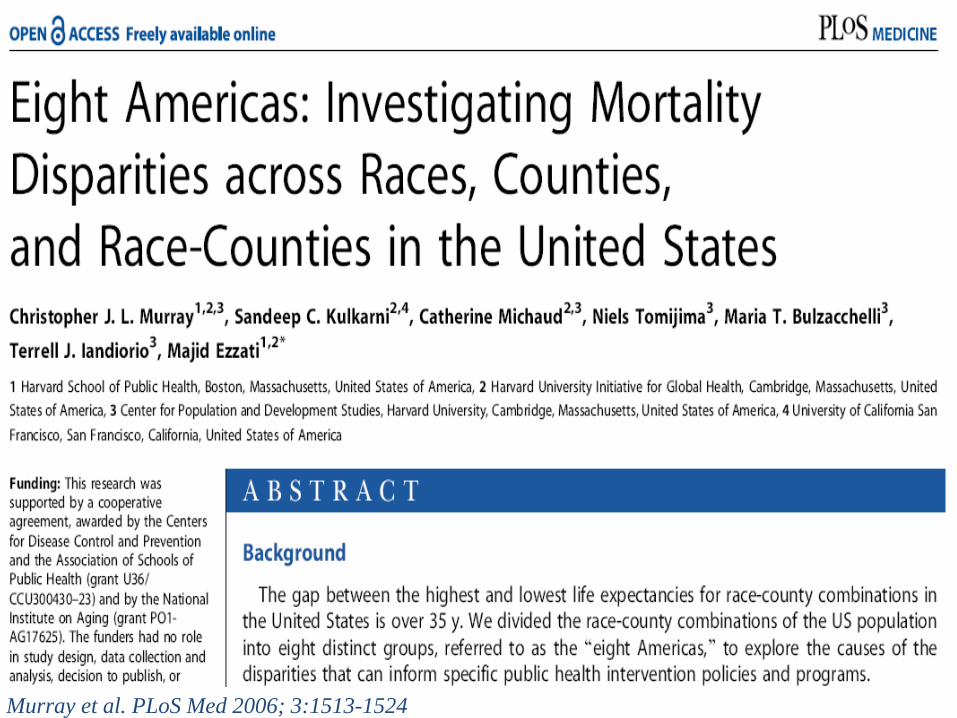
Murray et al. PLoS Med 2006; 3:1513-1524
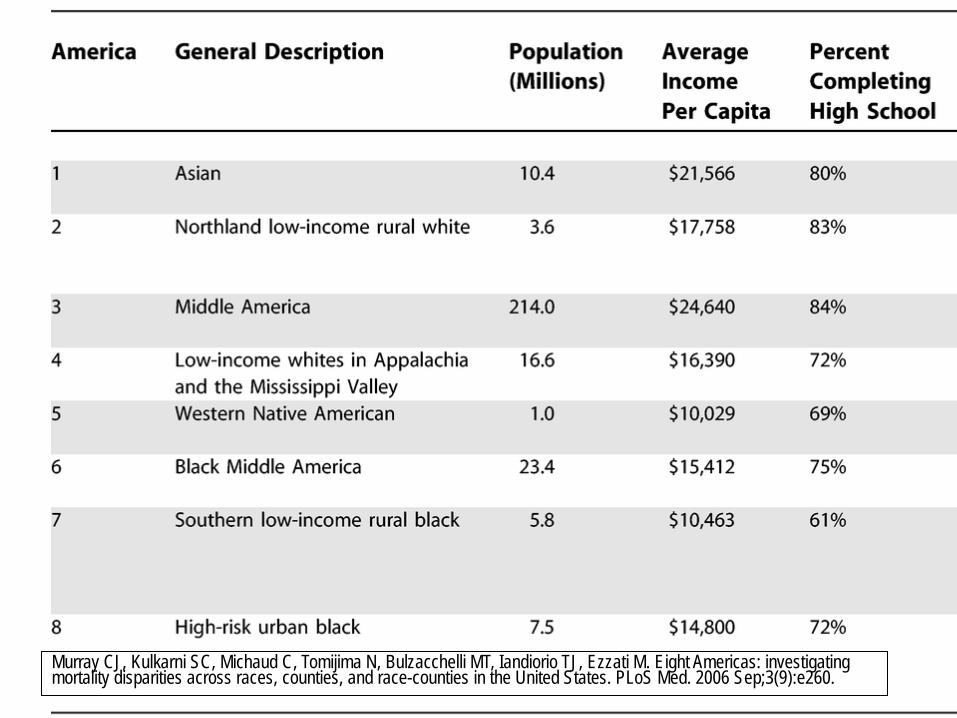
Murray CJ, Kulkarni SC, Michaud C, Tomijima N, Bulzacchelli MT, Iandiorio TJ, Ezzati M. Eight Americas: investigating mortality disparities across races, counties, and race-counties in the United States. PLoS Med. 2006 Sep;3(9):e260.
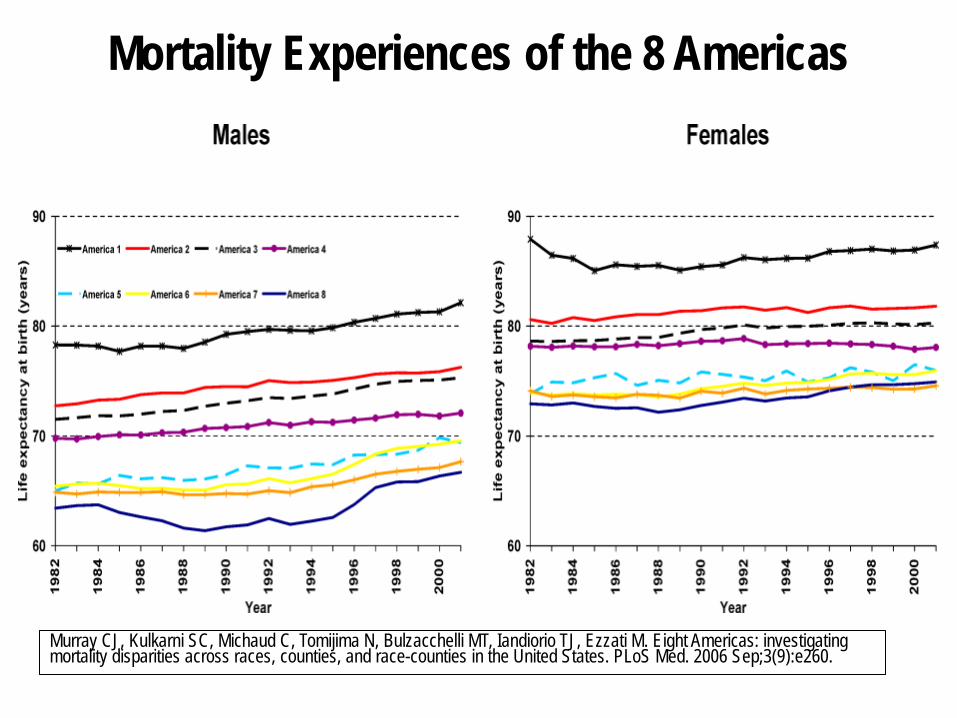
Mortality Experiences of the 8 Americas
Murray CJ, Kulkarni SC, Michaud C, Tomijima N, Bulzacchelli MT, Iandiorio TJ, Ezzati M. Eight Americas: investigating mortality disparities across races, counties, and race-counties in the United States. PLoS Med. 2006 Sep;3(9):e260.
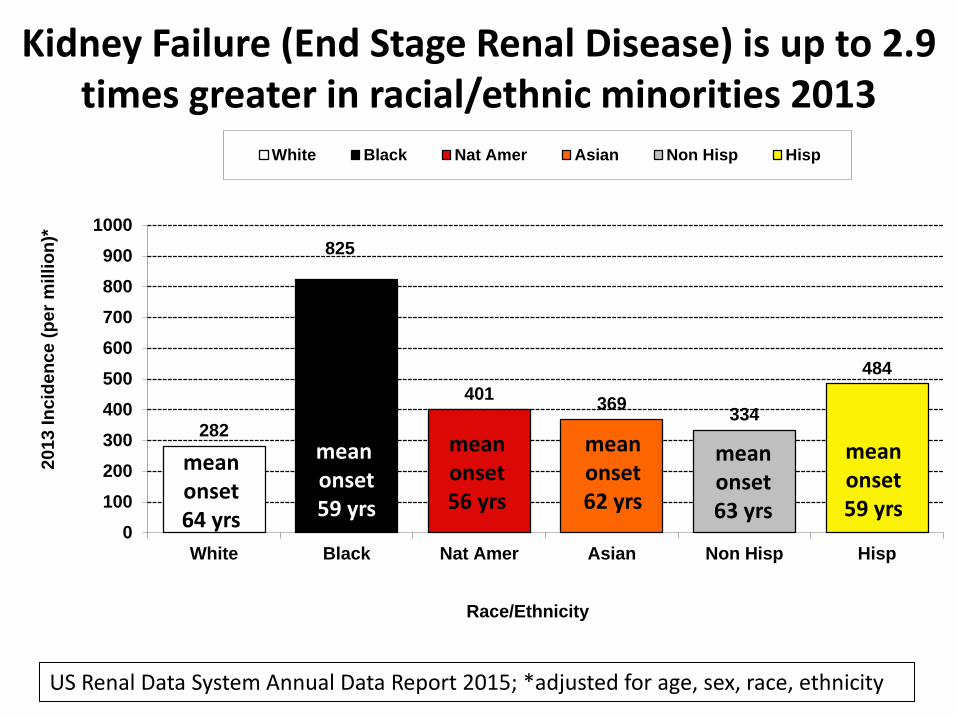
Kidney Failure (End Stage Renal Disease) is up to 2.9 times greater in racial/ethnic minorities 2013
282
825
401 369 334
484
0100200300400500600700800900
1000
White Black Nat Amer Asian Non Hisp Hisp
2013
Inci
denc
e (p
er m
illio
n)*
Race/Ethnicity
White Black Nat Amer Asian Non Hisp Hisp
US Renal Data System Annual Data Report 2015; *adjusted for age, sex, race, ethnicity
mean onset 59 yrs
mean onset 56 yrs
mean onset 62 yrs
mean onset 64 yrs
mean onset 59 yrs
mean onset 63 yrs
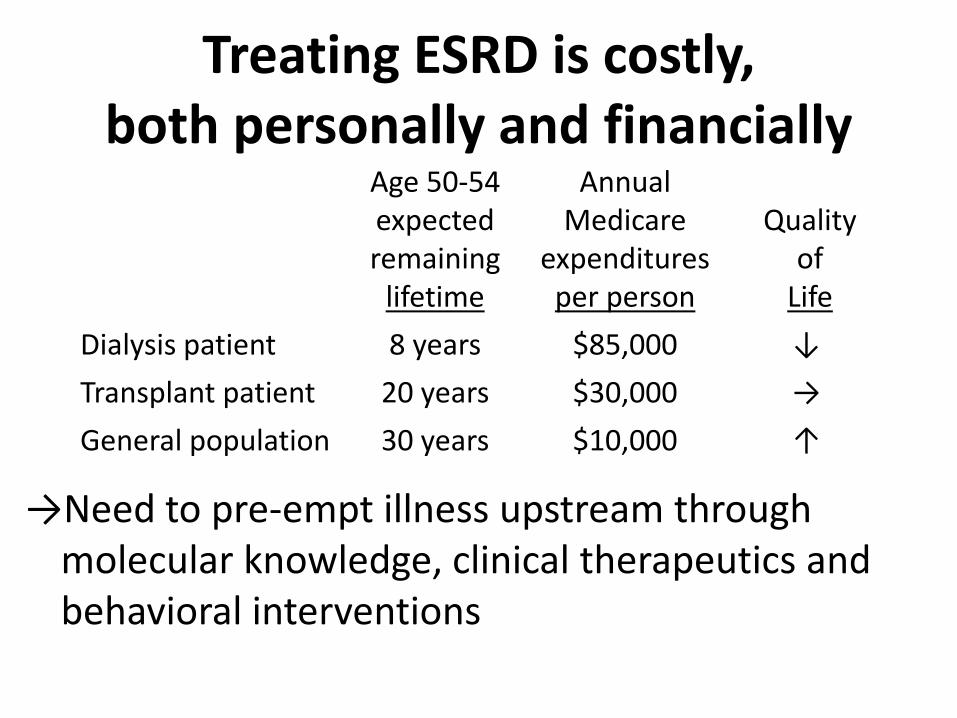
Treating ESRD is costly, both personally and financially
→Need to pre-empt illness upstream through
molecular knowledge, clinical therapeutics and behavioral interventions
Age 50-54 expected remaining
lifetime
Annual Medicare
expenditures per person
Quality
of Life
Dialysis patient 8 years $85,000 ↓ Transplant patient 20 years $30,000 → General population 30 years $10,000 ↑
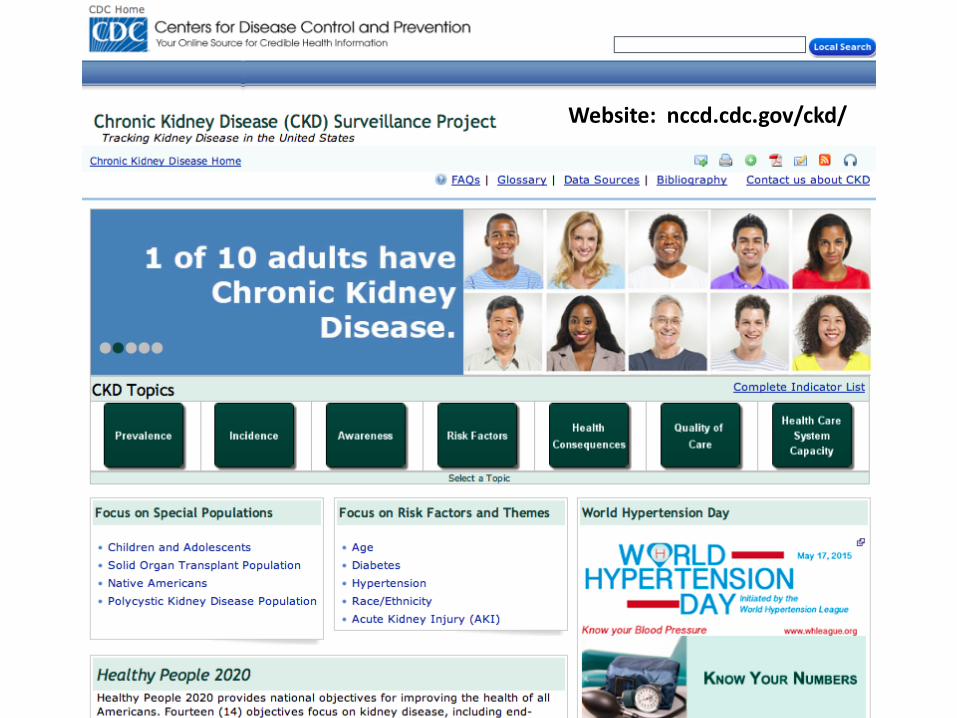
https://www.dropbox.com/s/n6ggke9g8pycgwp/Screenshot%202015-06-02%2012.45.04.png?dl=0
Website: nccd.cdc.gov/ckd/
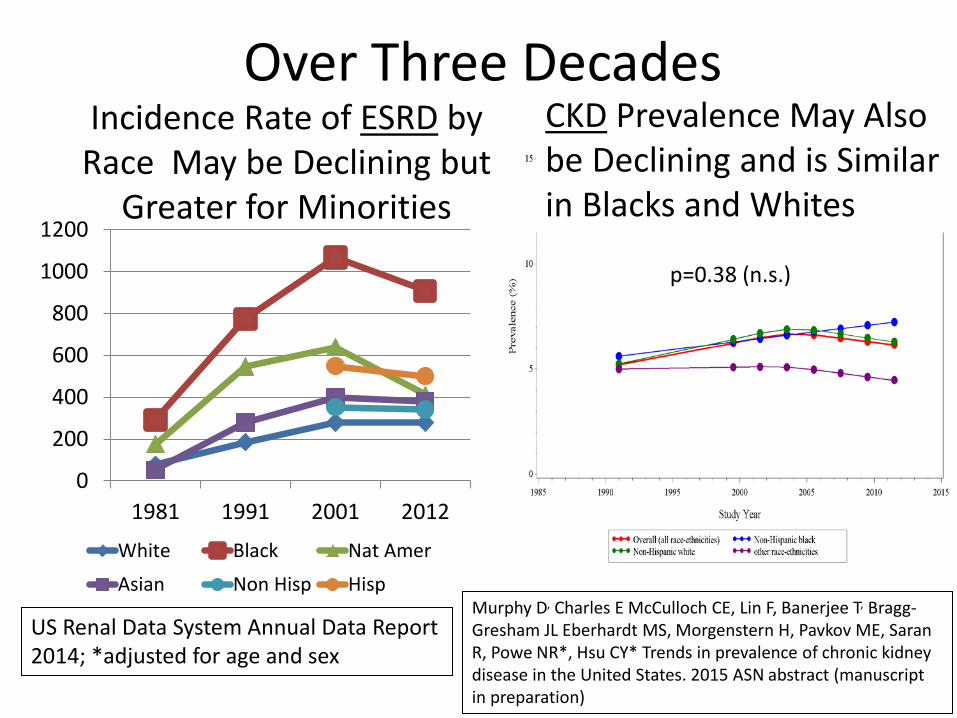
Incidence Rate of ESRD by Race May be Declining but
Greater for Minorities
0
200
400
600
800
1000
1200
1981 1991 2001 2012
White Black Nat Amer
Asian Non Hisp Hisp
US Renal Data System Annual Data Report 2014; *adjusted for age and sex
CKD Prevalence May Also be Declining and is Similar in Blacks and Whites
Murphy D, Charles E McCulloch CE, Lin F, Banerjee T, Bragg-Gresham JL Eberhardt MS, Morgenstern H, Pavkov ME, Saran R, Powe NR*, Hsu CY* Trends in prevalence of chronic kidney disease in the United States. 2015 ASN abstract (manuscript in preparation)
Over Three Decades
p=0.38 (n.s.)
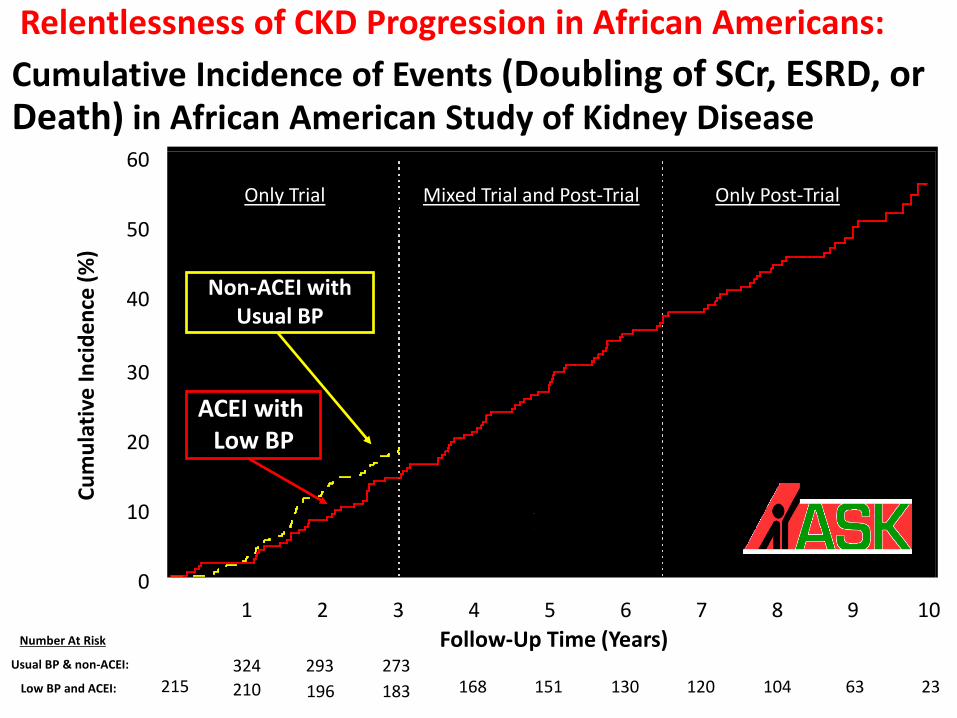
Only Trial Mixed Trial and Post-Trial Only Post-Trial
Number At Risk
Usual BP & non-ACEI:
Low BP and ACEI:
Non-ACEI with Usual BP
ACEI with Low BP
Cum
ulat
ive
Inci
denc
e (%
)
0
10
20
30
40
50
60
Follow-Up Time (Years) 0 1 2 3 4 5 6 7 8 9 10
104 63 23 130 120 168 151 273
196 183 293
215 333
210 324
Cumulative Incidence of Events (Doubling of SCr, ESRD, or Death) in African American Study of Kidney Disease
Relentlessness of CKD Progression in African Americans:

Decline in eGFRcys Differs by Race at Early Ages, with Faster Annualized Rates of Decline Among Blacks
Peralta CA, Vittinghoff E, Bansal N, Jacobs D Jr, Muntner P, Kestenbaum B, Lewis C, Siscovick D, Kramer H, Shlipak M, Bibbins-Domingo K. Trajectories of kidney function decline in young black and white adults with preserved GFR: results from the Coronary Artery Risk Development in Young Adults (CARDIA) study. Am J Kidney Dis. 2013 ;62(2):261-6.

Risk of Projected* Kidney Failure Among 1,119,816 Adult in Kaiser Permanente Southern California
is Greater for Blacks and Hispanics Compared to Whites Odds Ratios
Time after Entry eGFR Black vs White Hispanic vs White Asian vs White
1 y 2.17 (1.89–2.49) 1.78 (1.56–2.02) 1.47 (1.20–1.80)
3 y 1.53 (1.45–1.61) 1.30 (1.24–1.36) 1.10 (1.03–1.19)
5 y 1.34 (1.29–1.39) 1.15 (1.12–1.19) 0.99 (0.94–1.04)
During Study Period
Any entry eGFR 1.34 (1.30–1.38) 1.08 (1.05–1.10) 0.89 (0.85–0.92)
Entry eGFR ≥60 mL/min/1.73 m2
1.19 (1.47–1.23) 0.92 (0.89–0.94) 0.69 (0.66–0.73)
Entry eGFR <60 mL/min/1.73 m2
1.54 (1.46–1.62) 1.49 (1.42–1.56) 1.41 (1.32–1.51)
*Projected based on >2 serum creatinine tests and >180 days between tests from 2003–2009 : 526,498 whites, 350,919 Hispanics, 136,923 blacks, and 105,476 Asians. Derose SF, Rutkowski MP, Crooks PW, Shi JM, Wang JQ, Kalantar-Zadeh K, Kovesdy CP, Levin NW, Jacobsen SJ. Racial differences in estimated GFR decline, ESRD, and mortality in an integrated health system. Am J Kidney Dis. 2013 Aug;62(2):236-44.

The higher incidence of kidney failure among African Americans appears due to a
faster rate of disease progression rather than greater prevalence of early stage CKD
Normal Death
Blacks
Whites
Normal Damage ↓GFR
Kidney Failure 3-7 fold greater
Death
What are the contributing factors to this acceleration?
Kidney Failure 3-7 fold greater
Death
Kidney Failure 3-7 fold greater
Death
Kidney Failure 3-7 fold greater
Death ↓GFR
Kidney Failure 3-7 fold greater
Death Damage ↓GFR
Kidney Failure 3-7 fold greater
Death Damage ↓GFR
Kidney Failure 3-7 fold greater
Death Damage ↓GFR
↓GFR
Kidney Failure 3-7 fold greater
Death Increased risk
Increased risk Damage
Damage ↓GFR
Kidney failure
Kidney Failure Death

Susceptibility, initiation and progression factors contributing to
excess ESRD incidence • Biological • Environmental • Behavioral (e.g. lifestyle) • Quality/adequacy of CKD care

Blacks are more likely to have a family history of ESRD than Whites
9.5
14
6.4
22.823
14
0
5
10
15
20
25
All Blacks Whites All Blacks Whites
Perc
ent o
f Par
ticip
ants
•Freedman BI, Volkova NV, Satko SG, Krisher J, Jurkovitz C, Soucie JM, McClellan WM. Population-based screening for family history of end-stage renal disease among incident dialysis patients. Am J Nephrol. 2005 ;25(6):529-35. •McClellan W, Speckman R, McClure L, Howard V, Campbell RC, Cushman M, Audhya P, Howard G, Warnock DG. Prevalence and Characteristics of a Family History of ESRD among Adults in the US Population. J Am Soc Nephrol. 2007 Apr;18(4):1344-52.
Of 25,883 patients starting dialysis in southeast U.S : 1st or 2nd degree relative who was also being treated for ESRD
12,030 US residents 45 yr and older in NC, SC, GA, TN, MS AL, LA, AR and contiguous states in the Reasons for Geographic and Racial Differences in cohort: parent, sibling, or child with kidney failure (dialysis or transplant)
CHOICECHOICECHOICECHOICECHOICE
Choices for Healthy Outcomes In Caring
for ESRD
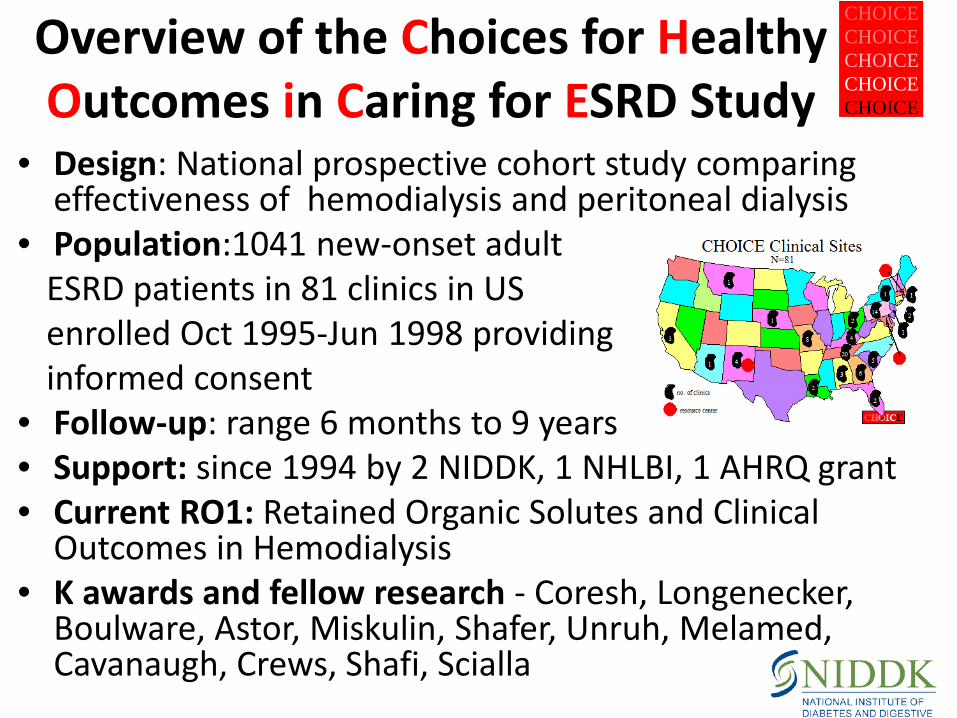
Overview of the Choices for Healthy Outcomes in Caring for ESRD Study
• Design: National prospective cohort study comparing effectiveness of hemodialysis and peritoneal dialysis
• Population:1041 new-onset adult ESRD patients in 81 clinics in US enrolled Oct 1995-Jun 1998 providing informed consent
• Follow-up: range 6 months to 9 years • Support: since 1994 by 2 NIDDK, 1 NHLBI, 1 AHRQ grant • Current RO1: Retained Organic Solutes and Clinical
Outcomes in Hemodialysis • K awards and fellow research - Coresh, Longenecker,
Boulware, Astor, Miskulin, Shafer, Unruh, Melamed, Cavanaugh, Crews, Shafi, Scialla

CHOICE Specimen Bank
Start of Dialysis
Enrollment ~45 days after
start
0 1 2 3 6 12 18 24 30 36 42 48 Specimen
N n-Visits n-Vials
•Total 895 13,502 (8 routine + 1 special) 91,231
Measurements ~10,000
•Serum Lp(a) levels + isoforms, CRP, IL-6, MMP3, p-selectin, TNF-beta
•Plasma Fibrinogen, PTH, iPTH
•DNA 16 candidates genes
Illumina panel - 1536 SNPs; 164 CVD genes; 87 admixture markers
646 genomic DNA + 179 WGA DNA + QC of WGA
Exit
1041 enrolled
CHOICECHOICECHOICECHOICECHOICE
Choices for Healthy Outcomes In Caring
for ESRD
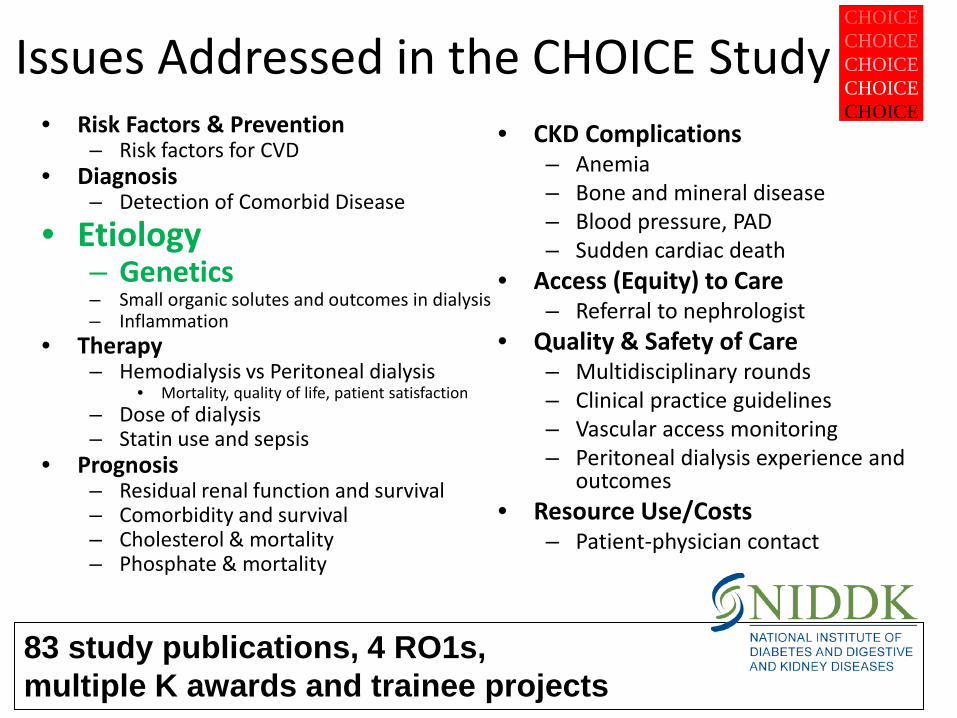
Issues Addressed in the CHOICE Study • Risk Factors & Prevention
– Risk factors for CVD • Diagnosis
– Detection of Comorbid Disease
• Etiology – Genetics – Small organic solutes and outcomes in dialysis – Inflammation
• Therapy – Hemodialysis vs Peritoneal dialysis
• Mortality, quality of life, patient satisfaction – Dose of dialysis – Statin use and sepsis
• Prognosis – Residual renal function and survival – Comorbidity and survival – Cholesterol & mortality – Phosphate & mortality
• CKD Complications – Anemia – Bone and mineral disease – Blood pressure, PAD – Sudden cardiac death
• Access (Equity) to Care – Referral to nephrologist
• Quality & Safety of Care – Multidisciplinary rounds – Clinical practice guidelines – Vascular access monitoring – Peritoneal dialysis experience and
outcomes • Resource Use/Costs
– Patient-physician contact
83 study publications, 4 RO1s, multiple K awards and trainee projects

Nat Gen Oct. 2008 40(10): 1185-92
Genetics?
Nat Genet. 2008 Oct;40(10):1185-92.
Case-control design in Choices for Healthy Outcomes in Caring for ESRD (CHOICE) Study participants
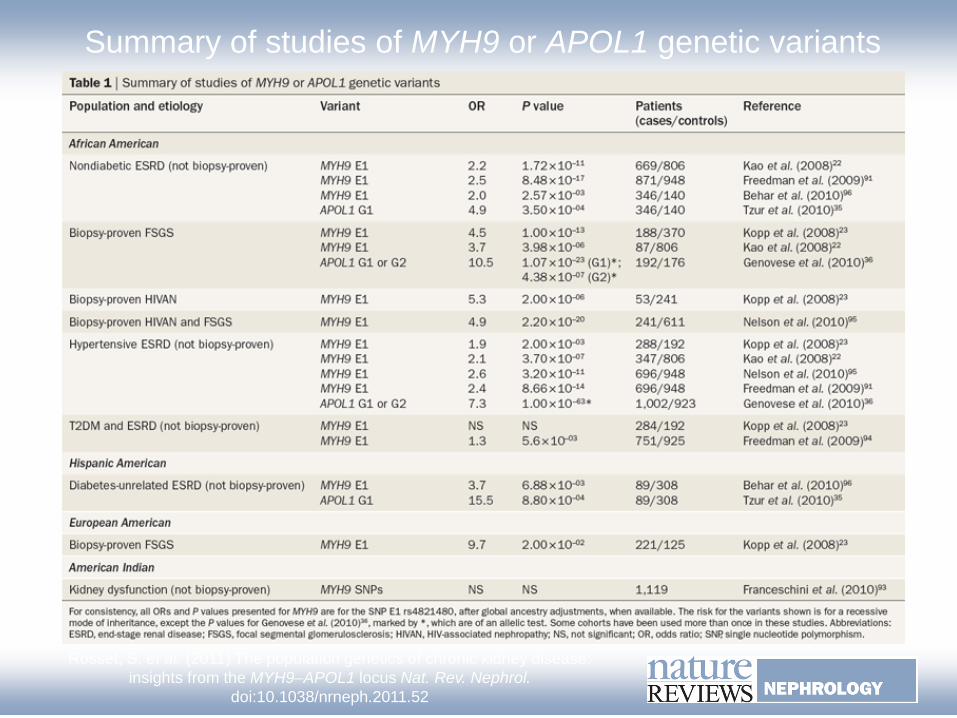
Summary of studies of MYH9 or APOL1 genetic variants
Rosset, S. et al. (2011) The population genetics of chronic kidney disease: insights from the MYH9–APOL1 locus Nat. Rev. Nephrol.
doi:10.1038/nrneph.2011.52

Kronenberg F Nephrol. Dial. Transplant. 2011;26:775-778
hypertension-attributed kidney disease, FSGS and HIV nephropathy recessive inheritance
Structure of the ApoL1 gene
• 14.5 kb gene on chromosome 22 • Located 14 kb downstream of MYH9
• Encodes 398 amino acids
Madhavan, Sethu M. O’Toole JF . "The biology of APOL1 with insights into the association between APOL1 variants and chronic kidney disease." Clinical and experimental nephrology 18.2 (2014): 238-242. Drawz, Paul E., and John R. Sedor. "The genetics of common kidney disease:." Nature Reviews Nephrology 7.8 (2011): 458-468. Kruzel-Davila E, Wasser WG, Aviram S, Skorecki K APOL1 nephropathy: from gene to mechanisms of kidney injury Nephrol Dial Transplant (2015) 0: 1–10
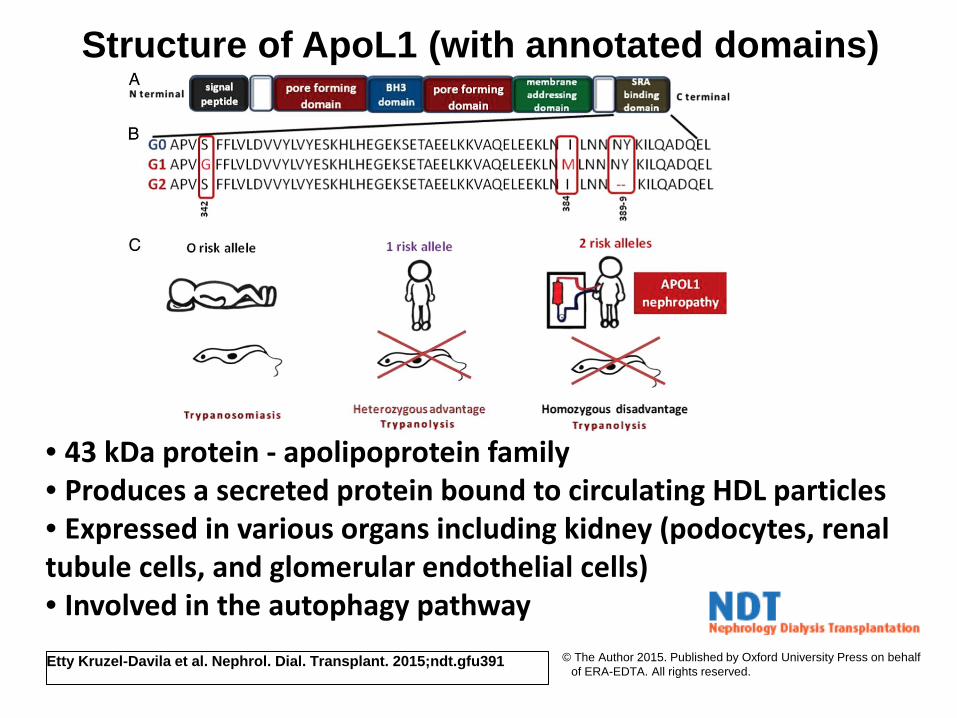
Structure of ApoL1 (with annotated domains)
Etty Kruzel-Davila et al. Nephrol. Dial. Transplant. 2015;ndt.gfu391 © The Author 2015. Published by Oxford University Press on behalf of ERA-EDTA. All rights reserved.
• 43 kDa protein - apolipoprotein family • Produces a secreted protein bound to circulating HDL particles • Expressed in various organs including kidney (podocytes, renal tubule cells, and glomerular endothelial cells) • Involved in the autophagy pathway
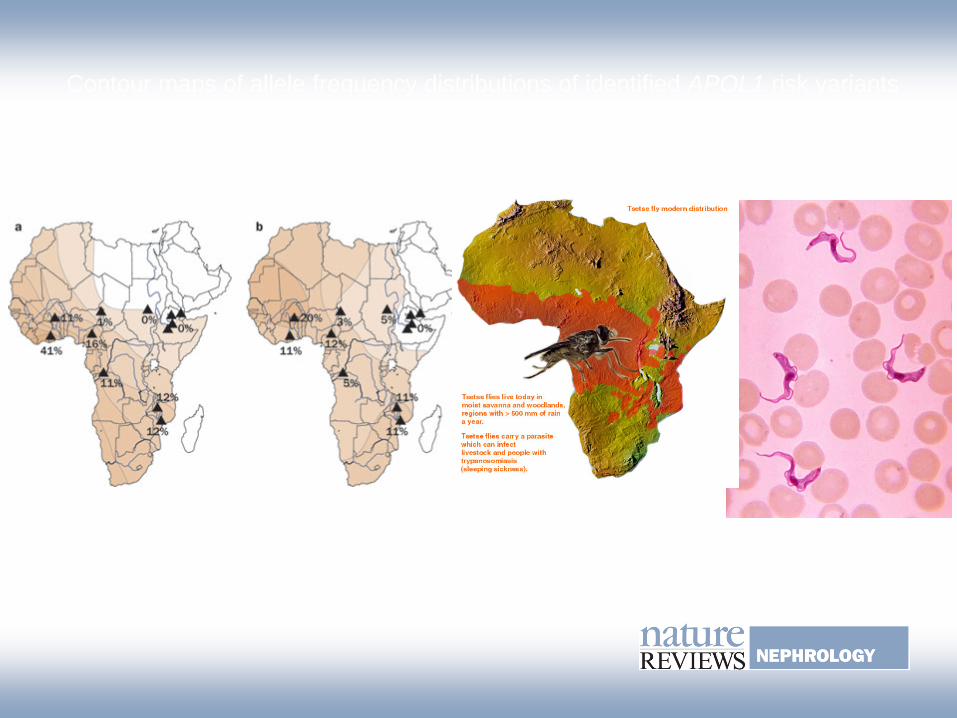
Contour maps of allele frequency distributions of identified APOL1 risk variants in a number of African countries
Rosset, S. et al. (2011) The population genetics of chronic kidney disease: insights from the MYH9–APOL1 locus Nat. Rev. Nephrol. doi:10.1038/nrneph.2011.52
G1 G2

AASK: APOL1 and CKD Progression in Longitudinal Studies
Parsa A, Kao WH, Xie D, Astor BC, Li M, Hsu CY, Feldman HI, Parekh RS, Kusek JW, Greene TH, Fink JC, Anderson AH, Choi MJ, Wright JT Jr, Lash JP, Freedman BI, Ojo A, Winkler CA, Raj DS, Kopp JB, He J, Jensvold NG, Tao K, Lipkowitz MS, Appel LJ; AASK Study Investigators; CRIC Study Investigators. APOL1 risk variants, race, and progression of chronic kidney disease. N Engl J Med. 2013 5;369(23):2183-96.
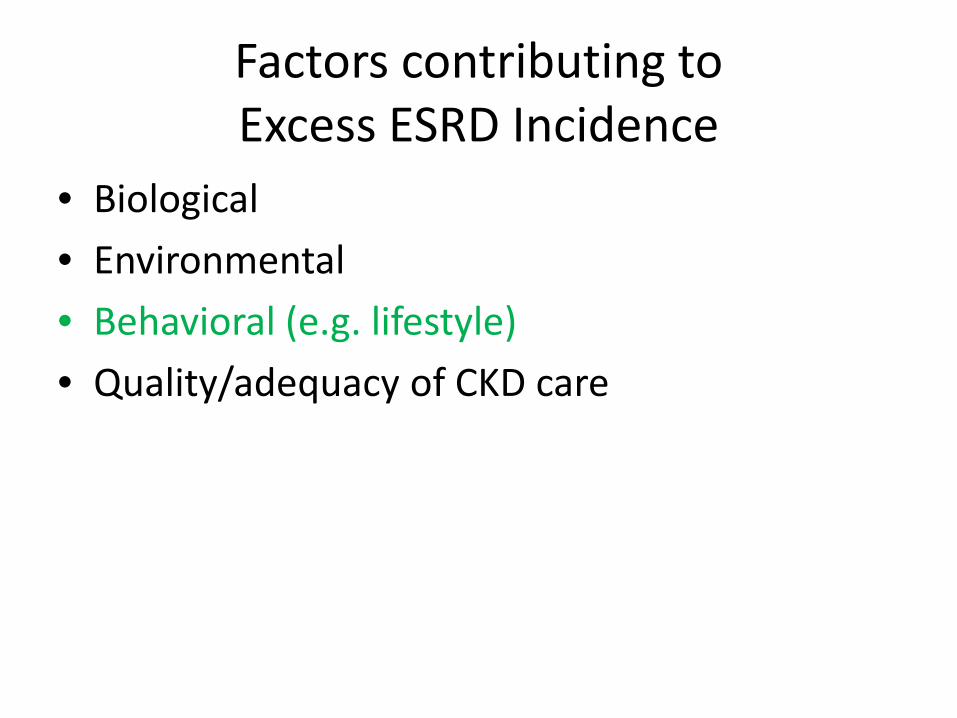
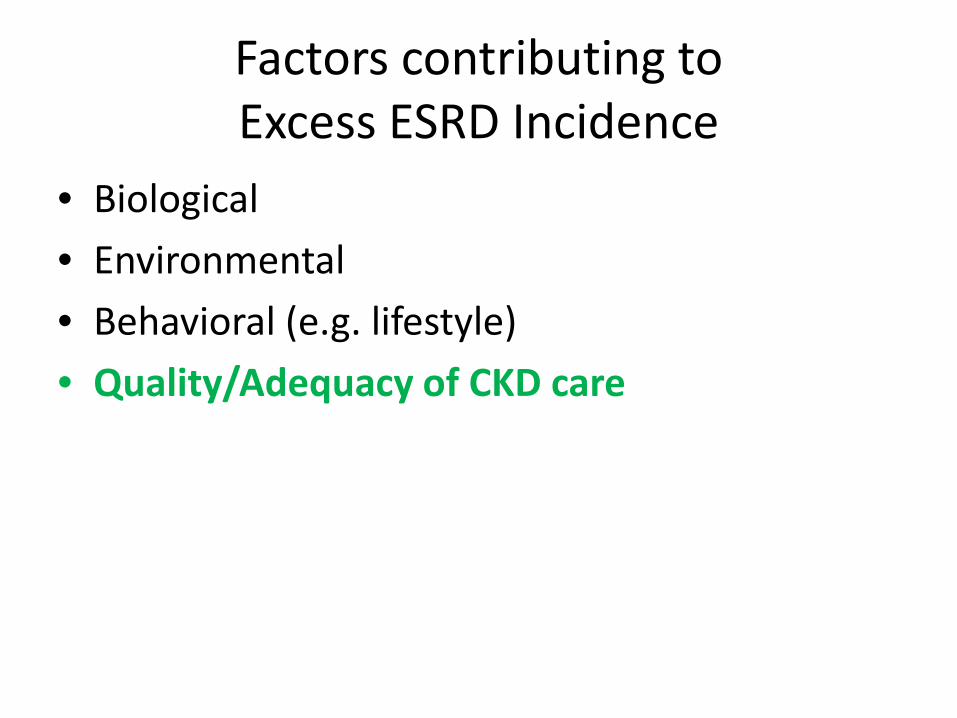
Factors contributing to Excess ESRD Incidence
• Biological • Environmental • Behavioral (e.g. lifestyle) • Quality/adequacy of CKD care
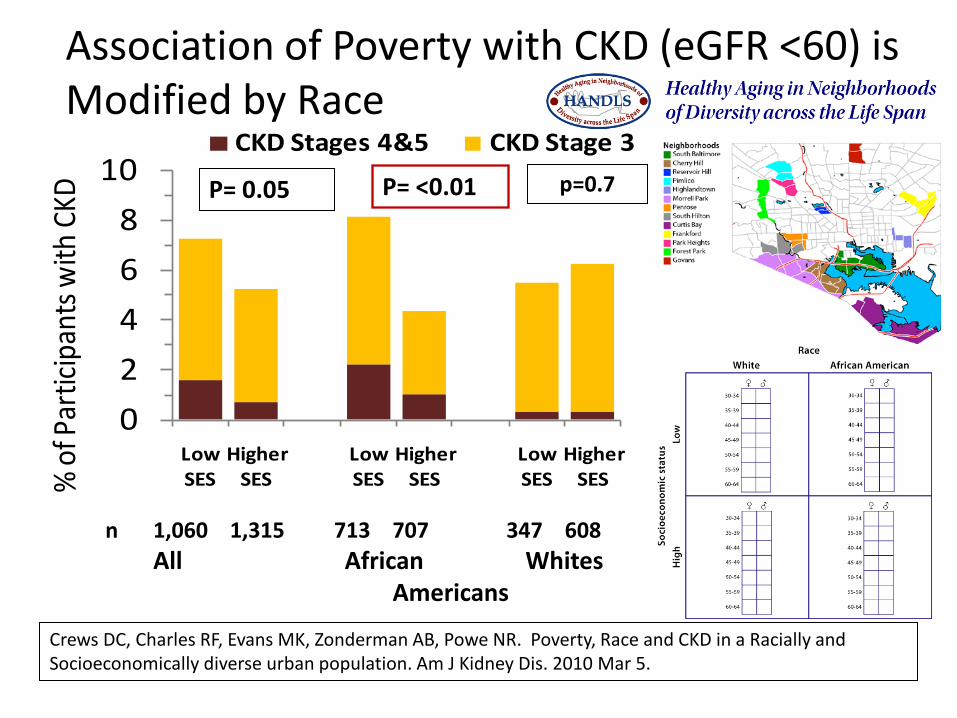
02468
10
Low SES
Higher SES
Low SES
Higher SES
Low SES
Higher SES%
of Pa
rticip
ants
with
CKD
CKD Stages 4&5 CKD Stage 3
P= 0.05 P= <0.01
Association of Poverty with CKD (eGFR <60) is Modified by Race
Crews DC, Charles RF, Evans MK, Zonderman AB, Powe NR. Poverty, Race and CKD in a Racially and Socioeconomically diverse urban population. Am J Kidney Dis. 2010 Mar 5.
p=0.7
n 1,060 1,315 713 707 347 608 All African Whites Americans
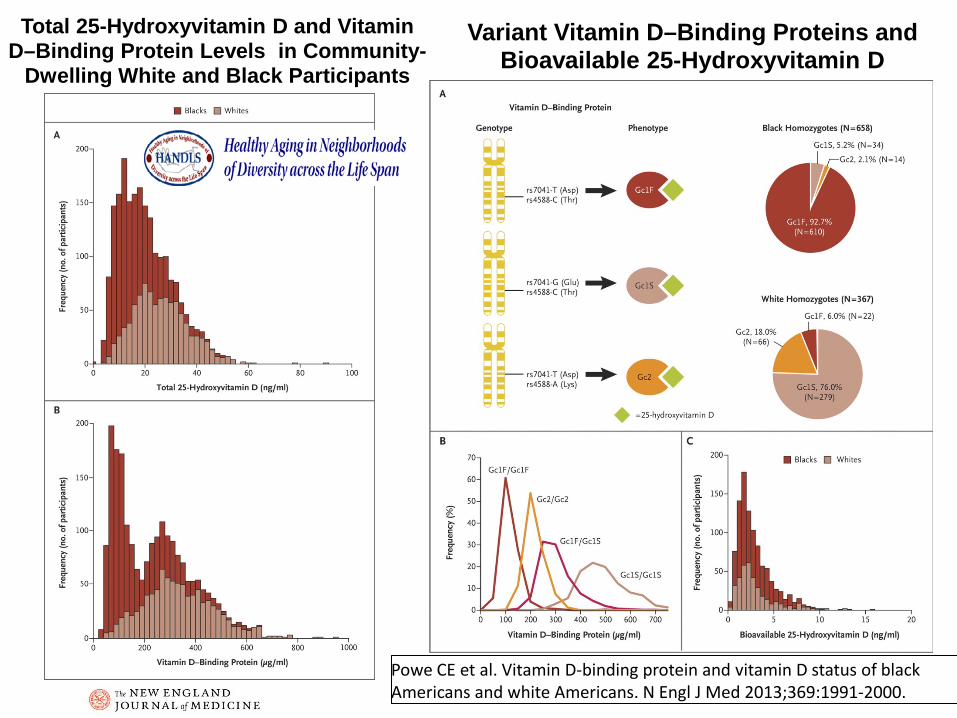
Total 25-Hydroxyvitamin D and Vitamin D–Binding Protein Levels in Community-
Dwelling White and Black Participants
Powe CE et al. Vitamin D-binding protein and vitamin D status of black Americans and white Americans. N Engl J Med 2013;369:1991-2000.
Variant Vitamin D–Binding Proteins and Bioavailable 25-Hydroxyvitamin D
Factors contributing to Excess ESRD Incidence
• Biological • Environmental • Behavioral (e.g. lifestyle) • Quality/adequacy of CKD care

Socioeconomic Status and Lifestyle Factors Explains 44% of the 3-fold excess risk of
CKD in African Americans vs Whites NHANES II (nationally representative) 2.69 2.49 2.29 2.15 1.95
0
1
2
3
age + sex + SES + lifestyle + care quality All factors
Rel
ativ
e R
isk,
B v
s W
poverty status education marital status
physical activity BMI, ETOH smoking status
DM, HTN, CVD hx, SBP cholesterol
11.8% excess risk
reduction
23.7% excess risk
reduction
32% excess risk
reduction
43.8 % excess risk
reduction
Tarver-Carr M, Powe NR, Eberhardt M, LaVeist TA, Kington RS, Coresh J, Brancati F. Excess Risk of Chronic Kidney Disease among African-American versus White Subjects in the United States: A Population-Based Study of Potential Explanatory Factors.Journal American Society Nephrology. 2002;13:2363-70.
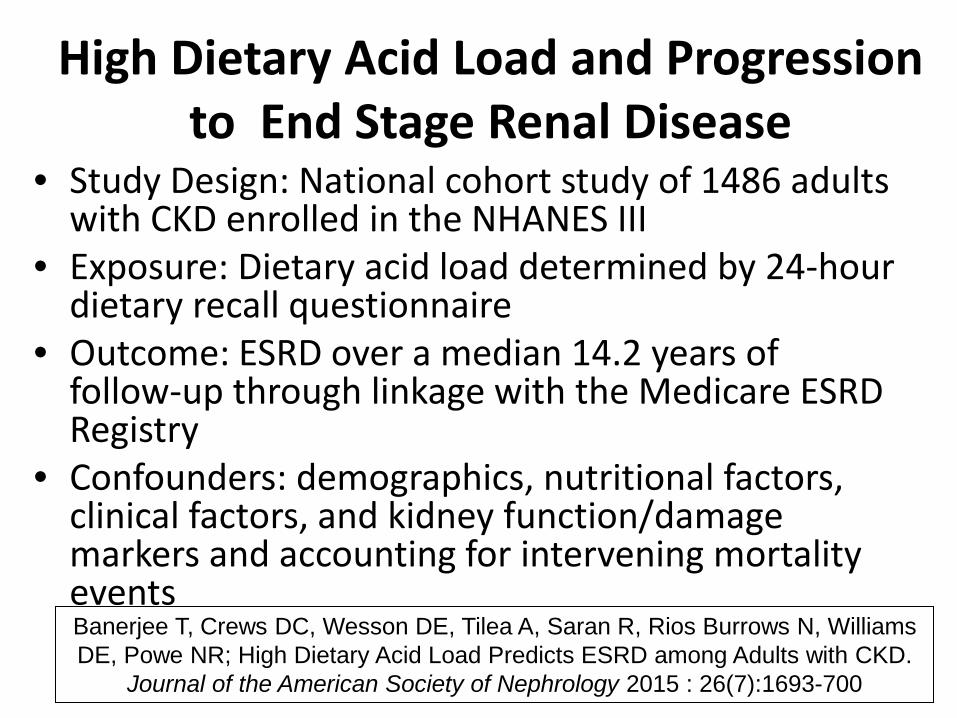
High Dietary Acid Load and Progression to End Stage Renal Disease
• Study Design: National cohort study of 1486 adults with CKD enrolled in the NHANES III
• Exposure: Dietary acid load determined by 24-hour dietary recall questionnaire
• Outcome: ESRD over a median 14.2 years of follow-up through linkage with the Medicare ESRD Registry
• Confounders: demographics, nutritional factors, clinical factors, and kidney function/damage markers and accounting for intervening mortality events Banerjee T, Crews DC, Wesson DE, Tilea A, Saran R, Rios Burrows N, Williams DE, Powe NR; High Dietary Acid Load Predicts ESRD among Adults with CKD.
Journal of the American Society of Nephrology 2015 : 26(7):1693-700
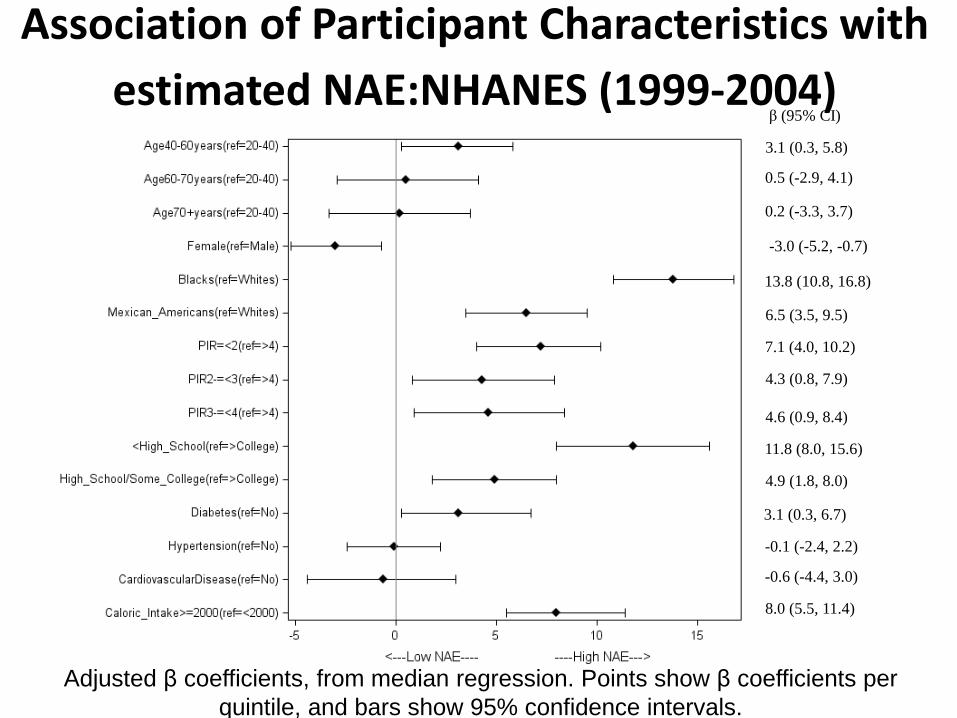
β (95% CI)
3.1 (0.3, 5.8)
0.5 (-2.9, 4.1)
0.2 (-3.3, 3.7)
-3.0 (-5.2, -0.7)
13.8 (10.8, 16.8)
6.5 (3.5, 9.5)
7.1 (4.0, 10.2)
4.3 (0.8, 7.9)
4.6 (0.9, 8.4)
11.8 (8.0, 15.6)
4.9 (1.8, 8.0)
3.1 (0.3, 6.7)
-0.1 (-2.4, 2.2)
-0.6 (-4.4, 3.0)
8.0 (5.5, 11.4)
Association of Participant Characteristics with estimated NAE:NHANES (1999-2004)
Adjusted β coefficients, from median regression. Points show β coefficients per quintile, and bars show 95% confidence intervals.
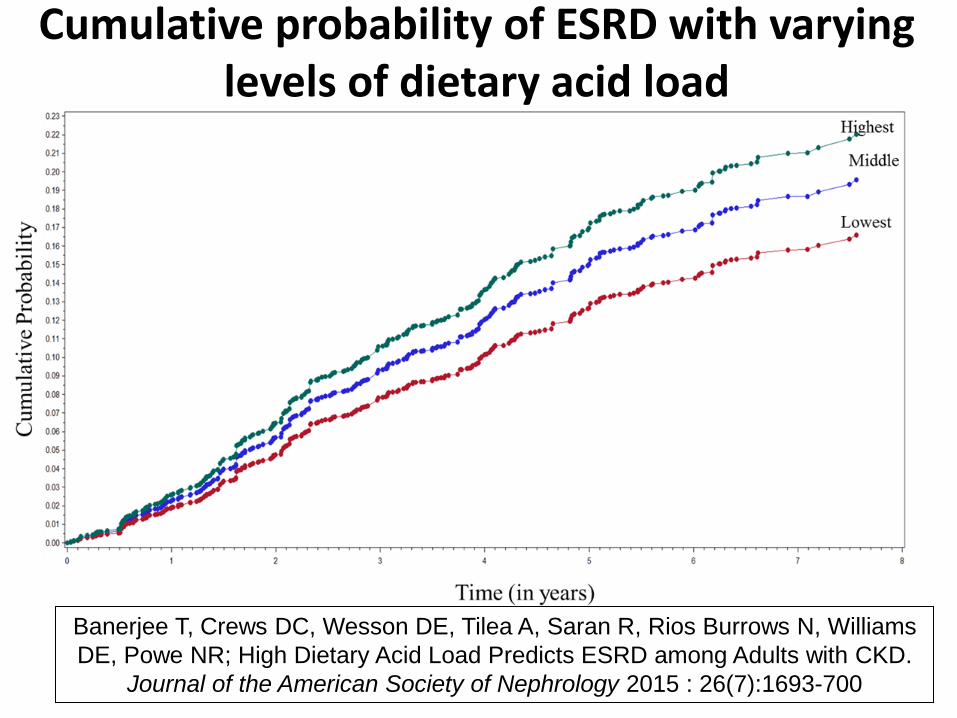
Cumulative probability of ESRD with varying levels of dietary acid load
Banerjee T, Crews DC, Wesson DE, Tilea A, Saran R, Rios Burrows N, Williams DE, Powe NR; High Dietary Acid Load Predicts ESRD among Adults with CKD.
Journal of the American Society of Nephrology 2015 : 26(7):1693-700
Factors contributing to Excess ESRD Incidence
• Biological • Environmental • Behavioral (e.g. lifestyle) • Quality/Adequacy of CKD care
53.457.8
62.0
79.074.5
70.1
56.957.5
53.555.353.6
49.4
0
10
20
30
40
50
60
70
80
90
% o
f par
ticip
ants
with
unc
ontr
olle
d bl
ood
pres
sure
General Definition Disease-specific Definition White Black
P=0.002, No CKD
P=0.001, No CKD
Mexican White Black Mexican
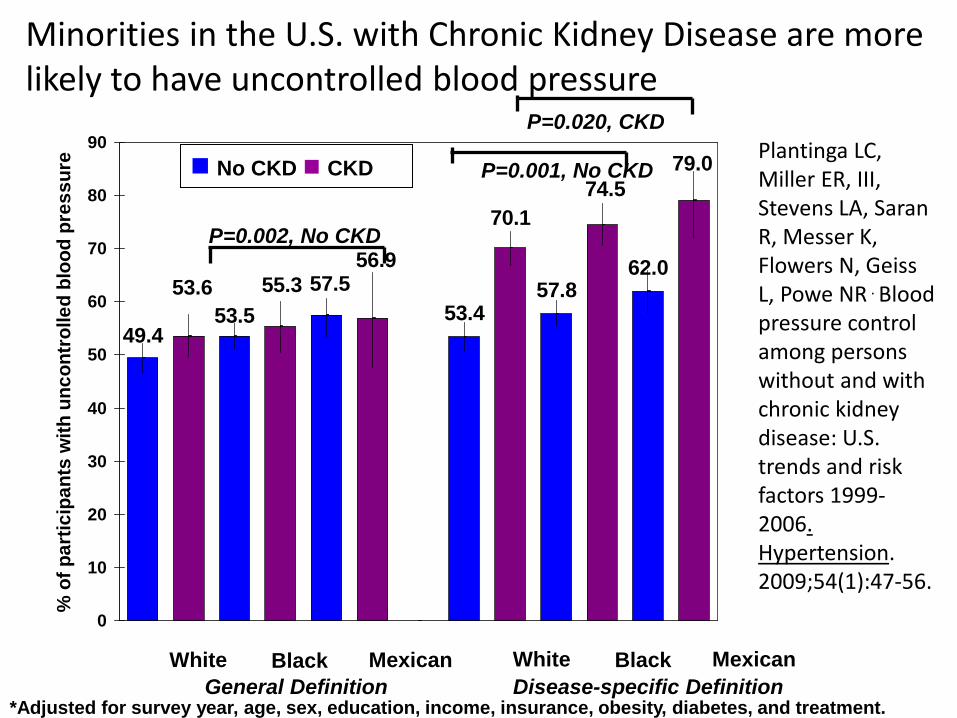
Minorities in the U.S. with Chronic Kidney Disease are more likely to have uncontrolled blood pressure
*Adjusted for survey year, age, sex, education, income, insurance, obesity, diabetes, and treatment.
P=0.020, CKD
No CKD CKD Plantinga LC, Miller ER, III, Stevens LA, Saran R, Messer K, Flowers N, Geiss L, Powe NR . Blood pressure control among persons without and with chronic kidney disease: U.S. trends and risk factors 1999-2006. Hypertension. 2009;54(1):47-56.

Socioeconomic Status, Lifestyle and Quality of Care Explains 44% of the 3-fold excess
risk of CKD in African Americans vs Whites NHANES II
2.69 2.49 2.29 2.15 1.95
0
1
2
3
age + sex + SES + lifestyle + care quality All factors
Rel
ativ
e R
isk,
B v
s W
poverty status education marital status
physical activity BMI, ETOH smoking status
DM, HTN, CVD hx, SBP cholesterol
11.8% excess risk
reduction
23.7% excess risk
reduction
32% excess risk
reduction
43.8 % excess risk
reduction
Tarver-Carr M, Powe NR, Eberhardt M, LaVeist TA, Kington RS, Coresh J, Brancati F. Excess Risk of Chronic Kidney Disease among African-American versus White Subjects in the United States: A Population-Based Study of Potential Explanatory Factors.Journal American Society Nephrology. 2002;13:2363-70.
ApoL1 or other genes 100% excess reduction?

Questions to Ponder • How much does ApoL1 or other genes contribute to the
disparity in ESRD incidence between African Americans and whites? – How important is ApoL1 or other genes in comparison to other
modifiable risk factors? (population attributable risk –incidence reduction if all unexposed)

Questions to Ponder • How much does ApoL1 contribute to the disparity in ESRD
incidence between African Americans and whites? – How important is ApoL1 in comparison to other modifiable risk
factors? (population attributable risk –incidence reduction if all unexposed)
• Are ApoL1 risk variants more susceptible to known kidney injury agents? – Do APOL1 variants alter response to an environmental factor or to
treatment?
• Does knowing ApoL1 risk status lead to better health outcomes? What can be done? – better blood pressure and diabetes control, avoidance of nephrotoxins
(contrast media, medications, NSAIDS), less acidic diets – decision to be a live kidney donor and donor outcomes

• APOL1 has an endogenous function in podocyte necessary to resist environmental stress and maintain podocyte health? – Pathways are dysregulated in presence of two risk variants where clinical
disease manifests with the introduction of an environmental stress.
• Gene/gene interactions? – Modifier loci may explain the differences in kidney pathologies between
FSGS, HIVAN and hypertensive-attributed nephropathy.
• Gene/environment interactions? – Modifiable environmental second hits (viruses, antiviral pathway) may
explain gaps between lifetime risks in individuals with same genetic background
• Risk in circulating APOL1 or APOL1 expressed in kidney? • Apoptosis in podocytes?
– biosynthesis, trafficking, ion channel properties, endocytosis, and effects on organellar structure and function
Questions to Ponder - Mechanism?
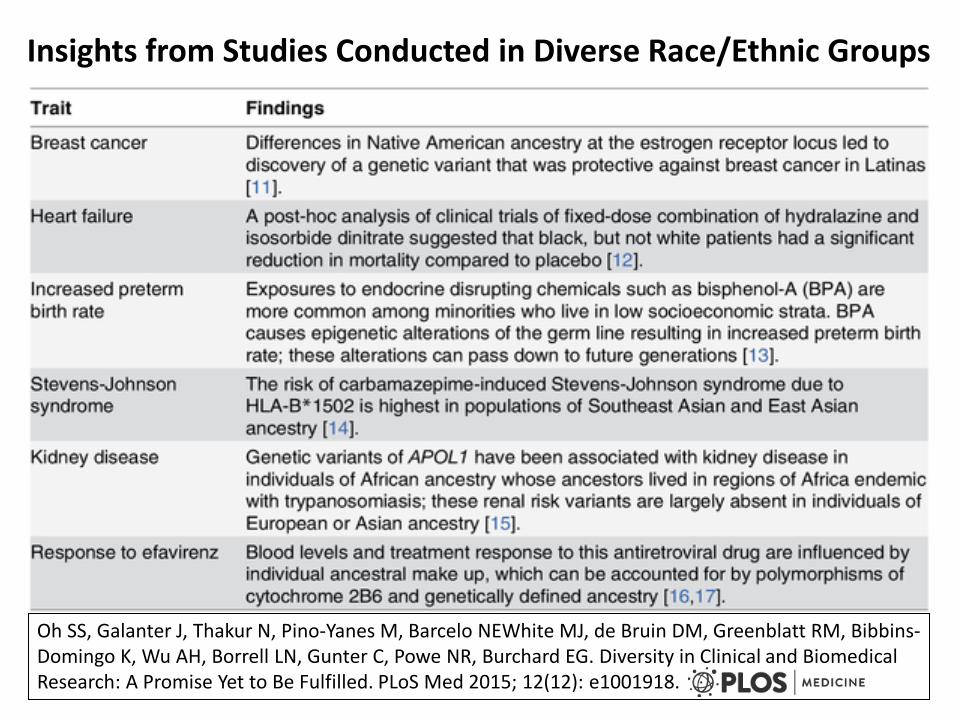
Insights from Studies Conducted in Diverse Race/Ethnic Groups
Oh SS, Galanter J, Thakur N, Pino-Yanes M, Barcelo NEWhite MJ, de Bruin DM, Greenblatt RM, Bibbins-Domingo K, Wu AH, Borrell LN, Gunter C, Powe NR, Burchard EG. Diversity in Clinical and Biomedical Research: A Promise Yet to Be Fulfilled. PLoS Med 2015; 12(12): e1001918.

Factors contributing to Excess ESRD Incidence
• Biological • Environmental • Behavioral (e.g. lifestyle) • Quality/Adequacy of CKD care - downstream
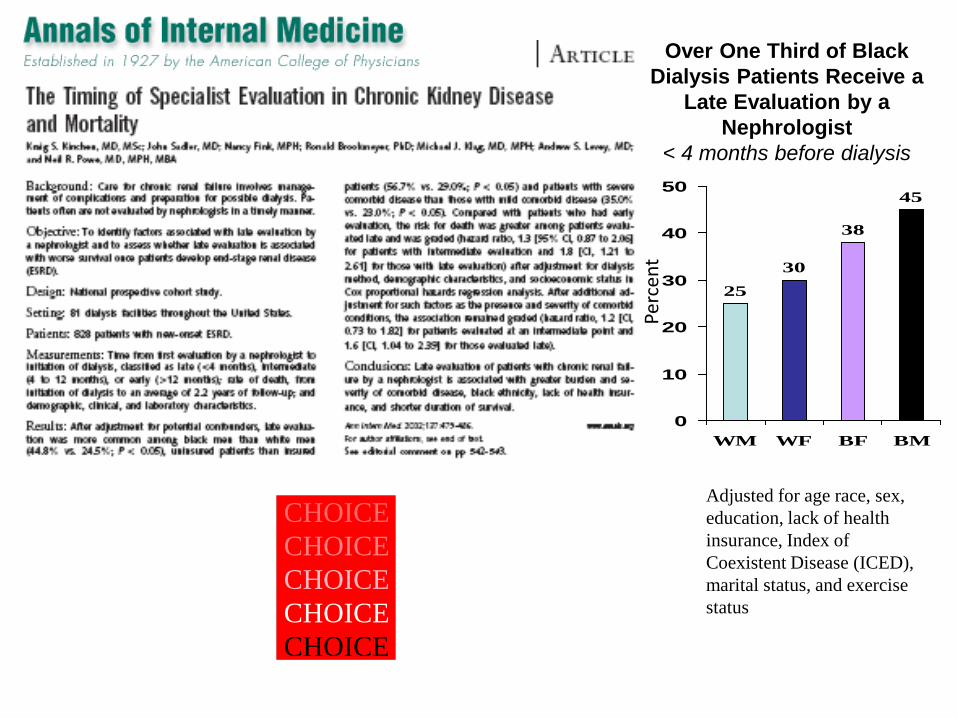
Over One Third of Black Dialysis Patients Receive a
Late Evaluation by a Nephrologist
< 4 months before dialysis
2530
38
45
0
10
20
30
40
50
WM WF BF BM
Perc
ent
Adjusted for age race, sex, education, lack of health insurance, Index of Coexistent Disease (ICED), marital status, and exercise status
CHOICECHOICECHOICECHOICECHOICE
Choices for Healthy Outcomes In Caring
f ESRD
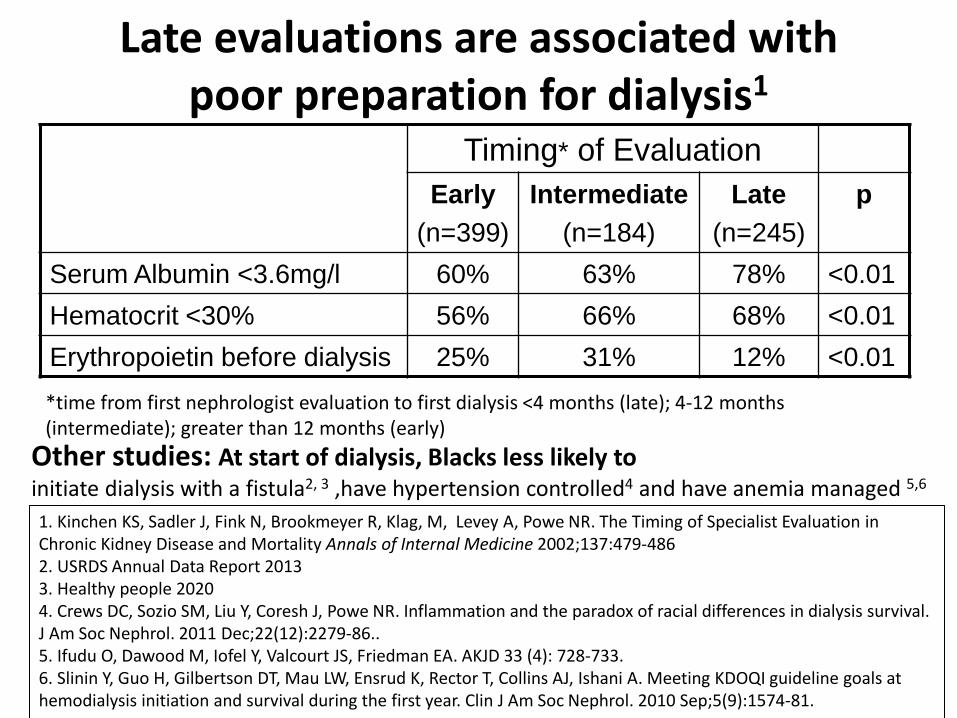
Late evaluations are associated with poor preparation for dialysis1
Timing* of Evaluation Early
(n=399) Intermediate
(n=184) Late
(n=245) p
Serum Albumin <3.6mg/l 60% 63% 78% <0.01 Hematocrit <30% 56% 66% 68% <0.01 Erythropoietin before dialysis 25% 31% 12% <0.01 *time from first nephrologist evaluation to first dialysis <4 months (late); 4-12 months (intermediate); greater than 12 months (early)
1. Kinchen KS, Sadler J, Fink N, Brookmeyer R, Klag, M, Levey A, Powe NR. The Timing of Specialist Evaluation in Chronic Kidney Disease and Mortality Annals of Internal Medicine 2002;137:479-486 2. USRDS Annual Data Report 2013 3. Healthy people 2020 4. Crews DC, Sozio SM, Liu Y, Coresh J, Powe NR. Inflammation and the paradox of racial differences in dialysis survival. J Am Soc Nephrol. 2011 Dec;22(12):2279-86.. 5. Ifudu O, Dawood M, Iofel Y, Valcourt JS, Friedman EA. AKJD 33 (4): 728-733. 6. Slinin Y, Guo H, Gilbertson DT, Mau LW, Ensrud K, Rector T, Collins AJ, Ishani A. Meeting KDOQI guideline goals at hemodialysis initiation and survival during the first year. Clin J Am Soc Nephrol. 2010 Sep;5(9):1574-81.
Other studies: At start of dialysis, Blacks less likely to initiate dialysis with a fistula2, 3 ,have hypertension controlled4 and have anemia managed 5,6
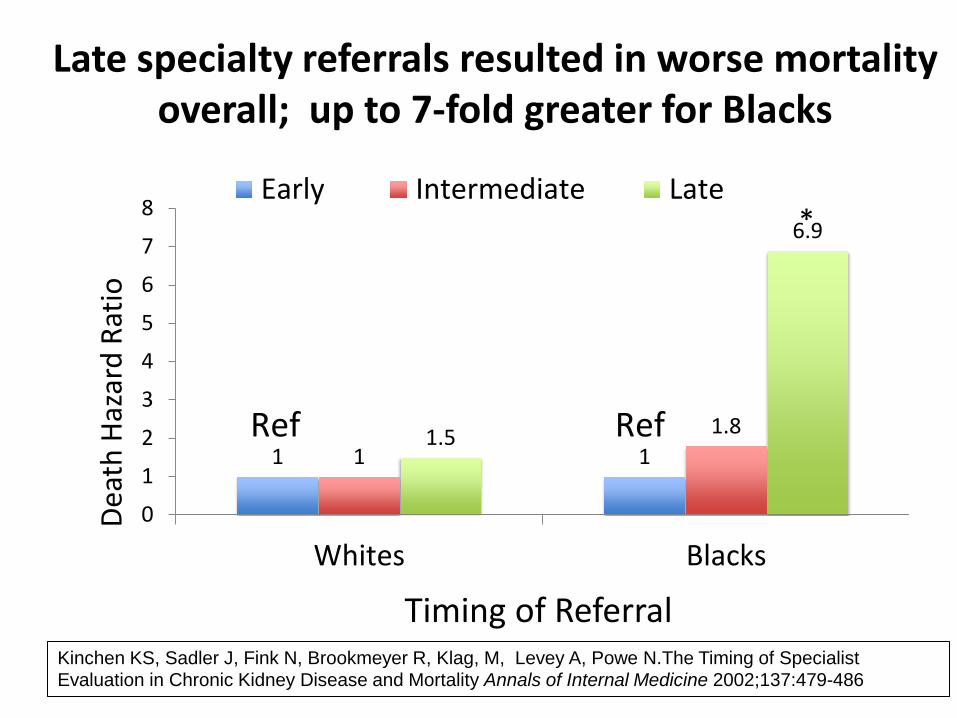
Late specialty referrals resulted in worse mortality overall; up to 7-fold greater for Blacks
1 1 1 1.8 1.5
6.9
0
1
2
3
4
5
6
7
8
Whites Blacks
Deat
h Ha
zard
Rat
io
Timing of Referral
Early Intermediate Late
Ref Ref
*
Kinchen KS, Sadler J, Fink N, Brookmeyer R, Klag, M, Levey A, Powe N.The Timing of Specialist Evaluation in Chronic Kidney Disease and Mortality Annals of Internal Medicine 2002;137:479-486
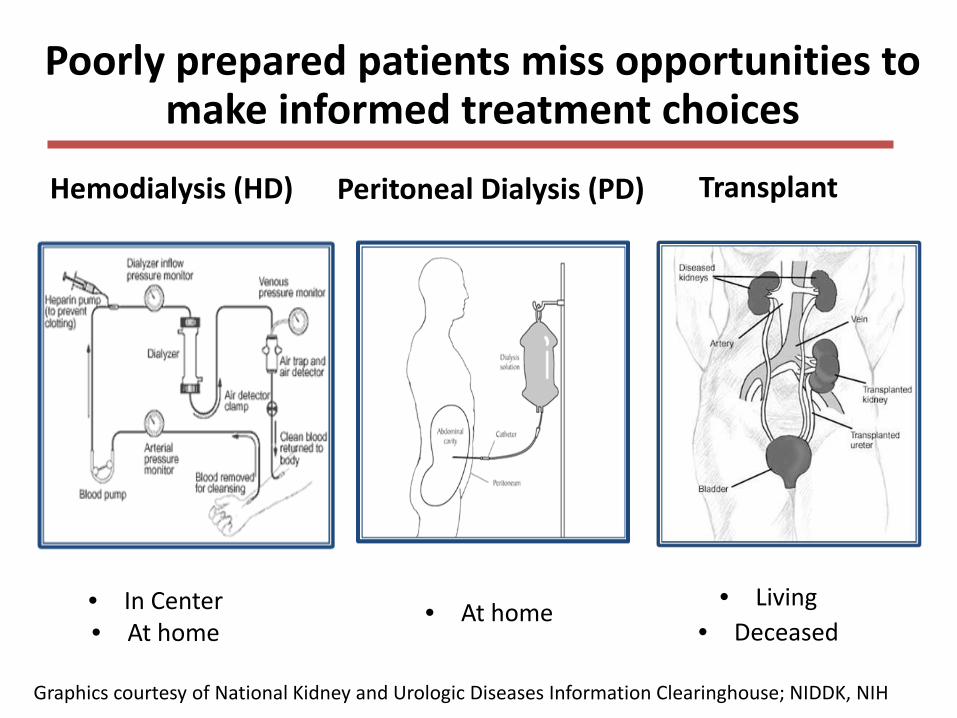
Poorly prepared patients miss opportunities to make informed treatment choices
Hemodialysis (HD)
• In Center • At home
Peritoneal Dialysis (PD)
• At home
• Living • Deceased
Graphics courtesy of National Kidney and Urologic Diseases Information Clearinghouse; NIDDK, NIH
Transplant

Does choice of therapy matter? • Debate on hemodialysis versus peritoneal dialysis
– Risk of death in first year of treatment equivalent1
– Hemodialysis may yield better long-term outcomes1
– More frequent hemodialysis at home may be better2
– Self-care modalities enhance quality of life
• Transplant yields better (up to 2-fold) length and quality of life and less cost compared to dialysis3, 4
– Live donor transplant better5
– Pre-emptive transplant better6,7 1 Jaar BG, Coresh J, Plantinga LC, Fink NE, Klag MJ, Levey AS, Levin NW, Sadler JH, Kliger A, Powe NR. Comparing risk for death with PD and hemodialysis. Ann Intern Med. 2005 ;143(3):174-83; 2 Culleton et al. JAMA. 2007 ;298(11):1291-9.; 3. Wolfe et al. N Engl J Med. 1999 Dec 2;341(23):1725-30. 4. Ojo et al. Am J Kidney Dis. 1994 Jul;24(1):59-64.; 5 Terasaki et al. N Engl J Med. 1995 Aug 10;333(6):333-6.; 6. Kasiske et al. J Am Soc Nephrol. 2002 May;13(5):1358-64; 7. Mange et al. Engl J Med. 2001 Mar 8;344(10):726-31.

African Americans versus Whites • Less likely to be waitlisted and transplanted1
• Less likely to receive live kidney transplants2
• Less likely to have knowledge of kidney replacement therapies3
• Less knowledge of transplant prior to dialysis initiation4
• Lower health literacy – health literacy associated with transplantation5
• Less knowledgeable when being evaluated for transplant; when knowledge is accounted for race differences in transplant evaporate6
1. United States Renal Data System 2015 Annual Report 2. Gore JL, Danovitch GM, Litwin MS, Pham PTT, Singer JS. Disparities in the Utilization of Live Donor Renal Transplantation. AJT 2009 9:1124-1133 3. Finkelstein FO. Perceived knowledge of CKD and ESRD. Kidney International (2008) 74, 1178-1184 4. Ayanian et al. The Effect of Patient’s Preferences on Racial Differences in Access to Renal Transplantation. NEJM 1999; 341 1661-1669 5. Grubbs V, Gregorich SE, Perez-Stable EJ, Hsu C. Health literacy and access to kidney transplantation. Clin J Am Soc Nephrol 4: 195-200, 2009 6. Waterman AD et al. Modifiable Patient Characteristics and Racial Disparities in Evaluation Completion and Living Donor Transplant. CJASN ePress. Published on March 28, 2013 as doi: 10.2215/CJN.08880812
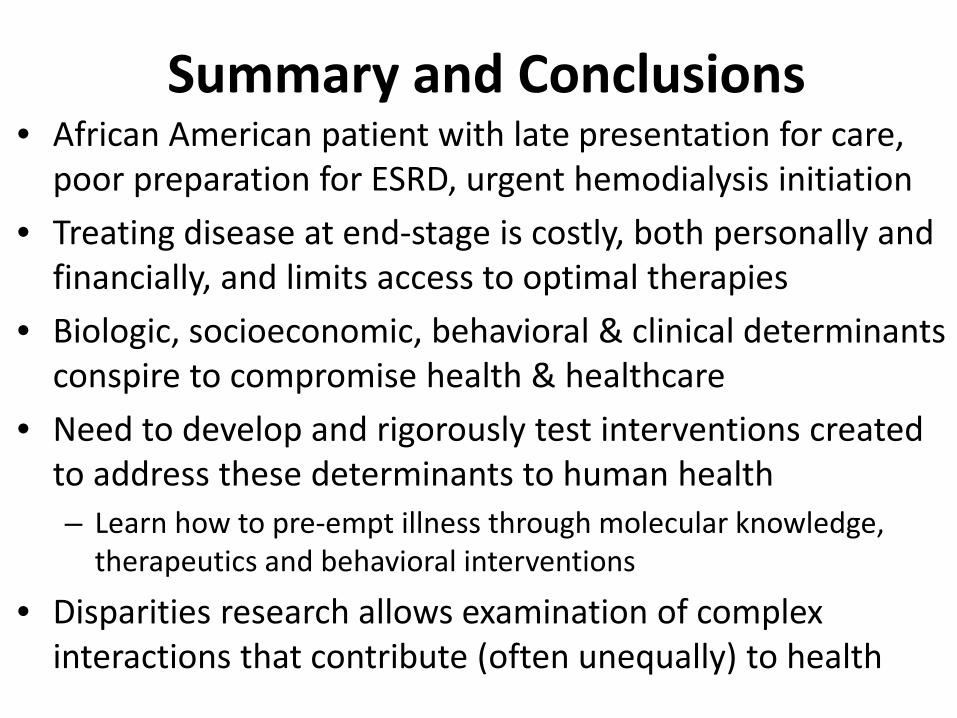
Summary and Conclusions • African American patient with late presentation for care,
poor preparation for ESRD, urgent hemodialysis initiation • Treating disease at end-stage is costly, both personally and
financially, and limits access to optimal therapies • Biologic, socioeconomic, behavioral & clinical determinants
conspire to compromise health & healthcare • Need to develop and rigorously test interventions created
to address these determinants to human health – Learn how to pre-empt illness through molecular knowledge,
therapeutics and behavioral interventions
• Disparities research allows examination of complex interactions that contribute (often unequally) to health

Summary and Conclusions • A growing proportion of Americans are not fully benefiting from
clinical and biomedical advances since racial and ethnic minorities make up ~ 40% of the United States population1
• Most physicians and scientists are informed by research extrapolated from a largely homogenous population1
• Ignoring diversity of US population is a missed scientific opportunity to understand factors that lead to disease or health1
• US biomedical research and study populations must better reflect the country’s changing demographics. 1
• Science on disparities, clinical care with diverse patients, and education about disparities enhances all of Medicine and human health.
1. Oh SS, Galanter J, Thakur N, Pino-Yanes M, Barcelo NE, White MJ, de Bruin DM, Greenblatt RM, Bibbins-Domingo K, Wu AH, Borrell LN, Gunter C, Powe NR, Burchard EG. Diversity in Clinical and Biomedical Research: A Promise Yet to Be Fulfilled. PLoS Med 2015; 12(12): e1001918.
THANK YOU!