3D Characterisation of Void Distribution in Resin Film Infused Composites

1
Chromatography Resin Characterisation to
Analyse Lifetime and Performance During
Biopharmaceutical Manufacture
by
Mauryn C. Nweke
Department of Biochemical Engineering
University College London
Gower Street
London
WC1E 6BT
A thesis submitted for the degree of
DOCTOR OF PHILOSOPHY
September 2017

2
DECLARATION
I confirm that the work presented in this thesis is my own unless indicated otherwise.
The work presented was carried out under the supervision of Prof Daniel G
Bracewell at the Department of Biochemical Engineering, University College
London and Dr R. Graham McCartney, Eli Lilly & Co., Ireland, between October
2013 and September 2017. This thesis has not been submitted, either in whole or in
part, for another degree or another qualification at any other university.
Mauryn C. Nweke
London, September 2017

3
ACKNOWLEDGMENTS
My acknowledgements extend as far back as when my time at UCL began in 2009. I
would like to thank all the contributors to my academic career thus far, for without
them, I would not have found myself here. I would especially like to thank my
supervisor Prof Daniel G Bracewell, my industrial supervisor Dr Graham McCartney
and my secondary supervisor Prof Nigel Titchener-Hooker for taking a chance on me
and supporting me in my pursuit of this project. Your support has not been in vain! I
also thank my Head of Department, Prof Gary J Lye and my mentor in many ways,
Dr Sunny Bains, for helping me to develop my personal aspirations, I am grateful.
I could never thank my loved ones enough. I thank you for your ability to believe in
me in my darkest moments and your ability to continue to support me when I could
hardly support myself. A special thank you to Dr Pierre Affaticati for inspiring me to
take the leap and to Yasmine Cherry, Rawan Al-Ramahi, Eliane Rozanes and
Estefani Daravina-Alvear for encouraging me to believe that I can, in any aspect of
life.
My mum and my brother are my world and everything I do and am is because of and
thanks to their love. I love you, always and forever and words will never be enough
to show my gratitude.
Finally and most importantly, I thank Him. For listening to me and for hearing my
every cry, no matter how petty it is. You do not let me cry in vain and every day, for
the rest of my days, belongs to you.

4
ABSTRACT
This thesis, completed in collaboration with Eli Lilly & Co., aims to understand and
assess the structural and mechanical changes that occur as agarose-based
chromatography resins are exposed to different bioprocessing conditions in an
attempt to explore the mechanisms by which different resins age. By understanding
this, there is significant potential for facilitating timely and improved decisions in
large-scale chromatographic operations, maximising resin lifetime whist maintaining
acceptable column performance.
Scanning electron microscopy (SEM) was used to image the structural properties of
nine widely used agarose-based chromatography resins before use while pressure-
flow analysis was used to characterise the mechanical properties of the same fresh
resins. The results showed that the Capto family had the highest critical velocities
(Capto Adhere- 492, Capto Q- 477 cm/hr), whilst Sepharose CL-6B, Sepharose 4
Fast Flow and Sepharose CL-4B had the lowest critical velocity values (283, 204,
149 cm/hr respectively).
There were practical limitations in using the pressure-flow technique alone to for
mechanical characterisation, including the large quantity of chromatography resin
and buffers and the stringent criteria required to pack a column. Dynamic
mechanical analysis (DMA) was therefore developed as a novel technique in this
field to address these limitations and allowed for further mechanical characterisation
based on the viscoelastic properties using 1ml of resin.
The technique was applied to the nine studied resins and correlated with the results
obtained using the pressure-flow technique. The same trends were observed – The
Capto family showed the highest resistance to deformation (Capto Adhere- 2.7,
Capto Q- 1.92 1/%min-1) through to Sepharose CL-6B, Sepharose 4 Fast Flow and
Sepharose CL-4B which exhibited the lowest slurry resistances (0.59, 0.4, 0.3
1/%min-1 respectively). These results indicate that DMA can be used as a small
volume, high-throughput technique, relative to pressure-flow analysis, for the
mechanical characterisation of chromatography media.

5
The structural imaging and mechanical testing tools developed in this study were
then applied to measure changes in resins that had undergone lifetime studies. These
studies expose the resins to repeated cycles of use to understand how they age in a
particular bioprocess, enabling decision making about their use. The first set of
experiments exposed the resins to the cleaning cycle only, whilst in the second set of
experiments, the resins had been used for lifetime studies in the production of
monoclonal antibodies (termed ‘aged’ resins).
The results indicated that MabSelect (highly cross-linked protein A resin) and Q-
Sepharose High Performance (anion exchange cross-linked resin) appeared to show
similar mechanisms of aging. Their matrices showed agarose fibre breakage with
increased exposure to process conditions. In the case of Capto Adhere (highly cross-
linked multimodal anion exchange resin) and MabSelect Xtra (highly cross-linked
protein A resin), the mechanism of aging appeared to be associated foulants coating
the surface fibres. The results indicate that the interaction of CIP reagents and
foulants (as opposed to CIP reagents alone) cause the greatest impact on the
structural integrity of the resins.
Pressure-flow and DMA characterisation were used to examine the mechanical
properties of the cycled resins to provide the first systematic study of these issues.
The results showed that fresh resins were consistently more robust than either of the
cycled resins but the greatest mechanical differences were observed between fresh
resins and aged resins, which corroborated the structural analysis data. Statistical
analysis was performed with one way ANOVA to determine whether DMA could be
independently used to assess the impact of process conditions on the mechanical
properties of chromatography media and the results show a >80% certainty that
DMA can be employed for this purpose.
6
IMPACT STATEMENT
-
Research relevance and Eli Lilly & Co.’s interest
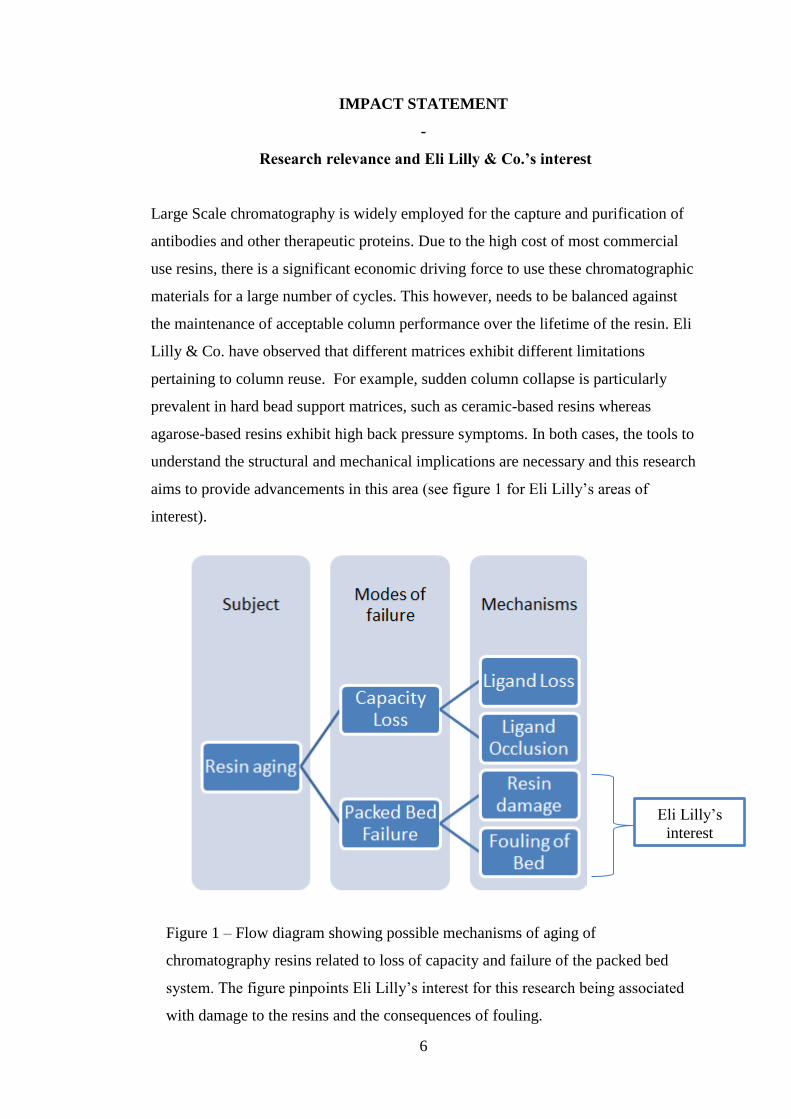
Large Scale chromatography is widely employed for the capture and purification of
antibodies and other therapeutic proteins. Due to the high cost of most commercial
use resins, there is a significant economic driving force to use these chromatographic
materials for a large number of cycles. This however, needs to be balanced against
the maintenance of acceptable column performance over the lifetime of the resin. Eli
Lilly & Co. have observed that different matrices exhibit different limitations
pertaining to column reuse. For example, sudden column collapse is particularly
prevalent in hard bead support matrices, such as ceramic-based resins whereas
agarose-based resins exhibit high back pressure symptoms. In both cases, the tools to
understand the structural and mechanical implications are necessary and this research
aims to provide advancements in this area (see figure 1 for Eli Lilly’s areas of
interest).
Eli Lilly’s
interest
Figure 1 – Flow diagram showing possible mechanisms of aging of
chromatography resins related to loss of capacity and failure of the packed bed
system. The figure pinpoints Eli Lilly’s interest for this research being associated
with damage to the resins and the consequences of fouling.

7
Additionally, robust chromatographic performance is essential to meet regulatory
expectations for biological products. It is a requirement to demonstrate the lifetime
of the resin exceeds that of its intended use within the process and to establish
procedures to monitor performance during operation. Hence there is a need to
understand what the critical factors are in the aging process. Better process decisions
can then be made to maximise resin usage by being able to better predict when
mechanical column failure may occur. This project aims to address this by
examining bead level events, which lead to mechanical failure of the column.

8
TABLE OF CONTENTS Page
Acknowledgments………………………………………………………3
Abstract………………………………………………………………….4
Impact statement………………………………………………………..6
Table of contents………………………………………………...............8
List of figures…………………………………………………………..11
List of tables……………………………………………………………23
List of abbreviations and notations……………………………...........27
List of publications…………………………………………………….29
Introduction…………………………………………………………….30
1. Literature review……………………………………………………….33
1.1.Chromatography in bioprocessing………………………………….35
1.2.Components of column chromatography…………………………..37
1.3.The role of resins…………………………………………………..39
1.3.1. Agarose-based resins………………………………………42
1.4.Chromatographic operation: Packing………………………………44
1.4.1. Structure-diffusion relationships……………………………48
1.4.2. Adsorption…………………………………………………..52
1.4.3. Resin lifetime and aging……………………………………54
1.5.The importance of characterisation……………………………......57
1.6.Mechanical and structural characterisation techniques…………...59
1.6.1. Microscopy techniques……………………………………..59
1.6.2. Chromatographic techniques……………………………….61
1.6.3. Other techniques……………………………………………63
2. Materials and methods……………………………………………….66
2.1.Scanning electron microscopy…………………………………......68
2.1.1. Air drying……………………………………………….......68
2.1.2. Freeze drying……………………………………………….68
2.1.3. Critical point drying………………………………………...68
2.1.4. Sample coating……………………………………………..70
2.1.5. Imaging……………………………………………………..70
2.1.6. Quantitative analysis using ImageJ software……………...70
2.2. Pressure-flow characterisation……………………………………72
2.2.1. Equipment…………………………………………………..72
3
4
6
8
11
23
27
29
30
33
35
37
44
42
3
4
6
8
11
23
27
29
30
33
35
37
39
42
44
48
52
54
57
60
60
62
64
67
69
69
69
69
71
71
71
73
73
9
2.2.2. Chromatography media……………………………………..72
2.2.3. Characterisation procedure…………………………………72
2.3.Dynamic mechanical analysis………………………………………74
2.3.1. Column/holder design………………………………………74
2.3.2. Sample preparation………………………………………….74
2.3.3. Characterisation procedure………………………………….74
2.4.CIP cycling studies (CIP-exposed conditions)……………………...75
2.4.1. MabSelect CIP cycling protocol…………………………….75
2.4.2. MabSelect Xtra CIP cycling protocol……………………….76
2.4.3. Q-Sepharose High Performance CIP cycling protocol………76
2.4.4. Capto Adhere CIP cycling protocol………………………….77
2.5.Aged conditions………………………………………………………78
2.5.1. MabSelect…………………………………………………….78
2.5.2. Capto Adhere………………………………………………....79
2.5.3. Q-Sepharose High Performance……………………………....79
2.5.4. Mabselect Xtra………………………………………………..79
3. The structural characterisation of chromatography media using
scanning electron microscopy (SEM)…………………………………….80
3.1.Choosing suitable drying conditions……………………………………83
3.1.1. Air drying method development and results……………………..85
3.1.2. Freeze drying vs critical point drying (CPD)…………………….90
3.2. Image analysis………………………………………………………….99
3.2.1. Qualitative image analysis……………………………………...107
3.2.2. Image J method development and results………………………109
3.2.3. Quantitative image analysis…………………………………….117
3.2.4. The challenges of SEM for quantitative image analysis……….122
3.3. Conclusion…………………………………………………………….124
4. Pressure-flow characterisation and the application of Dynamic
Mechanical Analysis (DMA)……………………………………………126
4.1.The challenges of column packing……………………………………129
4.2.Pressure-flow characterisation…………………………………………133
4.2.1. The limitations of pressure-flow characterisation……………..138
4.3.The development of the DMA technique……………………………...138
4.3.1. The advantages of DMA………………………………………144
73
73
75
75
75
75
76
76
77
77
78
79
79
80
80
80
81
84
86
91
100
108
110
118
123
125
127
130
134
139
139
145
10
4.4.Data correlation…………………………………………………….145
4.5.Conclusion………………………………………………………….148
5. The structural and mechanical characterisation of cycled resins….150
5.1.Selecting bioprocessing conditions…………………………………153
5.2.SEM image analysis…………………………………………………158
5.2.1. Qualitative analysis………………………………………….168
5.2.1.1.CIP-exposed resins………………………………………168
5.2.1.2.Aged resins……………………………………………….171
5.2.1.3.Qualitative analysis- discussion…………………………..172
5.2.2. Quantitative analysis – results…………………………………174
5.2.3. Quantitative analysis – discussion……………………………..182
5.2.3.1.MabSelect…………………………………………………182
5.2.3.2.MabSelect Xtra…………………………………………….183
5.2.3.3.Q-Sepharose High Performance…………………………...184
5.2.3.4.Capto Adhere………………………………………………184
5.3.Pressure-flow and DMA characterisation – results……………………187
5.3.1. Comparison of results from pressure-flow characterisation and
DMA…………………………………………………………192
5.4.Statistical analysis – results……………………………………………195
5.4.1. Statistical analysis – discussion………………………………199
5.5.Conclusion……………………………………………………………202
6. Final conclusions.......................................................................................204
6.1.Conclusions – Review of objectives………………………………….206
6.2.Overall aim……………………………………………………………
6.3.Study bottlenecks…………………………………………………….
7. Future work................................................................................................211
7.1.Resin fines studies…………………………………………………….213
7.2.Cryo-microtoming of bioprocessed resins…………………………….214
7.3.Column sectioning studies…………………………………………….214
7.4.Potential uses of DMA………………………………………………...215
7.5.Implementing resin aging analytical tools to satisfy QbD initiatives…218
References...................................................................................................217
Appendix……………………………………………………………….....230
146
149
151
154
159
169
169
172
173
176
184
184
185
186
186
189
195
198
202
205
207
209
212
213
214
216
217
217
218
219
230

11
List of figures Page
Figure 1 - Flow diagram showing possible mechanisms of aging of chromatography
resins related to loss of capacity and failure of the packed bed system. The figure
pinpoints Eli Lilly’s interest for this research being associated with damage to the
resins and the consequences of fouling………………………………………………6
Figure 2 - Industrial chromatography unit. (a) Schematic diagram (b)
Chromatography column adapted from (Bio-Rad Laboratories,2014)……………..37
Figure 3 - showing size of typical large-scale column, schematic of resin structure
and scanning electron microscopy (SEM) image of protein A resin prior to
processing…………………………………………………………………………...40
Figure 4 - General method for making porous agarose beads. The agarose solid is
dissolved in water heated to about 90˚C. This is then added to a stirred vessel
containing a hydrophobic solution (eg. Toluene or mineral oil) together with an
emulsifier. The solutions are immiscible meaning that constant agitation causes the
formation of agarose droplets. A surfactant is added to prevent droplet coalescing.
The solution is then cooled to below the gelation point of agarose (~35˚C) and the
beads are then washed, sieved to narrow the size distribution and cross-linked with a
reagent………………………………………………………………………………42
Figure 5 - pulse testing column evaluation method. (a) the HETP can be calculated
by first calculating N (number of plates) using values from the width of the peak at
half its maximum height (W1/2) and the retention time of the probe molecule (tr). (b)
the asymmetry can be calculated by dividing b by a, where a is the distance from the
leading edge of the peak to the midpoint and b is the distance from the midpoint to
the trailing edge of the peak………………………………………………………...47
Figure 6 - Schematic of an individual chromatography bead showing mass transfer
process of a solute. Binding of a solute to an immobilized ligand contributes to the
rate of reaction at the binding site (not shown). Surface diffusion, pore diffusion and
film diffusion also need to be accounted for at bead level………………………….48
12
Figure 7 - In-process factors that contribute to the movement of solute through the
packed bed. The effects of flow rate, mobile phase viscosity, resistance to mass
transfer due to pressure equilibriums should also be noted………………………..49
Figure 8 - Typical van Deemter plot of plate height vs. average linear velocity of
mobile phase. The optimum mobile phase flow rate can be determined………….51
Figure 9 - Showing possible mechanisms of chromatography resin aging. Column-
scale level changes include changes to packed bed structure. At bead level this could
translate to changes to bead morphology, ligand leaching, ligand occlusion, ligand
inactivation, matrix fouling and damage to matrix fibres, potentially leading to the
production of resin fines…………………………………………………………..56
Figure 10 - Scanning electron microscopy images of A: clean, B: partially fouled. C:
Extensively fouled resin particles. (Close et al., 2013)……………………………..61
Figure 11 - Schematic of DMA set up and dimensions. The lid has a diameter of
10mm and the column that sits inside the pan has an inner diameter of 11mm and an
outer diameter of 14mm. A sinusoidal force of 100mN is applied at a frequency of
1Hz over a period of 80 minutes. The output is strain v time, where strain is the
displacement of the lid relative to the sample height……………………………….66
Figure 12 - (A) Selected freeze drying conditions. A 0.5 ml aliquot of sample is
frozen over a period of 8.5 hours in a graded fashion from 25˚C to - 30˚C. The
sample is transferred onto a sticky aluminium stub for SEM. (B) Selected critical
point drying conditions. 0.5 ml of sample is dehydrated in graded fashion from 0-
100% ethanol before transfer to critical point dryer where sample is flushed 3 times
in liquid CO2. The temperature is raised in a vacuum to above 32˚C for 60 minutes.
The sample is transferred onto a sticky aluminium stub for SEM………………….70
Figure 13 – (A) Scanning electron micrograph showing fresh Capto Adhere post-air
drying. Whole bead image 2.0 kV accelerating voltage, x220 magnification, 3cm =
100 µm. (B) Scanning electron micrograph showing fresh Capto Adhere. Bead
surface image 2.0 kV accelerating voltage, x25, 000 magnification, 3 cm = 1µm...87

13
Figure 14 – (A) Scanning electron micrograph showing fresh MabSelect post-air
drying. Whole bead image 2.0 kV accelerating voltage, x350 magnification, 1cm =
20 µm. (B) Scanning electron micrograph showing fresh MabSelect. Bead surface
image 2.0 kV accelerating voltage, x18, 000 magnification, 2.5 cm = 1µm………88
Figure 15 - (A) Scanning electron micrograph showing fresh Capto Adhere post-
freeze drying. Whole bead image 2.0 kV accelerating voltage, x750 magnification,
1cm = 10 µm. (B) Scanning electron micrograph showing fresh Capto Adhere post-
freeze drying. Bead surface image 2.0 kV accelerating voltage, x14, 000
magnification, 2 cm = 1µm…………………………………………………………93
Figure 16 - (A) Scanning electron micrograph showing fresh MabSelect post-freeze
drying. Whole bead image 3.0 kV accelerating voltage, x950 magnification, 1.5cm =
10 µm. (B) Scanning electron micrograph showing fresh MabSelect post freeze-
drying. Bead surface image 2.0 kV accelerating voltage, x18, 000 magnification, 2.3
cm = 200nm…………………………………………………………………………94
Figure 17 - (A) Scanning electron micrograph showing fresh Capto Adhere post-
critical point drying. Whole bead image 2.0 kV accelerating voltage, x500
magnification, 1.2cm = 20 µm. (B) Scanning electron micrograph showing fresh
Capto Adhere post-freeze drying. Bead surface image 2.0 kV accelerating voltage,
x50, 000 magnification, 1.2 cm = 200nm…………………………………………95
Figure 18 - (A) Scanning electron micrograph showing fresh MabSelect post-critical
point drying. Whole bead image 2.0 kV accelerating voltage, x1,500 magnification,
2 cm = 10 µm. (B) Scanning electron micrograph showing fresh MabSelect post-
critical point drying. Bead surface image 2.0 kV accelerating voltage, x55, 000
magnification, 1.5 cm = 200 nm…………………………………………………….96
Figure 19 – (A) Scanning electron micrograph showing fresh Sepharose CL-4B post-
critical point drying. Whole bead image, 2.0kV, magnification x450, 0.6 cm=10 µm.
(B)Scanning electron micrograph showing fresh Sepharose CL-4B post-critical point
drying. Bead surface image, 2.0 kV, magnification x40,000, 0.6 cm=100nm…….101

14
Figure 20 – (A) Scanning electron micrograph showing fresh Sepharose 4 Fast Flow
post-critical point drying. Whole bead image, 2.0kV, magnification x500, 0.6 cm =
10 µm. (B) Scanning electron micrograph showing fresh Sepharose 4 Fast Flow
post-critical point drying. Bead surface image, 2.0 kV, magnification x40,000, 0.6
cm = 100 nm……………………………………………………………………….102
Figure 21 - (A) Scanning electron micrograph showing fresh Sepharose CL-6B post-
critical point drying. Whole bead image, 2.0kV, magnification x400, 0.6 cm=10 µm.
(B)Scanning electron micrograph showing fresh Sepharose CL-6B post-critical point
drying. Bead surface image, 2.0 kV, magnification x40,000, 0.6 cm=100 nm……103
Figure 22 - (A) Scanning electron micrograph showing fresh Sepharose 6 Fast Flow
post-critical point drying. Whole bead image, 2.0kV, magnification x700, 0.9 cm =
10 µm. (B) Scanning electron micrograph showing fresh Sepharose 6 Fast Flow
post-critical point drying. Bead surface image, 2.0 kV, magnification x40,000, 0.6
cm = 100 nm………………………………………………………………………104
Figure 23 – (A) Scanning electron micrograph showing fresh Q-Sepharose High
Performance post-critical point drying. Whole bead image, 2.0kV, magnification
x430, 0.6 cm = 10 µm. (B) Scanning electron micrograph showing fresh Q-
Sepharose High Performance post-critical point drying. Bead surface image, 2.0 kV,
magnification x33,000, 0.4 cm = 100 nm…………………………………………105
Figure 24 – (A) Scanning electron micrograph showing fresh MabSelect Xtra post-
critical point drying. Whole bead image, 2.0kV, magnification x670, 1 cm = 10 µm.
(B) Scanning electron micrograph showing fresh MabSelect Xtra post-critical point
drying. Bead surface image, 2.0 kV, magnification x40,000, 0.6 cm = 100 nm…106
Figure 25 – (A) Scanning electron micrograph showing fresh Capto Q post-critical
point drying. Whole bead image, 2.0kV, magnification x220, 3 cm = 100 µm. (B)
Scanning electron micrograph showing fresh Capto Q post-critical point drying.
Bead surface image, 2.0 kV, magnification x40,000, 0.6 cm = 100 nm………..107

15
Figure 26 – Column graph showing average pore count for all nine resins – CA
(Capto Adhere), CQ (Capto Q), MS (MabSelect), MSX (MabSelect Xtra), Q-HP (Q-
Sepharose High Performance), S4FF (Sepharose 4 Fast Flow), S6FF (Sepharose 6
Fast Flow), SCL4B (Sepharose CL4B), SCL6B (Sepharose CL6B) - the total number
of enclosed black pixels (pores) were calculated by the ImageJ software for 3 images
of each resin. The averages are plotted with their standard deviations……………112
Figure 27 – Column graph showing average pore size in nm2 for all nine resins – CA
(Capto Adhere), CQ (Capto Q), MS (MabSelect), MSX (MabSelect Xtra), Q-HP (Q-
Sepharose High Performance), S4FF (Sepharose 4 Fast Flow), S6FF (Sepharose 6
Fast Flow), SCL4B (Sepharose CL4B), SCL6B (Sepharose CL6B) - the areas of all
enclosed black pixels (pores) were calculated by the ImageJ software for 3 images of
each resin. The averages are plotted with their standard deviations. Pore diameters
are calculated based on the area of a circle πr2……………………………………113
Figure 28 – Column graph showing average apparent porosity in % for all nine
resins – CA (Capto Adhere), CQ (Capto Q), MS (MabSelect), MSX (MabSelect
Xtra), Q-HP (Q-Sepharose High Performance), S4FF (Sepharose 4 Fast Flow), S6FF
(Sepharose 6 Fast Flow), SCL4B (Sepharose CL4B), SCL6B (Sepharose CL6B) –
ImageJ counts the total number of black pixels (pores) against the total number of
pixels in the image and calculates this as a percentage. This was done on 3 images of
each resin. The averages are plotted with their standard deviations………………114
Figure 29 – Column graphs showing pore size distribution of Capto Adhere resin.
(A) Graph showing the distribution of pores up to 1e05 nm2. The graph shows that
>97% of the pores are less than 10000 nm2. (B) Graph showing the size distribution
of pores up to 10000 nm2. The graph shows that ~70% of the pores are less than
1000 nm2 in size. 1000nm2 ≈ 36nm (diameter) based on conversion πr2………….115
Figure 30 - Pressure-flow plot for Capto Q run 3 – asymmetry 1.23 (see table 15).
The flow rate was gradually increased until a 35kPa increase in pressure drop was
seen as described in Tran et al., 2007. This was continued until at least 50ml/min
(~1500 cm/hr) before it was determined that there would be no critical velocity value
recorded as no runaway pressure rise was observed. 1500 cm/hr was deemed to be a

16
linear velocity that was more than sufficient to observe a runaway rise in pressure
drop without compromise to the AKTA system which had a limit of 100 ml/min
(~3000 cm/hr) and a maximum operating pressure of 20 MPa……………………133
Figure 31 – (a) Pressure-flow plot showing 3 repeats for Sepharose 6FF (6% cross-
linked agarose) (one solid line, one dashed line, one dotted line). (b) Pressure-flow
plot showing averages of 3 out of the 9 resins – Sepharose CL-4B (4% cross-linked
agarose) (squares), Sepharose 6FF (6% cross-linked agarose) (circles) and Capto Q
(7% highly cross-linked agarose) (triangles). Error bars representing pressure and
flow rate are +/- one standard deviation taken from the 3 repeats………………...136
Figure 32 – Critical velocity for each resin obtained using the pressure-flow
technique in an XK16 column, bed height 15cm. Each bar represents an average of
the point before column failure. The error bars represent the standard deviation of 3
repeats of each resin. Capto Q - µcrit 492 cm/hr (7% highly cross-linked agarose),
Capto Adhere - µcrit 477 cm/hr (7% highly cross-linked agarose), MabSelect - µcrit
423 cm/hr (6% highly cross-linked agarose), MabSelect Xtra - µcrit 403 cm/hr (6%
highly cross-linked agarose), Q Sepharose HP - µcrit 353 cm/hr (6% cross-linked
agarose), Sepharose 6FF - µcrit 348 cm/hr (6% cross-linked agarose), Sepharose CL-
6B - µcrit 283 cm/hr (6% cross-linked agarose), Sepharose 4FF - µcrit 204 cm/hr
(4% cross-linked agarose), Sepharose CL-4B - µcrit 149 cm/hr (4% cross-linked
agarose)………………………………………………………………………….137
Figure 33 – Schematic of DMA methodology. The lid is equipped with a sensor that
records the initial height of the sample. When the methodology is started the
descending lid applies a sinusoidal force of 100 mN to the sample, causing the slurry
to deform and move around the sides of the lid. Strain (slurry displacement) is
recorded with time. A strain versus time plot is generated by the Pyris Manager
software and the slope of the line before ultimate compression determines the slurry
deformation rate……………………………………………………………………141
Figure 34 - (a) Strain v time plot for 3 repeats of Sepharose CL-4B (4% cross-linked
agarose) (one solid line, one dashed line, one dotted line). (b) Averages for 3 out of 9
resins – Capto Q (7% highly cross-linked agarose) (diamonds), MabSelect Xtra (6%
17
cross-linked agarose) (triangles) and Sepharose CL-4B (4% cross-linked agarose)
(circles). Error bars representing strain are standard deviations taken from the 3
repeats of each resin. Shapes and error bars are plotted once every 250 data
points………………………………………………………………………………142
Figure 35 – (a) SDR for all 9 resins. For all resins, the gradient of the lines for all
three repeats are taken and averaged. The bar represents the average value and the
error bars are standard deviations based on the three repeats. (b) Parity plot – Slurry
resistance. The values are obtained by calculating 1/SDR values obtained for all 9
resins. This can then be better compared to figure 32 as it also emphasises further the
difference between the more rigid resins compared to the less rigid……………143
Figure 36 - (a) SDR values shown in figure 8(a) plotted against ucrit values shown in
figure 32. Plot shows strong negative trend (b) Parity plot showing slurry resistance.
Slurry resistance values are calculated as 1/SDR. Plot shows strong positive trend.
Key: 1 – Sepharose CL-4B, 2 – Sepharose 4 Fast Flow, 3 – Sepharose CL-6B, 4 –
Sepharose 6 Fast Flow, 5 – Q-Sepharose High Performance, 6 – MabSelect Xtra, 7 –
MabSelect, 8 – Capto Adhere, 9 – Capto Q………………………………………148
Figure 37 – Eli Lilly & Co. process flow chart showing unit operations for the
creation of an IgG4 product. Where the capture and polishing steps feature in the
process is highlighted……………………………………………………………156
Figure 38 - summary of SEM surface images from chapter 3 of fresh resins for
comparative purposes. Q-HP – Q-Sepharose HP, MSX – MabSelect Xtra, CA –
Capto Adhere. 1cm = 400nm……………………………………………………..159
Figure 39 – (A) Scanning electron micrograph showing CIP-exposed MabSelect
(0.5M NaOH). Whole bead image 2.0 kV accelerating voltage, x400 magnification,
3 cm = 50 µm. (B) Scanning electron micrograph showing CIP-exposed MabSelect.
Bead surface image 5.0 kV accelerating voltage, x40, 000 magnification, 3 cm = 500
nm………………………………………………………………………………….160

18
Figure 40 – (A) Scanning electron micrograph showing CIP-exposed MabSelect
Xtra (0.5M acetic acid, 0.1M NaOH). Whole bead image 5.0 kV accelerating
voltage, x1000 magnification, 4.5 cm = 30 µm. (B) Scanning electron micrograph
showing CIP-exposed MabSelect Xtra. Whole bead image close-up 5.0 kV
accelerating voltage, x3600 magnification, 2.5 cm = 5 µm. Circled section clearly
shows surface distinctions……………………………………………………..161
Figure 41 – (A) Scanning electron micrograph showing CIP-exposed MabSelect
Xtra (0.5M acetic acid, 0.1M NaOH). ‘Inner’ bead surface image 5.0 kV accelerating
voltage, x40,000 magnification, 3 cm = 500 nm. (B) Scanning electron micrograph
showing CIP-exposed MabSelect Xtra. ‘Outer’ bead surface image 5.0 kV
accelerating voltage, x40, 000 magnification, 3 cm = 500 nm………………….162
Figure 42 – (A) Scanning electron micrograph showing CIP-exposed Q-HP (1N
NaOH). Whole bead image 5.0 kV accelerating voltage, x270 magnification, 4 cm =
100 µm. (B) Scanning electron micrograph showing CIP-exposed Q-HP. Bead
surface image 5.0 kV accelerating voltage, x40, 000 magnification, 3 cm = 500
nm………………………………………………………………………………….163
Figure 43 – (A) Scanning electron micrograph showing CIP-exposed Capto Adhere
(weak acid, strong base). Whole bead image 5.0 kV accelerating voltage, x330
magnification, 2.5 cm = 50 µm. (B) Scanning electron micrograph showing CIP-
exposed Capto Adhere. Bead surface image 5.0 kV accelerating voltage, x33, 000
magnification, 2.5 cm = 500 nm…………………………………………………164
Figure 44 – (A) Scanning electron micrograph showing aged MabSelect (17 cycles,
IgG4, CHO expression). Whole bead image 2.0 kV accelerating voltage, x3700
magnification, 1 cm = 2 µm. (B) Scanning electron micrograph showing aged
MabSelect. Bead surface image 2.0 kV accelerating voltage, x40, 000
magnification, 1 cm = 200 nm……………………………………………………165
Figure 45 – (A) Scanning electron micrograph showing aged MabSelect Xtra (20
cycles, IgG1). Whole bead image 2.0 kV accelerating voltage, x1000 magnification,
4 cm = 20 µm. (B) Scanning electron micrograph showing aged MabSelect Xtra.

19
Bead surface image 2.0 kV accelerating voltage, x40, 000 magnification, 3 cm =
500 nm……………………………………………………………………………166
Figure 46 – (A) Scanning electron micrograph showing aged Q-HP (64 cycles,
fusion protein, CHO expression). Whole bead image 5.0 kV accelerating voltage,
x270 magnification, 4 cm = 100 µm. (B) Scanning electron micrograph showing
aged Q-HP. Bead surface image 2.0 kV accelerating voltage, x40, 000
magnification, 1 cm = 200 nm……………………………………………………167
Figure 47 – (A) Scanning electron micrograph showing aged Capto Adhere (17
cycles IgG4 CHO expression). Whole bead image 3.0 kV accelerating voltage, x270
magnification, 3.5 cm = 100 µm. (B) Scanning electron micrograph showing aged
Capto Adhere. Bead surface image 2.0 kV accelerating voltage, x40, 000
magnification, 1 cm = 200 nm………………………………………………….168
Figure 48 – Column graphs showing surface properties of MabSelect under fresh,
CIP-exposed and aged conditions. The averages for 3 images were plotted with their
standard deviations. (a) Column graph showing average pore count. (b) Column
graph showing average pore size in nm2. (c) Column graph showing average
apparent porosity in %.............................................................................................176
Figure 49 – Column graphs showing surface properties of MabSelect Xtra under
fresh, CIP-exposed and aged conditions. The averages for 3 images were plotted
with their standard deviations. (a) Column graph showing average pore count. (b)
Column graph showing average pore size in nm2. (c) Column graph showing average
apparent porosity in %. ……………………………………………………………177
Figure 50 - Column graphs showing surface properties of Q-HP under fresh, CIP-
exposed and aged conditions. The averages for 3 images were plotted with their
standard deviations. (a) Column graph showing average pore count. (b) Column
graph showing average pore size in nm2. (c) Column graph showing average
apparent porosity in %. ……………………………………………………………178

20
Figure 51 - Column graphs showing surface properties of Capto Adhere under fresh,
CIP-exposed and aged conditions. The averages for 3 images were plotted with their
standard deviations. (a) Column graph showing average pore count. (b) Column
graph showing average pore size in nm2. (c) Column graph showing average
apparent porosity in %........................................................................................179
Figure 52 – (a) column graph showing critical velocity values of fresh and aged
MabSelect resin (423 and 398 cm/hr respectively). Error bars based on 3 runs. (b)
column graph showing Slurry deformation rate values (SDR) for MabSelect resin
under fresh, CIP-exposed and aged conditions (0.55, 0.72 and 0.78 %min-1.) Error
bars based on 3 runs……………………………………………………………190
Figure 53 - (a) column graph showing critical velocity values of fresh and aged
MabSelect Xtra resin (403 and 372 cm/hr respectively). Error bars based on 3 runs.
(b) column graph showing Slurry deformation rate values (SDR) for MabSelect Xtra
resin under fresh, CIP-exposed and aged conditions (0.61, 0.67 and 0.86 %min-1.)
Error bars based on 3 runs……………………………………………………….191
Figure 54 - (a) column graph showing critical velocity values of fresh and aged Q-
Sepharose HP resin (353 and 323 cm/hr respectively). Error bars based on 3 runs. (b)
column graph showing Slurry deformation rate values (SDR) for MabSelect resin
under fresh, CIP-exposed and aged conditions (1.1, 1.25 and 1.26 %min-1.) Error
bars based on 3 runs……………………………………………………………….192
Figure 55 - (a) column graph showing critical velocity values of fresh, CIP-exposed
and aged Capto Adhere resin (477, 378 and 368 cm/hr respectively). Error bars
based on 3 runs. (b) column graph showing Slurry deformation rate values (SDR) for
Capto Adhere resin under fresh, CIP-exposed and aged conditions (0.52, 0.8 and 0.9
%min-1.) Error bars based on 3 runs……………………………………………….193
Figure 56 – Parity plot - Slurry resistance vs critical velocity for Capto Adhere. The
square represents fresh resin, the diamond represents CIP-exposed resin and the
circle represents aged resin………………………………………………………194

21
Figure 57 - SEM micrographs of fresh Capto Adhere post- critical point drying used
for quantitative analysis…………………………………………………………..230
Figure 58 - SEM micrographs of fresh Capto Q post- critical point drying used for
quantitative analysis………………………………………………………………231
Figure 59 – SEM micrographs of fresh MabSelect post- critical point drying used for
quantitative analysis……………………………………………………………232
Figure 60 - SEM micrographs of fresh MabSelect Xtra post- critical point drying
used for quantitative analysis……………………………………………………233
Figure 61 - SEM micrographs of fresh Q-Sepharose High Performance post- critical
point drying used for quantitative analysis……………………………………..234
Figure 62 - SEM micrographs of fresh Sepharose 4 Fast Flow post- critical point
drying used for quantitative analysis……………………………………………235
Figure 63 – SEM micrographs of fresh Sepharose 6 Fast Flow post- critical point
drying used for quantitative analysis…………………………………………….236
Figure 64 – SEM micrographs of fresh Sepharose CL-4B post- critical point drying
used for quantitative analysis……………………………………………………237
Figure 65 – SEM micrographs of fresh Sepharose CL-6B post- critical point drying
used for quantitative analysis…………………………………………………….238
Figure 66 – SEM micrographs of CIP-exposed Capto Adhere used for quantitative
analysis…………………………………………………………………………….239
Figure 67 – SEM micrographs of CIP-exposed MabSelect used for quantitative
analysis……………………………………………………………………………240

22
Figure 68 - SEM micrographs of CIP-exposed MabSelect Xtra (inner surface) used
for quantitative analysis…………………………………………………………..241
Figure 69 – SEM micrographs of CIP-exposed MabSelect Xtra (outer surface) used
for quantitative analysis………………………………………………………….242
Figure 70 – SEM micrographs of CIP-exposed Q-Sepharose High Performance used
for quantitative analysis………………………………………………………….243
Figure 71 – SEM micrographs of aged Capto Adhere used for quantitative
analysis……………………………………………………………………………244
Figure 72 – SEM micrographs of aged MabSelect used for quantitative analysis...245
Figure 73 – SEM micrographs of aged MabSelect Xtra used for quantitative
analysis…………………………………………………………………………….246
Figure 74 – SEM micrographs of aged Q-Sepharose High Performance used for
quantitative analysis……………………………………………………………….247
Figure 75 – Slurry resistance vs critical velocity for MS (red), MSX (blue) and QHP
(green). The squares represent fresh resin data and the circles represent aged resin
data………………………………………………………………………………..248

23
List of tables Page
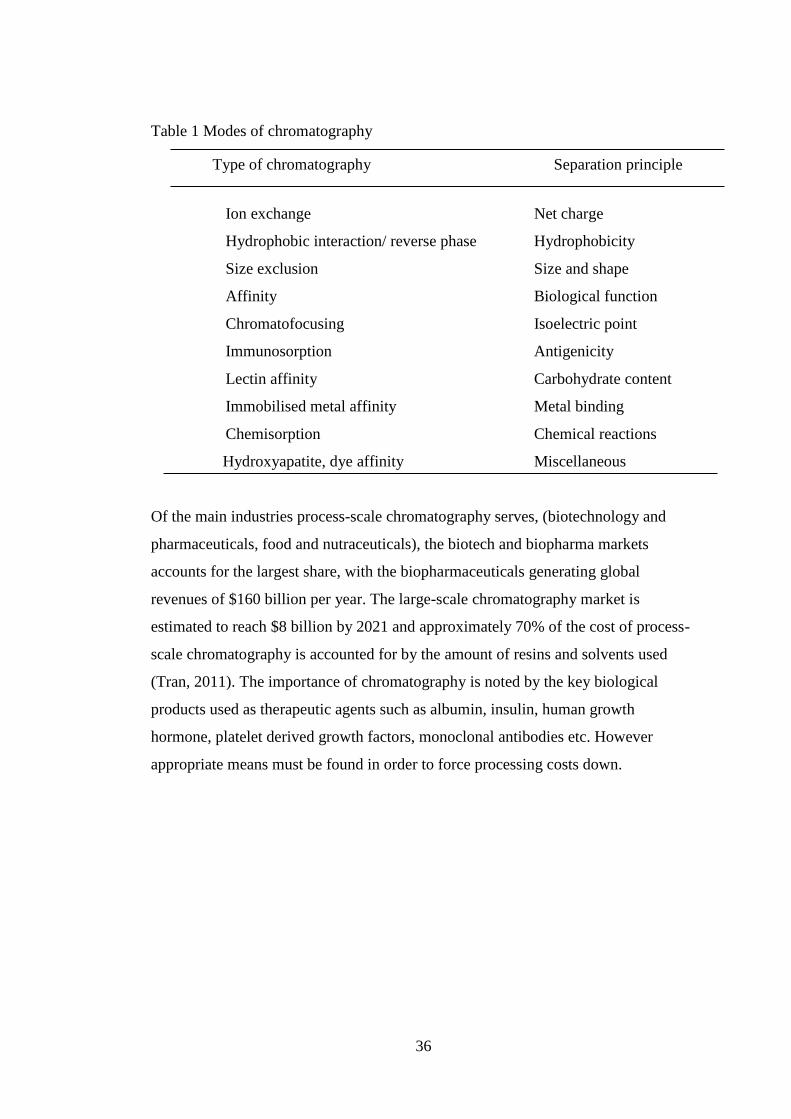
Table 1 Modes of chromatography………………………………………………….36
Table 2 Ideal base matrix compositional properties………………………………...41
Table 3 Typical base materials used in the formation of chromatography media….41
Table 4 The complexities associated with the accurate modelling of adsorption
(Rabe, Verdes and Seeger,2011)……………………………………………………53
Table 5 Parameters associated with the quantification of resin lifetime……………55
Table 6a Steps involved in the implementation of QbD/PAT………………………57
Table 6b showing techniques that can be used to meet certain QbD initiatives and
their extent of use/maturity in research. Green indicates high usage, yellow- medium,
blue- low (novel tools)………………………………………………………………59
Table 7 Packing flowrates for Sepharose 4FF, Sepharose 6FF, Q-Sepharose HP,
MabSelect and Capto Q……………………………………………………………..74
Table 8 Factors for consideration when choosing drying conditions for agarose-based
chromatography resins under scanning electron microscopy (SEM)……………….85
Table 9 Factors for consideration when choosing critical point drying or freeze
drying as a drying technique for agarose-based chromatography resin
*Optional; Sample can be fast-frozen in e.g. liquid nitrogen prior to freeze drying
**Selected conditions
***Can go down to as low as >-80˚for very delicate sample……………………….92
Table 10 Advantages of using ImageJ software package…………………………110

24
Table 11 Pore size distributions up to 100000nm2 (≈d360nm based on area of a circle
πr2.) On average, 95% of all pores within 100000nm2 are ≤10000nm2
(≈d100nm)…………………………………………………………………………116
Table 12 Pore size distributions up to 10000nm2 (≈d100nm based on area of a circle
πr2.) On average, over 70% of all pores within 10000nm2 are ≤1000nm2
(≈d36nm)……………………………………………………………………….116
Table 13 Pore size distributions up to 1000nm2 (≈d36nm based on area of a circle
πr2.) On average, almost 100% of all pores within 1000nm2 are ≤100nm2
(≈d10nm)…………………………………………………………………………117
Table 14 Summary table characterising the bead surface structure of the nine resins
used in this study relative to each other, based on 4 properties – pore count, pore
size, apparent porosity, pore size distribution. A green box represents relatively high
values for the assigned category, yellow represents mid-range values and blue
represents low values. The asterisk shows the resin that reported the highest/lowest
value for the given property………………………………………………………122
Table 15 Asymmetry results showing 3 repeats/runs for Capto Q, Sepharose CL-6B
(SCL6B), Sepharose 4 Fast Flow (S4FF) and MabSelect in an XK16 column, bed
height 15cm. N/A* indicates that no critical velocity value was recorded for the
associated run. The flow rate was increased in a step-wise fashion until at least
50ml/min (~1500 cm/hr) before it was determined that there would be no critical
velocity value recorded. The column consequently had to be repacked until an
asymmetry below 1.2 was achieved……………………………………………….132
Table 16 Troubleshooting methods used in an attempt to achieve an asymmetry
below 1.2. All methods resulted in a slight increase to the asymmetry value however
a value below 1.2 was not obtained. A maximum of two troubleshooting methods
were employed on each resin as to not cause any mechanical damage. All columns
were repacked until an asymmetry of >1.2 was achieved…………………………132
25
Table 17 Process conditions for aged resins – MabSelect & Capto Adhere, Q-
Sepharose High Performance and MabSelect Xtra. The table provides information on
the number of cycles, the column size used, buffer/CIP conditions, the product and
mode of expression………………………………………………………………157
Table 18 Process conditions for resins exposed to buffers only (CIP conditions) -
MabSelect & Capto Adhere, Q-Sepharose High Performance and MabSelect Xtra.
All experiments were carried out for 50 cycles. 1ml HiTrap columns from GE
Healthcare (Uppsala, Sweden) were used for MS, MSX and Q-HP and 45ml of CA
material was supplied by Eli Lilly & Co………………………………………….158
Table 19 - Pore size distributions of CIP –exposed resins up to 100000nm2
(≈d360nm based on area of a circle πr2.) On average, 99% of all pores within
100000nm2 are ≤10000nm2 (≈d100nm)…………………………………………180
Table 20 Pore size distributions of CIP-exposed resins up to 10000nm2 (≈d100nm
based on area of a circle πr2.) On average, over 70 % of all pores within 10000nm2
are ≤1000nm2 (≈d36nm)…………………………………………………………180
Table 21 Pore size distributions of CIP-exposed resins up to 1000nm2 (≈d36nm
based on area of a circle πr2.) On average, about 80% of all pores within 1000nm2
are ≤100nm2 (≈d10nm). Note: pores smaller than approx. 7nm were not detected by
the ImageJ software………………………………………………………………181
Table 22 Pore size distributions of aged resins up to 100000nm2 (≈d360nm based on
area of a circle πr2.) On average, 99% of all pores within 100000nm2 are ≤10000nm2
(≈d100nm)…………………………………………………………………………182
Table 23 Pore size distributions of aged resins up to 10000nm2 (≈d100nm based on
area of a circle πr2.) On average, over 75 % of all pores within 10000nm2 are
≤1000nm2 (≈d36nm)………………………………………………………………182
Table 24 - Pore size distributions of CIP-exposed resins up to 1000nm2 (≈d36nm
based on area of a circle πr2.) On average, over 75% of all pores within 1000nm2 are

26
≤100nm2 (≈d10nm). Note: pores smaller than approx. 7nm were not detected by the
ImageJ software……………………………………………………………………183
Table 25 Summary table characterising the bead surface structure of the 4 resins
used in this study – MabSelect, MabSelect Xtra, Q-Sepharose HP and Capto Adhere
under 3 conditions – fresh, CIP-exposed and aged. The surfaces are characterised
based on 4 properties – pore count, pore size, apparent porosity, pore size
distribution. A green box represents relatively high values for the assigned category,
yellow represents mid-range values and blue represents low values. The asterisk
shows the resin that reported the highest/lowest value for the given property….188
Table 26 Slurry resistance values for MabSelect, MabSelect Xtra, Q-Sepharose HP
and Capto Adhere under fresh, CIP-exposed and aged conditions. The slurry
resistance value is the inverse of the SDR value, 1/SDR. *The standard deviation is
0.05 for all apart from aged MabSelect and aged Capto Adhere (+/- 0.1)………194
Table 27 Statistical analysis showing whether there is significance between results
for fresh and aged resin using the pressure-flow and DMA techniques. Blue indicates
that both techniques show agreed significance of results and therefore prove the
same hypothesis. Red indicates the opposite……………………………………..200
Table 28 Statistical analysis of results for Capto Adhere. The table shows the
significance values for the results comparing fresh to CIP-exposed CA and CIP-
exposed CA to aged for both pressure-flow and DMA. Blue indicates that both
techniques show agreed significance and therefore prove the same hypothesis…..200
Table 29 Statistical analysis of DMA results for MabSelect, MabSelect Xtra and Q-
Sepharose HP comparing fresh- CIP-exposed conditions and CIP-exposed- aged
conditions for each resin…………………………………………………………201

27
List of abbreviations and notations
AEX – Anion exchange
AFM – Atomic force microscopy
As - Asymmetry
CA – Capto Adhere
CEX- Cation exchange
CHO – Chinese hamster ovary
CIP – Clean-in-place
CLSM – Confocal laser scanning microscopy
CPD – Critical point drying
CPP – critical process parameter
CQ – Capto Q
CQA – Critical quality attribute
CV – Column volume
DBC – Dynamic binding capacity
DMA – Dynamic mechanical analysis
DSP – Downstream processing
EM – Electron microscopy
FD – Freeze drying
HCP – Host cell protein
HETP – Height equivalent to a theoretical plate
HIC – Hydrophobic interaction chromatography
Hz – Hertz
IEX – Ion exchange
ISEC – Inverse size exclusion chromatography
kPa – Kilopascal
mAb – Monoclonal antibody
MPa – Mega pascal
MS – MabSelect
MSX – MabSelect Xtra
NaCl – Sodium chloride
NaOH – Sodium hydroxide
PAT – Process analytical technology

28
PF – pressure-flow
QbD – Quality by Design
Q-HP – Q-Sepharose High Performance
QTPP – Quality target product profile
S4FF – Sepharose 4 Fast Flow
SCL4B – Sepharose CL-4B
SCL6B – Sepharose CL-6B
SDR – Slurry deformation rate
SEM – Scanning electron microscopy
SMA – Steric mass action
TEM – Transmission electron microscopy

29
List of publications
Nweke, MC., Turmaine, M., McCartney, RG., Bracewell, DG., Drying techniques
for the visualisation of agarose-based chromatography media by scanning electron
microscopy, Biotechnology Journal (2016), 12, 1600583 (Relates to chapter 3)
Nweke, MC., McCartney, RG., Bracewell, DG., Mechanical characterisation of
agarose-based chromatography resins for biopharmaceutical manufacture, Journal of
Chromatography A (2017), v.1530, p.129-137 (Relates to chapter 4)
Conference presentations
European Synopsis on Biochemical Engineering Sciences (ESBES), Dublin 2016:
Oral presentation - Techniques for chromatography resin characterisation to analyse
lifetime and performance during biopharmaceutical manufacture.
The Engineering and Physical Sciences Research Council (EPSRC) Centre meeting,
London 2016: Poster presentation - Techniques for chromatography resin
characterisation to analyse lifetime and performance during biopharmaceutical
manufacture.

30
INTRODUCTION
-
Research aims and objectives
This research aims to understand and characterise the structural and mechanical
differences between a range of resins as a means of establishing a set of tools that
can be used to assess changes that occur as agarose-based chromatography resins are
exposed to different bioprocessing conditions to better understand the mechanisms
by which different resins age. This will potentially facilitate timely and improved
decisions in large-scale chromatographic operations, maximising resin lifetime whist
maintaining acceptable column performance. The resins (outlined below) were
selected as they are used frequently in the sponsoring company, Eli Lilly and readily
available in-house. The expected output is a mechanistic understanding of the
deterioration of the studied chromatography by studying a range of research
objectives.
Objectives
Ultrastructural visualisation and qualification of a range of commercially
available agarose-based chromatography media
Quantification of the observed ultrastructural properties
To fulfil these objectives, the use of scanning electron microscopy (SEM) will be
employed as a high-resolution imaging technique to visualise the surface properties
of nine commercially available agarose-based chromatography media with different
% agarose content - Sepharose CL-4B, Sepharose CL-6B, Sepharose 4 Fast Flow,
Sepharose 6 Fast Flow, Q-Sepharose High Performance, MabSelect Xtra,
MabSelect, Capto Adhere and Capto Q. The four properties used for characterisation
purposes are pore size, pore size distribution, apparent porosity and pore count.
ImageJ software will be employed for quantitative analysis of these properties.
Quantification of the mechanical properties of the resins
The traditionally used technique - pressure-flow – will be used to investigate how
mechanical properties of the nine resins vary. In this procedure, an XK16 column at

31
15 cm bed height is used. The fluid flow rate is manually increased until a runaway
rise in the pressure profile is observed. This is the point at which the column has
‘failed’ and is termed the critical velocity. This will provide an indication of the
mechanical robustness of each resin. The quantity of resin and buffers used, as well
as the stringent packing criteria necessary for pressure-flow characterisation mean
that an additional mechanical characterisation tool that addresses these limitations
will need to be investigated. The use of dynamic mechanical analysis (DMA) is
employed for this purpose. It measures the mechanical properties of resins based on
the viscoelasticity of a 1ml sample of slurry and will be correlated with pressure-
flow results to ascertain whether it can be used as a small volume, high-throughput
technique for the mechanical characterisation of chromatography media.
The use of these tools to investigate structural and mechanical properties of a
selection of these resins exposed to varying bioprocessing conditions.
SEM, pressure-flow characterisation and DMA will be used to assess the structural
and mechanical changes observed in resins exposed to different bioprocessing
conditions. A selection of 2 resins used at capture stage and 2 resins used post-
capture (MabSelect, MabSelect Xtra, Q-Sepharose HP and Capto Adhere) will be
exposed to repeated cycles of buffer only conditions (CIP-exposed) and aged
conditions (resins used for lifetime studies in the production of monoclonal
antibodies). They will then be structurally and mechanically analysed and the results
will be compared to their non-processed (fresh) counterparts. Statistical analysis will
also be employed to determine the significance of these results and to ascertain
whether DMA can be used to mechanically characterise bioprocessed resins.
32
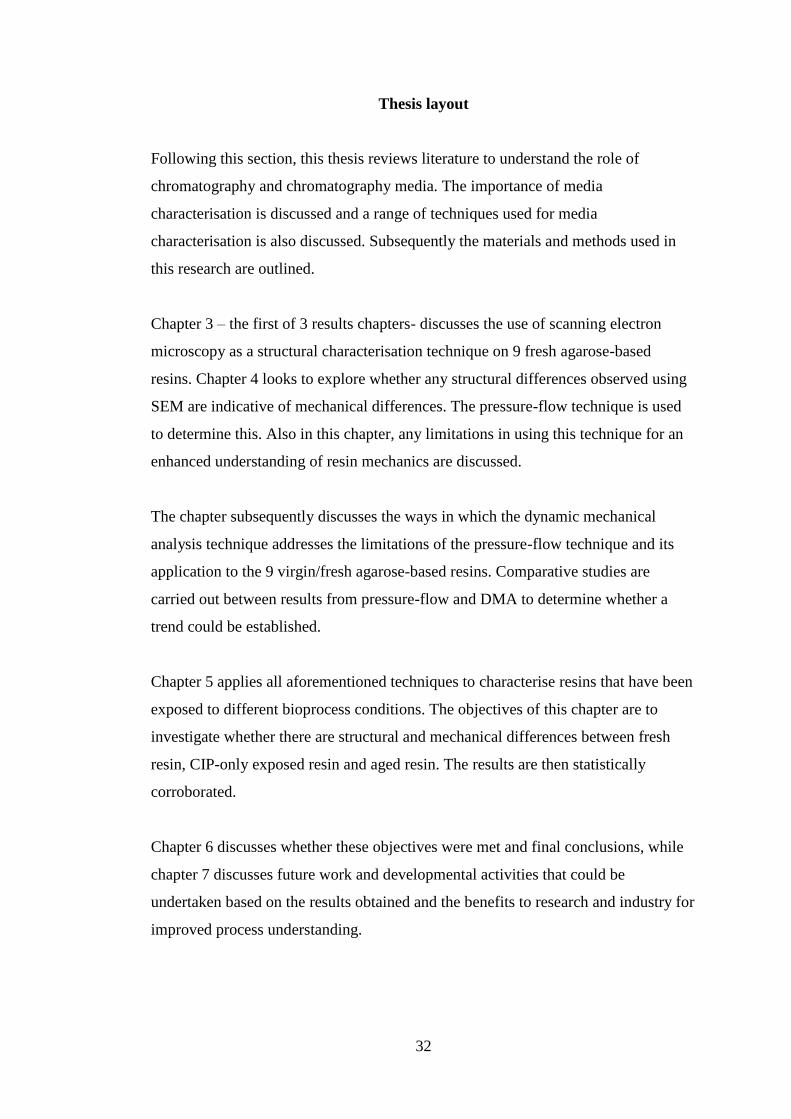
Thesis layout
Following this section, this thesis reviews literature to understand the role of
chromatography and chromatography media. The importance of media
characterisation is discussed and a range of techniques used for media
characterisation is also discussed. Subsequently the materials and methods used in
this research are outlined.
Chapter 3 – the first of 3 results chapters- discusses the use of scanning electron
microscopy as a structural characterisation technique on 9 fresh agarose-based
resins. Chapter 4 looks to explore whether any structural differences observed using
SEM are indicative of mechanical differences. The pressure-flow technique is used
to determine this. Also in this chapter, any limitations in using this technique for an
enhanced understanding of resin mechanics are discussed.
The chapter subsequently discusses the ways in which the dynamic mechanical
analysis technique addresses the limitations of the pressure-flow technique and its
application to the 9 virgin/fresh agarose-based resins. Comparative studies are
carried out between results from pressure-flow and DMA to determine whether a
trend could be established.
Chapter 5 applies all aforementioned techniques to characterise resins that have been
exposed to different bioprocess conditions. The objectives of this chapter are to
investigate whether there are structural and mechanical differences between fresh
resin, CIP-only exposed resin and aged resin. The results are then statistically
corroborated.
Chapter 6 discusses whether these objectives were met and final conclusions, while
chapter 7 discusses future work and developmental activities that could be
undertaken based on the results obtained and the benefits to research and industry for
improved process understanding.

33
CHAPTER 1 LITERATURE REVIEW

34
1. LITERATURE REVIEW
This literature review is structured to address the underlying principles that are
covered in this research. The understanding of chromatography resin aging first
requires comprehension of the column, its components and factors that affect
performance before, during and post-operation.
In this literature review the history of chromatography in bioprocessing is briefly
addressed, as well as its role, importance and various modes of operation. The
components that constitute a column are also outlined and the role of
chromatography resins is highlighted. A description of how agarose-based
chromatography resins are manufactured is also provided as a basis for
understanding the structural properties of the resins used in this study. The section
on chromatographic operation is designed to take the reader through the different
stages of purification, starting with packing. Subsequently, the structure-diffusion
relationships and adsorption are discussed as a means of demonstrating the various
stresses the column is exposed to during operation. This section concludes with resin
lifetime and aging, which discusses the effects of repeated process conditions on the
column and individual beads.
This leads on to highlight the importance of resin characterisation to meet both
economic and regulatory needs, with particular emphasis on the need for established
mechanical and structural characterisation techniques at industrial-scale. Currently
used mechanical and structural characterisation techniques in research are
subsequently discussed. This section is split into microscopy techniques (structural
characterisation), chromatographic techniques and further techniques reported in
literature for mechanical characterisation of chromatography media.

35
1.1.Chromatography in bioprocessing
Chromatography is a separation technique for biological molecules used to identify,
quantify and/or remove impurities in substances. In 1900 the Russian scientist,
Mikhail Tsvet, was the first to employ chromatography as a separation technique for
the separation of plant pigments such as chlorophyll and carotenes, on the basis of
colour disparity. During the 1940s and 1950s, the technique was developed further
by Archer John Porter Martin and Richard Laurence Millington Synge, who
established the techniques of partition chromatography and inspired the development
of paper, gas and high performance liquid chromatography (Giddings and Keller,
2014).
It is now widely employed throughout the bioprocessing industry for the purification
of biopharmaceuticals (Bahme, H. -J, P. Hedman, 2002). At large-scale, there are
many modes of operation are employed (table 1). In the food industry,
chromatography is used as a means of quality control by separating and analysing
preservatives, additives, vitamins, amino acids and proteins (Rathore and Kapoor,
2016). It is used in environmental testing laboratories to separate trace quantities of
contaminants such as DDT in groundwater PCBs in waste oil, the purification of
drinking water and the testing of air quality. Mixed-mode chromatography is used
widely as a polishing step and refers to a method that uses more than one form of
interaction (e.g. ion exchange and hydrophobic) to achieve higher selectivity and
thus better separation.
36
Table 1 Modes of chromatography
Ion exchange Net charge
Hydrophobic interaction/ reverse phase Hydrophobicity
Size exclusion Size and shape
Affinity Biological function
Chromatofocusing Isoelectric point
Immunosorption Antigenicity
Lectin affinity Carbohydrate content
Immobilised metal affinity Metal binding
Chemisorption Chemical reactions
Hydroxyapatite, dye affinity Miscellaneous
Of the main industries process-scale chromatography serves, (biotechnology and
pharmaceuticals, food and nutraceuticals), the biotech and biopharma markets
accounts for the largest share, with the biopharmaceuticals generating global
revenues of $160 billion per year. The large-scale chromatography market is
estimated to reach $8 billion by 2021 and approximately 70% of the cost of process-
scale chromatography is accounted for by the amount of resins and solvents used
(Tran, 2011). The importance of chromatography is noted by the key biological
products used as therapeutic agents such as albumin, insulin, human growth
hormone, platelet derived growth factors, monoclonal antibodies etc. However
appropriate means must be found in order to force processing costs down.
Type of chromatography Separation principle

37
1.2.Components of column chromatography
Column chromatography is comprised mainly of the following elements (figure 2):
- Column
- Stationary phase (section 1.3)
- Mobile phase
Other elements include:
- Fraction collection
- Pumping and detection system
- Solvent reservoirs
Figure 2 Industrial chromatography unit. (a) Schematic diagram (b) Chromatography
column adapted from (Bio-Rad Laboratories, 2014)
Columns, as the name suggests, are cylindrical apparatuses. Smaller columns are
usually made of borosilicate glass and larger columns are usually made of stainless
steel (Clark, 2007). The physical column itself has a fixed length but attached is
usually a variable end piece to adjust the bed length, so as to prevent dead spaces in
the stationary phase, which could lead to back-mixing, reducing process
performance.

38
Large-scale prepacked columns come readily available for use in manufacturing
however are limited in packed bed height, resin type and column diameter. There is
potential for growth in this area, however a number of limitations should be revised
if it is to be as widely employed as non-prepacked options (Grier and Yakubu, 2016)
The mobile phase is also referred to as the eluent. It is chosen based on its ability to
separate compounds effectively and provide the conditions under which separation
can take place. In column chromatography, the mobile phase is largely the buffer
system and this can vary depending on the mode of chromatographic operation. A
buffer system is usually comprised of an equilibration buffer, an elution buffer, a
wash buffer or regeneration buffer, a Clean-in-place (CIP) buffer and in some cases,
deionised water.

39
1.3.The role of resins
Resins play the vital role in column chromatography. They can also be referred to as
the stationary phase, the matrix, the column packing or the adsorbent. They are small
bead particles that are provided in the form of slurry, approximately 100µm in size
per bead, and prior to use are assumed spherical (figure 3). This slurry is poured into
the column and allowed to settle to give a measured bed height. During operation
resins are responsible for separating biological impurities such as host-cell proteins
(HCPs), oligomers and nucleic acids from a target biologics, such as monoclonal
antibodies, which must be purified to very high levels (often >99%) (Chochois et al.,
2011).
There are a number of properties that are considered ideal for base matrices (table 2).
Furthermore, manufacturers must ensure that chromatography media meet a broad
range of requirements before use for the separation/purification of biological
products. These requirements include a number of safety considerations (leachables,
toxicology), performance (capacity, specificity, throughput), cost (capital
investment, longevity) and stability, among others (Ioannidis, 2009). Stability can be
split broadly into two categories – chemical and mechanical. The chemical resistance
of chromatography media is dependent on the coupling chemistry as well as the
choice of spacer and ligand chemistry and stability. Whereas, the mechanical
stability is dependent largely on the choice and composition of the base material,
particle size distribution, particle porosity, and to a lesser extent, ligand and ligand
deployment (Jagschies, Sofer and Hagel, 2008; Andersson, 2014).
The base material is chosen based on a number of factors such as cost, the properties
of the material to be processed and surface area and mass transfer characteristics,
giving rise to parameters such as dynamic binding capacity (DBC) maximum flow
rates, maximum number of cycles etc. Based on this, different manufacturers use
different composite materials for their chromatographic media (Jungbauer, 2005).
There are a number of base materials that can be used in the formation of resin beads
(table 3)

40
Figure 3 – showing size of typical large-scale column, schematic of resin structure
and scanning electron microscopy (SEM) image of protein A resin prior to
processing.

41
Table 2 Ideal base matrix compositional properties
Table 3 Typical base materials used in the formation of chromatography media
Ideal base matrix compositional properties
Hydrophilic
Large pore size/ surface area
Spherical (mono-sized) particle
Low unspecific adsorption
Easy to functionalise
Reusability and low cost
Chemically stable
Mechanically stable
Typical base materials for chromatography media
Agarose
Cellulose
Ceramics
Dextran
Polystyrene
Polyacrylamide
Silica
Synthetic/organic polymers

42
1.3.1. Agarose-based resins
Agarose is a commonly used base matrix material in biopharmaceutical purification
as it relatively straightforward to manufacture and customise certain properties such
as porosity and specific binding properties. Although resin manufacturing is not a
study objective, it is important to understand these principles in relation to the
mechanical properties of resins. Agarose is one of two main constituents of agar and
is generally extracted from seaweed. It is composed of a polysaccharide polymer
material formed of repeating units of 1-3-linked β-D galactose and 1,4-linked 3,6-
anhydro-α-L-galactose (Gerstein, 2004). Once the agar has been processed, the
agarose is in the form of a dry powder. It is then dissolved in an aqueous solution
>85˚C, causing the chains to degrade (Mu, Lyddiatt and Pacek, 2005; Andersson,
2014). When the solution reaches a certain viscosity, it is cooled and poured, whilst
simultaneously being stirred into a non-polar organic solvent which contains an
emulsifier. These conditions induce the formation of spherical beads
(emulsification). The stirring rate is a key parameter in determining certain structural
characteristics such as porosity, pore size distribution and particle size distribution,
which tends to range from 20-300 μm (Jungbauer, 2005) (figure 4).
Figure 4 – General method for making porous agarose beads. The agarose solid is dissolved in
water heated to about 90˚C. This is then added to a stirred vessel containing a hydrophobic
solution (eg. Toluene or mineral oil) together with an emulsifier. The solutions are immiscible
meaning that constant agitation causes the formation of agarose droplets. A surfactant is added to
prevent droplet coalescing. The solution is then cooled to below the gelation point of agarose
(~35˚C) and the beads are then washed, sieved to narrow the size distribution and cross-linked
with a reagent.

43
Upon formation, the beads are insoluble and sediment into the higher density water
phase, as opposed to the organic solvent phase. Any remaining solvent phase is then
removed in a series of washing and sieving steps and the beads are subsequently
cross-linked with a reagent such as epichlorohydrin. The extent to which this is done
is one of the critical factors that determine the rigidity of the matrix. However,
caution must be taken at this step as over-cross-linking may reduce porosity, ligand
deployment and compressibility characteristics (Zhou et al., 2008; Zhou, Ma and Su,
2009). When the process is completed, the resin can be used in various applications
such as size exclusion and desalting. It may alternatively go on to be functionalised
with different ligand chemistries, such as proteins, aromatic groups, non-polar,
charged aliphatic groups etc. (Ioannidis, 2009; Yan et al., 2009; Ioannidis et al.,
2012; Andersson, 2014). Now functionalised, they can be used as ion exchange,
affinity chromatography, hydrophobic interaction chromatography (among others)
and used in various biopharmaceutical applications such as the purification of
monoclonal antibodies (Keller, Friedmann and Boxman, 2001).

44
1.4.Chromatographic operation: Packing
Efficient packing of a column is an important factor for the successful separation of
biopharmaceutical products. The purpose of purification (e.g. capture stages,
intermediate or polishing stages) and elution (whether it be gradient, step or
isocratic) will have an impact on the requirements for column efficiency. Typically,
the greater the bed height and the smaller the particle size, the more influential the
effects of packing become. A well packed column will also provide a stable bed that
will be slow to deteriorate over time (Jagschies, Sofer and Hagel, 2008).
Packing of homogenous chromatography media can be divided into two steps. The
aim of the first step is to produce a homogenous consolidated bed. To achieve this,
the beads are settled at a constant fluid velocity and are packed due to the viscous
drag of the fluid. The selected velocity is dependent on the rigidity of the media and
needs to be low enough in order to prevent particle deformation. Generally, the more
rigid the particle, the higher the flow rate it can withstand. Research has gone into
the stimulation of this consolidation phase by use of computational fluid models to
track individual particles when packing smaller beds (Luo et al., 2002; Hemph et al.,
2007). The studies capture the essential dynamics but are only modelled on very
small-scale (~5mm) columns.
After bed consolidation, the second step is bed compression. The purpose of this step
is to create a stable bed that will not deform if used within the set operation window.
This operation window is chosen based on the elastic properties of the particles due
to fluid stress and wall support (Bemberis, Noyes and Natarajan, 2003).
Compression of the column to its final bed height can be achieved by employing one
(or a combination) of a number of packing methods. Such methods include:
Constant flow
Constant pressure
Suction
Pack-in-place
Axial compression
45
In theory, all columns can be packed using constant flow or pressure methods. If no
packing method is supplied by the manufacturer, the suggested mode of packing is
by constant flow or constant pressure (Cheng, 2009).
Evaluating how well the bed has been packed is important in ensuring bed integrity
during separation. Routinely repeating evaluation tests is recommended in order to
ensure consistent column efficiency. Correlating the specifications of testing
conditions to the required separation performance at certain stages of the purification
process is crucial. For example, a column in capture mode using step elution does
not require the same efficiency specifications as a column in the polishing stage
using isocratic elution (Scharl et al., 2016). It should be noted however, that if the
measured efficiency, pressure drop or peak asymmetry is significantly reduced, this
strongly indicates that the column needs to be repacked. The most commonly
reported methods of column packing evaluation use the step and pulse method, both
of which are measures of residence time distribution (Keener, Maneval and
Fernandez, 2004).
The use of the step method is effective in manufacturing processes in which buffer
salt concentration varies. The efficiency is measured by monitoring changes in
conductivity as the concentration of the buffer is varied from high to low salt (or vice
versa). The shape of the resulting curve is a step which can be likened to frontal
analysis (Kennedy 2003). This analysis is generally performed in-process, and unlike
pulse testing, does not require the input of an additional sample to the column. This
evaluation can only be applied, however, if it has been verified that there is a linear
relationship between changes in tracer concentration and the measured signal that
has been subjected to evaluation.
The most commonly reported method of column evaluation involves adding a pulse.
A pulse is a low molecular weight solute of a narrow sample zone (usually 1-2% v/v
acetone or benzyl alcohol) (Rathore and Kumar, 2017). Subsequently, the values for
zone broadening are then calculated in terms of H (or HETP – height equivalent to a
theoretical plate) and/or peak symmetry (As – asymmetry factor) using the formulae
below (Kennedy 2003) (figure 5):

46
𝑁 = 5.54 (𝑡𝑟
𝑊1/2) 2 (1.1)
Where N – number of plates
tr – retention time of probe molecule
W1/2 – width of peak at one half maximum height
𝐻𝐸𝑇𝑃 = 𝐿
𝑁 (1.2)
Where L – total length of column
𝐴𝑠 = 𝑏
𝑎 (1.3)
Where a – distance from leading edge of peak to midpoint of peak
b – distance from midpoint of peak to trailing edge of peak
A related method is the use of reduced HETP (HETP ÷ mean particle diameter). This
normalizes HETP for particle diameter and is useful when comparing HETPs for
columns with different particle sizes.

47
Figure 5 – pulse testing column evaluation method. (a) the HETP can be calculated
by first calculating N (number of plates) using values from the width of the peak at
half its maximum height (W1/2) and the retention time of the probe molecule (tr). (b)
the asymmetry can be calculated by dividing b by a, where a is the distance from the
leading edge of the peak to the midpoint and b is the distance from the midpoint to
the trailing edge of the peak.
a
Injection
W1/2
h 1/2 h
tr
Injection
h a b 1/10 h
b

48
1.4.1. Structure-diffusion relationships
Post-packing, there are many in-process elements that contribute towards the gradual
deterioration of resins and packed beds over time. In order to understand the factors
that contribute towards performance reduction, it is first important to understand the
interactions that occur between the different phases during column operation. There
are two main areas to consider: the impact of process conditions on the individual
beads and the impact of process conditions on the packed bed as a whole (Rathore
and Kumar, 2017).
Figure 6 – Schematic of an individual chromatography bead showing mass transfer
process of a solute. Binding of a solute to an immobilized ligand contributes to the
rate of reaction at the binding site (not shown). Surface diffusion, pore diffusion and
film diffusion also need to be accounted for at bead level.
Broadly, there are four factors influencing mass transfer at the bead level, namely,
external mass transfer through the film layer around the bead particle (kfilm),
diffusion through the surface (Ds) and the pore (Dpore) of the bead, and reaction rate
at the binding site of an immobilized ligand (figure 6) (Rathore and Kumar, 2017).
Due to the complex nature of the movement of any given solute through a bead, the

49
partial differential equations vary greatly depending on how the movement is
modelled. A complete description of mass transfer models is available in the form of
the general rate model (GRM), which covers kfilm, Ds, Dpore, and reaction rate (von
Lieres and Andersson, 2010). Albeit, a numerical solution of the GRM is still
computationally complex. The past decade has seen a rise in using readily available
numerical solving tools such as chromX and CADET in the application of less
complex models (von Lieres et al., 2014). Such models include the transport
dispersive model (TDM) and the lumped rate model (LRM). In TDM the external
and internal mass transfer factors are combined to create one transfer coefficient
(Hahn et al., 2015) while in LMR reaction rate kinetics and mass transfer factors are
combined into one parameter while pore and surface diffusion is assumed infinite.
Whilst LMR is the simplest computational model used for ion-exchange
chromatography, there still remains other, more simplistic approaches that describe
the in-process interactions in a packed bed during column operation (figure 7).
Figure 7– In-process factors that contribute to the movement of solute through the
packed bed. The effects of flow rate, mobile phase viscosity, resistance to mass
transfer due to pressure equilibriums should also be noted.
50
A more simplistic description of processes at work inside a column accounts for the
time taken for the solute to equilibrate between the stationary and mobile phase
(dissimilar to the plate model, which is based on the assumption that equilibration is
infinitely fast). The resulting shape of a chromatographic peak is therefore affected
by the rate at which elution occurs. It is also affected by the different paths a solute
may travel between particles of stationary phase. If the various mechanisms which
contribute to band broadening are considered, the result is the Van Deemter equation
for plate height (figure 8);
HETP = A + B / u + C u (1.4)
where u is the average velocity of the mobile phase. A, B, and C are factors which
contribute to band broadening (Ioannidis, 2009).
A - Eddy diffusion
As the mobile phase moves through the column, solute molecules will take different
paths through the stationary phase at random. This will bring about broadening of
the solute band, as different paths are of different lengths.
B - Longitudinal diffusion
Analyte concentration is reduced at the edges of the band than at the centre. Analyte
diffuses out from the centre to the edges. This brings about band broadening. High
mobile phase velocity means that the analyte spends less time on the column, which
decreases the effects of longitudinal diffusion.
C - Resistance to mass transfer
The analyte spends a certain amount of time equilibrating between the stationary and
mobile phase. High mobile phase velocity will result in the analyte having a stronger
affinity for the stationary phase. The result of this is that an analyte in the mobile
phase will move ahead of an analyte in the stationary phase, resulting in broadening
of the analyte band. The higher the velocity of mobile phase, the wider band
broadening becomes.

51
Mobile phase velocity
Pla
te h
eigh
t Optimum velocity
Minimum plate height
Figure 8 – Typical van Deemter plot of plate height vs. average linear velocity of mobile
phase. The optimum mobile phase flow rate can be determined.

52
1.4.2. Adsorption
In chromatography, convective flow is what allows for the transport of the mobile
phase through the stationary phase, whereas diffusion governs the transport of
molecules through the porous adsorbent (Ioannidis, 2009). The adsorption of
proteins refers to the reversible adhesion of molecules from the mobile phase to resin
surface (Close, 2015). It is dictated by the thermodynamic interactions that occur
when load material comes into contact with ligands covalently bound to the resin
bead surface. At macroscopic level, components of the feed material distribute
themselves between the stationary and mobile phases. Modelling the theory of
adsorption is complicated for a number of reasons, as explained by Rabe et al. 2011
in table 4. However, there are experimentally- and empirically-derived adsorption
isotherm models available that generically describe the interaction of components
between the mobile phase and stationary phase. The most extensively studied models
can be grouped as Equilibrium models (Mollerup, 2008).
Equilibrium isotherm models assume bound protein concentration at steady state.
There are a number of commonly reported isotherms, including linear, Langmuir,
steric mass action (SMA), preferential interaction quadratic, Freundlich, Brunauer,
Emmet and Teller (BET) etc. The most simple equilibrium model is the linear
isotherm which assumes that the stationary phase is under-challenged, meaning that
there are a large number of free binding sites (Guichon, A and Shirazi, 2006). This is
often seen in analytical chromatography where small amounts of protein are loaded
onto the column. However this is not the case in industrial-scale bioseparations
where the column is loaded to maximum capacity to achieve high productivity
(Tugcu, Roush and Goklen, 2007). The most commonly used isotherm model is the
Langmuir model as it can be extended to deal with more than one
component/complexity (Close, 2015). It is based on four assumptions (Guichon, A
and Shirazi, 2006):
1. The surface of the adsorbent is uniform, i.e. all the adsorption sites are
equivalent
2. Adsorbed molecules do not interact
3. All adsorption occurs through the same mechanism
4. At the maximum adsorption, only a monolayer is formed i.e. molecules of
adsorbate do not deposit on other

53
Generally, single component Langmuir isotherms are used to aid in the
understanding of the impact of a single feature or aspect during chromatographic
operation, as has been reported by Gu et al. 1990 and Sun & Yang 2008.
Multicomponent Langmuir isotherms have been applied to understand competition
between components (Lienqueo, Shene and Asenjo, 2009; Müller-Späth et al., 2011;
Guélat et al., 2012). However, it is yet to be as widely applied as single component
isotherms due to a lack of understanding (Close, 2015).
Table 4 The complexities associated with the accurate modelling of adsorption
(Rabe, Verdes and Seeger, 2011)
Factors affecting the modelling of adsorption
Each molecule contains many electrostatic and hydrophobic groups heterogeneously
distributed throughout the entire protein structure
Proteins are typically asymmetric and so representing them as a sphere is unrealistic.
Proteins often simultaneously interact with multiple binding sites
Cooperative effects from proteins that are already adsorbed means that proteins are
sometimes more likely to adsorb if there are pre-adsorbed proteins.
During adsorption and/or desorption proteins often unfold and change structure,
potentially changing the groups exposed at the surface of the protein.
Due to the similar size of molecules to resin pore diameter, and the range of ionic
strengths encountered, electrostatic force fields can interact causing the local
conditions to vary.
Proteins can also self-associate (aggregate), both in solution and on the stationary
phase, so interactions between components are very important.
Proteins often denature in extreme conditions or due to other components, e.g.
proteases.

54
1.4.3. Resin lifetime and aging
Over repeated cycles of exposure to process conditions, the performance of the resin
will experience a gradual decline over time. Most reports on resin aging tend to
largely focus on quantifying the loss in performance characteristics by measuring
certain parameters such as dynamic binding capacity (DBC), yield, throughput etc.
(table 5) (Siu et al., 2006; Jiang et al., 2009; Gavara et al., 2015; Scharl et al., 2016).
However the reports do not focus enough on the mechanisms by which the resins
age, which lead to a decline in these performance characteristics.
Each report does allude to, however, the fact that selected process conditions largely
determine the speed at which resins will begin to age. The packing process may
cause the column to undergo mechanical compression (Cheng 2009; Bemberis et al.
2003; Keener 2004; Kennedy 2003). Further effects on the column include
differences in pressure throughout the column, hydrodynamic stresses caused by
changes in flow rate and column wall pressures (which are more prevalent with
smaller-width columns) ( (Hemph et al., 2007). These issues lead to column
compression and column plugging, all contributing to packed bed failure (figure 9).
The impact of selected process conditions can also be observed at microscale.
Deposits may become irreversibly bound to the matrix fibres leading to fouling of
the bead surface (Siu et al., 2007). Although the main contributor to the degradation
of matrix fibres is not clear, exposure to strong CIP and regeneration conditions is
highly likely to be the cause, potentially leading to the production of resin fines
(Jiang et al., 2009; Close, 2015).
Whilst reduced DBC and yield are often measured concurrently, it should be noted
that reductions in DBC are related to ligand deterioration factors, whilst reductions
in yield may also be related to previously mentioned factors. A decline in ligand
performance may be occur for a number of reasons such as, leaching of the ligand
off of the matrix, occlusion of the ligand by non-target molecules and inactivation of
the ligand due to possible changes in ligand chemistry post-exposure to process
conditions (Zhang, Xu, et al., 2015).

55
Table 5 Parameters associated with the quantification of resin lifetime
Measurable parameters for determining chromatography resin lifetime
Purity of product Bed height
Impurities (e.g. DNA) Dynamic/static binding capacity
Pressure/ flow rate Packing integrity
Product yield Leachables
Elution profile Ionic capacity (IEX)
Regeneration profile Appearance (microscopy)
Loading profile Productivity
Voidage (inter/intra particle porosity) Adsorption isotherms

56
Figure 9 – Showing possible mechanisms of chromatography resin aging. Column-
scale level changes include changes to packed bed structure. At bead level this could
translate to changes to bead morphology, ligand leaching, ligand occlusion, ligand
inactivation, matrix fouling and damage to matrix fibres, potentially leading to the
production of resin fines

57
1.5.The importance of characterisation
Most Protein A resins are used for ≤100 cycles before a decline in performance
parameters, such as DBC, yield, throughput etc., is observed (table 5). However, the
expected use of these resins is estimated to be at least 3 times higher than its current
usage (Rathore et al., 2015; Hernandez, 2016). The lack of live/real-time tracking
tools present during column operation makes it difficult to monitor column
performance and the column aging process. Furthermore, increased product titres in
recent years has led to heavier burdens on downstream purification, which has meant
that regulatory authorities such as the FDA are requesting for better defined
processes from manufacturers (Hentschel, 2013). The Quality by design approach
(QbD) was introduced into the chemical manufacturing control (CMC) review
process in 2004, followed by Process Analytical technology (PAT) initiatives, both
with the objective of achieving a desired state for pharmaceutical manufacturing
(Rathore, 2009). QbD has been defined in the International Conference on
Harmonization (ICH) Q8 guideline as ‘a systematic approach to development that
begins with predefined objectives and emphasizes product and process
understanding and process control, based on sound science and quality risk
management’ and there are a number of steps involved in the successful
implementation of both QbD and PAT, which involve identifying quality target
product profile (QTPP) and critical quality attributes (CQAs) (table 6a) as
extensively outlined by Rathore & Kapoor 2016.
Table 6a Steps involved in the implementation of QbD/PAT
Steps involved in the implementation of QbD/PAT
Identify QTPP
Identify CQA
Define Product Design Space
Define Process Design Space
Redefine Product Design Space
Define Control Strategy
Process Validation
Process Monitoring

58
Whilst worthwhile and extensive research has been put into the validation and
characterisation of chromatography media via measuring the changes in DBC, yield,
throughput etc., not as much has gone into establishing mechanical and structural
characterisation tools for these resins during and post-processing, as a means of
fulfilling regulatory requirements. Whilst it has been noted that there are a lack of
these tools at large-scale, a number of tools have been employed at research level
that provide high-level structural and mechanical information of chromatography
media during and post-bioprocessing and have shown good potential to be employed
at larger-scales (table 6b).

59
Technique/tool Maturity (references) QbD applications
Microscopy techniques
(SEM, AFM, CLSM,
TEM etc.)
(Linden et al., 1999;
Susanto et al., 2006; Yang,
Shi and Sun, 2006;
Hubbuch and Kula, 2008;
Ioannidis, 2009; Close et
al., 2013; Zhang, Daniels,
et al., 2015)
CQAs/CPPs associated
with product yield and
levels of impurities,
product characterisation
Florescence real-time
monitoring
(Pathak et al., 2017) PAT applications, IPC
testing, process
monitoring
Inter/intra particle
porosity
(Yao and Lenhoff, 2004;
Bacskay, Sepsey and
Felinger, 2014; Sepsey,
Bacskay and Felinger,
2014)
CPPs associated with
voidage and changes to
mass transfer properties
Pressure-flow (Stickel and Fotopoulos,
2001; Tran et al., 2007)
(industry and resin
manufacturers)
CPPs associated with
pressure/ CQAs
associated with
mechanical integrity
Packing: Asymmetry/
HETP
(Bemberis, Noyes and
Natarajan, 2003; Keener,
Maneval and Fernandez,
2004; Dorn et al., 2017;
Kong et al., 2017)
CPPs associated with
packing integrity
X-ray topography (Johnson et al., 2017) PAT applications, IPC
testing, process
monitoring
Mass spectrometry (Thillaivinayagalingam et
al., 2007; Jin et al., 2009;
Laursen, Justesen and
Rasmussen, 2011;
Andersson, 2014; Lintern
et al., 2016)
CQAs associated with
impurity levels, product
characterisation
Micromanipulation (Mu, Lyddiatt and Pacek,
2005; Yan et al., 2009;
Ioannidis et al., 2012)
CQAs/ CPPs associated
with yield and
mechanical integrity
Table 6b – showing techniques that can be used to meet certain QbD initiatives and their extent
of use/maturity in research. Green indicates high usage, yellow- medium, blue- low (novel tools)

60
1.6.Mechanical and structural characterisation techniques
1.6.1. Microscopy techniques
Extensive research has gone into microscopy techniques that best characterise
chromatography media. Examples include: Optical microscopy of agarose beads
(Zhou et al., 2008; Zhou, Ma and Su, 2009), transmission electron microscopy
(TEM) of agarose beads (A Amsterdam, Er-El and Shaltiel, 1975; Attwood, Nelmes
and Sellen, 1988), alongside freeze-fractured agarose gels (Waki, Harvey and
Bellamy, 1982) gel slabs (Griess, Guiseley and Serwer, 1993), confocal laser
scanning microscopy (CLSM) of lipid fouled protein A (Jin et al., 2009) and protein
uptake studies (Linden et al., 2002). Atomic force microscopy (AFM) has also been
employed in the investigation of agarose gel surfaces (Pernodet, Maaloum and
Tinland, 1997; Maaloum, Pernodet and Tinland, 1998; Ioannidis, 2009) and finally
scanning electron microscopy (SEM) has been used in to characterise agarose based
resins (Medin, 1995; Zhou, Ma and Su, 2009; Close et al., 2013) (figure 10). Other
microscopically characterized (SEM) adsorbents include polyacrylamide and dextran
based agarose composite beads (Grimaud et al., 1978).
A commonly reported limitation of microscopy is sample preparation due to the
sensitive nature of hydrogels. It is therefore crucial to choose the least invasive
sample preparation technique to avoid damage to ultrastructural properties.
However, it seems to be the case that the more invasive the sample preparation is,
the better the quality of the images obtained, whether or not the extracted
information is realistic. This is particularly prevalent in SEM and TEM. An example
of this occurrence can be found in a number of pieces of research (A Amsterdam, Er-
El and Shaltiel, 1975; Attwood, Nelmes and Sellen, 1988; Griess, Guiseley and
Serwer, 1993) where sample staining, buffer exchange and sample embedment in
epoxy resin resulted in average quality images whereas, freeze fracturing and freeze-
drying improved the quality of the images (Waki, Harvey and Bellamy, 1982;
Medin, 1995).

61
Figure 10 - Scanning electron microscopy images of A: clean, B: partially fouled. C:
Extensively fouled resin particles. (Close et al., 2013)

62
1.6.2. Chromatographic techniques
The inverse application of size exclusion chromatography (ISEC) also serves as a
method for characterizing the porous structure of chromatographic adsorbents. In the
initial stages of this technique, biomolecules are separated according to their size.
Biomolecules ranging in size are introduced into the column. Molecules larger than
the size exclusion limit of the adsorbent will not enter the pores of the gel and will
quickly pass through the bed. Smaller molecules diffuse in and out of the porous
network and therefore require more time to elute (Masters, 2012). As a result, the
mixture separates in order of decreasing molecular size and the pore size and pore
size distribution of the adsorbent can be determined. ISEC analysis of the adsorbent
structure requires priori selection of a physical model that best describes the
molecular probe properties alongside the structural characteristics of the adsorbent
(Yao and Lenhoff, 2004). For this reason a limitation of this technique is that the
obtained results will be heavily dependent on the selected probe and pore model
(Hagel, Ostberg and Andersson, 1996).
A number of adsorbents have been structurally characterised using the ISEC
technique. Such adsorbent composites include, dextran polyacrylamide,
polyacrylamide-agarose (Grimaud et al., 1978) alumina, silica (DePhillips and
Lenhoff, 2000), controlled pore glass and polystyrene (Knox and Ritchie, 1987).
Molecular probes used in ISEC include DNA, proteins, ficol and pullulan (Yao and
Lenhoff, 2004) and dextrans (Hagel, Ostberg and Andersson, 1996).
More recently, Pathak et al. 2017 developed a real-time column monitoring tool
using florescent markers to track the movement of process feed throughout the
column. It was able to monitor foulant concentration build-up and deposition during
chromatographic operation with an error of less than 1%. They were able to observe
that fluorescence intensity consistently increased with resin reuse as more foulants
were deposited over time, potentially signifying that this approach can be
implemented as a means to monitor fouling and process control.

63
Pressure-flow characterisation is performed to obtain data that is representative of
the pressure-flow relationship of the column during operation. This information is
then used to predict the limit of the operating pressure drop and flow velocity. In
contrast to open bed pressure-flow measurements, the top bed support is in contact
with the bed, creating a compressed structure. Therefore, a compression factor
(usually ranging from 1.15 to 1.20 for agarose-based resins) is applied during media
packing. Packed bed pressure-flow information is mainly used to determine the
pressure drop during column operation. The acquired data provides information
regarding the flow velocity limit for the media in use. The limit denotes the point at
which the bed will start to compress to such an extent that a gap is created between
the top bed support and the bed (resin rigidity limit) (Jagschies, Sofer and Hagel,
2008).
In this technique, the flow rate is manually increased until a runaway rise in the
pressure profile is observed. The flow rate at which this occurs is converted to linear
velocity. This is the point at which the column has ‘failed’ and is termed the critical
velocity. The more rigid the resin is, the higher the critical velocity. The degree to
which any individual repeat may vary is reliant mainly on column packing and the
resulting asymmetry. The probability that a column will pack in exactly the same
way, despite using the same procedure is low. This is represented by the asymmetry
value obtained.
64
1.6.3. Other techniques
Gel electrophoresis - This technique separates proteins according to their charge.
When in a free solution (usually a gel medium), proteins separate at different speeds
due to differences in their charge densities. The gel medium acts as an inert support
for the electrophoresis buffer or may actively participate in the separation process via
interaction with the proteins. The protein-gel interaction gives rise to separation and
the electrical field promotes migration of proteins though the gel. Commonly used
gels for electrophoresis include agarose and polyacrylamide (Laas, 1998). Structural
properties and mass transport of solutes in agarose gels have been widely studied
with this technique (Fatin-Rouge, Konstantin and Jacques, 2004). Similar to ISEC,
when a mixture of biomolecules is applied, structural information of the gel can be
obtained. Probes used to study the structure of agarose gels via electrophoresis
include dextrans, proteins, DNA molecular weight ladders and polymer beads
ranging between 10 and 140nm (Pluen et al., 1999; Fatin-Rouge, Konstantin and
Jacques, 2004).
Micromanipulation – Micromanipulation was first introduced as a theoretical
concept by University College London in 1987 and the first practical rig was
developed by the university of Birmingham in1990. It involves measuring
mechanical properties of individual particulate matter. The technique was employed
by Blewett 2000 to test the strength single particles of fungal hyphae under uniaxial
extension. The technique had also been applied to mammalian cells, yeast cells and
tomato cells (Zhang et al., 1991; Srinorakutara, 1997; Mashmoushy, Zhang and
Thomas, 1998; Wang, Wang and Thomas, 2003). More recently, it has also been
applied to chromatography-based materials such as dextran beads, agarose beads,
polymeric chromatographic adsorbents and gelatin-rich microparticles (Stenekes et
al., 2000; Mu, Lyddiatt and Pacek, 2005; Muller, Chung and Zhang, 2005; Ding et
al., 2007). More recently, advancements in the application of this technique had been
made by Liu et al. 2005. The mechanical properties of single nanoparticles, 800 nm
in size, were measured with an ESEM nanomanipulation rig, designed and
constructed by this group of researchers.

65
Dynamic mechanical analysis (DMA) - This technique involves applying a small
deformation to a sample in a cyclic manner and allows for the sample material to
respond to changes in stress, temperature, strain, frequency, force as well as other
parameters (figure 11). It is used widely in the bioengineering sector and the field of
biosciences to characterise the viscoelastic properties of various biological tissue and
other biomaterials. Traditionally, the stress and strain parameters are used to
calculate Young’s modulus to give an indication of changes in elastic properties.
Moroni et al. 2006 used the technique to investigate the use of scaffolds to mimic
human tissue. They found that the technique was particularly sensitive to pore size
changes in scaffolds. With increasing porosity in the scaffolds, there was a decrease
in elastic properties, which corresponded to an increase in strain. It has also been
used to look at the mechanical properties of materials similar to agarose gels, such as
hydrogels. Meyvis & Stubbe 2002 used DMA as a comparative technique to shear
rheometry to investigate mechanical properties of pharmaceutical hydrogels. They
found a strong correlation between the two techniques but observed that DMA can
be used to investigate many more mechanical parameters than solely viscoelasticity.
The technique has not yet been applied for the purposes of chromatography resin
characterization. We apply this technique in this study in an attempt to address
limitations associated with more established techniques.

66
Figure11 – Schematic of DMA set up and dimensions. The lid has a diameter of 10mm and the column that
sits inside the pan has an inner diameter of 11mm and an outer diameter of 14mm. A sinusoidal force of
100mN is applied at a frequency of 1Hz over a period of 80 minutes. The output is strain v time, where
strain is the displacement of the lid relative to the sample height.

67
CHAPTER 2 MATERIALS AND METHODS

68
2. MATERIALS AND METHODS
This section outlines the experimental procedures used in different sections of this
study as well as the materials used and where they were derived from.
All nine of the fresh resins used in this study – Capto Q (CQ), Capto Adhere (CA),
MabSelect (MS), MabSelect Xtra (MSX), Q-Sepharose High Performance (Q-HP),
Sepharose 6 Fast Flow (S6FF), Sepharose CL-6B (SCL6B), Sepharose 4 Fast Flow
(S4FF), Sepharose CL-4B (SCL4B) – were from GE Healthcare, Uppsala, Sweden.
Structural characterisation of these resins was performed using scanning electron
microscopy (SEM). Pre-treatment procedures and the SEM technique itself are
outlined in section 2.1. Pressure-flow characterisation and dynamic mechanical
analysis are then used for mechanical characterisation of the fresh resins. The
experimental procedures are outlined in sections 2.2 and 2.3 respectively. Four of the
nine resins (CA, MS, Q-HP and MSX) were exposed to 2 bioprocessing conditions
termed ‘CIP-exposed’ and ‘aged’ conditions. CIP-exposed conditions consist of
buffers only and aim to assess the impact of clean-in-place conditions on structural
and mechanical viability of the resins. The methods are outlined in section 2.4. Aged
resins are resins that have been used for resin lifetime studies in the production of a
monoclonal antibody or a fusion protein. Structural and mechanical characterisation
of these resins was performed in-house. The methods of aging are outlined in section
2.5.

69
2.1.Scanning electron microscopy - preparation and experiments
Separate 1 ml slurries (75% slurry concentration in 20% ethanol) of the
aforementioned fresh resins were used for this study.
2.1.1. Air drying
0.5 ml of each sample was syringed into a labelled petri dishes and left in a safety
cabinet (Class 2 MSC Walker, Derbyshire) for 24 hours. In this time the ethanol
evaporated to leave dry resin samples. These samples were then visually analysed
under a scanning electron microscope.
2.1.2. Freeze drying
The protocol employed is as an adaptation of previously reported freeze drying
methodologies (Tsinontides et al., 2004; Jones, 2012; Nireesha et al., 2013;
Zeitvogel et al., 2016). In this case, the time spent in the freezing and drying stages
of the process is increased. A 0.5 ml aliquot of each sample was syringed into
separate sterile polystyrene petri dishes (Fisher Scientific TM, 60mm x 15mm) and
labelled accordingly. They were then placed on different shelves in the freeze dryer
(Virtis Genesis 25EL, SP Scientific, US) to avoid cross-contamination. The samples
were left in the freeze dryer for 30 hours. The freezing stage was held for 8.5 hours
with a step-wise decrease in temperature, from 25˚C to -30˚C (a one degree decrease
approximately every 9 minutes). The drying stage was held for 21.5 hours with a
step-wise increase in temperature, from -40˚C to 25˚C (a one degree increase
approximately every 20 minutes).
2.1.3. Critical point drying
The storage medium of our agarose beads is made up of 80% water, however water
has an unfavourable critical point of +374˚C and 3212 p.s.i. which will cause heat
damage to the beads (Bray, 2000). For this reason, the medium used for critical point
drying is Carbon Dioxide (CO2), with a critical point of 31˚C and 1072 p.s.i.
(Pandithage, 2012). Water and CO2 are not miscible however, and for this reason a
transitional fluid is used. This fluid is miscible with both water and CO2 and is
usually an alcohol. As our chromatography media is stored in 20% ethanol, the

70
transitional fluid used in this case is ethanol.A 0.5 ml aliquot of each sample was
syringed into a 1.5 ml Eppendorf tube and labelled accordingly. The beads were
dehydrated in a graded ethanol-water series to 100% ethanol (20%, 50%, 70%, 90%,
100%) and put in critical point dryer (Polaron Critical point dryer, Quorum
Technologies Ltd, Essex). In critical point dryer, the beads were flushed 3 times in
CO2 in a graded series for 30 minutes. The temperature was raised to above 32˚C for
60 minutes (figure 12).
Figure 12 - (A) Selected freeze drying conditions. A 0.5 ml aliquot of sample is frozen
over a period of 8.5 hours in a graded fashion from 25˚C to - 30˚C. The sample is
transferred onto a sticky aluminium stub for SEM. (B) Selected critical point drying
conditions. 0.5 ml of sample is dehydrated in graded fashion from 0-100% ethanol before
transfer to critical point dryer where sample is flushed 3 times in liquid CO2. The
temperature is raised in a vacuum to above 32˚C for 60 minutes. The sample is transferred
onto a sticky aluminium stub for SEM.

71
2.1.4. Sample coating preparation
A wooden spatula is used to remove the dried resin from the tubes onto the labelled
1x1 cm cylindrical aluminium specimen stub (Agar Scientific, UK) for sample
coating. The surface of the specimen stub is sticky so that the sample is not removed
during subsequent steps.
The sample is placed into the ion gun gas flow control where excess liquid is
vacuumed out of the resin at 10-3 Pa. The Gatan, model 681 high resolution ion beam
coater (Gatan, Inc., US) is then used to coat the samples in a gold/ palladium alloy
(1-2 nm thickness of coating). SEM imaging requires the sample to be electrically
conductive in order to prevent the build-up of electrostatic charge. It is for that
reason that metal objects require little preparation for SEM imaging. However
samples of resin beads and other non-conductive samples tend to charge when
scanned by the electron beam, consequently causing scanning fault (Goldstein et al.,
2013). For this reason non-conductive samples are coated with conductive metals,
most commonly gold or a gold/palladium alloy. The ion beam coater is operated at
5.8 ke V, angle 70˚.
2.1.5. SEM Imaging
After the coating process, the samples are then mounted onto an SEM carrier and
inserted into the JEOL JSM-7401F field emission scanning electron microscope
(JEOL USA, Inc., US) for imaging at 10.0µA and 2 keV accelerating voltage.
2.1.6. Quantitative analysis using ImageJ software
The scale was set by using the software by manually drawing a line of 0.6 cm (as this
was the length of the scale bar measuring 100nm). The software then calculates the
number of pixels equivalent to 0.6 cm and the user can then insert the actual length
of the sample (100nm). The ‘Smooth’ filter is selected so that most projections are
flattened (https://imagej.nih.gov/ij/docs/guide/146-29.html). The ‘Invert’ option is
then selected to enhance the location of pores. The threshold limit is then set. The
edges of each pore are then bordered using the ‘Find edges’ tool, to further facilitate
pore sizing. The particle analyser function is selected to allow for the calculation of

72
pore sizes and related properties. Subsequently, a window appears numbering the
location of each detected pore so that this can be corresponded with the results
window. The user defines how the results are displayed. In this study results are
displayed per unit area (nm2). The software then displays two windows – a results
window (containing raw data) and a summary window. The summary provides the
user with the pore count information, average pore size and porosity. In this study,
porosity is recorded as a percentage, for example, 15% porosity means that 15% of
the image were pores and therefore 85% of the image is the fibrous network.

73
2.2.Pressure-flow characterisation
2.2.1. Equipment
A bench-scale column with adjustable column length and inner diameter of 1.6 cm
(model XK16, GE Healthcare, Uppsala, Sweden) was used. This was operated on the
AKTA Pure (GE Healthcare, Uppsala, Sweden). Column pressure drop (ΔP) was
measured using the internal pressure measurement devices installed in the feed
delivery system of the AKTA Pure and the volumetric flow rate was measured
manually using the method employed by (Tran et al., 2007).
2.2.2. Chromatography media
Sepharose CL-4B, Sepharose CL-6B, Sepharose 4 Fast Flow, Sepharose 6 Fast
Flow, Q Sepharose High Performance, MabSelect Xtra, MabSelect, Capto Q and
Capto Adhere (GE Healthcare, Uppsala, Sweden) were used in this study. These
agarose-based chromatography resins have an average particle size of 80 µm, with a
bead size distribution of between 24-165 µm. The mechanical differences between
the seven resins lie in the agarose content and the extent of structural cross-linking
present.
Sepharose 4 FF/ 6 FF, MabSelect Xtra, MabSelect, Capto Adhere and Capto Q are
made of highly cross-linked agarose, whereas Sepharose CL-4B/CL-6B and Q
Sepharose HP are structurally simpler in terms of their cross-linking. However
Sepharose 6 FF, CL-6B, Q Sepharose HP and MabSelect all contain the same
percentage of agarose in their matrices (6%), while Sepharose CL-4B and Sepharose
4 FF contain 4% and Capto Q 7%.
2.2.3. Characterisation procedure
Packing – All chromatography media was made up to 50% slurry concentration. The
same procedure was repeated for all seven resins. 30 ml of slurry was poured into the
column and allowed to gravity settle overnight. The adaptor was lowered into the
supernatant to start the flow pack. All columns were packed at 15cm/hr for 60
minutes and subsequently at 30 cm/hr for 30 minutes. The columns shown in table 7

74
were further consolidated. The top adaptor was then lowered to the top of the bed.
The packing medium used for all buffers was distilled H2O (dH2O) (as per resin
manufacturer recommendations – see datasheets).
Performance testing – 2% v/v of acetone was measured and added into 30 ml of
dH2O in a 50ml falcon tube (CELLSTAR®, UK). 1 ml of this solution was injected
into a 600 µl loop and then loaded onto the column. The eluent used in this study
was dH2O at 30 cm/hr. A peak was then generated within 30 minutes. The
asymmetry was calculated using the in-built function on the Unicorn 6.4 software.
Pressure-flow method – The flow rate of the packing buffer was continually
gradually increased until a 35 kPa increase in pressure drop was observed, as
described by Tran et al. 2007. At this point, the flow rate and any changes in bed
height were manually recorded. At a certain flow rate, the pressure began to increase
exponentially with no further change to the flow velocity. At this point it was
deemed that the critical velocity for the column had been reached.
Resin Packing flow rates
Sepharose 4 FF, Sepharose 6
FF, Q Sepharose HP
400 cm/ hr – 2 minutes
MabSelect 500 cm/ hr – 2 minutes
Capto Q 600 cm/ hr – 2 minutes
Table 7 – Packing flowrates for Sepharose 4FF, Sepharose 6FF, Q-Sepharose HP,
MabSelect and Capto Q

75
2.3. Dynamic mechanical analysis
2.3.1. Column/ holder design
10 identical cylindrical blocks of transparent acrylic were drilled with an inner
diameter of 11mm, an outer diameter of 14mm and a height of 15mm. The bottom
was wrapped in a thin sheet of parafilm (0.1mm thickness) to contain the slurry.
2.3.2. Sample preparation
An aliquot of 10 ml of each resin was placed into a labelled 50 ml falcon tube and
centrifuged for 5 minutes at 3000rpm (Eppendorf centrifuge 5810 R, Thermo Fisher
Scientific, UK) and the slurry concentration was noted based on the volume ratio of
liquid to slurry in the falcon tube. The storage buffer (20% ethanol) was decanted,
replaced with their respective packing buffers and the slurry solution was made up to
a 70% slurry concentration. The aliquots were resuspended and the procedure was
repeated until the storage buffer had been completely removed. 1.42 ml of each aliquot
was pipetted into their respectively labelled holder and left to settle overnight, such
that their settled bed height was 1cm.
2.3.3. Characterisation procedure
DMA was carried out on the DMA 7e hardware, with a TAC 7/DX controller and
Pyris Manager software (PerkinElmer, UK). In this procedure the force reading is
zeroed, the weight of the probe is tared and the probe position is zeroed when the lid
is lowered to the base of the pan. The lid is lifted and the holder containing the slurry
is placed onto the pan. The lid is lowered to the top of the resin bed, the height is read
and the methodology is started. In this methodology, the lid applies a force of
100mN/min at a frequency of 1 Hz for 80 minutes and a time-strain plot is generated
simultaneously. Upon completion of the methodology, the slope of the line is manually
fitted from the origin to the point before ultimate compression using the in-built slope
function in the Pyris Manager software.

76
2.4. CIP cycling experiments (CIP-exposed conditions)
Four of the nine resins (CA, MS, Q-HP and MSX) were exposed to 2 bioprocessing
conditions termed ‘CIP-exposed’ and ‘aged’ conditions. CIP-exposed conditions
consist of buffers only and aim to assess the impact of clean-in-place conditions on
structural and mechanical viability of the resins. This section outlines the procedure
used to perform CIP cycling studies on MabSelect, MabSelect Xtra and Q-Sepharose
High Performance. CIP cycling experiments on Capto Adhere were performed by Eli
Lilly & Co. in a 45ml column, internal diameter 22mm, for 50 cycles and conditions
are detailed subsequently. The CIP experiments using MS, MSX and Q-HP were
performed in 1ml HiTrap columns (x5) on the AKTA Pure (GE Healthcare, Uppsala,
Sweden) over a 50 cycle period. The experiments were initially designed to be as
close to the buffers used for ‘aged’ resin conditions as possible. However, for
confidentiality reasons, the exact conditions could not be disclosed. To address this,
standard protocols used by GE Healthcare were used for MS, MSX and Q-HP
instead. The protocols used for each resin is detailed below. Experiments were
generally run at 1ml/min, however, elution steps were run at 0.5 ml/min to mimic
standard process conditions. Certain less conventional conditions (such as the use of
0.5M NaOH for MS CIP protocol) were used after discussions with the sponsoring
company.
2.4.1. MabSelect CIP cycling protocol
Mili Q wash (5CV)
Equilibration (3CV): 20 mM sodium phosphate, 0.15 M NaCl, pH 7.4
Blank load (no protein) (2CV): 20 mM sodium phosphate, 0.15 M NaCl, pH 7.4
Wash (5CV): 20 mM sodium phosphate, 0.15 M NaCl, pH 7.4
Elution (2CV): 0.1 M sodium citrate, pH 3.0
CIP (2CV): 0.5M NaOH
Regeneration (2CV): 20 mM sodium phosphate, 0.15 M NaCl, pH 7.4

77
2.4.2. MabSelect Xtra CIP cycling protocol
Every cycle
Mili Q wash 5 CV
Equilibration (3CV): 20 mM sodium phosphate, 0.15 M NaCl, pH 7.2
Blank load (no protein) (2CV): 20 mM sodium phosphate, 0.15 M NaCl, pH 7.2
Wash (5CV): 20 mM sodium phosphate, 0.15 M NaCl, pH 7.2
Elution (2CV): 0.1 M sodium citrate, pH 3.0–3.6
CIP1 (2CV): 0.5M acetic acid
Every 5th cycle
Mili Q wash 5 CV
Equilibration (3CV): 20 mM sodium phosphate, 0.15 M NaCl, pH 7.2
Blank load (no protein) (2CV): 20 mM sodium phosphate, 0.15 M NaCl, pH 7.2
Wash (5CV): 20 mM sodium phosphate, 0.15 M NaCl, pH 7.2
Elution (2CV): 0.1 M sodium citrate, pH 3.0–3.6
CIP1 (2CV): 0.5M acetic acid
Wash (2CV): 20 mM sodium phosphate, 0.15 M NaCl, pH 7.2
CIP2 (2CV): 0.1M NaOH
Regeneration (2CV): 20 mM sodium phosphate, 0.15 M NaCl, pH 7.2
2.4.3. Q-Sepharose High Performance CIP cycling protocol
Pre-equilibration (1CV): 1M NaCl
Equilibration (5CV): 20 mM Tris-HCl, 0.7 M NaCI, pH 8.0
Blank load (no protein) (2CV): 20 mM Tris-HCl, 0.7 M NaCI, pH 8.0
Wash (5CV): 20 mM Tris-HCl, 0.7 M NaCI, pH 8.0
Elution (2CV): 20 mM Tris-HCl, 1 M NaCI, pH 8.0
CIP (2CV): 1M NaOH
Regeneration (5CV): 20 mM Tris-HCl, 0.7 M NaCI, pH 8.0

78
2.4.4. Capto Adhere CIP cycling protocol
These experiments were conducted by Eli Lilly & Co. The disclosed process
information is outlined below.
Wash: Tris buffer
Elution: 20mM Acetate buffer, 100 mM NaCl
Regeneration: Weak acid
Sanitisation: Strong base
The column pack is regenerated and sanitised after every run; the column is stored
after every second run.

79
2.5. Aged conditions
All ‘aged’ resin experiments were conducted externally by Eli Lilly & Co. and other
external partners. The resins used in this study were MabSelect, MabSelect Xtra, Q-
Sepharose HP and Capto Adhere, 2 of which were used as a capture step and 2 of
which were used as intermediate/polishing steps in 3 separate purification protocols.
The experiments are resin lifetime studies which aim to somewhat mimic the process
conditions used at large-scale manufacturing in the production of monoclonal
antibodies and fusion proteins. MabSelect and Capto Adhere were used as capture
and polishing steps respectively in the production of an IgG4. Q-Sepharose HP was
used in the post-capture stages of fusion protein purification and MabSelect Xtra was
used as a capture step in the purification of an IgG1 monoclonal antibody. The
experimental conditions for each resin are outlined below.
2.5.1. MabSelect ‘aged’ conditions
MabSelect was used as the capture step in the purification of Ixekizumab (chinese
hamster ovary (CHO) expression), an injectable drug used in the treatment of
autoimmune diseases such as plaque psoriasis. The manufacturing process involved
it being run over a 17 cycle period, in a 130 litre column (diameter 100cm, height
17cm). The buffer conditions are outlined below.
Wash: Tris buffers
Elution: Sodium Citrate, pH 3
Regeneration: 1% acetic acid, 1 % phosphoric acid.
Sanitisation: 50 mM NaOH, 1 M NaCl.
Storage: Sodium Acetate Buffer, pH 4
Sanitisation performed prior to the first cycle of two, and following the last cycle of
two.
80
2.5.2. Capto Adhere ‘aged’ conditions
Capto Adhere was used as the polishing step in the purification of Ixekizumab. The
manufacturing process involved it being run over a 17 cycle period, in a 145 litre
column (diameter 80cm, height 29cm). The buffer conditions are the same as those
outlined in section 2.4.4.
2.5.3. Q-Sepharose High Performance ‘aged’ conditions
Q-Sepharose HP was used in the post-capture stages in the purification of a fusion
protein (CHO expression). The manufacturing process involved it being run over a
64 cycle period, in a 45 litre column (diameter 60cm, height 16cm). The buffer
conditions are outlined below.
Wash and elution: Tris buffers.
Regeneration and Sanitisation: 1 N NaOH.
Storage: 0.1 N NaOH
Sanitisation performed prior to the first cycle of eight, and after every cycle.
2.5.4. MabSelect Xtra ‘aged’ conditions
MabSelect Xtra was used as the capture step in the purification of an IgG1
monoclonal antibody. The manufacturing process involved it being run over a 20
cycle period, in a 25ml column (bed height 20cm). The buffer conditions are
outlined below.
Wash: phosphate based
Elution: acetate buffer
CIP: 0.5M acetic acid, every cycle. 0.1M NaOH, every 5 cycles

81
CHAPTER 3 THE STRUCTURAL
CHARACTERISATION OF CHROMATOGRAPHY MEDIA USING
SCANNING ELECTRON MICROSCOPY (SEM)

82
3. THE STRUCTURAL CHARACTERISATION OF
CHROMATOGRAPHY MEDIA USING SEM
The performance of chromatography columns in large-scale manufacturing of
biotherapeutics is intrinsically linked to cost of goods and quality control. Poor
understanding of the events leading to column failure can make it difficult to ensure
robust operation avoiding process failures. Close examination of the bead structure
can aid in this understanding, particularly of the mechanical properties of the
chromatography resin. While there are various approaches and imaging techniques
that can be employed for the visualisation of chromatography resin, few techniques
provide the level of resolution as well as the adequate representation of its three-
dimensional structure required to analyse materials on the nanometre scale necessary
for this.
Scanning Electron Microscopy (SEM) is a technique routinely used to generate high-
resolution images. It is used widely in chemistry and biosciences to identify
microstructures, spatial compositions and the general characterization of solid
materials down to less than 50nm in size (Swapp, 2015). The benefits of SEM are
that use the technique requires little sample preparation and is able to provide highly
accurate information concerning the 3D morphology and the location of features
relative to each other, whilst still providing sufficient resolution and magnification
required for this particular application. Whilst there is arguably no other instrument
with the breadth of applications in the study of solid micro-materials that compares
with conventional SEM, the main limitation is that samples must be dry prior to
imaging. This is particularly problematic with regards to agarose-based
chromatography media, as water is a significant component in their structural
composition.
Consequently, there is a need to determine the most suitable drying technique for the
visualisation of agarose-based chromatography media. This chapter discusses the
factors for consideration when choosing the most appropriate drying conditions by
exploring three established drying techniques in the biosciences that have proven to
preserve biological properties of proteins and retain structure, namely air drying,
freeze drying and critical point drying. The selected drying technique is applied to

83
nine resins used in this study - Sepharose CL-4B (4% agarose content), Sepharose
CL-6B (6% agarose), Sepharose 4 Fast Flow (4% agarose), Sepharose 6 Fast Flow
(6% agarose), Q-Sepharose High Performance (6% agarose), MabSelect Xtra (6%
agarose, highly cross-linked), MabSelect (6% agarose, highly cross-linked) Capto
Adhere (7% agarose, highly cross-linked) and Capto Q (7% agarose, highly cross-
linked), which are then subsequently imaged using SEM.
The micrographs are then analysed both qualitatively and quantitatively. Quantitative
analysis is carried out using the Image J software in order to ascertain whether what
can be seen can also be measured accurately, with particular focus on average pore
size, apparent porosity, pore count and pore size distribution. Apparent porosity is
termed as such as it is not a true value of 3-dimensional porosity. It is a value that is
based on a 2-D image without account for the angle of the image. Differences in
matrix fibre composition can also be inferred from this data. This information can
then be used to characterise the structural properties of the resins, based on which
mechanical characterisation will be investigated in subsequent chapters.

84
3.1.Choosing suitable drying conditions
Agarose beads can contain up to 16% moisture content in their composition, which
means that water is an integral part of their structural make-up (Ghetie and Schell,
1971; Draveling, 2004). Furthermore, like most biological specimen, agarose-based
chromatography resins favour an aqueous environment to remain viable and
structurally intact (Joy and Pawley, 1992). Therefore, when choosing the most
appropriate drying conditions, it is important to consider a technique that can be
finely controlled. An uncontrolled dehydrating process can cause substantial changes
in structure and functionality. These changes can include shrinkage, cracking,
breakage, morphological alterations, contamination as well as other artefacts. It is
therefore important to determine the drying process and the best set of controlled
parameters (temperature and pressure) during this process that gives rise to the
fewest artefacts in order that the images can be correctly interpreted to understand
the structure (table 8).
Little has been reported on the drying technique best suited for the ultrastructural
visualisation of agarose-based chromatography resin under scanning electron
microscopy. There have been reports of the use of spray drying by Saito et al. 2013
as well as a non-parametric water-to-absolute ethanol dehydration technique by
Amsterdam et al. 1975. However, each one of the aforementioned techniques does
not provide a sufficient level of drying for the visualisation and characterization of
an agarose bead on the nanometre scale. Furthermore, there have been reports that
such methods do not perform well at lab-scale, in the case of spray drying or lead to
collapse of the bead altogether (Schwartzbach, 2010).

85
Factors for consideration when choosing drying conditions under SEM
Resin composition
Resin stability
Desired imaging resolution (microstructural or nanostructural visualisation)
It is therefore important to investigate a range of drying techniques that have proven
to preserve the properties and structure of biological specimen and can be adapted to
meet the requirements of agarose beads. Three commonly reported methods used to
dry biological material are air drying, freeze drying and critical point drying. There
are few reports on the optimisation of these techniques for agarose-based
chromatography resins. The subsequent chapters of this study investigate the
application of these techniques in order to ascertain which technique and which sets
of conditions are most preferable for the ultrastructural visualisation of agarose-
based chromatography resins. Visualisation of the ultrastructural properties of the
resins will allow for nanostructural characterisation, including pore sizing and matrix
formation analysis.
Table 8 – Factors for consideration when choosing drying conditions for agarose-
based chromatography resins under scanning electron microscopy (SEM)

86
3.1.1. Air drying – procedure development and results
Natural air drying is the process of drying with unheated air, taking advantage of a
material’s natural drying potential. When compared to vacuum-based drying
techniques (such as freeze drying and critical point drying) it is considered to be a
more straightforward method of drying as it the material generally requires little to
no preparation and the procedure requires minimal technical expertise or machine
operation.
In recent times, the procedure has been applied on agarose gels and agarose beads by
Nursam et al. 2016 and Close et al. 2013 respectively, with the intention of obtaining
structural information on the surface of the material using SEM. In both procedures
the agarose was exposed to no more than 10 hours of air in an uncontrolled setting.
Although microstructural information was obtained, it was difficult to view
nanostructural detail, such as the fibrous network of the materials. Potential reasons
for this could have been that the material was not sufficiently dried for higher
resolution studies or possible artefact formation on the surface of the materials,
which also limits the maximum resolution that can be achieved by SEM.
The air drying protocol used for this study was adapted to address the
aforementioned issues. To encourage further drying, the agarose beads were exposed
to air for an extended time period of 24 hours. To limit potential artefact formation
on the surface of the beads, the resins were dried in a biosafety cabinet, meaning the
beads were exposed to controlled air flow and sterile conditions. This technique was
tested on Capto TM Adhere and MabSelect TM resins and subsequently imaged using
SEM. Micrographs showing the 2 resins in different states were obtained. State 1 -
individual beads (whole bead images) and state 2 - bead surface images. Whole bead
micrographs intended to show any morphological effects of air drying on the resins,
while bead surface images intended to show any potential ultrastructural alterations
caused by the air drying technique. At least 3 micrographs of each state were
acquired for each resin.

87
Figure 13 – (A) Scanning electron micrograph showing fresh Capto Adhere post-air
drying. Whole bead image 2.0 kV accelerating voltage, x220 magnification, 3cm = 100
µm. (B) Scanning electron micrograph showing fresh Capto Adhere. Bead surface
image 2.0 kV accelerating voltage, x25, 000 magnification, 3 cm = 1µm.

88
Figure 14– (A) Scanning electron micrograph showing fresh MabSelect post-air
drying. Whole bead image 2.0 kV accelerating voltage, x350 magnification, 1cm =
20 µm. (B) Scanning electron micrograph showing fresh MabSelect. Bead surface
image 2.0 kV accelerating voltage, x18, 000 magnification, 2.5 cm = 1µm.

89
The samples imaged post-air drying are represented by figures 13 and 14, fresh
Capto Adhere (7% agarose content) and fresh MabSelect (6% agarose content)
chromatography resins respectively. These resins are widely used resins for the
intermediate and capture stages of monoclonal antibody purification respectively.
They are made up of highly cross-linked agarose and it is this make up that helps in
determining their structural and mechanical properties. The selected figures are
representative of all the images obtained for this section of the study.
Figure 13(A) shows a randomly selected collection of Capto Adhere beads post-air
drying. 1 cm of the micrograph represents 50 µm of the sample. The image shows
that the individual beads are uniformly spherical in shape and clearly shows there to
be a significant particle size distribution (~50-100µm) as specified by the
manufacturer, GE Healthcare. This can also be observed in figure 14(A), showing a
randomly selected region of MabSelect beads post-air drying (1 cm of the
micrograph represents 20 µm of the sample). The beads are also homogeneously
spherical with an observed pore size distribution (~40-100µm) as specified by the
manufacturer, GE Healthcare. These results indicate that air drying can be used to
characterise whole bead structures of chromatography media. It is important to note
that imaging artefacts (such as the dark patches that appear in figure 14(A) are
defects caused by the scanning speed as the image was captured as opposed to a
sample-related defect (see section 3.2.4).
Figure 13(B) shows the surface of a Capto Adhere bead post-air drying selected at
random. 3 cm of the micrograph represents 1µm of the sample. The image shows the
heterogeneity of the matrix structure, a wide pore size distribution and diversity in
pore morphology. The image also shows depth and some distinction can be made
between the pores that are closer to the surface and those that extend inwards.
However, moving towards the bottom of the micrograph, the image begins to drift.
This distortion can occur when the microscope is operating at maximum
magnification, meaning that a higher resolution image would be difficult to capture
for that particular sample. A probable reason for this could be related to the extent of
drying. Higher resolution images are more difficult to obtain if the sample is not
sufficiently dried. An image with higher resolution would allow for further
ultrastructural analysis and possible quantification of the nanostructure (Williams

90
and Clifford, 2000). It should be noted that due to the mixed mode properties of
Capto Adhere, it has hydrophobic properties pertaining to its ligand characteristics.
Further studies would need to be carried out to determine the impact of drying on the
stability of these ligands.
Similarly figure 14(B) shows the surface of a MabSelect bead post-air drying
selected at random. 2.5 cm of the micrograph represents 1µm of the sample. This
image provides almost no ultrastructural information. Unlike figure 13(B), the
surface appears to be homogeneously occluded and no observations can be made
regarding the matrix structure, pore size distribution or pore morphology. The most
likely cause of this could be related to the water retained in the sample due to
insufficient drying (Dey et al., 1989). Possible solutions to this issue may involve
extending the drying time and increasing the air flow. However, air drying is highly
susceptible to the effects of surface tension, as there are no controlled parameters
(such as temperature or pressure) when going from liquid to vapour/gas phase
(Reville and Cotter, 1991).
The results indicate that this air drying technique is sufficient enough to provide
microstructural information and clearly shows the variations in particle size
distribution and bead morphology under SEM. However, a drying technique that also
allows for the analysis of the nanostructural properties of the resins is required for
better characterisation. To address this, the subsequent section investigates the
application of two other drying techniques, freeze drying and critical point drying.

91
3.1.2. Freeze drying vs critical point drying (CPD)
Freeze drying and critical point drying are two established drying procedures that
have proven to preserve biological properties of proteins and retain structure. Unlike
air drying, these techniques allow for temperature and pressure optimisation and
therefore allow for a more controlled dehydration process. Furthermore, both
processes avoid transitioning directly from liquid to gas phase, vastly minimising the
effects of surface tension. However, there are a number of differences between the
two techniques (table 9). Freeze drying works by freezing the sample and
subsequently applying a vacuum. This allows for the removal of frozen water (solid
phase) by sublimation, which in turn avoids the liquid phase and reduces the effects
of surface tension (Tsinontides et al., 2004). Additionally, freeze drying employs a
wide range of temperatures when operating in the freezing and drying stages of the
process.
The process of critical point drying relies on the continuity of state. Specifically, this
occurs at a particular temperature and pressure at which liquid and vapour can co-
exist, hence having the same density. The point at which this particular temperature
and pressure occurs is termed the critical point. At this stage, there is no apparent
difference between the liquid and vapour states in the solid material, reducing the
surface tension to zero. This process takes place at a stable temperature range of 32-
35˚C (Bray 2000).
There are limited sources that clearly outline the temperatures and pressures used at
each stage of the freeze drying process when applied to agarose-based
chromatography media. However, the technique has been applied widely to agarose
gels and similar materials. The protocol employed in this study is an adaptation of
previously reported freeze drying methodologies (Nordestgaard and Rostgaard,
1985; Bell, 1988; Tsinontides et al., 2004; Wilson and Bacic, 2012; Nireesha et al.,
2013). In these methodologies, the solid materials are homogeneous in nature,
meaning a consistent surface area. Chromatography resins display liquid-like
behaviour as a slurry, which means that there is inconsistent exposure to the varying
temperature and pressure conditions in the freeze dryer. For this reason, the the time
spent in the freezing and drying stages of the process is increased.

92
The development of the critical point drying protocol used in this study took a
number of factors into account. The storage medium of our agarose beads is made up
of 80% water (and 20% ethanol), however water has an unfavourable critical point of
+374˚C and 3212 p.s.i. which will cause heat damage to the beads (Bray, 2000). For
this reason, the medium used for critical point drying is Carbon Dioxide (CO2), with
a critical point of 31˚C and 1072 p.s.i. (Pandithage, 2012). Water and CO2 are not
miscible however, and for this reason a transitional fluid is used. This fluid is
miscible with both water and CO2 and is usually an alcohol. As our chromatography
media is stored in 20% ethanol, the transitional fluid used in this case is ethanol. The
chromatography resins were then dehydrated in a graded ethanol-water series to
100% ethanol before being placed into the critical point dryer (see materials and
methods).
Factors CPD Freeze drying
Preparation Yes (water ethanol) None*
Media required Ethanol, CO2 Water
Phases Liquid Gas Solid Gas
Time 2-3 hours** 24-30 hours**
Working temperature 32-35˚C -30/-40˚C***
Table 9 Factors for consideration when choosing critical point drying or freeze drying as a
drying technique for agarose-based chromatography resin
*Optional; Sample can be fast-frozen in e.g. liquid nitrogen prior to freeze drying
**Selected conditions
***Can go down to as low as >-80˚for very delicate sample

93
Figure 15 - (A) Scanning electron micrograph showing fresh Capto Adhere post-freeze
drying. Whole bead image 2.0 kV accelerating voltage, x750 magnification, 1cm = 10
µm. (B) Scanning electron micrograph showing fresh Capto Adhere post-freeze drying.
Bead surface image 2.0 kV accelerating voltage, x14, 000 magnification, 2 cm = 1µm.

94
Figure 16 - (A) Scanning electron micrograph showing fresh MabSelect post-freeze
drying. Whole bead image 3.0 kV accelerating voltage, x950 magnification, 1.5cm =
10 µm. (B) Scanning electron micrograph showing fresh MabSelect post freeze-
drying. Bead surface image 2.0 kV accelerating voltage, x18, 000 magnification, 2.3
cm = 200nm.

95
Figure 17 - (A) Scanning electron micrograph showing fresh Capto Adhere
post-critical point drying. Whole bead image 2.0 kV accelerating voltage,
x500 magnification, 1.2cm = 20 µm. (B) Scanning electron micrograph
showing fresh Capto Adhere post-freeze drying. Bead surface image 2.0 kV
accelerating voltage, x50, 000 magnification, 1.2 cm = 200nm.

96
Figure 18- (A) Scanning electron micrograph showing fresh MabSelect post-
critical point drying. Whole bead image 2.0 kV accelerating voltage, x1,500
magnification, 2 cm = 10 µm. (B) Scanning electron micrograph showing fresh
MabSelect post-critical point drying. Bead surface image 2.0 kV accelerating
voltage, x55, 000 magnification, 1.5 cm = 200 nm.

97
Both Capto Adhere and MabSelect were imaged after exposure to the selected freeze
drying conditions. This is represented by figures 15 and 16 for Capto Adhere and
MabSelect respectively. Figures 15(A) and 16(A) are whole bead images for both
resins while figures 15(B) and 16(B) are bead surface images.
Figure 15(A) shows a Capto Adhere whole bead post-freeze drying. 1 cm of the
micrograph represents 10 µm of the sample. The image shows partial fragmentation
of the bead; the bead appears to be partially cracked, whilst still maintaining a
semblance of its spherical structure. Similarly figure 16(A) (MabSelect whole bead
image, 1.5 cm = 1µm) shows complete bead fragmentation – splitting of the bead
into two parts – of which one can be seen in the image. It should be noted that most
of the beads in both resin samples maintained their spherical structure and variations
in particle size distribution could be observed clearly. However, the fragmentation of
beads observed in figures 15(A) and 16A) represents a significant portion of the
samples. In all images collected in this study, at least a third of the beads were
disintegrated to some extent. What did differ, however, was the extent of
fragmentation in both cases, as observed in similar studies that employ freeze drying
on biological specimen (Polak and Pitombo, 2011). Figure 16(A) is completely
fragmented, whereas figure 15(A) is partially fragmented. This could be due to the
fact that Capto Adhere is a stronger resin type as it is made to have a higher
percentage of cross-linking of agarose media than MabSelect, as specified by the
manufacturer GE Healthcare. The results from this study indicate that freeze drying
under these conditions can lead to severe morphological changes in bead structure
(Draenert and Draenert, 1982).
Figure 15(B) shows the surface of a Capto Adhere bead post-freeze drying. 2 cm of
the micrograph represents 1µm of the sample. Likewise figure 16(B) is a bead
surface image of MabSelect post-freeze drying and 2.3 cm of the micrograph
represents 1µm of the sample. In both cases, visualisation of the ultrastructure at
high resolution proved difficult under these conditions. Similar to figure 13(B)
obtained post-air drying, the images show the heterogeneity of the matrix structure, a
wide pore size distribution and diversity in pore morphology. The images also show
depth and some distinction can be made between the pores that are closer to the
surface and those that extend inwards, albeit to a lesser extent than figure 13(B).
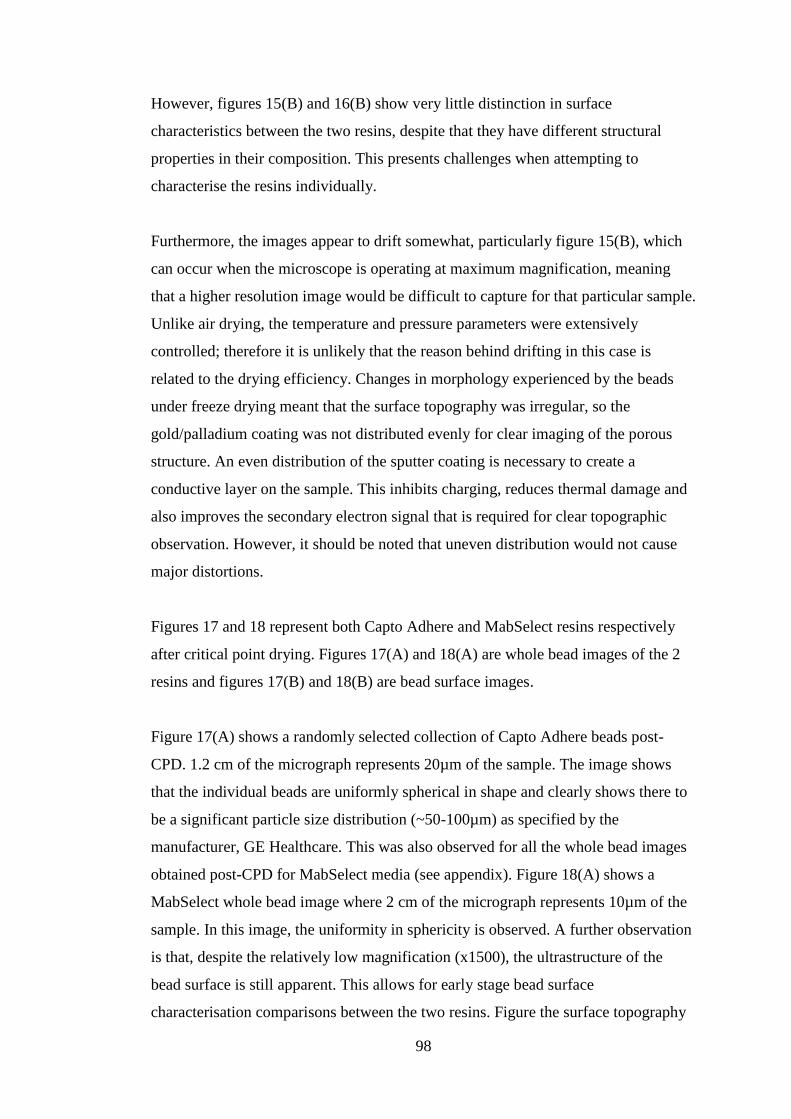
98
However, figures 15(B) and 16(B) show very little distinction in surface
characteristics between the two resins, despite that they have different structural
properties in their composition. This presents challenges when attempting to
characterise the resins individually.
Furthermore, the images appear to drift somewhat, particularly figure 15(B), which
can occur when the microscope is operating at maximum magnification, meaning
that a higher resolution image would be difficult to capture for that particular sample.
Unlike air drying, the temperature and pressure parameters were extensively
controlled; therefore it is unlikely that the reason behind drifting in this case is
related to the drying efficiency. Changes in morphology experienced by the beads
under freeze drying meant that the surface topography was irregular, so the
gold/palladium coating was not distributed evenly for clear imaging of the porous
structure. An even distribution of the sputter coating is necessary to create a
conductive layer on the sample. This inhibits charging, reduces thermal damage and
also improves the secondary electron signal that is required for clear topographic
observation. However, it should be noted that uneven distribution would not cause
major distortions.
Figures 17 and 18 represent both Capto Adhere and MabSelect resins respectively
after critical point drying. Figures 17(A) and 18(A) are whole bead images of the 2
resins and figures 17(B) and 18(B) are bead surface images.
Figure 17(A) shows a randomly selected collection of Capto Adhere beads post-
CPD. 1.2 cm of the micrograph represents 20µm of the sample. The image shows
that the individual beads are uniformly spherical in shape and clearly shows there to
be a significant particle size distribution (~50-100µm) as specified by the
manufacturer, GE Healthcare. This was also observed for all the whole bead images
obtained post-CPD for MabSelect media (see appendix). Figure 18(A) shows a
MabSelect whole bead image where 2 cm of the micrograph represents 10µm of the
sample. In this image, the uniformity in sphericity is observed. A further observation
is that, despite the relatively low magnification (x1500), the ultrastructure of the
bead surface is still apparent. This allows for early stage bead surface
characterisation comparisons between the two resins. Figure the surface topography

99
of figure18(A) appears to be more heterogeneous compared to figure 17(A).
However, a higher image resolution is required for further analysis.
Figures 17(B) and 18(B) are higher resolution bead surface images for Capto Adhere
and MabSelect respectively. In figure 17(B), 1.2 cm of the micrograph represents
200 nm of the sample and in figure 18(B) 1.5 cm represents 200 nm of sample. Both
figures clearly show a heterogenous polymer fibre network structure and the pore
size distribution and diversity in pore morphology can be clearly observed. However,
the figures show that there are differences between the ultrastruture of the 2 resins.
The matrix structure of MabSelect exhibits more discontinuity of fibres compared to
Capto Adhere, which appears to be more homogeneous. This difference could affirm
the aforementioned rationale that Capto Adhere is mechanically more robust than
MabSelect.
The results observed in addition to the factors for consideration associated with both
drying techniques (table 9) appear to favour critical point drying as the ideal
approach for sufficient drying of agarose-based chromatography media for
ultrastructural visualisation under SEM. This is corroborated by observations noted
by Nordestgaard & Rostgaard, 1985 who investigated critical point drying versus
freeze drying for studies on hepatocytes. From this, they were able to conclude that
critical point drying under SEM resulted in fewer morphological changes and clearer
ultrastructural visualisation. Whilst freeze drying requires next to no preparation or
any necessary additional media, with regards to the handling of both techniques,
critical point drying operates under less extreme temperature changes, which is quite
critical in maintaining ultrastructure. Furthermore, critical point drying is also in the
order of several hours less in time taken to carry out, which is important in the wider
use of the technique and scalability. However, as indicated by the results, it must be
noted that freeze drying can be applied to agarose-based chromatography media for a
wide variety of applications not covered in the scope of this research. The extreme
temperatures freeze drying is capable of achieving can be used to determine the
effects of other physical and mechanical factors, such as stress testing or bead
deformation testing and potentially used as a bead sectioning technique for
observation of the bead’s interior mechanical properties using SEM.

100
3.2.Image analysis
The use of SEM for the visualisation agarose-based chromatography media allows
for high resolution imaging upon the application of appropriate preparative
techniques. Detailed analysis of the images obtained is an important aspect for
improved understanding and characterisation of the properties of chromatography
resins. There are two main analytical approaches that are employed for interpretation
of images, namely qualitative analysis and quantitative analysis.
The use of qualitative analysis is of particular importance in this investigation as it
allows for quick identification of the more distinct properties that characterise the
resins used in this study. These properties include bead and pore sizing, size
distribution and morphology. Additionally interpretations can be made on matrix
structure differences and fibre sizing. Qualitative analysis also allows for quick
distinctions to be made between imaging artefacts and sample artefacts. It forms the
basis on which other analytical approaches are developed, hence highlighting the
need for accurate and precise observation of structural detail.
The quantitative analysis approach used in this study aims to provide numerical
information regarding the aforementioned properties. This approach cannot be
directly applied to images obtained via SEM and hence requires the use of image
processing software. The use of image processing software is ideal as it can be
automated to reduce human error.
Image analysis is performed on all nine resins used in this study (post-CPD).
Micrographs showing the all resins in different states were obtained. As previously
stated, the first state captures individual beads (whole bead images) and the second
are bead surface images. Whole bead micrographs intended to show any
morphological differences between the resins, while bead surface images intended to
show ultrastructural differences. At least 3 micrographs of each state were acquired
for each resin (see appendix).

101
Figure 19 – (A) Scanning electron micrograph showing fresh Sepharose CL-4B post-
critical point drying. Whole bead image, 2.0kV, magnification x450, 0.6 cm = 10 µm.
(B) Scanning electron micrograph showing fresh Sepharose CL-4B post-critical point
drying. Bead surface image, 2.0 kV, magnification x40,000, 0.6 cm = 100 nm.

102
Figure 20 – (A) Scanning electron micrograph showing fresh Sepharose 4 Fast Flow
post-critical point drying. Whole bead image, 2.0kV, magnification x500, 0.6 cm = 10
µm. (B) Scanning electron micrograph showing fresh Sepharose 4 Fast Flow post-critical
point drying. Bead surface image, 2.0 kV, magnification x40,000, 0.6 cm = 100 nm.

103
Figure 21 – (A) Scanning electron micrograph showing fresh Sepharose CL-6B post-
critical point drying. Whole bead image, 2.0kV, magnification x400, 0.6 cm = 10 µm.
(B) Scanning electron micrograph showing fresh Sepharose CL-6B post-critical point
drying. Bead surface image, 2.0 kV, magnification x40,000, 0.6 cm = 100 nm.

104
Figure 22 – (A) Scanning electron micrograph showing fresh Sepharose 6 Fast
Flow post-critical point drying. Whole bead image, 2.0kV, magnification x700, 0.9
cm = 10 µm. (B) Scanning electron micrograph showing fresh Sepharose 6 Fast
Flow post-critical point drying. Bead surface image, 2.0 kV, magnification x40,000,
0.6 cm = 100 nm.

105
Figure 23 – (A) Scanning electron micrograph showing fresh Q-Sepharose High
Performance post-critical point drying. Whole bead image, 2.0kV, magnification x430,
0.6 cm = 10 µm. (B) Scanning electron micrograph showing fresh Q-Sepharose High
Performance post-critical point drying. Bead surface image, 2.0 kV, magnification
x33,000, 0.4 cm = 100 nm.

106
Figure 24 – (A) Scanning electron micrograph showing fresh MabSelect Xtra post-
critical point drying. Whole bead image, 2.0kV, magnification x670, 1 cm = 10 µm. (B)
Scanning electron micrograph showing fresh MabSelect Xtra post-critical point drying.
Bead surface image, 2.0 kV, magnification x40,000, 0.6 cm = 100 nm.

107
Figure 25 – (A) Scanning electron micrograph showing fresh Capto Q post-critical
point drying. Whole bead image, 2.0kV, magnification x220, 3 cm = 100 µm. (B)
Scanning electron micrograph showing fresh Capto Q post-critical point drying. Bead
surface image, 2.0 kV, magnification x40,000, 0.6 cm = 100 nm.

108
3.2.1. Qualitative analysis
Figures 19-25 represent fresh Sepharose CL-4B, Sepharose 4 Fast Flow, Sepharose
CL-6B, Sepharose 6 Fast Flow, Q-Sepharose High Performance, MabSelect Xtra and
Capto Q respectively. Each figure labelled (A) show whole bead images and those
labelled (B) show bead surface images for the respective resins.
Figure 19(A) shows a randomly selected collection of Sepharose CL-4B post-CPD.
0.6 cm of the micrograph represents 10µm of the sample. The image shows that the
individual beads are uniformly spherical in shape and clearly shows a significant
particle size distribution (~50-150µm), as specified by the manufacturer - GE
Healthcare. These properties were generally observed for all whole beads images
obtained post-CPD for all resins used in this study (figures 20(A) – 25(A)).
However, figures 20(A) and 24(A) (Sepharose 4 Fast Flow and MabSelect Xtra
whole bead images) appear to show a number of beads that have a small area
displaying flat surfaces as opposed to spherical surfaces. This was observed in a
significant number of MabSelect Xtra beads obtained but was far less apparent for
Sepharose 4 Fast Flow. The flat surfaces could be associated with beads adhering to
each other pre-drying due to the viscous nature of the samples. Upon the removal of
water, the beads may have disjoined, resulting in the circular flat surfaces observed.
Figures 19(B)-25(B) are bead surface images for fresh Sepharose CL-4B (SCL4B),
Sepharose 4 Fast Flow (S4FF), Sepharose CL-6B (SCL6B), Sepharose 6 Fast Flow
(S6FF), Q-Sepharose High Performance (Q-HP), MabSelect Xtra (MSX) and Capto
Q (CQ) respectively. A scale based on 100 nm is provided for each of these images.
The results show structural similarities between groups of resins which can be
compared and contrasted against one another. Sepharose CL-4B and -6B (figures
19(B) and 21(B)) share similar chemical and physical compositions in their
manufacturing and are of the same subtype of resins. They both display a
heterogenous polymer fibre network structure, pore size distribution and diversity in
pore morphology. However, SCL6B appears to be more structurally stable as there is
less discontinuity of fibres, so the matrix itself appears more robust. A similar
observation can be seen between Sepharose 4 FF and 6 FF (figures 20(B) and
22(B)). Both resins display relatively thicker matrices but the extent of this is what
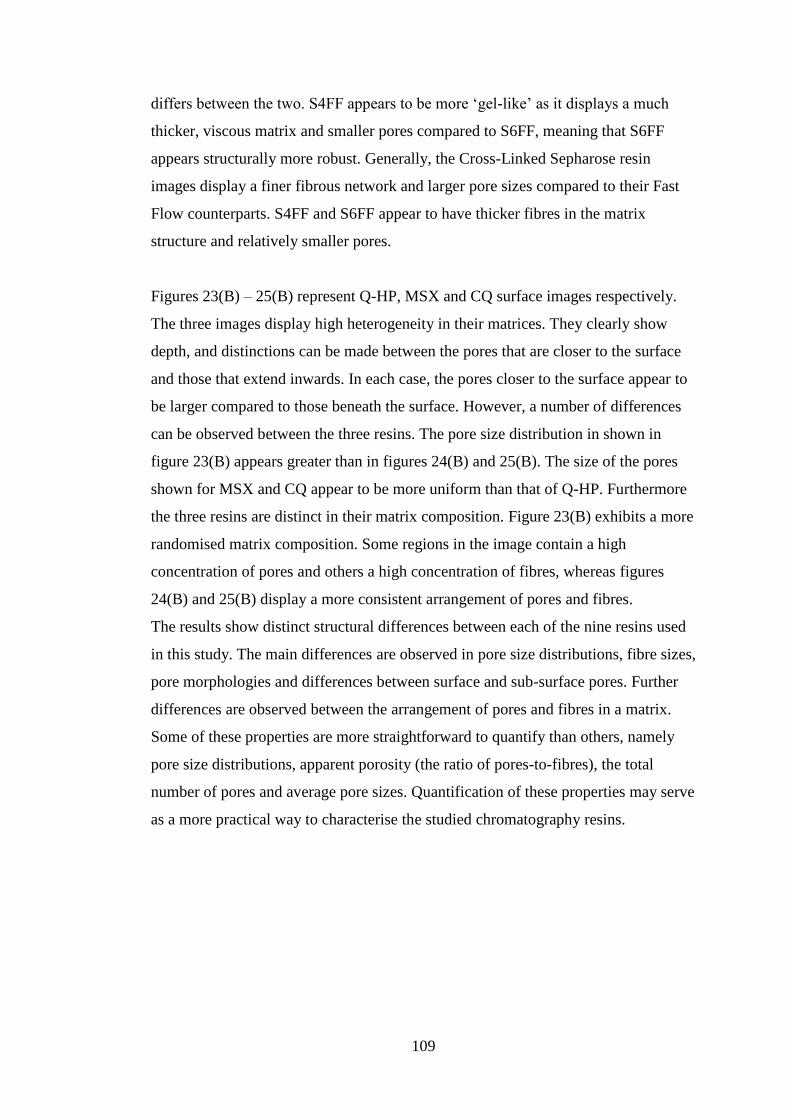
109
differs between the two. S4FF appears to be more ‘gel-like’ as it displays a much
thicker, viscous matrix and smaller pores compared to S6FF, meaning that S6FF
appears structurally more robust. Generally, the Cross-Linked Sepharose resin
images display a finer fibrous network and larger pore sizes compared to their Fast
Flow counterparts. S4FF and S6FF appear to have thicker fibres in the matrix
structure and relatively smaller pores.
Figures 23(B) – 25(B) represent Q-HP, MSX and CQ surface images respectively.
The three images display high heterogeneity in their matrices. They clearly show
depth, and distinctions can be made between the pores that are closer to the surface
and those that extend inwards. In each case, the pores closer to the surface appear to
be larger compared to those beneath the surface. However, a number of differences
can be observed between the three resins. The pore size distribution in shown in
figure 23(B) appears greater than in figures 24(B) and 25(B). The size of the pores
shown for MSX and CQ appear to be more uniform than that of Q-HP. Furthermore
the three resins are distinct in their matrix composition. Figure 23(B) exhibits a more
randomised matrix composition. Some regions in the image contain a high
concentration of pores and others a high concentration of fibres, whereas figures
24(B) and 25(B) display a more consistent arrangement of pores and fibres.
The results show distinct structural differences between each of the nine resins used
in this study. The main differences are observed in pore size distributions, fibre sizes,
pore morphologies and differences between surface and sub-surface pores. Further
differences are observed between the arrangement of pores and fibres in a matrix.
Some of these properties are more straightforward to quantify than others, namely
pore size distributions, apparent porosity (the ratio of pores-to-fibres), the total
number of pores and average pore sizes. Quantification of these properties may serve
as a more practical way to characterise the studied chromatography resins.
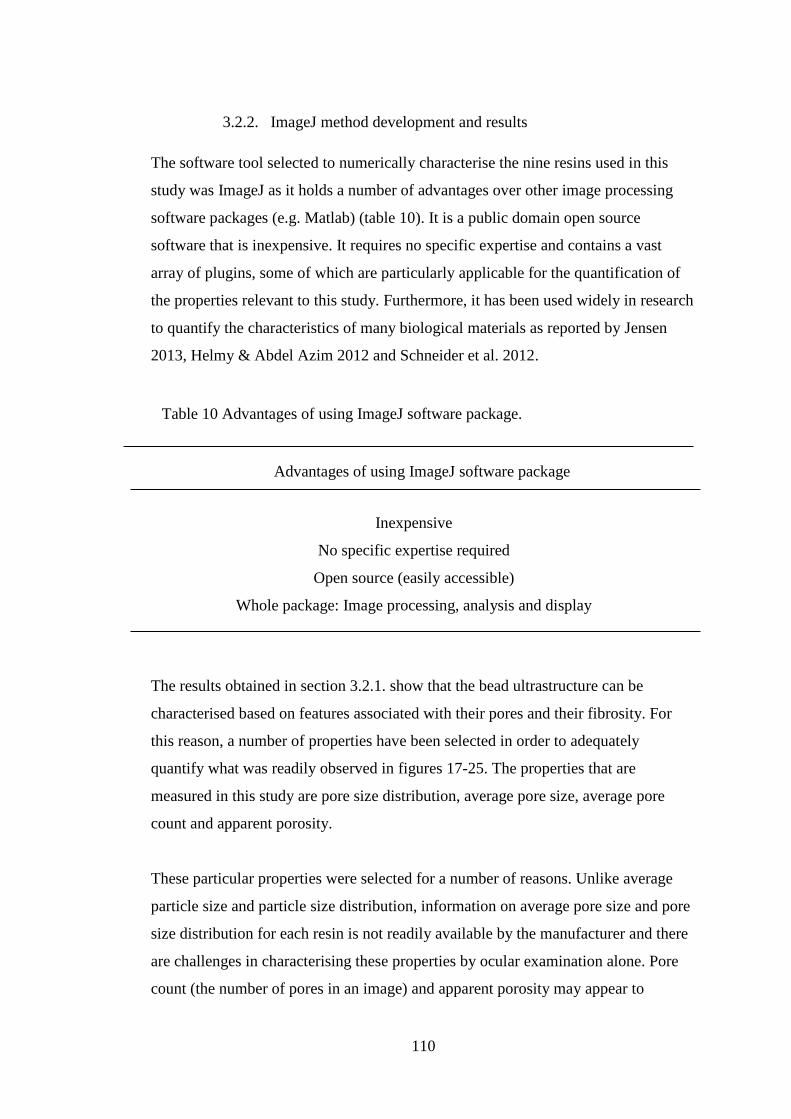
110
3.2.2. ImageJ method development and results
The software tool selected to numerically characterise the nine resins used in this
study was ImageJ as it holds a number of advantages over other image processing
software packages (e.g. Matlab) (table 10). It is a public domain open source
software that is inexpensive. It requires no specific expertise and contains a vast
array of plugins, some of which are particularly applicable for the quantification of
the properties relevant to this study. Furthermore, it has been used widely in research
to quantify the characteristics of many biological materials as reported by Jensen
2013, Helmy & Abdel Azim 2012 and Schneider et al. 2012.
The results obtained in section 3.2.1. show that the bead ultrastructure can be
characterised based on features associated with their pores and their fibrosity. For
this reason, a number of properties have been selected in order to adequately
quantify what was readily observed in figures 17-25. The properties that are
measured in this study are pore size distribution, average pore size, average pore
count and apparent porosity.
These particular properties were selected for a number of reasons. Unlike average
particle size and particle size distribution, information on average pore size and pore
size distribution for each resin is not readily available by the manufacturer and there
are challenges in characterising these properties by ocular examination alone. Pore
count (the number of pores in an image) and apparent porosity may appear to
Table 10 Advantages of using ImageJ software package.
Advantages of using ImageJ software package
Inexpensive
No specific expertise required
Open source (easily accessible)
Whole package: Image processing, analysis and display

111
provide similar information, however the difference between the two is that apparent
porosity supplies information about the non-porous portion of the image (i.e. the
amount of the image that is composed of fibres). Furthermore, the two properties
may not be correlative, as a high pore count may not necessarily indicate high
apparent porosity, as observed in figure 20(B).
There were a number of steps involved in making the images suitable for image
analysis. The first important step was setting the scale (figure 20(B) is used for
illustrative purposes). This was done by using the software to draw a line of 0.6 cm.
The software then calculates the number of pixels equivalent to 0.6 cm and the user
can then insert the actual length of the sample (100nm). Subsequently, the image is
‘smoothened out’. This filter replaces each pixel with the average of its 3 × 3
surrounding area, meaning that most projections are flattened
(https://imagej.nih.gov/ij/docs/guide/146-29.html). The image is then inverted to
create a reversed image (can be likened to a photographic negative) to enhance the
location of pores. The user then decides on the threshold limit. This is done to filter
out as much background information in the image as possible, such as sub-surface
structures. The edges of each pore are then bordered using the ‘Find edges’ tool, to
further facilitate pore sizing. The particle analyser function can then be selected to
allow for the calculation of pore sizes and related properties.
Subsequently, a window appears numbering the location of each detected pore so
that this can be corresponded with the results window. The user can define how the
results are displayed. In this study results are displayed per unit area (nm2) In the
discussion section of this study, the pore diameter is approximated based on the area
of a circle πr2. The software then displays two windows – a results window
(containing raw data) and a summary window. The summary provides the user with
the pore count information, average pore size and apparent porosity. In this study,
apparent porosity is recorded as a percentage, for example, 15% apparent porosity
means that 15% of the image were pores and therefore 85% of the image is the
fibrous network.

112
B
CA
CQ
MS
MSX
Q-H
P
S4F
F
S6F
F
SCL4
B
SCL6
B
0
200
400
600
800
1000
1200
1400
Avera
ge p
ore
cou
nt
Resin
Figure 26 – Column graph showing average pore count for all nine resins –
CA (Capto Adhere), CQ (Capto Q), MS (MabSelect), MSX (MabSelect Xtra),
Q-HP (Q-Sepharose High Performance), S4FF (Sepharose 4 Fast Flow), S6FF
(Sepharose 6 Fast Flow), SCL4B (Sepharose CL4B), SCL6B (Sepharose
CL6B) - the total number of enclosed black pixels (pores) were calculated by
the ImageJ software for 3 images of each resin. The averages are plotted with
their standard deviations.

113
CA
CQ
MS
MSX
Q-H
P
S4F
F
S6F
F
SCL4
B
SCL6
B
0
2000
4000
6000
8000
10000
Avera
ge p
ore
siz
e (
nm
^2)
Resin
Figure 27 – Column graph showing average pore size in nm2 for all nine resins –
CA (Capto Adhere), CQ (Capto Q), MS (MabSelect), MSX (MabSelect Xtra),
Q-HP (Q-Sepharose High Performance), S4FF (Sepharose 4 Fast Flow), S6FF
(Sepharose 6 Fast Flow), SCL4B (Sepharose CL4B), SCL6B (Sepharose CL6B)
- the areas of all enclosed black pixels (pores) were calculated by the ImageJ
software for 3 images of each resin. The averages are plotted with their standard
deviations. Pore diameters are calculated based on the area of a circle πr2.

114
CA
CQ
MS
MSX
Q-H
P
S4F
F
S6F
F
SCL4
B
SCL6
B
0
10
20
30
40
50
Appa
rent
po
rosity %
Resin
Figure 28 – Column graph showing average apparent porosity in % for all nine
resins – CA (Capto Adhere), CQ (Capto Q), MS (MabSelect), MSX (MabSelect
Xtra), Q-HP (Q-Sepharose High Performance), S4FF (Sepharose 4 Fast Flow),
S6FF (Sepharose 6 Fast Flow), SCL4B (Sepharose CL4B), SCL6B (Sepharose
CL6B) – ImageJ counts the total number of black pixels (pores) against the total
number of pixels in the image and calculates this as a percentage. This was done
on 3 images of each resin. The averages are plotted with their standard deviations.

115
<=10
00
1001
-200
0
2001
-300
0
3001
-400
0
4001
-500
0
5001
-600
0
6001
-700
0
7001
-800
0
8001
-900
0
9001
-100
00
0
300
600
Fre
que
ncy
Pore size (nm2)
<=10000
10001-20000
20001-30000
30001-40000
40001-50000
50001-60000
60001-70000
70001-80000
80001-90000
90001-100000
100000+
0
300
600
900
Fre
que
ncy
a
Figure 29 – Column graphs showing pore size distribution of Capto Adhere resin.
(a) Graph showing the distribution of pores up to 1e05 nm2. The graph shows that
>97% of the pores are less than 10000 nm2. (b) Graph showing the size
distribution of pores up to 10000 nm2. The graph shows that ~70% of the pores are
less than 1000 nm2 in size. 1000nm2 ≈ 36nm (diameter) based on conversion πr2.
b

116
Resin
Frequency
Pore size
range (nm2) CA CQ MS MSX QHP S6FF SCL6B S4FF SCL4B
≤1000 558 625 499.3 241.6 757.3 445.6 629.6 348 627
1001-2000 137 127 0 0 0 43.3 100.3 120.6 46.6
2001-3000 47 102.6 0 0 36.6 27.3 70.3 66.6 59.6
3001-4000 29 40 22.6 0 16 71.3 36 34 36
4001-5000 10.3 40.3 45 16.3 0 0 45.6 22.6 0
5001-6000 15 17.6 0 0 17.3 9 0 14 24.3
6001-7000 5 22.3 4.3 0 18.6 20.6 27 14.6 7
7001-8000 5.6 13.3 0 0 7 13.3 9 7.6 19
8001-9000 3 15.6 8 8.3 9.3 3.3 17.6 6 0
9001-10000 4 6 9.6 7 0 8.3 7 3.6 5
Total 814 1010 589 273.3̇̇ 862.3̇̇ 642.3̇̇ 942.6̇̇ 638 824.6̇̇
%<1000 69% 62% 85% 88% 88% 69% 67% 55% 76%
Resin
Frequency
Pore size range
(nm2) CA CQ MS MSX QHP S6FF SCL6
B
S4FF SCL4B
≤10000 814 1010 589 273.3 862.3 642.3 942.6 638 824.6
10001-20000 15.3 44.6 18.6 12.3 29.3 34.3 27.3 9.3 8
20001-30000 7 6 8.3 9.6 6.6 7 5 1 0.6
30001-40000 1.3 1.6 4.3 4.3 5 5.6 2.6 0 0
40001-50000 0.3 1.3 1 2.3 2 2.3 1 0 0
50001-60000 0.3 0 1.6 2 2.3 1.3 1.3 0 0
60001-70000 0.3 0 0.6 1.6 4 1 1.3 0 0
70001-80000 0 0 0.3 0.6 1 0 0 0 0
80001-90000 0 0 0.6 2.3 1.3 0 0 0 0
90001-100000 0 0 0.3 0.3 0 0 0 0 0
100000+ 0 0 1 1.6 2.6 0 0 0 0
Total 838.6̇̇ 1063.6̇̇ 626 310.6̇̇ 916.6̇̇ 694.3̇̇ 981.3̇̇ 648.3̇̇ 833.3̇̇
%≤10000 97% 95% 94% 88% 94% 93% 96% 98% 99%
Table 11 – Pore size distributions up to 100000nm2 (≈d360nm based on area of a
circle πr2.) On average, 95% of all pores within 100000nm2 are ≤10000nm2
(≈d100nm).
Table 12 – Pore size distributions up to 10000nm2 (≈d100nm based on area of a circle
πr2.) On average, over 70% of all pores within 10000nm2 are ≤1000nm2 (≈d36nm).

117
Resin
Frequency
Pore
size
range
(nm2)
CA CQ MS MSX QHP S6FF SCL6B S4FF SCL4B
≤100 550 625 499.3 241.6 757.3 445.6 629.6 348 627
101-
600
0 0 0 0 0 0 0 0 0
601-
700
8 0 0 0 0 0 0 0 0
701-
1000
0 0 0 0 0 0 0 0 0
Table 13 – Pore size distributions up to 1000nm2 (≈d36nm based on area of a circle
πr2.) On average, almost 100% of all pores within 1000nm2 are ≤100nm2
(≈d10nm).

118
3.2.3. Quantitative image analysis
Figures 26-28 are graphs showing the average pore count, pore size (nm2), and
apparent porosity (%) of all nine resins used in this study - CA (Capto Adhere), CQ
(Capto Q), MS (MabSelect), MSX (MabSelect Xtra), Q-HP (Q-Sepharose High
Performance), S4FF (Sepharose 4 Fast Flow), S6FF (Sepharose 6 Fast Flow),
SCL4B (Sepharose CL4B), SCL6B (Sepharose CL6B) – based on 3 bead surface
images. ImageJ calculates the total number of enclosed black pixels and converts this
into nanometres, based on the scale set by the user (see section 3.2.2.). From this, the
three aforementioned properties are determined. The total number of enclosed black
pixels represents the pore count, the average area of all enclosed black pixels is the
average pore size and the percentage of the image constituted by enclosed black
pixels represents apparent porosity.
Figure 26 shows the average pore count of each resin used in this study. The results
show Capto Q to have the highest pore count (>1000) and MabSelect Xtra to have
the least number of pores (~300). Whilst this property is not so easily observed by
ocular judgement of figures 17-25, it can quite clearly be observed that Capto Q does
have a relatively high number of pores whilst MabSelect Xtra has a low pore count
for the same surface area. In this case, both qualitative and quantitative analyses are
in agreement. Capto Adhere and Q-Sepharose High Performance show a high degree
of variability in their pore count, which is more readily observed in the images
collected for Q-HP resin than Capto Adhere. Possible reasons for such variability not
perceived by qualitative analysis could be due to differences during the thresholding
stage of the quantitative analysis process, during which, some pores may not have
been accounted for or/and many sub-surface pores were added to the total pore
count, leading to high variability (Morse, 2000). The results also show that the Fast
Flow resins - SF44 (~650) and S6FF (~700) - have lower pore counts compared to
their Cross-linked (-CL) counterparts - SCL4B (~830) and SCL6B (~980). This can
also be observed visually in figures 19-22, meaning that both qualitative and
quantitative analyses are in agreement.
Figure 27 shows the average pore size (nm2) of all nine resins used in this study. For
simplicity, pore diameter information is calculated based on the assumption of a pore

119
having the shape of a circle. Therefore, to convert pore size in nm2 to nm, the
equation πr2 is used. The results show that MabSelect Xtra has the highest average
pore size (~7000nm2 ≈ d95nm) whilst Sepharose 4 Fast Flow has the lowest
(~1500nm2 ≈ d44nm). This can be visually observed in figures 20 and 24 as MSX
appears to have relatively larger pores whilst S4FF has uniformly smaller pores.
Both qualitative and quantitative analyses are in agreement in this case. The
remaining resins all display similar average pore sizes. Such similarities were not
immediately visually observed for some resins, particularly for Q-HP. Q-HP appears
to have relatively larger pores (see figure 23(B)). However, a possible reason for the
discrepancies between qualitative and quantitative analysis in this case could be due
to the observed irregularities in the matrix structure of Q-HP. There appear to be
many large pores, however, there are many very small pores located randomly in
clusters on the bead surface (as described in section 3.2.1) This may account for the
reason why, on average, the pore size of Q-HP is similar to the other studied resins.
Figure 28 shows the average apparent porosity (%) of all nine resins used in this
study. The results show Q-HP to have the highest porosity (44%) and S4FF to have
the lowest (17%). The low apparent porosity of S4FF can be readily observed in
figure 20, as S4FF appears to relatively be the most gel-like and therefore have
higher fibrosity compared to the other studied resins, as figure 28 also clearly
indicates. Figure 23(B) (Q-HP bead surface image) also shows relatively high
apparent porosity, meaning that both qualitative and quantitative analyses are in
agreement in this case. The remaining 7 resins also display very similar levels of
apparent porosity. However, overall the results show that over 50% of the bead
structure for all resins is composed of the fibrous network. This results cannot be
directly compared with other studies that measure porosity such as Stickel &
Fotopoulos 2001, as the 3-D nature of the pores is not accounted for in this study
(hence the use of the term ‘apparent’ porosity), however similar studies have used 2-
D pore measurements to provide comparative information to qualitative observations
(Ioannidis, 2009).
Figure 29 and tables 11, 12 and 13 show the pore size distributions for all nine resins
used in this study. Table 4 shows the pore size distributions every 10,000 nm2 up to

120
1e5 nm2 (≈d360nm). The results for all resins showed that on average 95% of the
pores were less than 10,000 nm2 (≈d100nm). Table 12 shows how the pore sizes
were distributed for every 1000 nm2 up to 10,000 nm2. In this table, there appears to
be more of a distribution observed in each band compared to table 11. Table 13
shows how the pores were distributed for every 100 nm2 up to 1000 nm2 (≈d36nm).
Almost 100% of the pores within 1000 nm2 were 100 nm2 or less (≈d10nm).
The resin that showed the widest distribution of pore sizes was MabSelect Xtra. Over
12% of pores were larger than 10,000 nm2, with pore sizes recorded in every band
width. This could account for why the highest average pore size was measured for
this resin. The resins that showed the narrowest distribution of pore sizes were
Sepharose 4 Fast Flow and Sepharose CL-4B. This could account for why the
lowest average pore size was recorded for Sepharose 4 Fast Flow. SCL4B had a mid-
range average pore size, however, the narrow pore size distribution appears to be
more in line with what is visually observed in figure 19(B). Resins that followed
MabSelect Xtra with wide pore size distributions were MabSelect and Q-Sepharose
High Performance. This could also be visually observed in figures 18(B) and 23(B)
respectively. Capto Adhere and Capto Q showed similar distributions which could
also be observed in figures 17(B) and 25(B). Both resins also had similar average
pore sizes. Tables 11 and 12 also show that S6FF and SCL6B had similar
distributions, however, S6FF has a slightly wider pore size distribution than SCL6B.
Although this is not immediately obvious in figures 21(B) and 22(B), S6FF does
report a slightly higher average pore size compared to its Cross-linked (-CL)
counterpart. Direct comparison of these results to other similar studies conducted by
Yao & Lenhoff 2004; Sepsey et al. 2014; Bacskay et al. 2014 cannot be made as
these studies account for the 3-D nature of the pores. However, as previously alluded
to, quantitative information gained by image analysis data can provide support to
qualitative observations.
Overall the results show that the studied resins can be characterised according to the
properties used in this study (table 14). The Capto family of resins have a greater
number of pores whilst MabSelect Xtra has a low pore count, larger pores and a wide
pore size distribution. Similarly, MabSelect and Q-HP also have a wide pore size
distribution and relatively high apparent porosity values. The Sepharose Fast Flow

121
family (4 and 6) had lower pore sizes compared to their Cross-linked counterparts
and S4FF in particular had the lowest recorded apparent porosity value. The results
also show that general trends observed using qualitative analysis can be measured
quantitatively. However, the results have also shown that there are challenges in
attempting to quantify images displaying 3-D data.

122
Resin Pore count Pore size Apparent
porosity
Pore size
distribution
Capto Adhere High Low High Mid
Capto Q High* Low High Mid
MabSelect High Mid High High
MabSelect Xtra Low* High* High High*
Q-Sepharose
HP
High High High* High
Sepharose 6 FF Mid High High Mid
Sepharose CL-
6B
High Low Mid Mid
Sepharose 4 FF Low Low* Low* Low
Sepharose CL-
4B
High Mid Mid Low*
Table 14 Summary table characterising the bead surface structure of the nine resins used
in this study relative to each other, based on 4 properties – pore count, pore size, apparent
porosity, pore size distribution. A green box represents relatively high values for the
assigned category, yellow represents mid-range values and blue represents low values.
The asterisk shows the resin that reported the highest/lowest value for the given property.

123
3.2.4. The challenges of using SEM for quantitative image analysis
Whilst SEM is one of the most widely used tools for structural analysis of biological
materials (Kervrann et al., 2016), there were a number of challenges faced in this
study when using SEM to obtain a large number of high resolution images for
quantitative analysis.
Due to the sensitivity of the fibrous polymer network that constitutes the agarose
bead structure, the resins are particularly susceptible to damage due to the effects of
irradiation by the focused beam of electrons. There are primary and secondary
effects on the sample surface when the beam is focused on one area for a relatively
short period of time. Primary effects involve polymer ionisation and damage to
chemical bonds. Secondary effects are mainly heat generation, chain scission and
charging-up of the sample, which affects the maximum resolution that can be
achieved for that image (Michler, 2008).
A solution to this issue was to use a ‘low-dose’ technique when imaging. This
involved adjustments to microscope parameters such as magnification, matching the
electron dosage to the sensitivity of the bead sample and focusing on an area of the
sample adjacent to the structure to be viewed (Buban et al., 2010). However, there
were still issues faced with this technique as, due to the spherical and heterogeneous
nature of the bead and bead surface, focusing on an adjacent area still resulted in
having to refocus the beam and readjust certain parameters when capturing images
on the area of interest. The time spent making these adjustments on the area of
interest created secondary effects, meaning that whilst some observations could be
made using qualitative analysis, there would be further limitations when trying to use
these images for quantitative analysis. Furthermore, each resin used in this study
exhibited different levels of sensitivity when under the microscope. The softer gels,
such as SCL4B and S4FF were much more difficult to image and exhibited higher
levels of sensitivity, meaning even less contact time between the focused beam and
the sample surface, resulting in fewer high resolution images being obtained.

124
A further challenge in using SEM for quantitative analysis was the use of 2-D
imaging on 3-D specimen. As pores have 3 dimensions, using SEM for quantitative
pore size analysis meant that the depth of pores could not be measured, resulting in
imprecise values. However, these observations could be somewhat made out using
qualitative analysis. Therefore, the values obtained using quantitative analysis cannot
be used as ‘true’ characterisation values but the trends can be used to support what is
visually observed (Ioannidis, 2009). A more general challenge faced during
quantitative image analysis was the use of manual thresholding using ImageJ. Whilst
the option to allow ImageJ to automatically threshold exists, this option was not
feasible for the resins used in this study as each resin was structurally different and
therefore each required a different amount of thresholding. Care was taken to neither
over- nor under- threshold each image; however, due to the variability of this
process, the quantitative values obtained maybe over or under representative of what
can be observed qualitatively (https://imagej.net/Thresholding).

125
3.3.Conclusion
As previously outlined, scanning electron microscopy (SEM) is a imaging technique
routinely used to generate high-resolution images and is used widely in chemistry
and biosciences to identify microstructures, spatial compositions and the general
characterization of solid materials down to less than 50nm in size (Swapp, 2015).
Relatively little sample preparation is required and it provides accurate information
regarding the 3D morphology and the location of features relative to each other,
whilst still providing sufficient resolution and magnification required for this
particular application. The main limitation however, is that samples must be dry
prior to imaging.
This chapter explored three commonly applied drying techniques – air drying, freeze
drying and critical point drying (CPD) – on two resins – Capto Adhere and
MabSelect – to determine which drying technique was most suitable for the
ultrastructural characterisation of the agarose-based chromatography media used in
this study. The results showed that air drying was sufficient enough to provide
microstructural information and clearly showed the variations in particle size
distribution and bead morphology under SEM. However, no clear surface details
could be identified using the air drying technique for both resins. Freeze drying
resulted in changes to bead morphology. This meant that the surface topography was
irregular, which created challenges in achieving clear topographic images. CPD
however allowed for clearer microstructural and nanostructural imagining. This
drying technique was applied to all resins used in this study for ultrastructural
characterisation.
The images of all nine resins – Capto Adhere, Capto Q, MabSelect, MabSelect Xtra,
Q-Sepharose High Performance, Sepharose 6 Fast Flow, Sepharose CL-6B,
Sepharose 4 Fast Flow and Sepharose CL-4B were then qualitatively analysed based
on differences in their structural make up, more precisely, apparent porosity and
fibrosity differences. Based on this, four quantifiable properties were selected to
better characterise the resins – pore count, average pore size, apparent porosity and
pore size distribution. 3 images of each resin were analysed using ImageJ and the

126
results were used to determine whether they could support the characteristics
observed qualitatively.
The values of the properties obtained for each resin using ImageJ analysis generally
concurred with what could be observed by visual judgement and trends could be
observed between sets of resins. The Capto family of resins had a greater pore count
on average whilst MabSelect Xtra had the lowest pore count, larger pores and a wide
pore size distribution. Similarly, MabSelect and Q-HP also had a wide pore size
distribution and relatively high apparent porosity values. The Sepharose Fast Flow
family (4 and 6) had lower pore sizes compared to their Cross-linked counterparts
and S4FF in particular had the lowest recorded apparent porosity value. The results
also show that general trends observed using qualitative analysis can be measured
quantitatively. However, the results have also shown that there are challenges in
using SEM for quantitative image analysis.
The main challenges faced when using SEM for quantitative image analysis involved
obtaining a large number of images with consistently high enough resolution. This
proved difficult due the high sensitivity of the polymers and their susceptibility to
damage if exposed to the focused electron beam for too long. A further challenge
was the use of 2-D imaging to characterise 3-dimensional properties. As a result, the
values obtained can only be used to support visual observations.

127
CHAPTER 4 PRESSURE-FLOW
CHARACTERISATION AND THE APPLICATION OF DYNAMIC
MECHANICAL ANALYSIS (DMA)

128
4. PRESSURE-FLOW CHARACTERISATION AND THE
APPLICATION OF DMA
In the previous chapter structural differences were observed across nine agarose-
based chromatography resins – Sepharose CL-4B (4% agarose content), Sepharose
CL-6B (6% agarose), Sepharose 4 Fast Flow (4% agarose), Sepharose 6 Fast Flow
(6% agarose), Q-Sepharose High Performance (6% agarose), MabSelect Xtra (6%
agarose, highly cross-linked), MabSelect (6% agarose, highly cross-linked) Capto
Adhere (7% agarose, highly cross-linked) and Capto Q (7% agarose, highly cross-
linked) - using scanning electron microscopy. The micrographs showed differences
in matrix formation, pore size, pore size distribution, porosity and pore count. Capto
Q had the highest pore count (>1000), MabSelect Xtra had the lowest pore count
(~300), the highest pore size (7000nm2) and the highest pore size distribution, while
SCL4B had the lowest pore size distribution. S4FF had the smallest average pore
size (1500nm2) and the lowest porosity (17%), while Q-HP had the highest porosity
at 44%.
This chapter looks to investigate whether the structural differences observed in
chapter 3 are indicative of mechanical differences. The pressure-flow technique is an
established method of mechanical characterisation and is used traditionally to
determine the limit of the operating pressure drop and flow velocity. In order to
obtain meaningful data, the column packing procedure is a critical step. The bed
needs to be aligned such that the hydrodynamic pressure applied is evenly spread
across the axial direction of the column. However, there are a number of issues
associated with packing columns for the purpose of pressure-flow testing. This
chapter reviews the importance of column packing and considers the challenges in
achieving a well packed column.
The technique itself will be applied to the aforementioned nine resins for
consistency. This method involves gradually increasing the flow rate until an infinite
rise in the pressure drop is observed without further increase to the flow rate. The
point at which an infinite rise in the pressure profile is observed without further
increase to the flow rate is the point at which the column has ‘failed’ and is deemed
129
the critical velocity. The pressure-flow profiles of all nine resins and the limitations
of the pressure-flow technique are discussed in this chapter.
A technique that addresses the limitations of pressure-flow characterisation and also
allows for enhanced understanding of the mechanical behaviour of chromatography
media is required. DMA is widely used to characterise a material’s properties as a
function of time, temperature, stress, strain, frequency, force, atmosphere or a
combination of these parameters and provides information about the viscoelastic
behaviour of the material. The choice of parameters to use for any given experiment
is dependent on a number of factors such as sample consistency, morphology, size,
among other factors. This chapter discusses the development of the DMA technique
and parameter selection process for chromatography resins. The procedure is applied
to the same nine resins and the results are presented and discussed. The application
of this technique will need to be correlated with pressure-flow data to verify its
validity. The DMA results are compared to pressure-flow data to observe any
correlations.

130
4.1 The challenges of column packing
Column packing is central to chromatographic performance as it allows for
maximum efficiency, high yield and purity. Because of this, regulatory authorities
require that the packing process is robust and reproducible (Kennedy, 2003). The bed
needs to be aligned such that the hydrodynamic pressure applied is evenly spread
across the axial direction of the column and the density of the packed bed needs to be
homogeneous with a controlled interstitial volume (Cheng, 2009). If this is not the
case, channels may form in the bed resulting in loss of product yield and quality.
Alternatively poor packing can also lead to cracking of the column and mechanical
damage to the beads.
The most common packing method uses the flow packing technique, which was
adopted in these investigations (Cheng, 2009). All the resins used in this study were
packed with the same general technique in the sequence outlined below:
- Transfer the slurry to an empty column
- Slurry resuspension
- Lowering of the top adaptor
- Applying flow to the slurry to pack the rein
- Lowering the top adaptor to the final bed height
Despite the consistency in this technique, there were still challenges in achieving a
well packed column in the first instance and in many cases, multiple attempts were
required. The quality of the packing is known to be influenced by factors such as the
chosen packing buffer, packing flow rates and the packing and compression factors
specific to the resin type. For typical protein purification applications, the column
asymmetry can range between 0.8-1.5. However a challenge faced when column
packing for pressure-flow studies was that the asymmetry range was more stringent
(0.8-1.2). Results in this study showed that when an asymmetry above 1.2 was
obtained, the subsequent pressure-flow test led to no runaway rise to the pressure
profile with increasing flow rate (table 15; figure 30).

131
Consequently various troubleshooting methods were employed (table 16) and the
packing quality was re-evaluated (Bemberis, Noyes and Natarajan, 2003). More
often than not, the troubleshooting techniques led to little improvement in the
asymmetry value and the columns were repacked until an asymmetry of less than 1.2
was achieved. To ascertain whether the stringent asymmetry range was due to the
apparatus used, the same experiment was performed on the AKTA Avant using
Capto Q (3 tests were performed, results not shown). The outcome using the two
systems (AKTA Pure and Avant) were the same (no pressure-flow profile was
obtained when asymmetry was above 1.2). The critical velocity values obtained on
the AKTA Avant were between 480 and 500 cm/hr (in agreement with AKTA Pure
results, shown below).
A further challenge faced was that some matrices required more packing attempts
than others. Although each resin required repacking on at least one occasion, the
softer gels such as Sepharose CL-4B and Sepharose CL-6B in some instances
required at least 3 attempts before an asymmetry of less than 1.2 was achieved. This
was also the case with resins that had been exposed to aged and CIP conditions,
Reasons for this could be that the softer gels have less cross-linking, lower agarose
content and a wider particle size distribution compared to the Capto and MabSelect
family of matrices, meaning that pressure fluctuations (either caused by flow or the
lowering of the adaptor) were more likely to cause possible changes in bead
morphology. The wider particle size distribution may have impacted the interstitial
volume making it more difficult to control. The resins that had been exposed to
aged/CIP conditions may have been mechanically compromised in this process,
which may have made them more challenging to pack. It should be noted that
automated packing systems e.g. AxiChrom can save both time and labour costs and
achieve a more consistent pack compared with pack-in-place procedures however
this was not an available resource during this study.

132
Resin type Initial As Troubleshooting
method
New As
Capto Q 1.23 Lower top adaptor 1.21
SCL6B 1.21 Reduce flow rate 1.21
S4FF 1.41 - Flow in reverse
direction
- Reduce flow rate
1.40
MabSelect 1.50 - Modify injection
loop
- Reduce flow rate
1.47
Resin Run Asymmetry Critical velocity
(cm/hr)
Capto Q 1 1.07 477
2 1.19 507
3 1.23 N/A*
SCL6B 1 0.98 283
2 1.21 N/A*
3 1.30 N/A*
S4FF 1 1.41 N/A*
2 1.08 194
3 1.18 209
Mabselect 1 1.50 N/A*
2 1.02 418
3 1.04 418
Table 15 Asymmetry results showing 3 repeats/runs for Capto Q, Sepharose CL-6B
(SCL6B), Sepharose 4 Fast Flow (S4FF) and MabSelect in an XK16 column, bed height
15cm. N/A* indicates that no critical velocity value was recorded for the associated run.
The flow rate was increased in a step-wise fashion until at least 50ml/min (~1500 cm/hr)
before it was determined that there would be no critical velocity value recorded. The
column consequently had to be repacked until an asymmetry below 1.2 was achieved.
Table 16 – Troubleshooting methods used in an attempt to achieve an asymmetry below
1.2. All methods resulted in a slight increase to the asymmetry value however a value
below 1.2 was not obtained. A maximum of two troubleshooting methods were
employed on each resin as to not cause any mechanical damage. All columns were
repacked until an asymmetry of >1.2 was achieved.
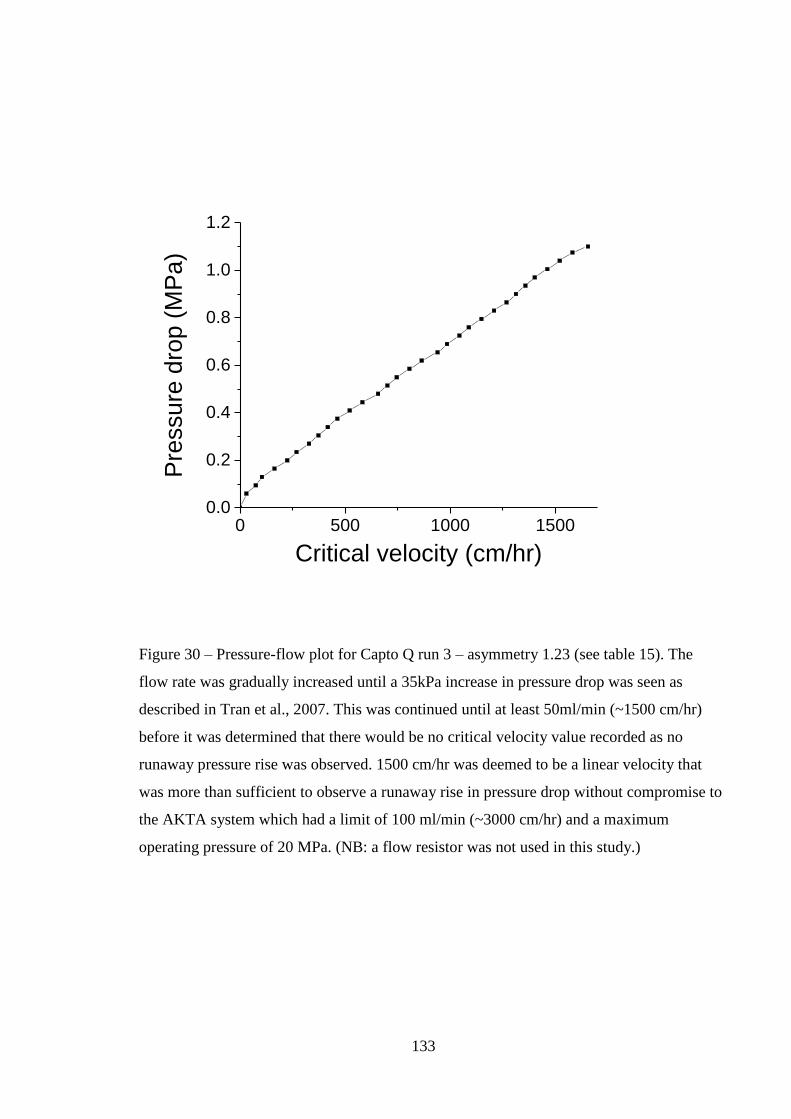
133
Figure 30 – Pressure-flow plot for Capto Q run 3 – asymmetry 1.23 (see table 15). The
flow rate was gradually increased until a 35kPa increase in pressure drop was seen as
described in Tran et al., 2007. This was continued until at least 50ml/min (~1500 cm/hr)
before it was determined that there would be no critical velocity value recorded as no
runaway pressure rise was observed. 1500 cm/hr was deemed to be a linear velocity that
was more than sufficient to observe a runaway rise in pressure drop without compromise to
the AKTA system which had a limit of 100 ml/min (~3000 cm/hr) and a maximum
operating pressure of 20 MPa. (NB: a flow resistor was not used in this study.)
0 500 1000 15000.0
0.2
0.4
0.6
0.8
1.0
1.2
Pre
ssu
re d
rop
(M
Pa)
Critical velocity (cm/hr)

134
4.2.Pressure-flow characterisation
Pressure-flow characterisation is performed to obtain data that is representative of
the pressure-flow relationship of the column during operation. This information is
then used to predict the limit of the operating pressure drop and flow velocity. In
contrast to open bed pressure-flow measurements, the top bed support is in contact
with the bed, creating a compressed structure. Therefore, a compression factor
(usually ranging from 1.15 to 1.20 for agarose-based resins) is applied during media
packing. Packed bed pressure-flow information is mainly used to determine the
pressure drop during column operation. The acquired data provides information
regarding the flow velocity limit for the media in use. The limit denotes the point at
which the bed will start to compress to such an extent that a gap is created between
the top bed support and the bed (resin rigidity limit) (Jagschies, Sofer and Hagel,
2008).
In this technique, the flow rate of the packing buffer was increased until a 35 kPa
increase in pressure drop was observed. This was achieved by applying gradual
increments to the flow rate (usually a 0.5 ml/min increase each time). When each 35
kPa increase had been reached, the fluid flow rate measurements were taken. The
procedure was conducted until the point at which the pressure proceeded to rise
rapidly without further increase to the flow rate. The flow rate at which this occured
was converted to linear velocity. This linear velocity value denoted the point at
which the column had ‘failed’ and is generally termed the critical velocity (Tran et
al., 2007). In theory, the more rigid the resin is, the higher the critical velocity. This
means that gels that are manufactured to be softer or more compressible will require
lower pressures and fluid flow rates to ‘fail’ or reach critical velocity, while the more
rigid resins will withstand higher pressures and fluid flow rates before critical
velocity is reached. The analysis also gives an indication as to whether it is the resin
or the column that sets the flow velocity and pressure limits (Stickel and Fotopoulos,
2001).

135
In this study an XK16 column (diameter 16mm) was used for all experiments and
the bed was packed to a height of 15cm. This aspect ratio was chosen to avoid wall
support issues that arise when using narrower columns, which can in turn lead to
unexpectedly high pressures. Three repeats of the procedure were conducted for all
nine resins and the averages were plotted. The standard deviations from the average
(based on the repeats) are represented by the error bars (figure 31). The degree to
which any individual repeat may vary is reliant mainly on column packing and the
resulting asymmetry. The probability that a column will pack in exactly the same
way, despite using the same procedure is low. This is represented by the asymmetry
value obtained. Although the asymmetry differed for all repeats, it was maintained in
the range of 0.8-1.2, which may have required multiple repacks to achieve (see
section 4.1). A reduction in bed height during the changes to flow velocity may also
be observed (Tran et al., 2007).

136
Figure 31 – (a) Pressure-flow plot showing 3 repeats for Sepharose 6FF (6% cross-linked
agarose) (one solid line, one dashed line, one dotted line). (b) Pressure-flow plot showing
averages of 3 out of the 9 resins – Sepharose CL-4B (4% cross-linked agarose) (squares),
Sepharose 6FF (6% cross-linked agarose) (circles) and Capto Q (7% highly cross-linked
agarose) (triangles). Error bars representing pressure and flow rate are +/- one standard
deviation taken from the 3 repeats.
0 100 200 300 400 5000.0
0.1
0.2
0.3
0.4
0.5
0.6
SCL4B
S6FF
Capto Q
Pre
ssure
dro
p (
MP
a)
Linear velocity (cm/hr)
0 100 200 300 4000.0
0.1
0.2
0.3
0.4
0.5
0.6P
ressu
re d
rop
(M
Pa
)
Linear velocity (cm/hr)

137
Figure 32 shows the critical velocities for each resin using the pressure-flow
characterisation technique using an XK16 column with a bed height of 15cm. Capto
492477
423403
353 348
283
204
149
Cap
to Q
Cap
to A
dher
e
Mab
Selec
t
Mab
Selec
t Xtra
Q-H
P
S6F
F
SCL6
B
S4F
F
SCL4
B
0
100
200
300
400
500
Critica
l velo
city (
cm
/hr)
Resin type
Figure 32 – Critical velocity for each resin obtained using the pressure-flow technique in an
XK16 column, bed height 15cm. Each bar represents an average of the point before column
failure. The error bars represent the standard deviation of 3 repeats of each resin. Capto Q - µcrit
492 cm/hr (7% highly cross-linked agarose), Capto Adhere - µcrit 477 cm/hr (7% highly cross-
linked agarose), MabSelect - µcrit 423 cm/hr (6% highly cross-linked agarose), MabSelect Xtra -
µcrit 403 cm/hr (6% highly cross-linked agarose), Q Sepharose HP - µcrit 353 cm/hr (6% cross-
linked agarose), Sepharose 6FF - µcrit 348 cm/hr (6% cross-linked agarose), Sepharose CL-6B -
µcrit 283 cm/hr (6% cross-linked agarose), Sepharose 4FF - µcrit 204 cm/hr (4% cross-linked
agarose), Sepharose CL-4B - µcrit 149 cm/hr (4% cross-linked agarose)

138
Capto Q has the highest critical velocity at 492 cm/hr, followed by Capto Adhere –
477 cm/hr, MabSelect – 423 cm/hr, MabSelect Xtra – 403 cm/hr, Q-Sepharose HP –
353 cm/hr, Sepharose 6FF – 348 cm/hr, Sepharose CL-6B - 283 cm/hr, Sepharose
4FF – 204 cm/hr and Sepharose CL-4B – 149 cm/hr.
The results show that the Capto family (Capto Q and Adhere) are the least
compressible of the resins, followed the MabSelect family. This is expected as both
families are made of highly cross-linked agarose polymers and contain 7% and 6%
agarose respectively. Q-HP and S6FF are cross-linked resins that contain 6%
agarose. These two resins exhibit quasi-identical mechanical behaviour in the
column. Their main structural differences are observed in their average bead size and
their average pore size distributions (see chapter 3). S6FF resins are 2-3 times larger
in size (dp) compared to Q-HP, however the average pore size of S6FF (and Fast
Flow resins in general) is approximately 2-3 times smaller than that of Q-HP
(DePhillips and Lenhoff, 2000; Tarmann and Jungbauer, 2008; Hardin et al., 2009).
It has been established that both pore size distribution and bead size contribute to the
mechanical properties of chromatography media (Zhou et al., 2007; Yan et al.,
2009). The trade-off between these two parameters, as well as their identical
mechanical traits, may explain why both resins mechanically perform almost
identically in the column.
The results also show the differences in mechanical strength between SCL6B and
S6FF, as well as SCL4B and S4FF. Both pairs of resins are cross-linked and contain
6% and 4% agarose in their matrices respectively, however both fast flow resins are
mechanically stronger than their -CL counterparts. In both cases, the fast flow resins
withstand much higher flow rates according to the manufacturer’s specification,
which may indicate that their cross-linking was more extensive. Furthermore, their
electron micrographs show that they are structurally different (see chapter 3).
SCL6B, for example, appears to be more fibrous and more discontinuous compared
to its fast flow counterpart which has a more homogenous, continuous structure,
which may indicate greater mechanical strength. A further consideration concerns
the ligand chemistry. For example, the attachment of affinity chromatography
ligands would alter the mechanical properties of the base matrix, which would differ
for an ion exchange/hydrophobic ligand used as a polishing step.

139
4.2.1. The limitations of pressure-flow characterisation
There are advantages in using the pressure-flow technique to investigate the
mechanical properties of resins. These include the ability to determine the behaviour
of chromatography media in a packed bed and how mechanical properties vary with
media viscosity, pH, ionic strength, among other properties. However, a drawback of
this method is that it requires that the operator adheres to stringent packing criteria to
obtain meaningful data. As described in section 4.1, packing of columns can be a
time consuming and tedious process as several re-packs may be required to achieve
the desired asymmetry and each resin, depending on its chemical and mechanical
properties, has its own specific packing criteria. Furthermore, it is necessary to use a
column of a suitable diameter, such that wall effects that support the resin in narrow
columns do not dominate (Stickel and Fotopoulos, 2001). The bed height also needs
to be representative, as pressure drop directly correlates to the height of the bed,
meaning heights of 15cm or greater are typically used (Tran et al., 2007). For these
reasons, the pressure-flow technique consumes large quantities of chromatographic
media and buffers, which is costly (Warner and Nochumson, 2003).
4.3. The development of the DMA technique
As previously outlined, DMA is a technique widely used to characterise a material’s
properties as a function of time, temperature, stress, strain, frequency, force,
atmosphere or a combination of these parameters and provides information about the
viscoelastic behaviour of the material. The choice of parameter to use for any given
experiment is dictated by a number of factors including the sample’s physical state,
sample size, the difficulty in loading, the consistency of the sample and sample
morphology (Menard and Menard, 2015). Generally, if the sample is irregularly
shaped and/or difficult to mount (such as soft materials and gels) it is recommended
to use DMA for compression studies, which involves using the stress, strain and time
parameters in any suitable combination (Menard, 2008).
Traditionally, compression studies requiring the use of DMA measure stress (force
per unit area) as a function of strain (proportional deformation/displacement). The
stress-strain curve that is generated is used to calculate Young’s modulus which is a

140
universal indicator of a material’s stiffness (Moroni, De Wijn and Van Blitterswijk,
2006). However, in order to use Young’s modulus, the material needs to be
homogeneously solid, which is not the case for chromatography media. This means
that a suitable combination of parameters in this case would involve the use of time.
Given the physical properties of chromatography media and the liquid-like properties
of a slurry, the application of consistent force to observe changes in shear seemed
most ideal. Therefore in this study, a small deformation of constant force is applied
to a 1ml sample of resin in a sinusoidal manner, allowing the media to respond to
changes in strain over a period of time.
The DMA equipment itself is composed mainly of a pan and a lid, equipped with
sensors. The lid is equipped with a sensor that allows it to stop just at the surface of
the slurry once in descent, which allows the system to record the sample height.
When the methodology is started, a sinusoidal force of 100mN is applied at a
constant frequency of 1 Hz. As the lid descends, the slurry moves around the sides of
the lid and this movement is recorded as a displacement percentage with time.
Meanwhile, a time-strain profile is generated, where strain is the displacement of the
lid through the resin bed recorded as a percentage. Once a strain threshold is
exceeded, the rate of increase is vastly reduced or the plot begins to level out
completely and at this point ultimate compression is reached. This is either when the
lid has hit the bottom of the pan, or when little or no further deformation of the
slurry can be achieved with constant force. For consistency, the slope of the line is
taken before ultimate compression and this provides information about the
movement of the lid through the slurry with constant force. The units are recorded as
%min-1 (figure 33). The less viscous the media is, the quicker the lid will move
through the slurry, therefore the higher the % strain per minute. The procedure is
repeated 3 times for each resin (figure 34).

141
Figure 33 – Schematic of DMA methodology. The lid is equipped with a sensor that
records the initial height of the sample. When the methodology is started the
descending lid applies a sinusoidal force of 100 mN to the sample, causing the slurry to
deform and move around the sides of the lid. Strain (slurry displacement) is recorded
with time. A strain versus time plot is generated by the Pyris Manager software and the
slope of the line before ultimate compression determines the slurry deformation rate.

142
Figure 34 – (a) Strain v time plot for 3 repeats of Sepharose CL-4B (4% cross-linked
agarose) (one solid line, one dashed line, one dotted line). (b) Averages for 3 out of
9 resins – Capto Q (7% highly cross-linked agarose) (diamonds), MabSelect Xtra
(6% cross-linked agarose) (triangles) and Sepharose CL-4B (4% cross-linked
agarose) (circles). Error bars representing strain are standard deviations taken from
the 3 repeats of each resin. Shapes and error bars are plotted once every 250 data
points
0 40 800
50
100
Str
ain
(%
)
Time (mins)
0 40 800
50
100
Ave
rag
e s
tra
in (
%)
Time (min)
CQ
SCL4B
MSX

143
Figure 35 – (a) SDR for all 9 resins. For all resins, the gradient of the lines for all
three repeats are taken and averaged. The bar represents the average value and the
error bars are standard deviations based on the three repeats. (b) Parity plot –
Slurry resistance. The values are obtained by calculating 1/SDR values obtained
for all 9 resins. This can then be better compared to figure 32 as it also emphasises
further the difference between the more rigid resins compared to the less rigid.
3
2.5
1.7
1.1 1.1
0.61 0.55 0.520.36
SCL4
B
S4F
F
SCL6
B
Q-H
P
S6F
F
Mab
Selec
t Xtra
Mab
Selec
t
Cap
to A
dher
e
Cap
to Q
0
1
2
3
Slu
rry D
efo
rma
tio
n R
ate
(%
/min
)
Resin Type
0.3 0.40.59
0.9 0.9
1.641.81
1.92
2.7
SCL4
B
S4F
F
SCL6
B
Q-H
P
S6F
F
Mab
Selec
t Xtra
Mab
Selec
t
Cap
to A
dher
e
Cap
to Q
0
1
2
3
Slu
rry R
esis
tan
ce
(1
/% m
in-1)
Resin Type

144
Figure 35a shows the slurry deformation rates for each resin using the DMA
technique. Capto Q has the slowest slurry deformation rate at 0.36 %/min, followed
by Capto Adhere – 0.52 %/min, MabSelect – 0.55 %/min, MabSelect Xtra – 0.61
%/min, Q-Sepharose HP and Sepharose 6FF – 1.1 %/min, Sepharose CL-6B – 1.7
%/min, Sepharose 4 FF – 2.5 %/min and Sepharose CL-4B – 3 %/min.
Figure 35b shows the graph obtained by plotting the reciprocal of the SDR values for
each resin. The resulting parameter was termed ‘slurry resistance (1/%min-1)’. This
approach allowed for a positive correlation between the pressure-flow technique and
the DMA technique and more clearly highlighted distinctions between the more
mechanically robust resins and weaker resins. The results show Capto Q has the
highest slurry resistance of 2.7 , followed by Capto Adhere – 1.92, MabSelect - 1.81,
MabSelect Xtra – 1.64, Q-Sepharose High Performance and Sepharose 6 Fast Flow -
0.90, Sepharose CL-6B - 0.59, Sepharose 4 Fast Flow - 0.4 and Sepharose CL-4B -
0.3.
The same trends observed in figure 32 are observed in figure 35b. The results from
figure 35b show that Capto Q is most resistant to deformation, followed by Capto
Adhere, MabSelect, MabSelect Xtra, Q-Sepharose High Performance and Sepharose
6 Fast Flow, Sepharose CL-6B, Sepharose 4 Fast Flow and Sepharose CL-4B.
Similar to the trends observed in section 4.2, the results also show that Q-Sepharose
High Performance and Sepharose 6 Fast Flow exhibit very similar viscoelastic
properties. Both resins contain 6% agarose however there are differences in their
average bead sizes and pore sizes. The results also show the differences in
viscoelastic properties between SCL6B and S6FF, as well as SCL4B and S4FF. The
possible reasons for the observed trends are further explained in section 4.2. The data
from figures 32 and 35 are plotted for comparison (figure 36).

145
4.3.1. The advantages of DMA
The pressure-flow technique is useful for determining the mechanical behaviour of
chromatography media within a packed bed as well as the effects of fluid viscosity,
pH, ionic strength etc. However there are limitations associated with the stringent
packing criteria, the potential of multiple repacks and the quantity of media and
buffers consumed. DMA is a tool that allows for flexibility in the use of parameters
and can be tailored according to the mechanical properties to be studied. It allows for
the use of small quantities of sample (~1ml) and requires relatively little preparation.
Furthermore, it measures mechanical behaviour based on changes in viscoelasticity
as opposed to critical velocity, which allows for an enhanced understanding of the
mechanical properties of chromatography media. The low force of 100 mN applied
in a sinusoidal manner is non-destructive to the media over an extended period of
time (80 minutes). Given these advantages, it can potentially be used to investigate
the mechanical properties of other media types, e.g. non-agarose based resins. It may
also be used in the development of new resins for rapid screening post-
emulsification.

146
4.4. Data correlation – Pressure-flow vs Dynamic Mechanical analysis
The pressure-flow technique has proven to be a reproducible way of obtaining
mechanical performance information of chromatography media. Despite this, the
limitations of this technique indicate that further information about media
mechanical performance is required. Therefore, additional techniques are necessary
in order to further enhance the understanding of the mechanical behaviour of
chromatography resins. However, the application of an additional technique will
need to be correlated with pressure-flow data to verify its validity. This technique
may then be applied as a combinatory technique together with pressure-flow for a
more comprehensive understanding of the mechanical properties of chromatography
media. The results from DMA are compared to that of pressure-flow to observe
whether any correlations can be established.
Figure 36a shows a strong negative correlation between critical velocity and slurry
deformation rate for all 9 resins used in this study. This means that the stronger
resins such as MabSelect, Capto Adhere and Capto Q have low SDRs and high ucrit
values and the opposite is true for mechanically weaker resins such as SCL4B and
S4FF. The trend begins in a linear fashion with the first five resins but then tapers off
when the more mechanically robust resins appear. This representation of results
indicates that as the resins become mechanically more similar and the difference in
their mechanical properties becomes less significant. However, as manufacturers and
regulatory authorities favour the use mechanically robust resins for separation, there
is an onus to better clarify the mechanical differences between the stronger resins.
Figure 36b shows a parity plot of figure 36a and the y-axis is represented as ‘slurry
resistance’. The values are calculated based on 1/SDR for each resin. The trend
observed is a positive polynomial trend for slurry resistance against critical velocity.
The first 5 resins show a gradual increase in mechanical resistance, however, the
difference in mechanical strength becomes more apparent when the more robust
resins (MabSelect, Capto Adhere and Capto Q) are plotted. This plot better
demonstrates the disparity in mechanical behaviour between each resin.

147
Both plots show strong correlations and can be used individually to either observe
mechanical differences between mechanically weaker media (figure 36a) or to
observe differences between more robust resins (figure 36b). The results therefore
indicate that DMA can be used as a combinatory technique to pressure-flow for the
characterisation of chromatography media.

148
Figure 36 – (a) SDR values shown in figure 35(a) plotted against ucrit values
shown in figure 32. Plot shows strong negative trend (b) Parity plot showing
slurry resistance. Slurry resistance values are calculated as 1/SDR. Plot shows
strong positive trend. Key: 1 – Sepharose CL-4B, 2 – Sepharose 4 Fast Flow, 3 –
Sepharose CL-6B, 4 – Sepharose 6 Fast Flow, 5 – Q-Sepharose High
Performance, 6 – MabSelect Xtra, 7 – MabSelect, 8 – Capto Adhere, 9 – Capto Q

149
4.5. Conclusion
Two important characteristics in determining mechanical strength of resins are their
percentage agarose content and their extent of cross-linking. Currently,
chromatography resin manufacturers use the pressure-flow characterisation
technique to determine the limit of the operating pressure drop and flow velocity that
resins can withstand. It is an established technique and allows for the behaviour of
chromatography media in a packed bed to be determined. Furthermore, the pressure-
flow technique can be used to investigate how mechanical properties of resins vary
with changes to media viscosity, pH, ionic strength, among other properties. In this
procedure, the fluid flow rate is manually increased until a runaway rise in the
pressure profile is observed. This is the point at which the column has ‘failed’ and is
termed the critical velocity. There are however, disadvantages in the use of this
method, including stringent column packing criteria and packing columns potentially
up to many litres in size. These processes can be both costly and time-consuming,
requiring a number of buffers to be used.
This chapter discussed the development of a DMA technique that does not require
the use of multiple buffers and uses a much reduced quantity of resin (~1ml). The
technique was tested on nine resins with varying mechanical properties and
compared to their pressure-flow characteristics. The results show a strong correlation
between both techniques and show the most mechanically robust resins to be Capto
Q, Capto Adhere, MabSelect and MabSelect Xtra. Both techniques also show that
Sepharose 6 Fast Flow and Q-Sepharose High Performance are mechanically similar.
The main differences in the techniques are observed in the quantitative values
obtained. Using the pressure-flow method, the most robust resin (Capto Q) had a
critical velocity 3 times higher than Sepharose CL-4B, whilst the DMA technique
showed Capto Q to have a slurry deformation rate 9 times higher than Sepharose CL-
4B. This could be due to increased sensitivity of mechanical changes as the sample
volume used for DMA is much smaller than that of pressure-flow. Notwithstanding,
the results do indicate that DMA can be used as a combinatory technique with
pressure-flow for determining mechanical performance of a given resin.
However, DMA alone does exhibit additional benefits over the pressure-flow
technique. It could be applied to non-agarose resins to determine mechanical

150
performance. The technique may also be useful for rapid testing of a range of resins
post-emulsification and during the development of new resins. It may also be
considered as a test to investigate mechanical differences in different parts of the
column during bioprocessing. These points are further discussed in Chapter 7 –
Future Work. Furthermore, it may also be used to test resins at different stages of its
lifetime during bioprocessing and also to test resins exposed to different conditions
in the column. This final point is investigated in the next chapter.
General correlations between the studied parameters in chapters 3 and 4 can be
drawn as to ascertain whether there is a link between the observed structural and
mechanical properties. The mechanically stronger resins (CQ, CA, MS) generally
had a higher pore count, higher apparent porosity and relatively smaller pore sizes
compared to the mechanically weaker resins. The pore size distribution was
relatively lower for older generation resins, compared to newer resins.

151
CHAPTER 5 THE STRUCTURAL AND
MECHANICAL CHARACTERISATION OF CYCLED RESINS

152
5. THE STRUCTURAL AND MECHANICAL CHARACTERISATION
OF CYCLED RESINS
Previous chapters explored the structural and mechanical characterisation of nine
fresh chromatography resins – Capto Adhere, Capto Q, MabSelect, MabSelect Xtra,
Q-Sepharose High Performance, Sepharose 6 Fast Flow, Sepharose CL-6B,
Sepharose 4 Fast Flow and Sepharose CL-4B - using scanning electron microscopy
and pressure-flow/dynamic mechanical analysis respectively. The resins were
structurally characterised based on pore count, apparent porosity, average pore size
and pore size distribution. Each resin exhibited different structural characteristics
when viewed under the electron microscope. Q-Sepharose HP had relatively high
values in all elements characterised, reporting the highest level of apparent porosity
at 44% whilst Sepharose 4FF had relatively low values in all elements characterised,
including the lowest level of apparent porosity at 17%. This indicates that the bead
structure is highly fibrous, which was also observed qualitatively (see chapter 3).
Pressure-flow analysis was then used to determine whether the structural properties
were indicative of mechanical strength. The results showed that the Capto family had
the highest critical velocities, followed by the MabSelect family. Q-HP and S6FF
exhibited quasi-identical behaviour in the column whilst SCL6B, S4FF and SCL4B
had the lowest critical velocity values (chapter 4). However, there were practical
limitations in using the pressure-flow technique alone to for mechanical
characterisation, including the large quantity of chromatography media required and
buffers, the stringent criteria required to pack a column, among others. The use of
DMA as a technique allowed for further mechanical characterisation based on the
viscoelastic properties of the resin using 1ml of resin. It also gives the user flexibility
in choice of parameters to be measured. The technique was also applied to the nine
studied resins and correlated with the results obtained using the pressure-flow
technique. The same trends were observed – The Capto family showed the highest
resistance to deformation, followed by the MabSelect family. Q-HP and S6FF
showed similar resistance and SCL6B, S4FF and SCL4B had the lowest slurry
resistance values.

153
These techniques are applied in this chapter to characterise the structural and
mechanical changes observed in resins that had undergone use in a bioprocess. The
resins used in this study were MabSelect, MabSelect Xtra, Q-Sepharose HP and
Capto Adhere and each resin has been exposed to two conditions – CIP and aged.
This chapter discusses the reasoning behind the selection of these conditions.
Subsequently, these resins are structurally characterised to determine whether there
are differences between resins exposed to buffers only (CIP) and resins used for
lifetime studies in the production of biopharmaceuticals (aged), namely monoclonal
antibodies and fusion proteins. ImageJ is used to quantify the structural properties
observed. Pressure-flow and DMA are then used to investigate the mechanical
differences between CIP and aged resins, which is then compared to the
characteristics observed in their fresh counterparts. Statistical analysis using one-way
ANOVA is carried out to determine whether the relationships between pressure-flow
and DMA data is significant and if so, to what extent. Further understanding of the
changes in structural and mechanical properties of resins over their lifetime may
facilitate timely and improved decisions in large-scale chromatographic operations,
potentially maximising resin lifetime.

154
5.1.Selecting bioprocessing conditions
MabSelect, Q-Sepharose High Peformance and Capto Adhere are resins widely used
in the biopharmaceutical industry as elements in platform type processes for the
purification of monoclonal antibodies and in this case, were used by Eli Lilly & Co.
in the purification of two biopharmaceutical products, a monoclonal antibody and a
fusion protein. In this study, the resins used form capture and polishing steps. These
resins were supplied by the company in their fresh and aged states as part of
laboratory-scale resin lifetime studies. Figure37 shows the process flow of unit
operations used to obtain the aged sample in the production of monoclonal
antibodies (table 17). MabSelect and Capto Adhere were used for lifetime studies
studies of an IgG4 product and make up the two chromatography operations in this
process (figure 37), whereas Q-HP was used in the latter stages of the separation
process in the production of a fusion protein. MabSelect Xtra was supplied by
another manufacturing company and is used as a capture step for monoclonal
antibody IgG1. This company had noticed severe back pressure increase as a
function of cycle number and therefore wanted to understand how the changing
structural and mechanical properties of aging MabSelect Xtra contributed to this
phenomenon.
The resins were also exposed to buffer-only conditions, termed CIP conditions (table
18). The purpose of this was to observe any changes in structural and mechanical
properties post-exposure to buffers only, i.e. without loading any biological material
onto the columns, with key focus on the effects of CIP reagents, which is likely to be
the most damaging element of the process cycle in absence of any biological
material. These experiments were designed to determine the impact of buffers and
CIP reagents on the structural and mechanical integrity of the resins compared to
their fresh and aged counterparts. These studies may also provide insight into the
effects of biological material on the columns as they can be used as a negative
control in studies of the bioprocess lifetime.
The CIP experiments were performed in-house on MabSelect, Q-HP and MabSelect
Xtra resins and Eli Lilly & Co. conducted CIP experiments on Capto Adhere resin.
All were conducted for 50 cycles. Due to the vast quantities of buffers that would

155
have to be used on larger columns, the experiments were conducted on smaller
columns. They were carried out five times for each resin on 5 separate 1ml HiTrap
columns supplied by GE Healthcare (Uppsala, Sweden). One column was used for
SEM studies and the remaining columns were used for DMA studies. The Capto
Adhere CIP material supplied by Eli Lilly & Co. was large enough to perform SEM,
pressure-flow and DMA studies (45ml column). The CIP conditions to which the
columns were exposed, aimed to be as closely matched as possible to the buffer
conditions used to generate the aged resins supplied by the aforementioned
companies. For confidentiality reasons, not all the information could be supplied by
both Eli Lilly & Co. and the second company. Where there were gaps in information,
process conditions on freely accessible data sheets reported by GE Healthcare were
substituted.
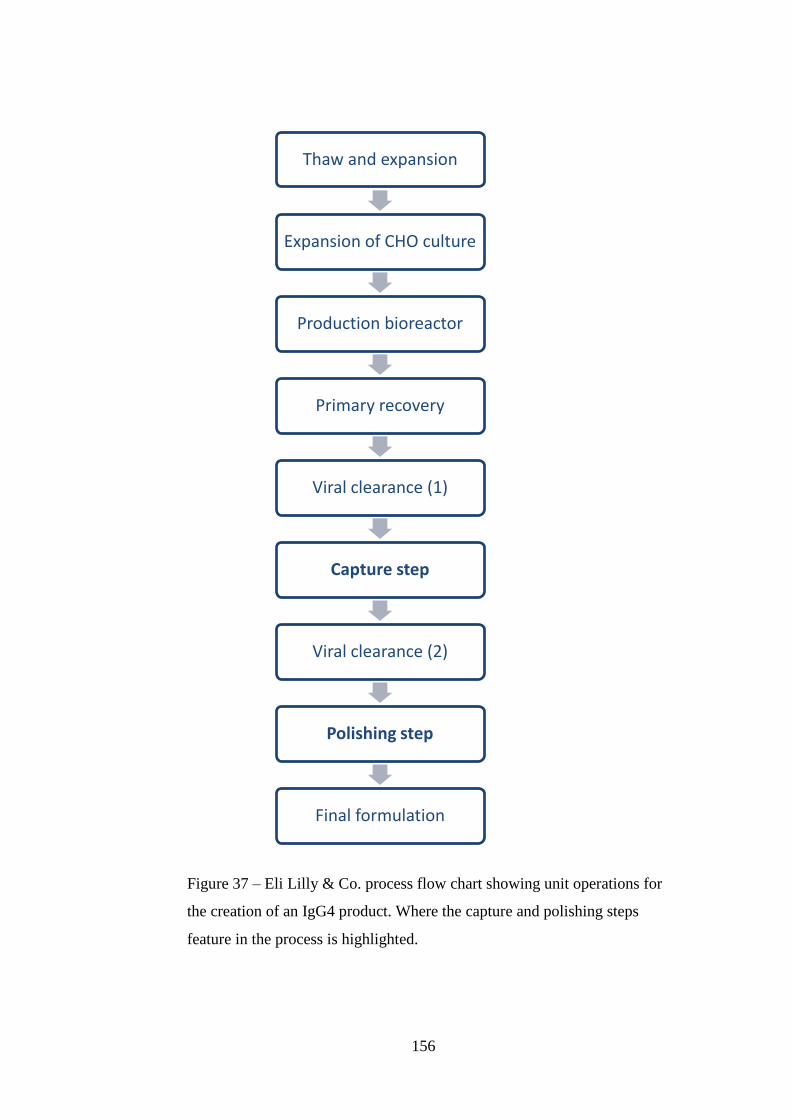
156
Thaw and expansion
Expansion of CHO culture
Production bioreactor
Primary recovery
Viral clearance (1)
Capture step
Viral clearance (2)
Polishing step
Final formulation
Figure 37 – Eli Lilly & Co. process flow chart showing unit operations for
the creation of an IgG4 product. Where the capture and polishing steps
feature in the process is highlighted.

157
Resin type Condition No. of
cycles
Column
size
Buffers Application
MabSelect Aged 17 100 cm
diameter,
17 cm bed
height
(~130L)
Wash: Tris buffers
Elution: Sodium Citrate, pH 3
CIP:
Regeneration:
1% acetic acid, 1 % phosphoric
acid.
Sanitisation:
50 mM NaOH, 1 M NaCl.
Sanitisation performed prior to
the first cycle of two, and
following the last cycle of two.
Storage: Sodium Acetate
Buffer, pH 4
IgG4, CHO
expression
Capto
Adhere
Aged 17 80 cm
diameter,
29 cm bed
height
(~145L)
Wash: Tris buffer
Elution: 20mM Acetate buffer
100 mM NaCl
CIP: Regeneration weak
acid. Sanitisation strong
base. The column pack is
regenerated and sanitised after
every run; the column is stored
after every second run.
IgG4, CHO
expression
Q-
Sepharose
HP
Aged 64 60 cm
diameter,
16 cm bed
height
(~45L)
Wash and elution: Tris buffers.
Regeneration and Sanitisation:
1 N NaOH.
Sanitisation performed prior to
the first cycle of eight, and after
every cycle.
Storage: 0.1 N NaOH
Fusion protein,
CHO
expression
MabSelect
Xtra
Aged 20 25ml
column,
bed height
20 cm
Wash: phosphate based
Elution: acetate buffer
CIP: 0.5M acetic acid, every
cycle. 0.1M NaOH, every 5
cycles
In-house
developed
IgG1
(hydrodynamic
radius 8-12
nm)
Table 17 Process conditions for aged resins – MabSelect & Capto Adhere, Q-
Sepharose High Performance and MabSelect Xtra. The table provides information on
the number of cycles, the column size used, buffer/CIP conditions, the product and
mode of expression.
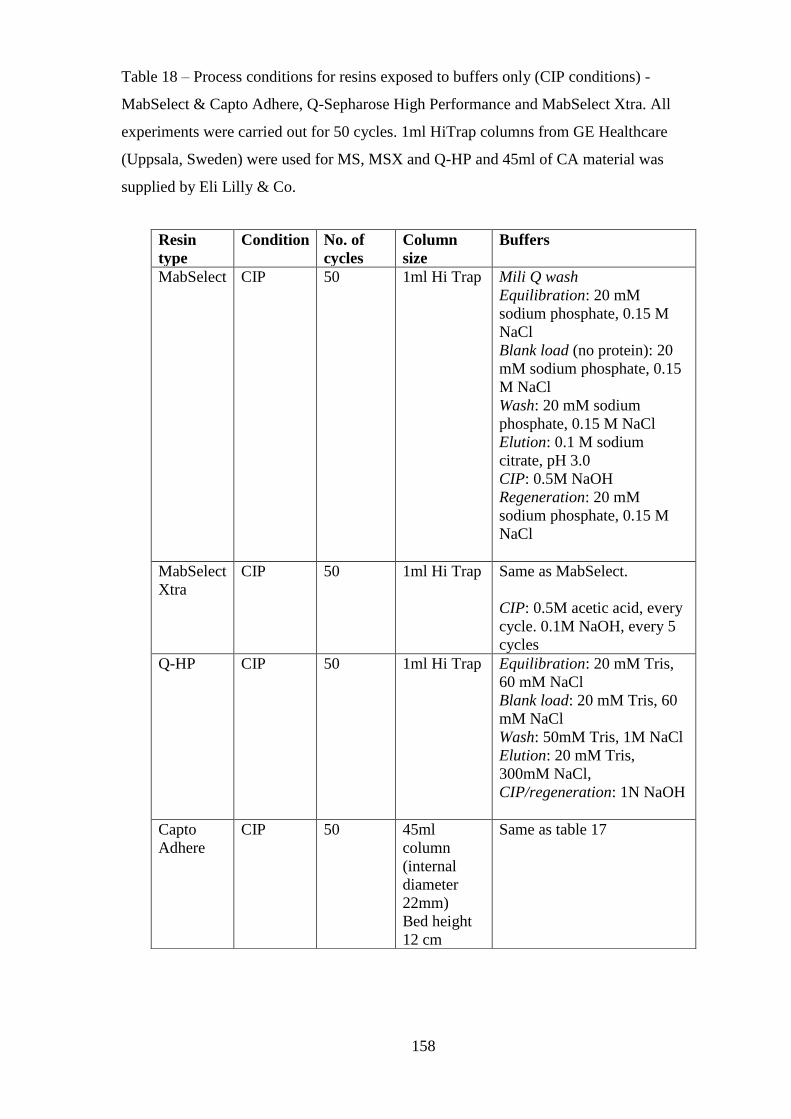
158
Resin
type
Condition No. of
cycles
Column
size
Buffers
MabSelect CIP 50 1ml Hi Trap Mili Q wash
Equilibration: 20 mM
sodium phosphate, 0.15 M
NaCl
Blank load (no protein): 20
mM sodium phosphate, 0.15
M NaCl
Wash: 20 mM sodium
phosphate, 0.15 M NaCl
Elution: 0.1 M sodium
citrate, pH 3.0
CIP: 0.5M NaOH
Regeneration: 20 mM
sodium phosphate, 0.15 M
NaCl
MabSelect
Xtra
CIP 50 1ml Hi Trap Same as MabSelect.
CIP: 0.5M acetic acid, every
cycle. 0.1M NaOH, every 5
cycles
Q-HP CIP 50 1ml Hi Trap Equilibration: 20 mM Tris,
60 mM NaCl
Blank load: 20 mM Tris, 60
mM NaCl
Wash: 50mM Tris, 1M NaCl
Elution: 20 mM Tris,
300mM NaCl,
CIP/regeneration: 1N NaOH
Capto
Adhere
CIP 50 45ml
column
(internal
diameter
22mm)
Bed height
12 cm
Same as table 17
Table 18 – Process conditions for resins exposed to buffers only (CIP conditions) -
MabSelect & Capto Adhere, Q-Sepharose High Performance and MabSelect Xtra. All
experiments were carried out for 50 cycles. 1ml HiTrap columns from GE Healthcare
(Uppsala, Sweden) were used for MS, MSX and Q-HP and 45ml of CA material was
supplied by Eli Lilly & Co.

159
5.2.SEM image analysis
The images obtained show whole bead and surface structures under CIP and aged
conditions for the four resins used in this study – MabSelect, MabSelect Xtra, Q-
Sepharose High Performance and Capto Adhere post-critical point drying.
Qualitative analysis is used to characterise morphological differences observed in
whole bead and bead surface images. Structural properties are compared and
contrasted between the resins under each condition. The images are also compared to
their fresh counterparts (chapter 3 also see figure 38 – summary image). Quantitative
analysis is carried out using ImageJ software. Pore count, average pore size, pore
size distribution and apparent porosity values are calculated and compared to
observations made qualitatively.
Figure 38 – summary of SEM surface images from chapter 3 of fresh resins for
comparative purposes. Q-HP – Q-Sepharose HP, MSX – MabSelect Xtra, CA –
Capto Adhere. 1cm = 400nm

160
Figure 39 – (A) Scanning electron micrograph showing CIP-exposed MabSelect
(0.5M NaOH). Whole bead image 2.0 kV accelerating voltage, x400 magnification, 3
cm = 50 µm. (B) Scanning electron micrograph showing CIP-exposed MabSelect.
Bead surface image 5.0 kV accelerating voltage, x40, 000 magnification, 3 cm = 500
nm.

161
Figure 40 – (A) Scanning electron micrograph showing CIP-exposed MabSelect Xtra (0.5M
acetic acid, 0.1M NaOH). Whole bead image 5.0 kV accelerating voltage, x1000
magnification, 4.5 cm = 30 µm. (B) Scanning electron micrograph showing CIP-exposed
MabSelect Xtra. Whole bead image close-up 5.0 kV accelerating voltage, x3600
magnification, 2.5 cm = 5 µm. Circled section clearly shows surface distinctions.

162
Figure 41 – (A) Scanning electron micrograph showing CIP-exposed MabSelect Xtra
(0.5M acetic acid, 0.1M NaOH). ‘Inner’ bead surface image 5.0 kV accelerating voltage,
x40,000 magnification, 3 cm = 500 nm. (B) Scanning electron micrograph showing CIP-
exposed MabSelect Xtra. ‘Outer’ bead surface image 5.0 kV accelerating voltage, x40,
000 magnification, 3 cm = 500 nm.

163
Figure 42 – (A) Scanning electron micrograph showing CIP-exposed Q-HP (1N NaOH).
Whole bead image 5.0 kV accelerating voltage, x270 magnification, 4 cm = 100 µm. (B)
Scanning electron micrograph showing CIP-exposed Q-HP. Bead surface image 5.0 kV
accelerating voltage, x40, 000 magnification, 3 cm = 500 nm.

164
Figure 43 – (A) Scanning electron micrograph showing CIP-exposed Capto Adhere (weak
acid, strong base). Whole bead image 5.0 kV accelerating voltage, x330 magnification, 2.5
cm = 50 µm. (B) Scanning electron micrograph showing CIP-exposed Capto Adhere. Bead
surface image 5.0 kV accelerating voltage, x33, 000 magnification, 2.5 cm = 500 nm.

165
Figure 44– (A) Scanning electron micrograph showing aged MabSelect (17 cycles,
IgG4, CHO expression). Whole bead image 2.0 kV accelerating voltage, x3700
magnification, 1 cm = 2 µm. (B) Scanning electron micrograph showing aged
MabSelect. Bead surface image 2.0 kV accelerating voltage, x40, 000 magnification, 1
cm = 200 nm.

166
Figure 45 – (A) Scanning electron micrograph showing aged MabSelect Xtra (20
cycles, IgG1). Whole bead image 2.0 kV accelerating voltage, x1000 magnification, 4
cm = 20 µm. (B) Scanning electron micrograph showing aged MabSelect Xtra. Bead
surface image 2.0 kV accelerating voltage, x40, 000 magnification, 3 cm = 500 nm.

167
Figure 46 – (A) Scanning electron micrograph showing aged Q-HP (64 cycles, fusion
protein, CHO expression). Whole bead image 5.0 kV accelerating voltage, x270
magnification, 4 cm = 100 µm. (B) Scanning electron micrograph showing aged Q-HP.
Bead surface image 2.0 kV accelerating voltage, x40, 000 magnification, 1 cm = 200 nm.

168
Figure 47– (A) Scanning electron micrograph showing aged Capto Adhere (17
cycles IgG4 CHO expression). Whole bead image 3.0 kV accelerating voltage,
x270 magnification, 3.5 cm = 100 µm. (B) Scanning electron micrograph
showing aged Capto Adhere. Bead surface image 2.0 kV accelerating voltage,
x40, 000 magnification, 1 cm = 200 nm.

169
5.2.1. Qualitative analysis
The aim of this section is to describe the changes to the bead ultrastructural
properties under CIP and aged conditions and compare any changes to their fresh
counterparts. From this, the significance of these structural changes is discussed.
Figures 39-43 are SEM micrographs of MabSelect, MabSelect Xtra, Q-Sepharose
HP and Capto Adhere post-exposure to CIP conditions and figures 44-47 are
micrographs of the same resins post-exposure to aged conditions. All resins
underwent the same drying process – critical point drying – as outlined in materials
& methods and chapter 3. Figures 39(A), 40(A) and 42(A)-47(A) show whole bead
images whilst figures 39(B), 41 and 42(B)-47(B) show bead surface images. 3
images of each state were taken (see appendix).
5.2.1.1.CIP-exposed resins
Figure 39(A) shows a randomly selected collection of MabSelect beads post-CIP. 3
cm of the micrograph represents 500µm of the sample. The image shows that most
of the beads are consistently spherical, with a wide particle size distribution (approx.
30-60µm) consistent with the range of sizes specified on GE Healthcare’s product
data sheet for this resin. However 2 of the beads on display appear to have flat
surfaces, something which was not observed with fresh MabSelect. The reason for
this could be as a result of beads sticking to each other in the column under flow
conditions. Figure 39(B) is a bead surface image of MabSelect after exposure to CIP
conditions. 3 cm of the micrograph represents 500nm of the sample surface. When
compared to its fresh counterpart (figure 38) the pores appear more occluded and the
fibres appear to be thicker, indicating a reduction in apparent porosity. Because of
this, the pores also appear to be smaller on average and the pore size distribution
appears to be narrower. The contrast between the fresh and CIP-exposed MabSelect
resins is apparent. The exposure to CIP conditions appears to have significantly
altered the surface ultrastructure. This could have occurred due to chemical
interactions between the matrix fibres and the sodium hydroxide and build-up and
depositing of salts and caustic reagents on the surface of the bead, causing an
apparent increase in fibrosity (see section 5.2.1.3).

170
Figure 40(A) shows a randomly selected collection of MabSelect Xtra beads post-
CIP. 4.5 cm of the micrograph represents 30µm of the sample. The figure shows the
average particle size to be much smaller than MabSelect (figure 39(A)), as specified
by the manufacturer GE Healthcare. This was observed in all images obtained for the
2 resins. Figure 40(A) also shows the beads to be uniformly spherical. However, the
image reveals distinct differences between what appears to be an ‘outer’ surface
structure and an ‘inner’ surface structure. The reason for this could be that prolonged
exposure to CIP conditions may have caused erosion of the outer layer, exposing the
inner layer and creating resin fines, which can also be observed in figure 40(A) (see
section 5.2.1.3). Figure 40(B) shows a close up of this phenomenon, circling the
abrupt change in surface characteristics shown in figure 40. Figures 41(A) and 41(B)
show the ‘inner’ and ‘outer’ surface of the bead respectively. The vast majority of
the pores shown on the ‘inner’ surface appear to be more occluded than that of the
outer surface and the structure appears more fibrous, however, there are also large
pores located randomly in the surface structure. The pores and distribution of pores
shown on the ‘outer’ surface appear to be more homogeneous. Both the ‘outer’ and
‘inner’ surface structures differ greatly compared to their fresh counterpart, which
indicates that exposure to CIP conditions (0.5M acetic acid, 0.1M NaOH) creates
significant changes in the ultrastructural properties of MabSelect Xtra resins.
Figure 42(A) shows a randomly selected collection of Q-HP beads post-CIP. 4 cm of
the micrograph represents 100µm of the sample. The figure shows the beads to be
mostly spherical in shape however, as was seen in figure 39(A), there are a number
of beads with flat surfaces. Again, this could be associated with beads adhering to
each other. Figure 42(B) shows the bead surface. 3 cm of the micrograph represents
500nm of the sample surface. Compared to its fresh counterpart (figure 38) the pores
appear more homogeneous in size and distribution, however the fibrosity appears
reduced. This could be because exposure to CIP conditions (1N NaOH) may have
caused a thinning of the fibres. Surprisingly however, the effects of CIP exposure on
Q-HP do not appear to be as significant as what has been observed in MabSelect
(0.5M NaOH) and MabSelect Xtra (0.1M NaOH), despite that it had been exposed to
much higher concentrations of sodium hydroxide (see section 5.3.1).

171
Figure 43(A) shows a randomly selected collection of Capto Adhere beads post-CIP.
2.5 cm of the micrograph represent 50µm of the sample. The beads appear to be
homogeneously spherical, with a similar particle size and distribution as their fresh
counterpart (chapter 3). Figure 43(B) shows the bead surface (2.5 cm = 500nm). The
surface shows more occlusion of the pores compared to its fresh counterpart (figure
38). Many pores appear smaller and the matrix appears to be thicker. Similar to
observations in figure 39(B), this could be due to chemical interactions of CIP
reagents with the bead surface and chemical or biological depositions on the matrix,
causing the fibres to appear to be thicker; indicating that exposure to CIP conditions
creates significant changes in the surface properties of Capto Adhere resins.

172
5.2.1.2.Aged resins
Figure 44(A) shows a whole bead image of aged MabSelect after 17 cycles of
exposure to the conditions highlighted in table 17. In this image, uniform sphericity
is observed. A further observation is that, despite the relatively low magnification
(x3700), the ultrastructure of the bead surface is still apparent, allowing for early
stage topological characterisation of the sample surface. From this magnification, the
bead surface structure appears to be more porous compared to its CIP-exposed and
fresh counterparts. This can be seen in more detail in figure 44(B). The image shows
gaping holes in the ultrastructure and a greater discontinuity of fibres, indicating
damage to the matrix. This could have resulted due to the combined interaction of
process feed material and CIP reagents with the matrix. Repeated exposure may have
caused degradation of the fibres over time, resulting in large disparities in pore size
and an increase in apparent porosity. The results show that the ultrastructure of
MabSelect exposed to CIP conditions differ from the effects seen after the aging
process.
Figure 45(A) shows a whole bead image of aged MabSelect Xtra after 20 cycles of
exposure to the conditions in table 17. The image shows a uniformly spherical bead,
which was observed for all images obtained for this sample. There also appears to be
deposits on the surface of the bead, occluding the ultrastructure. These deposits may
contribute to the increase in back pressure observed by the second company, as they
inhibit the flow of process media through the column, causing blockages resulting in
build-up of back pressure, however mechanical testing may further corroborate this
(section 5.3.). Figure 45(B) shows the bead surface image of aged MabSelect Xtra
(3 cm = 500nm). This image displays distinct surface characteristics compared to
figure 41 (CIP counterpart). However, there are ultrastructural similarities between
this figure and its fresh counterpart figure 38. The matrix structure in both images
are similar, however the more pores appear to be occluded in figure 45(B) compared
to fresh resin, which may be as a result of matrix interaction with process feed
material and chemical reagents in CIP buffers.
Figure 46(A) shows a whole bead image of aged Q-HP after 64 cycles of exposure to
the conditions in table 17. The vast majority of the beads are uniformly spherical,

173
with a relatively wide particle size distribution. Figure 46(B) shows a bead surface
image of aged Q-HP (1 cm = 200nm). Similar to aged MabSelect, the mechanism of
aging appears to be associated with the breakdown of the matrix structure. More
discontinuous fibres can be observed and as a result, large pores and reduced
fibrosity compared to its fresh and CIP-exposed counterparts. As with MabSelect,
this could be due to repeated exposure causing degradation of the fibres over time.
Overall, results do indicate surface structure differences between fresh, CIP-exposed
and aged Q-HP resins.
Figure 47(A) shows a whole bead image of aged Capto Adhere after 17 cycles of
exposure to the conditions in table 17. There is a difference in bead morphology
compared to its fresh and CIP-exposed counterparts, appearing more oval in shape.
This could be due to a number of possible reasons associated with in-process
conditions such as high flow rates, packing procedures and column properties.
Another possible reason for the change in morphology could be unforeseen effects of
the critical point drying process on aged Capto Adhere resin. The critical point
drying procedure used in this study has not previously contributed to any observed
morphological changes to the beads, however, investigations to further optimise the
CPD process could be carried out to definitively determine its impact on bead
morphology. Figure 47(B) shows the bead surface of aged Capto Adhere (1 cm =
200 nm). The bead surface shows similar characteristics to what was observed in the
CIP-exposed image for this resin (figure 43(B)). However, the pores appear to be
even more occluded and there are more occurrences of gel-like depositions on the
matrix structure, resulting in a reduction in apparent porosity. The mechanism of
aging appears to be associated with the adherence of process feed material to the
fibres and the chemical interaction of CIP reagents with the matrix, all contributing
to a build-up of depositions on the bead surface. The results have shown surface
structure differences between fresh, CIP-exposed and aged Capto Adhere resins.
5.2.1.3.Qualitative analysis – discussion
The four resins used in this study have all shown vast ultrastructural differences
under fresh, CIP-exposed and aged conditions. The greatest structural differences
were observed for 2 resins, MabSelect Xtra under CIP conditions and Capto Adhere

174
under aged conditions. Micrographs for MSX showed that exposure to the CIP
conditions in table 17, resulted in the formation of two surface layers with distinct
properties and the creation of resin fines. Aged MSX, however, appeared to age via
pore occlusion (fouling), suggesting that the interaction of CIP reagents, protein and
feed material can change the mechanism of aging. Similar studies corroborate this
and also report that the mechanism of aging of protein A resin is associated with
fouling and the adhesion of product/feed material to bead fibres (Jiang et al., 2009;
Zhang, Daniels, et al., 2015; Zhang, Xu, et al., 2015; Lintern et al., 2016; Pathak and
Rathore, 2016). Resins used post-capture, such as ion exchange resins and
multimodal resins have also been reported to age similarly to protein A resins, which
was observed in micrographs for Capto Adhere (figure 47 (A)) (Siu and Boushaba,
2006; Siu et al., 2006, 2007; Jin et al., 2009). However, CIP results for Capto
Adhere (figure 43(A)) indicate that chemical deposits from CIP conditions contribute
more greatly to the fouling mechanism by which Capto Adhere appears to age, as
opposed to biological deposits, as has been reported with protein A resins. In this
case, this could be because CA is a latter-stage purification step and is therefore
exposed to smaller quantities of biological material but stronger CIP conditions than
the preceding protein A step.
Contrastingly, MabSelect and Q-HP displayed similar mechanisms of aging, not
widely reported in literature for both media types. Both resins showed a breakdown
of matrix fibres and consequently larger pores. There have been a number of studies
on the stability of matrices under strong CIP conditions (Tengliden, 2008; Grönberg
et al., 2011). Whilst many studies indicate high levels of matrix stability under
varying CIP and sanitization conditions, a number of studies indicate structural
changes to resins as a result of repeated exposure to high concentrations of NaOH
combined with process feed material, such as the conditions reported in this study for
Q-Sepharose High Performance (1N NaOH) (Carter-Franklin et al., 2007;
Thillaivinayagalingam et al., 2007; Zhang, Xu, et al., 2015). As MabSelect was
exposed to relatively mild CIP conditions, its mechanism of aging was unexpected.
However, it is important to note that other factors, such as physical stresses of
process conditions e.g. flow rate or mobile phase viscosity can contribute towards a
decline in aging Further consideration include the fact that different expression
systems (e.g. mammalian vs microbial) will result in the expression of different

175
foulants and may therefore impact the aging process. However mechanical/structural
characterization studies will need to be carried out to determine any differences.

176
5.2.2. Quantitative analysis - results
Fresh CIP Aged0
200
400
600
800
1000A
ve
rag
e p
ore
co
un
t
MabSelect
Fresh CIP Aged0
1000
2000
3000
4000
5000
Avera
ge p
ore
siz
e (
nm
2)
MabSelect
Fresh CIP Aged0
10
20
30
40
Ap
pa
ren
t p
oro
sity %
MabSelect
Figure 48 – Column graphs showing surface properties of MabSelect under fresh, CIP-
exposed and aged conditions. The averages for 3 images were plotted with their standard
deviations. (a) Column graph showing average pore count. (b) Column graph showing
average pore size in nm2. (c) Column graph showing average apparent porosity in %.

177
Fresh CIP inner CIP outer Aged0
200
400
600
800
Ave
rag
e p
ore
co
un
t
MSX
Fresh CIP inner CIP outer Aged0
2000
4000
6000
8000
10000
Ave
rag
e p
ore
siz
e (
nm
2)
MSX
Fresh CIP inner CIP outer Aged0
10
20
30
40
App
are
nt po
rosity %
MSX
Figure 49 – Column graphs showing surface properties of MabSelect Xtra under fresh, CIP-
exposed and aged conditions. The averages for 3 images were plotted with their standard
deviations. (a) Column graph showing average pore count. (b) Column graph showing average
pore size in nm2. (c) Column graph showing average apparent porosity in %.

178
Fresh CIP Aged0
300
600
900
1200
Ave
rag
e p
ore
co
un
t
QHP
Fresh CIP Aged0
1000
2000
3000
4000
5000
Avera
ge p
ore
siz
e (
nm
2)
QHP
Fresh CIP Aged0
10
20
30
40
50
App
are
nt po
rosity %
QHP
Figure 50 – Column graphs showing surface properties of Q-HP under fresh, CIP-exposed and aged
conditions. The averages for 3 images were plotted with their standard deviations. (a) Column graph
showing average pore count. (b) Column graph showing average pore size in nm2. (c) Column graph
showing average apparent porosity in %.

179
Fresh CIP Aged0
300
600
900
1200
1500
Ave
rag
e p
ore
co
un
t
Capto Adhere
Fresh CIP Aged0
10
20
30
40
Ap
pa
ren
t p
oro
sity %
Capto Adhere
Fresh CIP Aged0
1000
2000
3000
Avera
ge p
ore
siz
e (
nm
2)
Capto Adhere
Figure 51– Column graphs showing surface properties of Capto Adhere under fresh, CIP-
exposed and aged conditions. The averages for 3 images were plotted with their standard
deviations. (a) Column graph showing average pore count. (b) Column graph showing average
pore size in nm2. (c) Column graph showing average apparent porosity in %.

180
Resin
Frequency
Pore size range
(nm2) CA MS MSXinner MSXouter QHP
≤10000 857.3 830 655.6 419.3 634.3
10001-20000 10.3 8 2 5.3 3.6
20001-30000 0.6 1.6 0.3 2 0.6
30001-40000 0 0.6 0.3 0 0.3
40001- 100000 0 0 0 0 0
Total 868.3 840.3 658.3 426.6 639
%≤10000 99% 99% 99% 98% 99%
Resin
Frequency
Pore size
range
(nm2)
CA MS MSXinner MSXouter QHP
≤1000 574 593.6 468 358 462.3
1001-2000 142 122.6 112.6 35 77.3
2001-3000 68 48.3 31 5.6 39.6
3001-4000 28.3 24.6 19.6 8 18.6
4001-5000 20.6 14.3 9 4.3 11.3
5001-6000 4 6 7.6 2.6 9.3
6001-7000 2.6 7.3 3.6 1.6 4.3
7001-8000 5.6 6.3 2 0.6 6.6
8001-9000 5.3 4.3 1.3 3 2.6
9001-
10000
2.6 2.6 0.6 0.3 2
Total 853.3̇̇ 830 655.6̇̇ 419.3̇̇ 634.3̇̇
%≤1000 67% 72% 71% 85% 73%
Table 19 Pore size distributions of CIP –exposed resins up to 100000nm2
(≈d360nm based on area of a circle πr2.) On average, 99% of all pores within
100000nm2 are ≤10000nm2 (≈d100nm).
Table 20 Pore size distributions of CIP-exposed resins up to 10000nm2 (≈d100nm
based on area of a circle πr2.) On average, over 70 % of all pores within
10000nm2 are ≤1000nm2 (≈d36nm).

181
Resin
Frequency
Pore size
range
(nm2)
CA MS MSXinner MSXouter QHP
≤100 421.3 459 337 331 366
101-500 0 0 0 0 0
501-600 86 72 0 0 0
601-700 0 0 131 0 0
701-800 0 0 0 0 0
801-900 66.6 0 0 0 96
901-1000 0 62 0 72 0
%≤100 73% 77% 72% 92% 79%
Table 21 Pore size distributions of CIP-exposed resins up to 1000nm2 (≈d36nm
based on area of a circle πr2.) On average, about 80% of all pores within 1000nm2
are ≤100nm2 (≈d10nm). Note: pores smaller than approx. 7nm were not detected
by the ImageJ software.
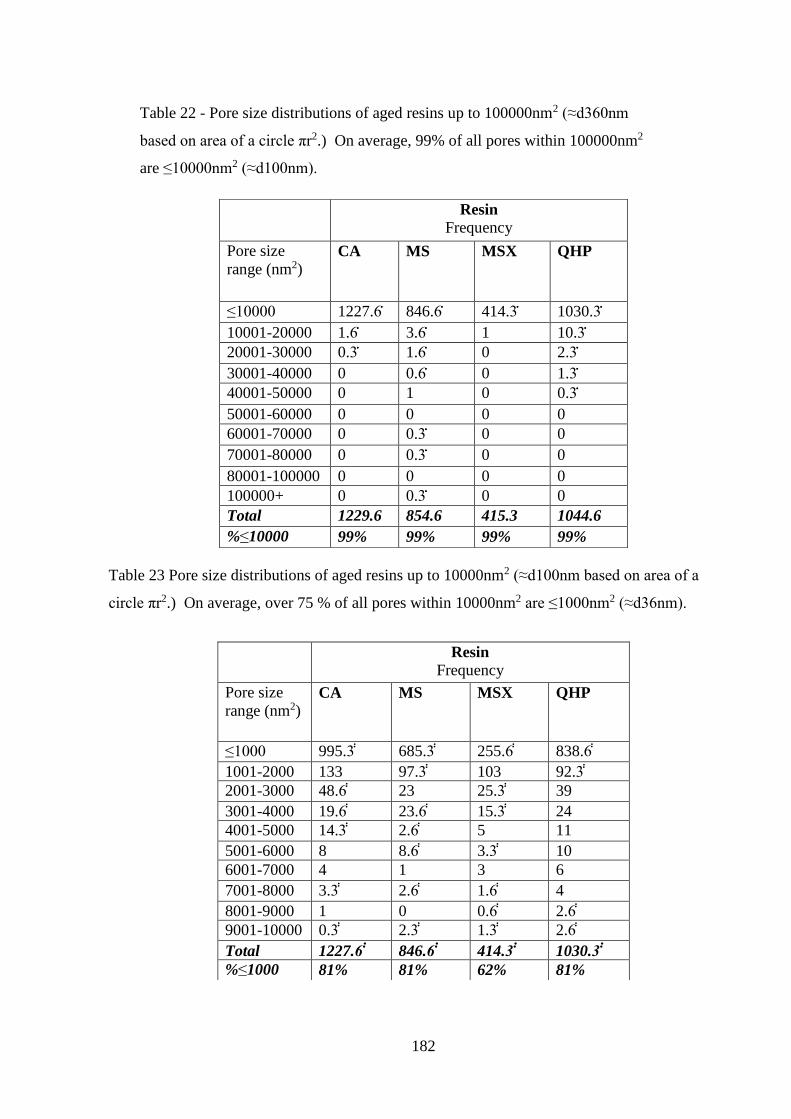
182
Resin
Frequency
Pore size
range (nm2) CA MS MSX QHP
≤10000 1227.6 846.6 414.3 1030.3
10001-20000 1.6 3.6 1 10.3
20001-30000 0.3 1.6 0 2.3
30001-40000 0 0.6 0 1.3
40001-50000 0 1 0 0.3
50001-60000 0 0 0 0
60001-70000 0 0.3 0 0
70001-80000 0 0.3 0 0
80001-100000 0 0 0 0
100000+ 0 0.3 0 0
Total 1229.6 854.6 415.3 1044.6
%≤10000 99% 99% 99% 99%
Resin
Frequency
Pore size
range (nm2) CA MS MSX QHP
≤1000 995.3 685.3 255.6 838.6
1001-2000 133 97.3 103 92.3
2001-3000 48.6 23 25.3 39
3001-4000 19.6 23.6 15.3 24
4001-5000 14.3 2.6 5 11
5001-6000 8 8.6 3.3 10
6001-7000 4 1 3 6
7001-8000 3.3 2.6 1.6 4
8001-9000 1 0 0.6 2.6
9001-10000 0.3 2.3 1.3 2.6
Total 1227.6̇̇ 846.6̇̇ 414.3̇̇ 1030.3̇̇
%≤1000 81% 81% 62% 81%
Table 22 - Pore size distributions of aged resins up to 100000nm2 (≈d360nm
based on area of a circle πr2.) On average, 99% of all pores within 100000nm2
are ≤10000nm2 (≈d100nm).
Table 23 Pore size distributions of aged resins up to 10000nm2 (≈d100nm based on area of a
circle πr2.) On average, over 75 % of all pores within 10000nm2 are ≤1000nm2 (≈d36nm).

183
Resin
Frequency
Pore size
range (nm2) CA MS MSX QHP
≤100 473 685.3 175 721
101-300 0 0 0 0
301-400 113 0 0 0
401-500 278 0 0 0
501-600 0 0 41 0
601-700 0 0 40 0
701-800 47 0 0 0
801-900 44 0 0 61
901-1000 41 0 0 57
%≤100 48% 100% 68% 86%
Table 24 Pore size distributions of CIP-exposed resins up to 1000nm2 (≈d36nm based
on area of a circle πr2.) On average, over 75% of all pores within 1000nm2 are
≤100nm2 (≈d10nm). Note: pores smaller than approx. 7nm were not detected by the
ImageJ software.

184
5.2.3. Quantitative analysis - discussion
The purpose of this section is to determine whether the quantitative results obtained
corroborate qualitative analysis findings in section 5.2.1. If this is the case, the
obtained values can be used to characterise the ultrastructure of the studied resins.
However, inconsistencies in quantitative results would suggest the values may not be
true indicators of the structural properties. Figures 48-51 and tables 19-24 show pore
count, average pore size, apparent porosity and pore size distributions for MabSelect,
MabSelect Xtra, Q-Sepharose High Performance and Capto Adhere under CIP-
exposed and aged conditions. 3 images of each resin under each condition were
quantitatively analysed using ImageJ software and average values are plotted with
their standard deviations.
5.2.3.1.MabSelect
Figure 48 (a-c) shows average pore count, average pore size (nm2) and apparent
porosity (%) information respectively for fresh, CIP-exposed and aged MabSelect
resin. All 3 graphs show that the values obtained for CIP-exposed and aged
conditions are quasi-identical. Figure 48(a) shows that the average pore count of
CIP-exposed is higher (840) than its fresh counterpart (626). Figure 39(b)
corroborates this, as there appears to be more pores on the surface of CIP-exposed
MabSelect resin compared to its fresh counterpart. The same trends are observed in
figures 48(b) and 48(c). Average pore size and apparent porosity is lower in CIP-
exposed MabSelect compared to fresh resin. Qualitative analysis showed that aged
MabSelect (figure 44(b)) had a higher number of discontinuous fibres, creating
larger pores and as a result, what would likely be a fewer number of surface pores, a
larger average pore size and higher apparent porosity compared to its fresh and CIP-
exposed counterparts. However, the opposite is observed in figures 48 a, b and c.
This could be as a result of manual thresholding during ImageJ software analysis.
SEM images showed that aged MabSelect images had the least surface homogeneity,
i.e. a higher amount of surface protrusions compared to fresh and aged images,
which meant that differentiating between the top surface and subsurface pores during
thresholding was more challenging. As a result, the values calculated by the software
for each property were not in agreement with what could be observed qualitatively.

185
Tables 19-21 and 22-24 show pore size distributions for CIP-exposed and aged
MabSelect resin respectively. Under both conditions, at least 99% of the pores are
less than 10000nm2 (which is ~100nm in diameter, based on the area of a circle.)
Both CIP-exposed and aged MabSelect data show similar distributions, however,
there are fewer pores between 5000-10000nm2 under aged conditions. This
corroborates figure 48(b) which shows aged MabSelect to have the lowest average
pore size. However this is contradictory to what can be observed in the SEM
micrograph - figure 44(b). As previously mentioned, this could be as a result of
thresholding due to high surface heterogeneity.
5.2.3.2.MabSelect Xtra
Figure 49 shows average pore count, average pore size (nm2) and apparent porosity
(%) information respectively for fresh, CIP-exposed and aged MabSelect Xtra resin.
The figures also compare the properties of the ‘inner’ and ‘outer’ surfaces of
MabSelect Xtra post-CIP-exposed conditions and show distinct characteristics
between fresh resin and processed resin. Figure 49(a) provides average pore count
information. It shows that fresh resin has far fewer pores (310) compared to its
processed counterparts. The ‘inner’ surface (CIP-exposed) has the highest pore count
(658) whilst the ‘outer’ CIP-exposed surface and aged resin surface have a similar
number of pores (427 and 415 respectively). This is not necessarily apparent at first
glance of the SEM images (figures 41 and 45(b)) however, upon close observation,
figure 41(a) (CIP-exposed, ‘inner’ surface) is made up of a large number of very
small pores and randomly dispersed bigger ones, whilst CIP-exposed ‘outer’ surface
image (figure 41(b)) and aged MabSelect Xtra (figure 45(b)) have more occluded
pores. Figures 49(b) and (c) compare the average pore size and apparent porosity of
fresh MabSelect Xtra to its processed counterparts. The figures show that both the
average pore size and apparent porosity of CIP-exposed and aged MabSelect Xtra is
less than half that of fresh resin. This can also be seen in the electron micrographs
gathered for each condition.
Tables 19-21 and 22-24 shows pore size distributions for CIP-exposed and aged
MabSelect Xtra resin.Under both conditions, at least 98% of the pores are less than
10000nm2 (which is ~100nm in diameter, based on the area of a circle.) Both CIP-

186
exposed and aged MabSelect Xtra data show similar distributions percentage-wise,
with pores in every bandwidth. This is corroborated by figure 49(b) that shows
MabSelect Xtra resin under CIP-exposed and aged conditions with similar average
pore sizes.
5.2.3.3.Q-Sepharose High Performance
Figure 50 shows average pore count, average pore size (nm2) and apparent porosity
(%) information respectively for fresh, CIP-exposed and aged Q-Sepharose High
Performance resin. Qualitative analysis showed that aged Q-HP (figure 46(b)) had a
higher number of discontinuous fibres, creating larger pores and as a result, what
would likely be a fewer number of surface pores, a larger average pore size and
higher apparent porosity compared to its fresh and CIP-exposed counterparts.
However, the opposite is observed in figures 50 a, b and c. Similar to the case of
MabSelect, this could be associated with difficulties in manual thresholding in
ImageJ due to a highly heterogeneous bead surface. Large differences in average
pore size and apparent porosity between fresh and CIP-exposed Q-HP were not
apparent when analysed quantitatively. However, figures 50(b) and (c) show CIP-
exposed Q-HP resin to have a significantly lower average pore size and apparent
porosity compared to fresh Q-HP. Similarly, the pore size distribution information
(tables 19-24) show that the pore size distributions of CIP-exposed and aged Q-HP
are very similar, although the opposite is observed in their electron micrographs
(figures 42(b) and 46(b)).
5.2.3.4.Capto Adhere
Figure 51 shows average pore count, average pore size (nm2) and apparent porosity
(%) information respectively for fresh, CIP-exposed and aged Capto Adhere resin.
The average pore count (figure 51(a)) shows aged Capto Adhere to have the highest
pore count (1230), whilst fresh and CIP-exposed CA have a similar number of pores
(839 and 868 respectively). It should be noted however, that there is large pore count
variability, as represented by the standard deviations, indicating that the pore count
may not vary greatly under any given condition. However, more images would need
to be quantitatively analysed to ascertain this. Figure 51(b) shows that the average

187
pore size is highest under fresh conditions (2464 nm2) followed by CIP-exposed
conditions (1567 nm2), whilst aged CA had the lowest average pore size (886 nm2).
Figure 51(c) shows that fresh CA is more than two times more porous than CIP-
exposed and aged CA, which show similar apparent porosity levels. These properties
can also be observed in the electron micrographs obtained for each condition (figure
43(b) and 47(b)). Under CIP-exposed and aged conditions, the pores appear
occluded and as a result, vastly smaller compared to their fresh counterpart.
Similarly, the pore size distribution information corroborates average pore size
results and qualitative results. Table 19 shows that ~99% of pores are less than
10000nm2 in size (which is ~100nm in diameter, based on the area of a circle.) Table
23 shows a higher frequency of smaller pores (<1000nm2) compared to table 20,
which supports a smaller average pore size.
The use of the term apparent porosity accounts for the fact that the porosity
measurements in this study are based on 2-D images that do not account for the
angle at which the micrographs were attained. For this reason, the values obtained in
this study for average pore size, apparent porosity and pore size distribution differ
from studies that account for the 3-D nature of the pores (Yao and Lenhoff, 2004;
Bacskay, Sepsey and Felinger, 2014; Sepsey, Bacskay and Felinger, 2014).
However, some studies have made use of 2-D pore information as a general guide
(Ioannidis, 2009). The results of this study have shown that while some of the values
obtained using quantitative analysis corroborate some of the observed properties in
section 5.2.1, overall, the results vary substantially with each resin. However, a trend
can be observed based on the values obtained. Table 25 shows a summary table
characterising the resins under each condition relative to their fresh counterparts. As
the values cannot be directly used, the resins are characterised on the basis of high-
mid-low ranging.

188
Resin Condition Pore
count
Pore size Apparent
porosity
Pore size
distribution
MabSelect Fresh Mid High High High
CIP-
exposed
High Low Mid Mid
Aged High Low Low Low*
MabSelect
Xtra
Fresh Low* High* High High*
CIP-
exposed
(inner)
Mid Low Low Mid
CIP-
exposed
(outer)
Low Low Low* Mid
Aged Low Low Low Mid
Q-
Sepharose
HP
Fresh High High High* High
CIP-
exposed
Mid Low Mid Mid
Aged High Low Mid Mid
Capto
Adhere
Fresh High Mid High Mid
CIP-
exposed
High Low Mid Mid
Aged High* Low* Low Mid
Table 25 Summary table characterising the bead surface structure of the 4 resins
used in this study – MabSelect, MabSelect Xtra, Q-Sepharose HP and Capto Adhere
under 3 conditions – fresh, CIP-exposed and aged. The surfaces are characterised
based on 4 properties – pore count, pore size, apparent porosity, pore size
distribution. A green box represents relatively high values for the assigned category,
yellow represents mid-range values and blue represents low values. The asterisk
shows the resin that reported the highest/lowest value for the given property.

189
5.3.Pressure-flow and DMA characterisation – results
There were a number of structural differences observed between the four resins
under fresh, CIP-exposed and aged conditions. Pressure-flow and dynamic
mechanical analysis are used to determine whether there are differences in
mechanical behaviour of the same studied resins exposed to the aforementioned
conditions and to compare the two techniques. The same pressure-flow and DMA
techniques as described in chapter 4 are used in this study. The results are presented
below.

190
423398
Fresh MabSelect Aged MabSelect0
100
200
300
400
500
Critical ve
locity (
cm
/hr)
0.55
0.72
0.78
Fresh CIP Aged 0.0
0.2
0.4
0.6
0.8
1.0
Slu
rry D
efo
rmation R
ate
(%
/min
)
MabSelect
Figure 52– (a) column graph showing critical velocity values of fresh and aged
MabSelect resin (423 and 398 cm/hr respectively). Error bars based on 3 runs. (b)
column graph showing Slurry deformation rate values (SDR) for MabSelect resin
under fresh, CIP-exposed and aged conditions (0.55, 0.72 and 0.78 %min-1.) Error
bars based on 3 runs.
a
b

191
403
372
Fresh MabSelect Xtra Aged MabSelect Xtra0
100
200
300
400
Critical velo
city (
cm
/hr)
0.610.67
0.86
Fresh CIP Aged0.0
0.2
0.4
0.6
0.8
1.0
SD
R (
%)
MabSelect Xtra
Figure 53- (a) column graph showing critical velocity values of fresh and
aged MabSelect Xtra resin (403 and 372 cm/hr respectively). Error bars
based on 3 runs. (b) column graph showing Slurry deformation rate values
(SDR) for MabSelect Xtra resin under fresh, CIP-exposed and aged
conditions (0.61, 0.67 and 0.86 %min-1.) Error bars based on 3 runs.
a
b

192
a
b
353
323
Fresh QHP Aged QHP0
100
200
300
400
Critical ve
locity (
cm
/hr)
1.1
1.25 1.26
Fresh CIP Aged0.0
0.2
0.4
0.6
0.8
1.0
1.2
1.4
SD
R (
%/m
in)
QHP resin conditions
Figure 54 - (a) column graph showing critical velocity values of fresh and aged Q-
Sepharose HP resin (353 and 323 cm/hr respectively). Error bars based on 3 runs.
(b) column graph showing Slurry deformation rate values (SDR) for MabSelect
resin under fresh, CIP-exposed and aged conditions (1.1, 1.25 and 1.26 %min-1.)
Error bars based on 3 runs.
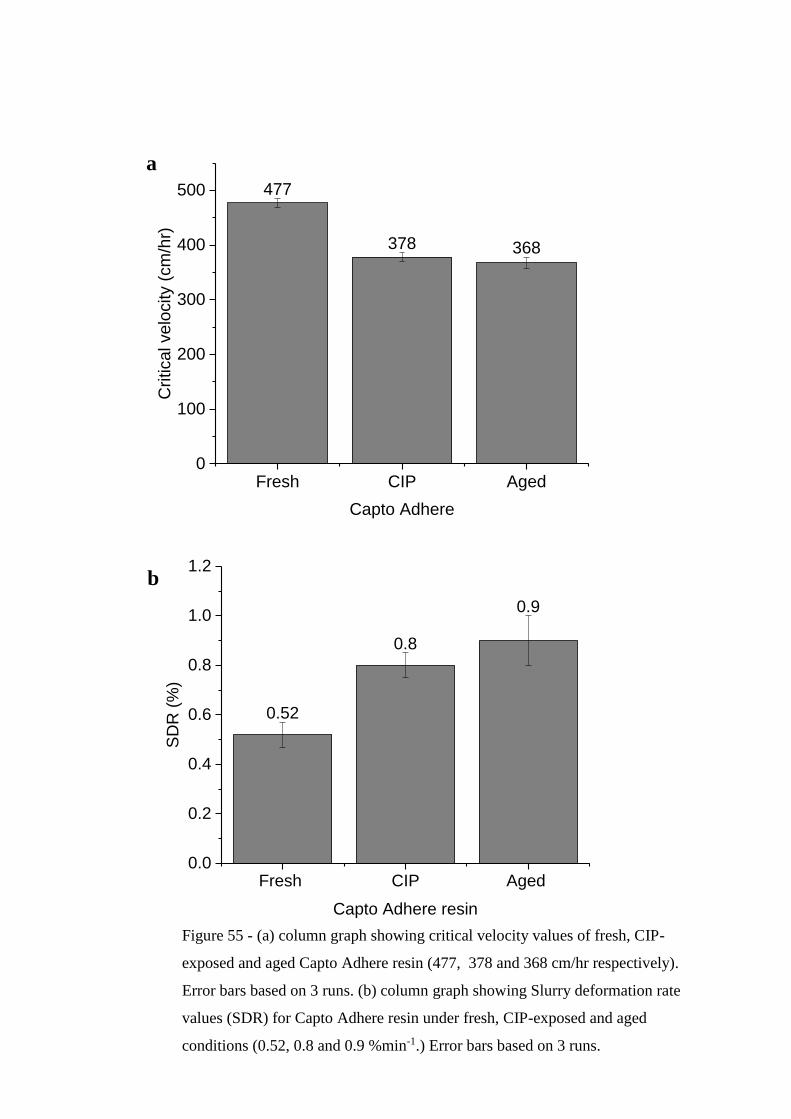
193
a
b
477
378 368
Fresh CIP Aged0
100
200
300
400
500
Critical ve
locity (
cm
/hr)
Capto Adhere
0.52
0.8
0.9
Fresh CIP Aged 0.0
0.2
0.4
0.6
0.8
1.0
1.2
SD
R (
%)
Capto Adhere resin
Figure 55 - (a) column graph showing critical velocity values of fresh, CIP-
exposed and aged Capto Adhere resin (477, 378 and 368 cm/hr respectively).
Error bars based on 3 runs. (b) column graph showing Slurry deformation rate
values (SDR) for Capto Adhere resin under fresh, CIP-exposed and aged
conditions (0.52, 0.8 and 0.9 %min-1.) Error bars based on 3 runs.

194
Resin MabSelect MabSelect Xtra Q-Sepharose HP Capto Adhere
Condition Fresh CIP Aged Fresh CIP Aged Fresh CIP Aged Fresh CIP Aged
Slurry
resistance (1/SDR) (+/- 0.05
STD)*
1.8 1 1.38 1.23 (+/-
0.1)
1.64 1.49 1.16 0.9 0 0.8 0.79 1.92 1.25 1.1 (+/-
0.1)
Table 26 – Slurry resistance values for MabSelect, MabSelect Xtra, Q-Sepharose
HP and Capto Adhere under fresh, CIP-exposed and aged conditions. The slurry
resistance value is the inverse of the SDR value, 1/SDR. *The standard deviation
is 0.05 for all apart from aged MabSelect and aged Capto Adhere (+/- 0.1).
Figure 56 – Parity plot - Slurry resistance vs critical velocity for Capto
Adhere. The square represents fresh resin, the diamond represents CIP-
exposed resin and the circle represents aged resin.
Fresh CA
CIP-exposed CA
Aged CA

195
5.3.1. Comparison of results from pressure-flow characterisation and
DMA
Figures 52(a)-55(a) show pressure-flow characterisation results for 4 resins -
MabSelect, MabSelect Xtra, Q-Sepharose High Performance and Capto Adhere -
under fresh and aged conditions, while figures 52(b) - 55(b) show DMA results for
the 4 resins under fresh, CIP-exposed and aged conditions. Figure 55(a) also
includes pressure-flow characterisation data for CIP-exposed Capto Adhere resin.
Table 26 shows slurry resistance data for all resins under all conditions, which is
calculated by inversing the slurry deformation values provided in figures 52(b)-
55(b). These sets of data can be compared to analyse mechanical differences
between resins under different bioprocessing conditions.
The results for each resin using both techniques all show that fresh resin is more
mechanically robust than its bioprocessed counterparts and that CIP-exposed resin is
mechanically more robust than aged resin. However, what does differ between each
technique is the extent to which the means vary. For example, Figure 52 shows
pressure-flow characterisation of MabSelect (a) and dynamic mechanical analysis
(b). In figure 52(b) there is approximately a 40% increase between the mean values
for fresh and aged MabSelect, whereas in figure 52(a) the percentage change is far
less significant (~6%). This is also the case for MabSelect Xtra. Figure 53(b) shows
a difference of approximately 40% between fresh and aged resin, whereas in figure
53(a), the difference is far less significant (~8%). Furthermore, Capto Adhere also
shows similar differences. The percentage reduction in mechanical strength shown in
figure 55(b) between fresh and aged CA is over 70%, which is almost 2.5 times
higher than the percentage reduction in mechanical strength shown in figure 55(a)
(<30%). These results could indicate that due to the reduced volumes used for DMA,
the sensitivity is increased, allowing for differences in mechanical behaviour to be
more readily detected.
Contrastingly figure 54 (Q-HP) shows that the percentage difference of the mean
values for fresh and aged resins using both techniques is much closer, meaning
mechanical differences between fresh and aged Q-HP resin were less apparent using
both techniques. This could indicate that Q-HP is the more robust resin as it is most

196
resistant to mechanical changes regardless of process conditions, which would
corroborate findings observed in section 5.2.1.1. It is important to note however, that
each resin used for this study has been exposed to different process conditions and/or
lies in different stages of 3 individual separation processes. MabSelect and
MabSelect Xtra are traditionally used in the same stages of mAb separation
processes (capture). The similarities in their mechanical behaviour could be
explained by that they were both exposed to a similar number of cycles.
However their observed differences (section 5.2) could be explained by the fact that
they were both exposed to varying process conditions and the separation of different
products. Another important thing to note is the vast difference in column sizes used
in both cases (130L MabSelect vs 25ml MabSelect Xtra). Capto Adhere and Q-
Sepharose HP are both used in latter stages of 2 separate purification process
however, both display different mechanical behaviours. Whilst Capto Adhere has
shown to be the more mechanically robust pre-bioprocessing, the results have
indicated that Q-HP is the most resistant to mechanical change despite that it had
undergone almost 4 times more in the number of cycles and repeated exposure to 1N
NaOH. What is unknown however, are the process titres, levels of impurities that
each resin was exposed to and how many purification steps there were in the process
involving Q-HP. The use of statistical analysis will allow for the quantification of
the significance of these results and the determination as to whether DMA can be
used independently as a tool to test for mechanical differences with varying process
conditions.
Figure 56 shows a plot of slurry resistance versus critical velocity for the fresh, CIP-
exposed and aged conditions of Capto Adhere. The plot correlates with previously
discussed trends – Fresh resin is the most mechanically robust followed by CIP-
exposed and aged CA resin. Similar to SEM structural analysis for CA, the
mechanical performance of CIP-exposed resin is more closely matched to its aged
counterpart than its fresh counterpart, which may indicate that structural analysis is
somewhat indicative of mechanical performance. It is important to note that Capto
Adhere is the only resin for which pressure-flow and DMA data were collected
under all 3 conditions and is therefore the only media that has 3 points that can be

197
plotted on a graph. However the collated information for fresh and aged pressure-
flow and DMA data for other studied resins can be found in the appendix.

198
5.4.Statistical analysis - results
In order to ascertain whether there is a significant difference in the mechanical
behaviour of fresh, CIP-exposed and aged resins, statistical analysis needs to be
performed. This will account for areas of uncertainty between standard deviations. If
the statistical results for both pressure-flow and DMA data are in agreement, it
would indicate that DMA could be used as a small volume, high throughput
technique to analyse mechanical differences in the studied agarose-based
chromatography media independent of pressure-flow characterisation data. However,
there are a number of factors to consider when choosing the most appropriate
method with which to carry out statistical analysis.
ANOVA (analysis of variance) holds many advantages over other conventional
statistical methods, such as t-tests. T-tests only allow for the comparison of means
between 2 samples. However, if more than 2 conditions are used in an experiment,
ANOVA is required. Furthermore, the larger the number of hypotheses tested using
the t-test, the higher the Type I error and the less powerful the statistical results
become (Boslaugh, 2012). This study will use one-way ANOVA (or ANOVA:
single-factor) as significant differences between 3 conditions will be tested.
ANOVA works by either rejecting or failing to reject a null hypothesis. A null
hypothesis assumes that the means in all populations in all conditions are the same
and is expressed as:
H0: µfresh = µCIP-exposed = µaged
meaning that there is no difference between the mean mechanical strength values for
fresh, CIP-exposed or aged resins. If the null hypothesis is rejected then it can be
concluded that at least one population mean is different to the others. In that case the
alternative hypothesis (Ha) would be true (Seltman, 2007).
Ha: Ǝ fresh, CIP-exposed, aged: µfresh ≠ µCIP-exposed ≠ µaged
In order to ascertain whether this is the case, a comparison of F ratios are made. If
the F value is higher than the Fcrit value, then the null hypothesis rejected, meaning
that there is a statistical difference between the populations. The F-statistics can be
automatically computed in many packages including Microsoft Excel and is

199
calculated based on a number of sums of squares and degrees of freedom
(Mendenhall and Sincich, 2006). It should be noted that the Fcrit value is calculated
based the number of samples and the number of conditions. As this is the same in
both pressure-flow and DMA experiments, the calculated Fcrit value will be the same
in all cases.

200
Technique Capto Adhere
conditions
F Fcrit (to 1dp) Proven
hypothesis
Pressure-flow Fresh- CIP-
exposed
104 7.7 Ha
DMA Fresh- CIP-
exposed
16 7.7 Ha
Pressure-flow CIP-exposed-
Aged
2 7.7 H0
DMA CIP-exposed-
Aged
1 7.7 H0
Technique Resin (fresh -
aged
conditions)
F Fcrit (to 1dp) Proven
hypothesis
Pressure-flow MabSelect 12.5 7.7 Ha
DMA MabSelect 12.7 7.7 Ha
Pressure-flow MabSelect
Xtra
6.1 7.7 H0
DMA MabSelect
Xtra
9.4 7.7 Ha
Pressure-flow Q-Sepharose
HP
4.5 7.7 H0
DMA Q-Sepharose
HP
3.1 7.7 H0
Pressure-flow Capto Adhere 125 7.7 Ha
DMA Capto Adhere 17.8 7.7 Ha
Table 27- Statistical analysis showing whether there is significance between
results for fresh and aged resin using the pressure-flow and DMA
techniques. Blue indicates that both techniques show agreed significance of
results and therefore prove the same hypothesis. Red indicates the opposite.
Table 28- Statistical analysis of results for Capto Adhere. The table shows
the significance values for the results comparing fresh to CIP-exposed CA
and CIP-exposed CA to aged for both pressure-flow and DMA. Blue
indicates that both techniques show agreed significance and therefore
prove the same hypothesis.

201
Resin Conditions F Fcrit Proven
hypothesis
MabSelect Fresh- CIP-
exposed
33 7.7 Ha
CIP-exposed -
Aged
1 7.7 H0
MabSelect
Xtra
Fresh- CIP-
exposed
0.6 7.7 H0
CIP-exposed -
Aged
5 7.7 H0
Q-Sepharose
HP
Fresh- CIP-
exposed
2.5 7.7 H0
CIP-exposed -
Aged
0.08 7.7 H0
Table 29- Statistical analysis of DMA results for MabSelect, MabSelect
Xtra and Q-Sepharose HP comparing fresh- CIP-exposed conditions
and CIP-exposed- aged conditions for each resin.

202
5.4.1. Statistical analysis - discussion
The results from table 27 show whether there are statistical differences between the
fresh and aged resins used in this study using both pressure-flow characterisation and
dynamic mechanical analysis techniques. When the F value is greater than the Fcrit
value, the null hypothesis (H0) is rejected, meaning that there is a significant
difference between fresh and aged resin, making the alternative hypothesis true (Ha).
If this is shown for both pressure-flow and DMA, it is an indication that DMA can
be used independent of pressure-flow characterisation to characterise changes to
mechanical integrity over the lifetime of chromatography media. The boxes
highlighted in blue indicate that both pressure-flow and DMA prove the same
hypothesis. This is the case for 3 out of the 4 studied resins - MabSelect, Q-
Sepharose and Capto Adhere. The results show that there is a significant difference
between fresh and aged MabSelect resin as well as fresh and aged Capto Adhere
resin. This was also observed structurally in their corresponding SEM micrographs
(chapter 3 and section 5.2.) The results indicate that there are no statistical
differences between fresh and aged Q-HP. This corroborates aforementioned
findings that the mechanical differences between fresh and aged Q-HP resin were
less apparent using both techniques (section 5.3.) Furthermore, structural
characterisation studies in section 5.2 and chapter 3 indicated that the structural
changes observed in Q-HP were not as distinct and other studied resins such as
Capto Adhere and MabSelect.
Contrastingly, statistical analysis using the DMA technique for MabSelect Xtra
showed Ha to be true, i.e. that there is a significant difference between fresh and aged
MabSelect Xtra, however, the opposite was proven using pressure-flow
characterisation (highlighted in red). Reasons for this could be associated with
increased sensitivity of the DMA technique, given that it uses a much reduced
volume of resin, mechanical changes that were otherwise undetectable using
pressure-flow could have been detected with DMA. Furthermore, the expectation of
substantial changes to mechanical integrity of MabSelect Xtra is not completely
surprising given the structural changes observed in section 5.2. Substantial
mechanical changes would also corroborate with the aforementioned problem of
severe back pressure increases observed by the second company after a relatively

203
low number of cycles. It is also important to note however, that more experimental
repeats (n) would increase the statistical power to get an enhanced understanding of
what these results truly indicate and increase confidence in these results as a whole.
Table 28 shows the statistical differences for Capto Adhere under CIP-exposed
conditions and aged conditions using both the pressure-flow and DMA techniques.
Both techniques corroborated the same hypotheses, hence why the table is
highlighted in blue. The results show that there is a significant difference between
fresh and CIP-exposed Capto Adhere however there is no significant difference
between CIP-exposed and aged Capto Adhere. This would indicate that the addition
of protein feed material would not have a significant effect on the mechanical
robustness of the resin and that CIP-exposed conditions contribute the most to the
mechanical aging of Capto Adhere. However, this could be due to the fact that the
CIP-exposed conditions ran for 50 cycles compared to 17 cycles under aged
conditions. Furthermore, as Capto Adhere is used as the last chromatography step in
the production of an IgG4 product, it is exposed to far fewer impurities than
MabSelect. Therefore the impact of foulants on the bead structure and mechanical
integrity may be much reduced.
Table 29 shows statistical analysis of DMA results for MabSelect, MabSelect Xtra
and Q-Sepharose High Performance comparing the significance of fresh to CIP-
exposed conditions and CIP-exposed to aged conditions. The results show that there
is a significant difference between fresh and CIP-exposed MabSelect but no
statistical significance going from CIP-exposed to aged conditions. This also appears
to be shown quite clearly in figure 52(b) as the error bars overlap. This is contrary to
what was observed in the structural analysis of MabSelect under CIP-exposed and
aged conditions. Aged MabSelect appeared to have a higher amount of fibre
breakage and more evident damage to the matrix structure (figure 44(b)). It may
suggest that a higher number of DMA experimental repeats may be necessary to
determine whether these structural findings bear any impact on mechanical integrity.
The results also show that there is no statistical difference between fresh and CIP-
exposed MabSelect Xtra resin, as well as CIP-exposed and aged MabSelect Xtra
resin. It should be noted that the CIP-exposed data used in this analysis was the
‘outer’ surface data. The SEM images in section 5.2. figure 41(b) show that the outer
204
surface has similar surface characteristics to its aged counterpart (figure 45(b)). This
could explain why statistical analysis would show no significance between the two
conditions. But, as previously alluded to, a higher number of DMA experimental
repeats would increase confidence in these statistical findings.
The results also show that there are no statistical differences between fresh and CIP-
exposed Q-HP resin, as well as CIP-exposed and aged Q-HP resin. This is
corroborated by the structural analysis results that indicate that whilst there are
observed structural differences in fresh, CIP-exposed and aged Q-HP, these
differences, relative to the other studied resins, appear to be the least distinct. This
would also aid in validating an aforementioned supposition that based on similar
results, Q-HP would appear to be the most resilient to mechanical changes in spite of
varied process conditions. The results also indicate that structural changes observed
in the micrographs between fresh, CIP and aged resins, are indicative of mechanical
changes, which is in agreement with similar studies comparing structural changes to
other chromatographic performance parameters (Ioannidis, 2009; Jiang et al., 2009;
Close et al., 2013; Gavara et al., 2015). For example, the fibre degradation observed
in aged MabSelect micrographs, resulted in reduced mechanical robustness
compared to its fresh counterpart under both pressure-flow and DMA studies. What
structural analysis does not indicate is the extent of reduction in mechanical strength.
Despite Q-HP and MabSelect appearing to show similar amounts of fibre
degradation, they display different levels of mechanical strength, as pressure-flow
and DMA showed Q-HP to be far more mechanically robust than what the SEM
micrographs would suggest. From this, it can be concluded that SEM can be used as
an early stage indicator of mechanical robustness; however, mechanical testing
would still have to be conducted to determine the extent of loss in mechanical
strength.

205
5.5.Conclusion
Four resins were analysed – MabSelect, MabSelect Xtra, Q-Sepharose High
Performance and Capto Adhere - to determine whether there were any structural
and/or mechanical changes to the resins once exposed to typical process conditions
(see tables 17 and 18). The experimental design compared “CIP-exposed” and
“aged” to their fresh counterparts. CIP-exposed conditions involved exposing the
resins to 50 cycles of buffer-only conditions to assess the impact of CIP reagents on
structural and mechanical integrity, whilst aged resins were generated by two
manufacturing companies who had conducted lifetime studies for the purification of
two monoclonal antibodies (IgG 1 and 4) and a fusion protein under separate
processes. The structural analysis studies were conducted using scanning electron
microscopy imaging, while the mechanical integrity studies were conducted using
pressure-flow characterisation studies and dynamic mechanical analysis.
The results from the structural analysis of the studied resins under different
conditions show that there are structural differences under fresh, CIP-exposed and
aged conditions for all 4 resins. The results indicate that each resin ages differently.
MabSelect and Q-HP show matrix fibre degradation characteristics with aging,
whilst Capto Adhere and MabSelect Xtra show matrix occlusion – possibly foulants
adhering to the surfaces, causing reduced pore sizes. In the case of MabSelect Xtra,
this aging mechanism may be a large contributor towards overpressuring of the
column observed by the second company, as pore diffusion has been reported to be a
rate limiting step in recent studies of protein A mass transfer characteristics, which
can lead to back pressure issues (Bemberis, Noyes and Natarajan, 2003; Pathak and
Rathore, 2016). The impact of CIP-exposed conditions appeared to have little visual
effect on most resins; however Capto Adhere observed the biggest visual structural
change under these conditions. The surface properties appeared to resemble Capto
Adhere under aged conditions. This could indicate that impact of process feed
material on the structural integrity of Capto Adhere is relatively minimal; however,
more tests would need to be conducted to verify this. Subsequently mechanical
testing was conducted on these resins to ascertain whether the observed structural
changes were indicative of mechanical differences.

206
The results from the mechanical analysis of the studied resins under different
conditions show that there were mechanical differences under fresh, CIP-exposed
and aged conditions for all 4 resins. Mechanical tests were carried out using
pressure-flow and dynamic mechanical analysis techniques. Both techniques showed
that fresh resins were mechanically more robust than their processed counterparts
and resins exposed to CIP conditions were more robust than their aged counterparts.
In order to determine the significance of these results, ANOVA: single-factor
statistical analysis was conducted. This showed that the results from DMA
experiments corroborated that of pressure-flow experiments on 5/6 occasions, which
is a strong indication that DMA can be used independently of pressure-flow to test
the mechanical integrity bioprocessed resin throughout its lifetime. The statistical
results also showed that there were significant differences between fresh and aged
MabSelect, Q-HP and Capto Adhere as well as fresh and CIP-exposed Capto
Adhere, which is supported by observations in the corresponding SEM micrographs.
In the case of MabSelect Xtra, while pressure-flow characterisation suggested that
there was no significant difference between fresh and aged resin, DMA suggested
the opposite to be true, which would corroborate the findings of the structural
analysis data.
The results indicate that while repeated exposure of buffers and CIP reagents can
affect the structural and mechanical integrity of chromatography resins to a large
extent, the interaction of product/feed material does have a different and more
significant impact on the way in which the resins age. In order to possibly extend
resin lifetime, these results would indicate the need for two things: a review of the
clarification strategy used and ways to lower burdens on downstream processing or
that more studies would need to be conducted in order to determine ideal CIP-
process feed interactions that would result in the least damage to chromatography
media whilst still maintaining acceptable column performance.

207
CHAPTER 6 FINAL CONCLUSIONS
208
6. FINAL CONCLUSIONS
The work presented in this thesis has made use of structural and mechanical testing
tools (SEM, pressure-flow characterisation and DMA) to further enhance the
understanding of the changes that occur when chromatography media is exposed to
different bioprocessing conditions. This chapter reviews each results chapter in order
to determine whether the initial objectives have been addressed.
The objectives of the first results chapter involved visualising a range of resins and
quantifying associated structural properties. Using scanning electron microscopy
(SEM), the properties of nine commercially available resins were observed and
quantified using ImageJ software (section 6.1 for results).
The objective of the second results chapter was to quantify mechanical differences
between the nine resins. To fulfil this, mechanical properties of these resins were
investigated using pressure-flow characterisation. The limitations of this technique
led to the development of a novel technique to this field – dynamic mechanical
analysis. The results reported in section 6.1 of this chapter show pressure-flow and
DMA to display the same trends and indicate that DMA can be used as a small
volume, high-throughput technique for mechanical characterisation of resins.
The objective of the final results chapter involved the use of SEM, pressure-flow and
DMA in order to characterise four resins that had been exposed to varying
bioprocess conditions - buffer conditions (CIP-exposed) as well as protein
purification conditions (aged) over repeated cycle. The results reported in section 6.1
have shown that the 4 resins used in this study age via matrix degradation or fouling
when exposed to certain conditions and suggest that the interaction of CIP reagents
and foulants have the biggest impact on resin integrity.

209
6.1.Conclusions – Review of objectives
The objectives addressed in the first results chapter (chapter 3) are outlined below:
Ultrastructural visualisation and qualification of a range of commercially
available agarose-based chromatography media
Quantification of the observed ultrastructural properties
The first results chapter used scanning electron microscopy (SEM) to observe the
structural properties of nine agarose-based chromatography media - Sepharose CL-
4B (SCL4B), Sepharose CL-6B (SCL6B), Sepharose 4 Fast Flow (S4FF), Sepharose
6 Fast Flow (S6FF), Q-Sepharose High Performance (Q-HP), MabSelect Xtra
(MSX), MabSelect (MS), Capto Adhere (CA) and Capto Q (CQ). The samples
require a drying step as a pre-treatment procedure that can impact the quality of
images produced using SEM. This chapter investigated 3 commonly used drying
techniques – air drying, freeze drying and critical point drying (CPD). Air drying did
not provide sufficient drying for clear ultrastructural visualisation, whilst freeze
drying caused bead breakage. It was found that CPD was the most suitable drying
procedure as it best preserved the ultrastructural properties of the resins and allowed
for high resolution imaging of surface properties.
The micrographs were then analysed both qualitatively and quantitatively.
Quantitative analysis was carried out using Image J software in order to ascertain
whether what was assessed qualitatively could also be measured accurately, with
particular focus on average pore size, apparent porosity, pore count and pore size
distribution. Certain properties, such as pore size and pore size distribution were
difficult to assess by sight only. It should be noted that the use of terms such as
‘apparent porosity’ accounts for the fact that the porosity measurements in this study
are based on 2-D images that do not account for the angle at which the micrographs
were attained. For this reason, the values obtained in this study for average pore size,
apparent porosity and pore size distribution differ from studies that account for the
3-D nature of the pores (Yao and Lenhoff, 2004; Bacskay, Sepsey and Felinger,
2014; Sepsey, Bacskay and Felinger, 2014). Some studies have however made use of

210
2-D pore information as a general guide (Ioannidis, 2009). However, a trend can be
observed based on the values obtained. The results showed that Capto Q had the
highest pore count (>1000), MabSelect Xtra had the lowest pore count (~300), the
highest pore size (~d95nm) and the highest pore size distribution, while SCL4B had
the lowest pore size distribution. S4FF had the smallest average pore size (~d45nm)
and the lowest apparent porosity (17%), while Q-HP had the highest apparent
porosity at 44%.
The main challenges faced when using SEM for quantitative image analysis involved
obtaining a large number of images with consistently high enough resolution. This
proved difficult due the high sensitivity of the polymers and their susceptibility to
damage if exposed to the focused electron beam for too long. A further challenge
was the use of 2-D imaging to characterise 3-dimensional properties. As a result, the
values obtained can only be used as a general guide to support visual observations.
The objective addressed in the second results chapter (chapter 4) is outlined below:
Quantification of the mechanical properties of the resins
Pressure-flow analysis was used to determine whether the differences in the
observed structural properties were in any way indicative of mechanical strength.
This was carried out to determine the mechanical limits of each resin, operated in an
XK16 column, ~30ml. The results showed that the Capto family had the highest
critical velocities (CA- 492, CQ- 477 cm/hr), followed by the MabSelect family
(MS- 423, MSX- 403 cm/hr). Q-HP (353 cm/hr) and S6FF (348 cm/hr) exhibited
quasi-identical behaviour in the column whilst SCL6B, S4FF and SCL4B had the
lowest critical velocity values (283, 204, 149 cm/hr respectively).
There were practical limitations in using the pressure-flow technique alone for
mechanical characterisation, including the large quantity of chromatography media
and buffers required, as well as the stringent criteria required to pack a column. The
development of a low volume, high throughput technique – dynamic mechanical
analysis (DMA) - that aimed to address the challenges associated with the pressure-
211
flow characterisation was also presented in this chapter. The DMA technique
allowed for further mechanical characterisation based on the viscoelastic properties
using 1ml of resin. The technique was applied to the nine studied resins and
correlated with the results obtained using the pressure-flow technique. The same
trends were observed – The Capto family showed the highest resistance to
deformation (CA- 2.7, CQ- 1.92 1/%min-1), followed by the MabSelect family (MS-
1.81, MSX- 1.64 1/%min-1). Q-HP and S6FF showed similar resistance and SCL6B,
S4FF and SCL4B had the lowest slurry resistance values (0.59, 0.4, 0.3 1/%min-1
respectively). These results indicate that DMA can be used as a small volume, high-
throughput technique for the mechanical characterisation of chromatography media.
The objective addressed in the third results chapter (chapter 5) is outlined below:
The use of these tools (SEM, pressure-flow characterisation and DMA) to
investigate structural and mechanical properties of a selection of these resins
exposed to varying bioprocessing conditions.
The final results chapter utilises all three structural and mechanical testing tools –
SEM, pressure-flow characterisation and DMA – to assess the structural and
mechanical changes observed in resins exposed to different bioprocessing
conditions. The four selected resins used in this chapter were MabSelect, MSX, Q-
HP and Capto Adhere. Each resin had been exposed to two different conditions
termed CIP-exposed and aged. CIP conditions involved exposing each resin to 50
cycles of buffer conditions only (i.e. no protein product exposure), in order to gain
an understanding into how these conditions contribute to the structural and
mechanical integrity of the resins. Regarding the second condition, aged, each resin
had been used for resin lifetime studies in the production a monoclonal antibody (or
a fusion protein, in the case of Q-HP) and had therefore been exposed to repeated
cycles of process feed, including impurities as well as buffer and CIP reagents. The
impact of this condition on the structural and mechanical properties of the resins was
compared with its fresh and CIP-exposed counterparts to observe how the properties
of the resins had changed.

212
MS and Q-HP appeared to show similar mechanisms of aging. Their matrices
degraded with increased exposure, leading to the formation of larger pores, whilst
the opposite was true for CA and MSX. In these cases, there appeared to be foulants
adhering to the surface fibres, leading to a reduction in pore size. The results from
mechanical analysis were consistent in all cases. Fresh resins showed higher
mechanical resistance compared to their bioprocessed counterparts, while CIP-
exposed resins were mechanically more robust than their aged counterparts, but to
different extents. Statistical analysis was performed with one way ANOVA to
determine whether DMA alone could be used to assess the impact of process
conditions on the mechanical properties of chromatography media and the results
show a >80% certainty that DMA can be employed for this purpose. To increase this
value, it is likely that more experimental repeats would need to be carried out.
The results indicate that while repeated exposure of buffers and CIP reagents can
affect the structural and mechanical integrity of chromatography resins to a large
extent, the interaction of CIP reagents with foulants does have a different and more
significant impact on the way in which the resins age. In order to possibly extend
resin lifetime, these results would indicate the need for two things: a review of the
clarification strategy used and ways to lower burdens on downstream processing or
that more studies would need to be conducted in order to determine ideal CIP-
process feed interactions that would result in the least damage to chromatography
media whilst still maintaining acceptable column performance.
6.2.Overall aim
The results from these studies have shown that a combination of structural and
mechanical testing tools can provide a more rounded picture of the contrasting
properties of different resins, as well as resins exposed to different bioprocessing
conditions. The use of these tools can be employed to investigate a number of
emerging concerns for process validation and manufacturing companies. Concerns
over batch-to-batch variation, how to evaluate these studies and the frequency of
these studies have become areas of scrutiny, as regulatory authorities tighten up
process criteria requirements as a means of making safety enhancements (Hentschel,
2013). Further drug manufacturing concerns relate to the lack of understanding

213
surrounding mass transfer through certain sections of the column. A combination of
the structural and mechanical techniques presented in this thesis, along with work
that has shown potential to be applied in further understanding the aging
mechanisms of chromatography resins can contribute greatly to addressing some of
the aforementioned concerns. DMA in particular could be used to test for mechanical
variations between batches of resins. It also has the potential to test resins post-
emulsification, aid in the development of new resins and be applied to resins of non-
agarose based material.
6.3. Study bottlenecks
As outlined above, a number of primary objectives were met in this study. However,
with the provision of information pertaining to certain aspects of this study, a range
of secondary objectives could have been explored (further outlined in chapter 7 –
Future Work). Use of the structural and mechanical tools developed in this study on
non-agarose based beads may have contributed to a deeper understanding on the
effectivity of this tools, however this could be studied in future work (see chapter 7).
Disclosure of certain information such as the position of the column from which
samples were sent by the sponsoring company, any changes in DBC/HETP observed
as a result of mechanical degradation and structural/mechanical information from the
resin vendors (all of which were deemed confidential) may have also aided in the
understanding of the resin aging process. Although there are many advantages in
using a small volume of sample for DMA studies, tests could be carried out to
determine whether there are mechanical differences in different sections of the
column in order to get a more representative mechanical characterization profile of a
large-scale column. Finally, as well as the application of tools developed in this
study to non-agarose beads, the flexibility of the DMA technique, as described in
chapter 4 means it can be adapted to test non-beaded chromatography formats. The
information collected could then be linked/correlated to other chromatography
performance characteristics such as DBC, yield etc. (see chapter 7).

214
CHAPTER 7 FUTURE WORK

215
7. FUTURE WORK
With chromatography being the workhorse of the biopharmaceutical purification
train, it is responsible for producing over 500 tons of biopharmaceutical products,
such as monoclonal antibodies (mAbs) per year (Jagschies, Sofer and Hagel, 2008).
It is also considered to be the most expensive part of downstream processing. It has
been estimated that in a typical mAb process, 60% of downstream costs come from
chromatography alone and the cost of a typical Protein A resin is 50% higher than
the cost of other types of chromatographic media, such as ion exchangers (Rathore et
al., 2015; Hernandez, 2016). Aside from economic implications, the increased
product titres achieved within the last few years have led to a heavier burden on
downstream processing, which in turn, has led to regulatory authorities calling for
manufacturers to better define their processes to deal with the increased load
(Hentschel, 2013). The Quality by Design (QbD) and Process Analytical Technology
(PAT) initiatives call for increased process and product understanding to ensure each
process consistently meets precisely defined quality attributes. This has led to
increased research in factors that define the critical quality attributes (CQAs) of resin
aging and linking them to their corresponding critical process parameters (CPPs),
meaning a thorough and systematic approach to characterise the process parameter
space (Hanke and Ottens, 2014).
Due to these pressures, there is a need to identify procedures that can be
implemented to contribute to an increase in resin lifetime. As previously alluded to, a
number of approaches could be taken. Improvements to clarification strategies as
well as alterations to process feed material and process conditions, such as flow rate
and mobile phase viscosity, can act as troubleshooting techniques for the extension
of resin lifetime. Bracewell et al. 2008 reported that more poorly clarified
suspensions required proportionally larger filters, however increased clarification led
to greater column capacity. They also reported that the use of centrifugation
followed by filtration left lipids in their soluble state, meaning that they were not
removed. Similarly, Jin et al. 2009 found that the presence of lipids in the
purification of virus-like particles (VLPs) greatly reduced recovery by almost 70%
over 40 cycles. However improvements to CIP conditions caused a 20% rise in
recovery but only when higher degrees of lipid fouling had occurred. Revisions to

216
clean-in-place (CIP) and regeneration conditions can also extend resin lifetime
(Sofer and Yourkin, 2007). In 2008, Tengliden investigated a number of CIP
procedures optimised for protein A chromatography using design of experiments
(DoE) approach. The study showed that after exposure to 0.55 M NaOH for 24
hours, MabSelect Sure had retained 90% of its original capacity and the addition of
sodium chloride provided a stabilizing effect on the resin. More recently, Grönberg
et al. 2011 developed a high-throughput method for screening for CIP conditions on
MabSelect Sure and had found similar results, also with the addition of sodium
chloride acting as a stabilizing agent.
Choosing the adsorbent most suitable for the specific protein to be purified is
important. The degree of agarose-based resin cross-linking has been reported to
contribute towards both the chemical and mechanical stability of the resin
(Andersson, Ramberg and Johansson, 1998; Hardin et al., 2009). Langer 2013 found
that too high a degree of cross-linking caused mass transfer limitations leading to a
decrease in resin functionality. A further property is resin bead size. Masters 2012
reported on the impact of using smaller vs. larger resins on chromatographic
performance. Smaller beads tend to encourage faster mass transfer than larger beads,
higher efficiency and better resolution. However they exhibit greater tendencies for
high back pressure issues and equipment and economic implications. Larger resins
provide higher capacity, fewer back pressure issues and better economics. However,
achievable resolution and efficiency is lower than that of smaller beads.
The following sections briefly describe a number of experimental procedures that
can be employed to enhance the results of this study and contribute towards further
understanding of the aging of chromatography resins.
7.1.Resin fines studies
The results from chapter 5 have indicated that 2 of the 4 studied resins show matrix
fibre degradation characteristics (MabSelect and Q-HP). This indicates that beads
may have disintegrated during column operation that has led to the observed
breakdown of the matrix structure, creating small particles or fines. This build-up
may contribute to back pressure build-up and mechanical instability of the column.
In order to ascertain whether this is the case, studies could be carried out intended to

217
collect resin fines with the use of sieves. Particle size analysis could then be
conducted on the resin fines to further understand the effects of these particulates on
column stability.
7.2.Cryo-microtoming of bioprocessed samples
In order to gain an enhanced understanding of the mechanical stability of the column
during operation, it is important to investigate the beads in their entirety and not
solely surface characteristics. One way of potentially achieving this would be to
visualise the interior of the beads to observe whether the surface characteristics are
distinct from the sub-surface characteristics. Pathak et al. 2017 recently used an
ultramicrotoming device to view the interior of fouled MabSelect resin using
transmission electron microscopy (TEM). Limitations to the employed techniques
are that ultramicrotoming does not allow for controlled temperatures within the
microtoming chamber and the use of TEM requires extensive sample preparation.
Furthermore, a wider range of resins under different bioprocessing conditions would
need to be investigated for enhanced understanding. A tool that could potentially be
used to address one of these limitations is cryo-microtoming. This tool can be used
to slice thin sections (50nm-100µm) of the bead at a suitable temperature and
potentially without the need for further pre-treatment prior to visualisation.
Subsequently, SEM can be used for clearer ultrastructural visualisation of the
sections. The flatness of the sections will allow for better quantitative analysis of the
sub-surface properties.
7.3.Column sectioning studies
Samples from different sections of the column could also be structurally and
mechanically analysed during and post-column operation by combining tools
presented in this work and work from recent studies, particularly Johnson et al. 2017
and Pathak et al. 2017. With this understanding, the effects of mechanical stability
could be correlated with other performance parameters such as DBC, yield, etc. A
combination of these studies will lead to improved process understanding and the
maximisation of resin lifetime and performance.

218
7.4.Potential uses of DMA
Chapter 4 showed that DMA has the potential to be used as a small volume, high-
throughput technique for the mechanical characterisation of chromatography media.
Based on this, DMA could be used by resin manufacturers and researchers to test for
mechanical variations between batches of resins. It also has the potential to test
resins post-emulsification, aid in the development of new resins and be applied to
resins of non-agarose based material, e.g. ceramic, cellulose, etc. The versatility of
the DMA technique means it can be adapted depending on the nature of the
material’s mechanical properties. Mechanical testing for non-beaded
chromatographic materials such as filters can be carried out using DMA in its more
traditional mode of operation, as described in section 4.3. DMA may also be applied
in more recently developed chromatographic technologies such as simulated moving
bed chromatography (SMB). Further studies on how DMA correlates to each
parameter used during structural analysis could be studied. The use of mercury
intrusion for 3D pore size evaluation, porosity and pore size distribution could have
been compared.
7.5.Implementing resin aging analytical tools to satisfy QbD initiatives
Whilst research continues in this area, it should be noted that most of these
techniques are yet to be employed during industrial-scale separations due to the high
cost of some of the equipment. A number of strategies have been presented for
optimising process economics in purification, such as using less expensive
sanitization buffers and moving towards single use filters, prepacked columns and
membrane adsobers (Hernandez, 2016). The employment of more economically
optimised processes, as well as the regulatory pressures for better process
characterisation, a shift towards the implementation of these diagnostic techniques
based on the understanding of column aging mechanisms, needs to be something of
the not-too-distant future. Table 6b highlights the maturity of certain resin aging
analytical tools (i.e. their extent of use within research) and the specific QbD
properties they would meet.

219
REFERENCES
Amsterdam, A., Er-El, Z. and Shaltiel, S. (1975) ‘Ultrastructure of beaded agarose’,
Archives of biochemistry and biophysics. 171(2) pp.673-677
Andersson, M. (2014) Characterisation of Chromatography Media Aimed for
Purification of Biomolecules. PhD thesis - Uppsala Universitet.
Andersson, M., Ramberg, M. and Johansson, B.-L. (1998) ‘The influence of the
degree of cross-linking, type of ligand and support on the chemical stability of
chromatography media intended for protein purification’, Process Biochemistry,
33(1), pp. 47–55.
Attwood, T., Nelmes, B. and Sellen, D. (1988) ‘Electron microscopy of beaded
agarose gels’, Biopolymers, 27(2), pp. 201–212.
Bacskay, I., Sepsey, A. and Felinger, A. (2014) ‘The pore size distribution of the
first and second generation of silica monolithic stationary phases’, Journal of
Chromatography A, 1359, pp. 112–116.
Bahme, H. -J, P. Hedman, E. H. (2002) ‘Advances in Biochemical
Engineering/Biotechnology’, Springer. Edited by R. Freitag, 76, p. 273.
Bell, B. (1988) ‘Comparison of the effects of critical point-drying and freeze-drying
on cytoskeletons and microtubules’, Journal of Microscopy, 151(August), pp. 103–
114.
Bemberis, I., Noyes, A. and Natarajan, V. (2003) ‘Column Packing for Process-Scale
Chromatography: Guidelines for Reproducibility’, BioPharm International Guide,
(July), pp. 23–30.
Bio-Rad Laboratories (2014) Process-Scale Chromatography Columns. Available at:
http://www.bio-rad.com/en-uk/category/process-scale-chromatography-columns.
Blewett, J. M. (2000) Micromanipulation of plant cell mechanical properties.
University of Birmingham, UK.
Boslaugh, S. (2012) Statistics in a Nutshell. 2nd Editio. O’Reilly Media, Inc.
Bracewell, D. G. et al. (2008) ‘Impact of clarification strategy on chromatographic
separations: Pre-processing of cell homogenates.’, Biotechnology and
bioengineering, 100(5), pp. 941–9.
Bray, D. (2000) ‘Critical point drying of biological specimens for scanning electron
microscopy’, Supercritical Fluid Methods and Protocols, 13, pp. 235–243.
Buban, J. P. et al. (2010) ‘High-resolution low-dose scanning transmission electron

220
microscopy’, Journal of Electron Microscopy, 59(2), pp. 103–112.
Carter-Franklin, J. N. et al. (2007) ‘Fragments of protein A eluted during protein A
affinity chromatography’, Journal of Chromatography A, 1163(1–2), pp. 105–111.
Cheng, J. H. (2009) Packing and Quality Control of a Chromatography Column.
Chochois, H. et al. (2011) ‘Industrial-Scale Biochromatography Columns Address
Challenging Purification Needs’, BioProcess International.
Close, E. J. et al. (2013) ‘Fouling of an anion exchange chromatography operation in
a monoclonal antibody process: Visualization and kinetic studies.’, Biotechnology
and bioengineering, 110(9), pp. 2425–35.
Close, E. J. (2015) The derivation of bioprocess understanding from mechanistic
models of chromatography. University College London.
DePhillips, P. and Lenhoff, A. (2000) ‘Pore size distributions of cation-exchange
adsorbents determined by inverse size-exclusion chromatography’, Journal of
Chromatography A, 883, pp. 39–54.
Dey, S. et al. (1989) ‘A new rapid method of air-drying for scanning electron
microscopy using tetramethylsilane’, Journal of Microscopy, 156(2), pp. 259–261.
Ding, P. et al. (2007) ‘Mechanical properties of gelatin – rich microparticles’,
Journal of Food Engineering, 86, pp. 307–314.
Dorn, M. et al. (2017) ‘Influence of different packing methods on the hydrodynamic
stability of chromatography columns’, Journal of Chromatography A. Elsevier B.V.
Draenert, Y. and Draenert, K. (1982) ‘Ice crystal damage in freeze-dried articular
cartilage studied by scanning electron microscopy’, Scan Electron Microsc, (4), pp.
1799–1804.
Fatin-Rouge, N., Konstantin, S. and Jacques, B. (2004) ‘Size effects on diffusion
processes within agarose gels’, Biophysical Journal, 86, pp. 2710–2719.
Gavara, P. et al. (2015) ‘Chromatographic Characterization and Process Performance
of Column-Packed Anion Exchange Fibrous Adsorbents for High Throughput and
High Capacity Bioseparations’, Processes, 3(1), pp. 204–221.
Gerstein, A. (2004) Molecular Biology Problem Solver: A Laboratory Guide. 2nd
edn. Edited by A. Gerstein. Wiley.
Ghetie, V. and Schell, H. D. (1971) Cellular and Molecular Life Sciences. Springer.
doi: 10.1007/BF02154242.
Goldstein, J. et al. (2013) Scanning Electron Microscopy and X-Ray Microanalysis.
3rd edn. Springer US.

221
Grier, S. and Yakubu, S. (2016) ‘Prepacked chromatography columns: evaluation for
use in pilot and large-scale bioprocessing’, BioProcess International.
Griess, G., Guiseley, K. and Serwer, P. (1993) ‘The relationship of agarose gel
structure to the sieving of spheres during agarose gel electrophoresis’, Biophysical
Journal, 65(1), pp. 138–148.
Grimaud, E. et al. (1978) ‘Comparison of gels for molecular sieving of proteins by
electron microscopy and pore parameters determination’, Journal of
Chromatography A, 166(1), pp. 1–348.
Grönberg, A. et al. (2011) ‘A tool for increasing the lifetime of chromatography
resins’, mAbs, 3(2), pp. 192–202.
Gu, T. et al. (1990) ‘Displacement effect in multicomponent chromatography’,
AIChE Journal, 36, pp. 1156–1162.
Guélat, B. et al. (2012) ‘Simulation model for overloaded monoclonal antibody
variants separations in ion-exchange chromatography’, Journal of Chromatography
A, 1253, pp. 32–43.
Guichon, G., A, F. and Shirazi, D. (2006) Fundamentals of preparative and
nonlinear chromatography. 2nd Editio. Academic Press.
Hagel, L., Ostberg, M. and Andersson, T. (1996) ‘Apparent pore size distributions of
chromatography media’, Journal of Chromatography A, 743(1), pp. 33–42.
Hahn, T. et al. (2015) ‘Simulating and Optimizing Preparative Protein
Chromatography with ChromX’, Journal of Chem. Educ, 92(9), pp. 1497–1502.
Hanke, A. T. and Ottens, M. (2014) ‘Purifying biopharmaceuticals: knowledge-
based chromatographic process development’, Trends in Biotechnology. Elsevier
Ltd, 32(4), pp. 210–220.
Hardin, A. M. et al. (2009) ‘Ion exchange chromatography of monoclonal
antibodies: Effect of resin ligand density on dymanic binding capacity’, Journal of
Chromatography A, 20(1216), pp. 4366–4371. doi:
Helmy, I. M. and Abdel Azim, A. M. (2012) ‘Efficacy of ImageJ in the assessment
of apoptosis’, Diagnostic Pathology, 7(1), p. 15.
Hemph, R. et al. (2007) ‘Discrete eluent simulations and experimental validation of
particle packing in a 5mm chromatography column’, in International conference for
multiphase flow. Leipzig.
Hentschel, N. (2013) ‘EMA Expert Workshop on Validation of Manufacturing for
Biological Medicinal Products’,

222
Hernandez, R. (2016) ‘Achieving Cost-Effective Bioprocesses’, BioPharm
International, 29(3), pp. 14–19.
Hubbuch, J. and Kula, M. R. (2008) ‘Confocal laser scanning microscopy as an
analytical tool in chromatographic research.’, Bioprocess and biosystems
engineering, 31(3), pp. 241–59.
Ioannidis, N. (2009) Manufacturing of agarose-based chromatographic media with
controlled pore and particle size. University of Birmingham.
Ioannidis, N. et al. (2012) ‘Manufacturing of agarose-based chromatographic
adsorbents - Effect of ionic strength and cooling conditions on particle structure and
mechanical strength’, Journal of Colloid and Interface Science. Elsevier Inc., 367(1),
pp. 153–160.
Jagschies, G., Sofer, G. and Hagel, L. (2008) Handbook of Process Chromatography
- Development, Manufacturing, Validation and Economics. 2nd edn. Elsevier.
Jensen, E. C. (2013) ‘Quantitative Analysis of Histological Staining and
Fluorescence Using ImageJ’, Anatomical Record, 296(3), pp. 378–381.
Jiang, C. et al. (2009) ‘A mechanistic study of Protein A chromatography resin
lifetime’, Journal of Chromatography A, 1216(31), pp. 5849–5855.
Jin, J. et al. (2009) ‘Evaluation of the impact of lipid fouling during the
chromatographic purification of virus-like particles from Saccharomyces cerevisiae’,
Journal of Chemical Technology & Biotechnology, (June 2009),
Johnson, T. F. et al. (2017) ‘X-ray computed tomography of packed bed
chromatography columns for three dimensional imaging and analysis’, Journal of
Chromatography A. Elsevier B.V., 1487, pp. 108–115.
Jones, C. G. (2012) ‘Scanning Electron Microscopy: Preparation and Imaging for
SEM’, Methods in Molecular Biology Springer Protocols. Edited by L. S. Bell.
Totowa, NJ: Humana Press (Methods in Molecular Biology), 915, pp. 1–20.
Joy, D. and Pawley, J. (1992) ‘High-resolution scanning electron microscopy’,
Ultramicroscopy, 47(I 992), pp. 80–100.
Jungbauer, A. (2005) ‘Chromatographic media for bioseparation’, Journal of
Chromatography A, 1065(1), pp. 3–12.
Keener, R., Maneval, J. and Fernandez, E. (2004) ‘Toward a Robust Model of
Packing and Scale-Up for Chromatographic Beds. 1. Mechanical Compression’,
Biotechnology progress, 20, pp. 1146–1158.
Keller, K., Friedmann, T. and Boxman, A. (2001) ‘The bioseparation needs for

223
tomorrow’, Trends in Biotechnology, 19(11), pp. 438–441.
Kennedy, R. (2003) ‘Qualification of a Chromatographic Column’, BioPharm
International, (March).
Kervrann, C. et al. (2016) ‘A Guided Tour of Selected Image Processing and
Analysis Methods for Fluorescence and Electron Microscopy’, IEEE Journal of
Selected Topics in Signal Processing, 10(1), pp. 6–30.
Knox, J. and Ritchie, H. (1987) ‘Determination of pore size distribution curves by
size-exclusion chromatography’, Journal of Chromatography A, 387, pp. 65–84.
Kong, D. et al. (2017) ‘Effects of Bed Compression on Protein Separation on Gel
Filtration Chromatography at Bench and Pilot Scale’, Journal of Chemical
Technology & Biotechnology.
Laas, T. (1998) Protein Purification: Principles, High Resolution Methods and
Applications. 2nd editio. Wiley-VCH.
Langer, E. (2013) ‘Influence of conditions of chromatographic analysis and cross-
linking process on Flory-Huggins parameters and solubility parameters of selected
epoxy resins’, Chemik International Edition, 64(4), pp. 301–308.
Laursen, K., Justesen, U. and Rasmussen, M. (2011) ‘Enhanced monitoring of
biopharmaceutical product purity using liquid chromatography mass spectrometry’,
Journal of Chromatography A, 1218(28), pp. 4340–4348.
Lienqueo, E. ., Shene, C. and Asenjo, J. (2009) ‘Optimization of hydrophobic
interaction chromatography using a mathematical model of elution curves of a
protein mixture’, J. Mol. Recognit, 22, pp. 110–120.
von Lieres, E. et al. (2014) ‘Chromatography Analysis and Design Toolkit
(CADET)’, Chemie Ingenieur Technik, 86(9), p. 1629.
von Lieres, E. and Andersson, J. (2010) ‘A fast and accurate solver for the general
rate model of column liquid chromatography’, Comput. Chem. Eng., 34(8), pp.
1180–1191.
Linden, T. et al. (1999) ‘Visualizing two-component protein diffusion in porous
adsorbents by confocal scanning laser microscopy.’, Biotechnology and
bioengineering, 65(6), pp. 622–30.
Linden, T. et al. (2002) ‘Visualizing patterns of protein uptake to porous media
using confocal scanning laser microscopy’, Separation Science and Technology,
37(1), pp. 1–32.
Lintern, K. et al. (2016) ‘Residual on column host cell protein analysis during

224
lifetime studies of protein A chromatography’, Journal of Chromatography A, 1461,
pp. 70–77.
Liu, T., Donald, A. and Zhang, Z. (2005) ‘Novel manipulation in Environmental
SEM for measuring the mechanical properties of single nano-particles’, Materials
Science and Technology, 21(3), pp. 289–294.
Luo, X. et al. (2002) ‘Simulation of packed bed formation in chromatography
columns’, in Proceedings of the WCPT World Congress of Particle Technology.
Sedney.
Maaloum, M., Pernodet, N. and Tinland, B. (1998) ‘Agarose gel structure using
atomic force microscopy: gel concentration and ionic strength effects’,
Electrophoresis, 19(10), pp. 1606–1610.
Mashmoushy, H., Zhang, Z. and Thomas, C. (1998) ‘Micromanipulation of the
mechanical properties of baker’s yeast cells’, Biotechnology Techniques, 12, pp.
925–929.
Masters, A. (2012) Types of Ion Exchange Chromatography Media.
Medin, A. (1995) Studies on Structure and Properties of Agarose. Uppsala: Acta
Universitatis Upsaliensis.
Menard, K. (2008) Dynamic Mechanical Analysis: A Practical Introduction.
Menard, K. and Menard, N. (2015) Dynamic Mechanical Analysis in the Analysis of
Polymers and Rubbers.
Mendenhall, W. and Sincich, T. (2006) Statistics for Engineering and the Sciences.
5th editio. Pearsons.
Meyvis, T. and Stubbe, B. (2002) ‘A comparison between the use of dynamic
mechanical analysis and oscillatory shear rheometry for the characterisation of
hydrogels’, International Journal of Pharmaceutics, 244, pp. 163–168.
Michler, G. H. (2008) ‘8 Problems Associated with the Electron Microscopy’,
Electron Microscopy of Polymers, p. 473.
Mollerup, J. M. (2008) ‘A review of the thermodynamics of protein association to
ligands, protein adsorption, and adsorption isotherms’, Chemical Engineering and
Technology, 31(6), pp. 864–874.
Moroni, L., De Wijn, J. R. and Van Blitterswijk, C. A. (2006) ‘3D fiber-deposited
scaffolds for tissue engineering: Influence of pores geometry and architecture on
dynamic mechanical properties’, Biomaterials, 27(7), pp. 974–985. Morse, B. S.
(2000) ‘Thresholding’, in Bringham Young University, pp. 1–5.

225
Mu, Y., Lyddiatt, A. and Pacek, A. W. (2005) ‘Manufacture by water/oil
emulsification of porous agarose beads: Effect of processing conditions on mean
particle size, size distribution and mechanical properties’, Chemical Engineering and
Processing: Process Intensification, 44(10), pp. 1157–1166.
Müller-Späth, T. et al. (2011) ‘Model simulation and experimental verification of a
cation-exchange IgG capture step in batch and continuous chromatography’, Journal
of Chromatography A, 1218, pp. 5195– 5204.
Muller, E., Chung, T. and Zhang, Z. (2005) ‘Characterization of mechanical
properties of polymeric chromatographic particles’, Journal of Chromatography A,
1097, pp. 116–123.
Nireesha, G. R. et al. (2013) ‘Lyophilization / Freeze Drying - An Review’, IJNTPS,
3(4), pp. 87–98.
Nordestgaard, B. and Rostgaard, J. (1985) ‘Critical-point drying versus freeze drying
for scanning electron microscopy: a quantitative and qualitative study on isolated
hepatocytes’, Journal of Microscopy, 137(October 1984), pp. 189–207.
Nursam, N. M. et al. (2016) ‘Probing the Effects of Templating on the UV and
Visible Light Photocatalytic Activity of Porous Nitrogen-Modified Titania
Monoliths for Dye Removal’, ACS Applied Materials and Interfaces, 8(27), pp.
17194–17204.
Nweke, M. C. et al. (2016) ‘Drying techniques for the visualisation of agarose-based
chromatography media by scanning electron microscopy’, Biotechnology Journal,
(12), p. 1600583.
Pandithage, R. (2012) Brief Introduction to Critical Point Drying. Available at:
http://www.leica-microsystems.com/science-lab/brief-introduction-to-critical-point-
drying/.
Pathak, M. et al. (2017) ‘Fluorescence based real time monitoring of fouling in
process chromatography.’, Scientific reports. Nature Publishing Group, 7(October
2016), p. 45640.
Pathak, M. and Rathore, A. S. (2016) ‘Mechanistic understanding of fouling of
protein A chromatography resin’, Journal of Chromatography A. Elsevier B.V.,
1459, pp. 78–88.
Pernodet, N., Maaloum, M. and Tinland, B. (1997) ‘Pore size of agarose gels by
atomic force microscopy’, Electrophoresis, 18, pp. 55–58.
Pluen, A. et al. (1999) ‘Diffusion of macromolecules into agarose gels: Comparison

226
of linear vs. globular configurations’, Biophysical Journal, 77, pp. 542 – 552.
Polak, R. and Pitombo, R. (2011) ‘Care during freeze-drying of bovine pericardium
tissue to be used as a biomaterial: A comparative study’, Cryobiology, 63(2), pp. 61–
66.
Rabe, M., Verdes, D. and Seeger, S. (2011) ‘Understanding protein adsorption
phenomena at solid surfaces’, Advances in Colloid and Interface Science. Elsevier
B.V., 162(1–2), pp. 87–106.
Rathore, A. et al. (2015) ‘Re-use of Protein A Resin: Fouling and Economics’,
BioPharm International, 28(3).
Rathore, A. S. (2009) ‘Roadmap for implementation of quality by design (QbD) for
biotechnology products’, Trends in Biotechnology, 27(9).
Rathore, A. S. and Kapoor, G. (2016) ‘Implementation of Quality by Design for
processing of food products and biotherapeutics’, Food and Bioproducts Processing.
Institution of Chemical Engineers, 99, pp. 231–243.
Rathore, A. S. and Kumar, V. (2017) ‘Mechanistic modeling of preparative ion-
exchange chromatography’, BioPharm International, 30(4).
Reville, W. and Cotter, M. (1991) ‘An evaluation of the usefulness of air-drying
biological samples from tetramethylsilane in preparation for scanning electron
microscopy’, J Electron Microsc, 40(3), pp. 198–202.
Saito, M., Kurosawa, Y. and Okuyama, T. (2013) ‘Scanning electron microscopy-
based approach to understand the mechanism underlying the adhesion of dengue
viruses on ceramic hydroxyapatite columns.’, PloS one, 8(1), p. e53893.
Scharl, T. et al. (2016) ‘Trend analysis of performance parameters of pre-packed
columns for protein chromatography over a time span of ten years’, Journal of
Chromatography A, 1465, pp. 63–70.
Schneider, C. A., Rasband, W. S. and Eliceiri, K. W. (2012) ‘NIH Image to ImageJ:
25 years of image analysis’, Nature Methods. Nature Publishing Group, 9(7), pp.
671–675.
Schwartzbach, H. (2010) ‘The possibilities and challenges of spray drying’, Pharm.
Technol. Europe.
Seltman, H. (2007) Experimental design and analysis. Available at:
http://www.stat.cmu.edu/~hseltman/309/Book/chapter7.pdf.
Sepsey, A., Bacskay, I. and Felinger, A. (2014) ‘Molecular theory of size exclusion
chromatography for wide pore size distributions’, Journal of Chromatography A,

227
1331, pp. 52–60.
Siu, S. and Boushaba, R. (2006) ‘Visualising fouling of a chromatographic matrix
using confocal scanning laser microscopy’, Biotechnology and …. doi: 10.1002/bit.
Siu, S. C. et al. (2006) ‘Effect of fouling on the capacity and breakthrough
characteristics of a packed bed ion exchange chromatography column.’, Bioprocess
and biosystems engineering, 28(6), pp. 405–14.
Siu, S. C. et al. (2007) ‘Confocal imaging of chromatographic fouling under flow
conditions’, Journal of Chemical Technology & Biotechnology, 82, pp. 871–881.
Sofer, G. and Yourkin, J. (2007) ‘Cleaning and Cleaning Validation in Process
Chromatography’, Bioprocess international, (November), pp. 72–82.
Srinorakutara, T. (1997) Mechanical Strength of Yeasts. University of Birmingham,
UK.
Stenekes, R. et al. (2000) ‘Pore sizes in hydrated dextran microspheres’,
Biomacromolecules, 1, pp. 696–703.
Stickel, J. J. and Fotopoulos, A. (2001) ‘Pressure-flow relationships for packed beds
of compressible chromatography media at laboratory and production scale’,
Biotechnology Progress, 17(4), pp. 744–751.
Sun, Y. and Yang, K. (2008) ‘Analysis of mass transport models based on Maxwell–
Stefan theory and Fick’s law for protein uptake to porous anion exchanger’,
Separation and Purification Technology, 60, pp. 180–189.
Susanto, A. et al. (2006) ‘Developing a chromatographic column model for bovine
serum albumin on strong anion-exchanger Source30Q using data from confocal laser
scanning microscopy.’, Journal of chromatography. A, 1137(1), pp. 63–75.
Swapp, S. (2015) Scanning Electron Microscopy. Available at:
http://serc.carleton.edu/research_education/geochemsheets/techniques/SEM.html
Tarmann, C. and Jungbauer, A. (2008) ‘Adsorption of plasmid DNA on anion
exchange chromatography media’, Journal of Separation Science, 31(14), pp. 2605–
2618.
Tengliden, H. (2008) Development of cleaning-in-place procedures for protein A
chromatography resins using design of experiments and high throughput screening
technologies. Linkoping University.
Thillaivinayagalingam, P. et al. (2007) ‘Detection and quantification of affinity
ligand leaching and specific antibody fragment concentration within
chromatographic fractions using surface plasmon resonance’, Biotechnology and
228
Applied Biochemistry, 48(4), p. 179.
Tran, R. et al. (2007) ‘A framework for the prediction of scale-up when using
compressible chromatographic packings.’, Biotechnology progress, 23(2), pp. 413–
22.
Tran, R. (2011) Evaluation of Challenges to the Ubiquitous Nature of
Chromatography, UCL Doctoral Thesis. University College London.
Tsinontides, S. C. et al. (2004) ‘Freeze drying--principles and practice for successful
scale-up to manufacturing.’, International journal of pharmaceutics, 280(1–2), pp.
1–16.
Tugcu, N., Roush, D. and Goklen, K. (2007) ‘Maximizing productivity of
chromatography steps for purification of monoclonal antibodies’, Biotechnology and
bioengineering, 99(3), pp. 599–613.
Waki, S., Harvey, J. and Bellamy, A. (1982) ‘Study of agarose gels by electron
microscopy of freeze-fractured surfaces’, Biopolymers, 21(9), pp. 1909–1926.
Wang, C., Wang, L. and Thomas, C. (2003) ‘Modelling the mechanical properties of
single suspension – cultured tomato cells’, Annals of Botany, 93, pp. 443–453.
Warner, T. and Nochumson, S. (2003) ‘Rethinking the Economics of Pensions’,
BioPharm International, 22(3), pp. 15–39.
Williams, J. R. and Clifford, A. A. (2000) Supercritical Fluid Methods and
Protocols. Methods in Biotechnology.
Wilson, S. M. and Bacic, A. (2012) ‘Preparation of plant cells for transmission
electron microscopy to optimize immunogold labeling of carbohydrate and protein
epitopes’, Nature Protocols, 7(9), pp. 1716–1727.
Yan, Y. et al. (2009) ‘Mechanical characterization of agarose micro-particles with a
narrow size distribution’, Powder Technology. Elsevier B.V., 192(1), pp. 122–130.
Yang, K., Shi, Q.-H. and Sun, Y. (2006) ‘Modeling and simulation of protein uptake
in cation exchanger visualized by confocal laser scanning microscopy.’, Journal of
chromatography. A, 1136(1), pp. 19–28.
Yao, Y. and Lenhoff, A. (2004) ‘Determination of pore size distributions of porous
chromatographic adsorbents by inverse size-exclusion chromatography’, Journal of
Chromatography A, 1037(28), pp. 273–282.
Zeitvogel, F. et al. (2016) ‘Comparison of Preparation Methods of Bacterial Cell-
Mineral Aggregates for SEM Imaging and Analysis Using the Model System of
Acidovorax sp. BoFeN1’, Geomicrobiology Journal. Taylor & Francis, 34(4), pp. 1–

229
11.
Zhang, S., Daniels, W., et al. (2015) ‘Nature of foulants and fouling mechanism in
the Protein A MabSelect resin cycled in a monoclonal antibody purification
process.’, Biotechnology and bioengineering, pp. 1–28.
Zhang, S., Xu, K., et al. (2015) ‘Structural and functional characteristics of virgin
and fouled Protein A MabSelect resin cycled in a monoclonal antibody purification
process.’, Biotechnology and bioengineering, pp. 1–29.
Zhang, Z. et al. (1991) ‘A novel micromanipulation technique for measuring the
bursting strength of single mammalian cells’, Applied Microbiology and
Biotechnology, 36, pp. 208–210.
Zhou, Q.-Z. et al. (2007) ‘Preparation of uniform-sized agarose beads by
microporous membrane emulsification technique’, Journal of Colloid and Interface
Science, 311(1), pp. 118–127.
Zhou, Q.-Z. et al. (2008) ‘Multi-stage premix membrane emulsification for
preparation of agarose microbeads with uniform size’, Journal of Membrane
Science, 322(1), pp. 98–104.
Zhou, Q.-Z., Ma, G.-H. and Su, Z.-G. (2009) ‘Effect of membrane parameters on the
size and uniformity in preparing agarose beads by premix membrane emulsification’,
Journal of Membrane Science, 326(2), pp. 694–700.

230
APPENDIX
Figure 57 – SEM micrographs of fresh Capto Adhere post- critical point drying used
for quantitative analysis
X50,000 400 nm
X75,000
X40,000
400 nm
400 nm

231
Figure 58 – SEM micrographs of fresh Capto Q post- critical point drying
used for quantitative analysis
X40,000
X40,000
X40,000
400 nm
400 nm
400 nm

232
Figure 59– SEM micrographs of fresh MabSelect post- critical point drying
used for quantitative analysis
X40,000
X55,000
X55,000
400 nm
400 nm
400 nm

233
Figure 60 – SEM micrographs of fresh MabSelect Xtra post- critical point drying
used for quantitative analysis
X40,000
X40,000
X40,000
400 nm
400 nm
400 nm

234
Figure 61 – SEM micrographs of fresh Q-Sepharose High Performance
post- critical point drying used for quantitative analysis
X33,000
X50,000
X40,000 400 nm
400 nm
400 nm

235
Figure 62 – SEM micrographs of fresh Sepharose 4 Fast Flow post-
critical point drying used for quantitative analysis
X37,000
X40,000
X40,000
400 nm
400 nm
400 nm

236
Figure 63 – SEM micrographs of fresh Sepharose 6 Fast Flow
post- critical point drying used for quantitative analysis
X40,000
X40,000
X40,000
400 nm
400 nm
400 nm

237
Figure 64 – SEM micrographs of fresh Sepharose CL-4B post- critical
point drying used for quantitative analysis
X40,000
X40,000
X40,000
400 nm
400 nm
400 nm
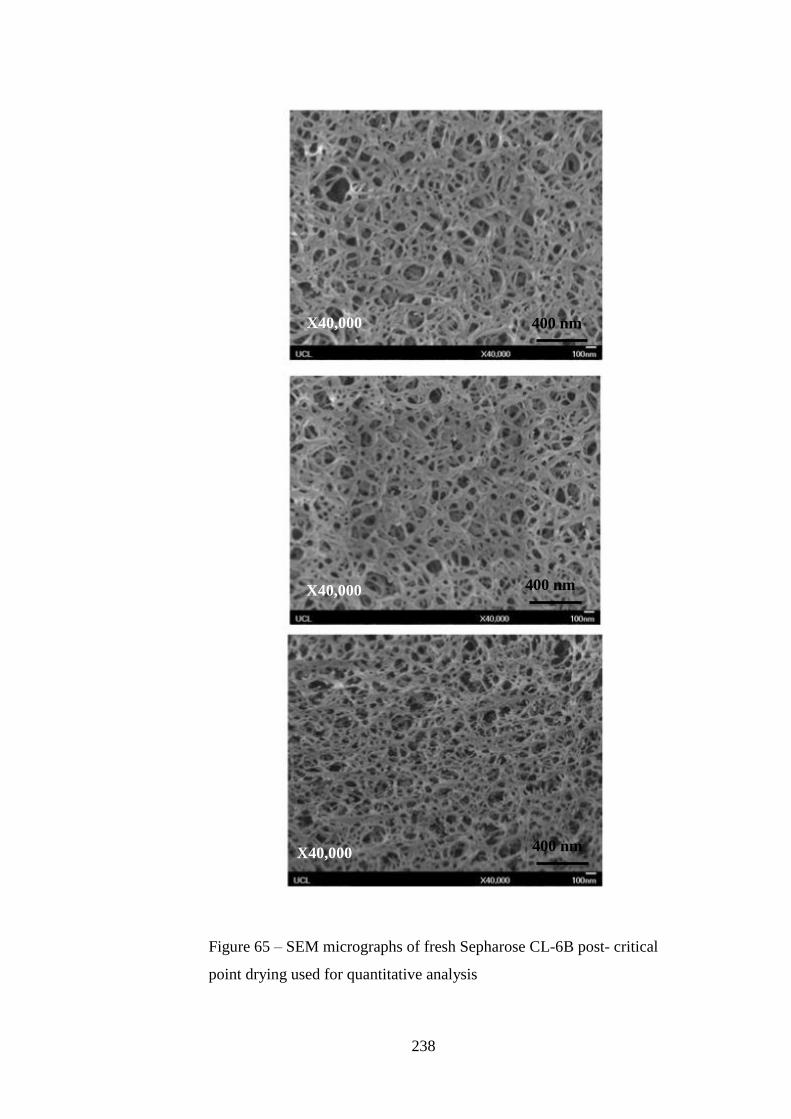
238
Figure 65 – SEM micrographs of fresh Sepharose CL-6B post- critical
point drying used for quantitative analysis
X40,000
X40,000
X40,000
400 nm
400 nm
400 nm

239
Figure 66 – SEM micrographs of CIP-exposed Capto Adhere used for
quantitative analysis
X40,000
X40,000
X40,000
400 nm
400 nm
400 nm
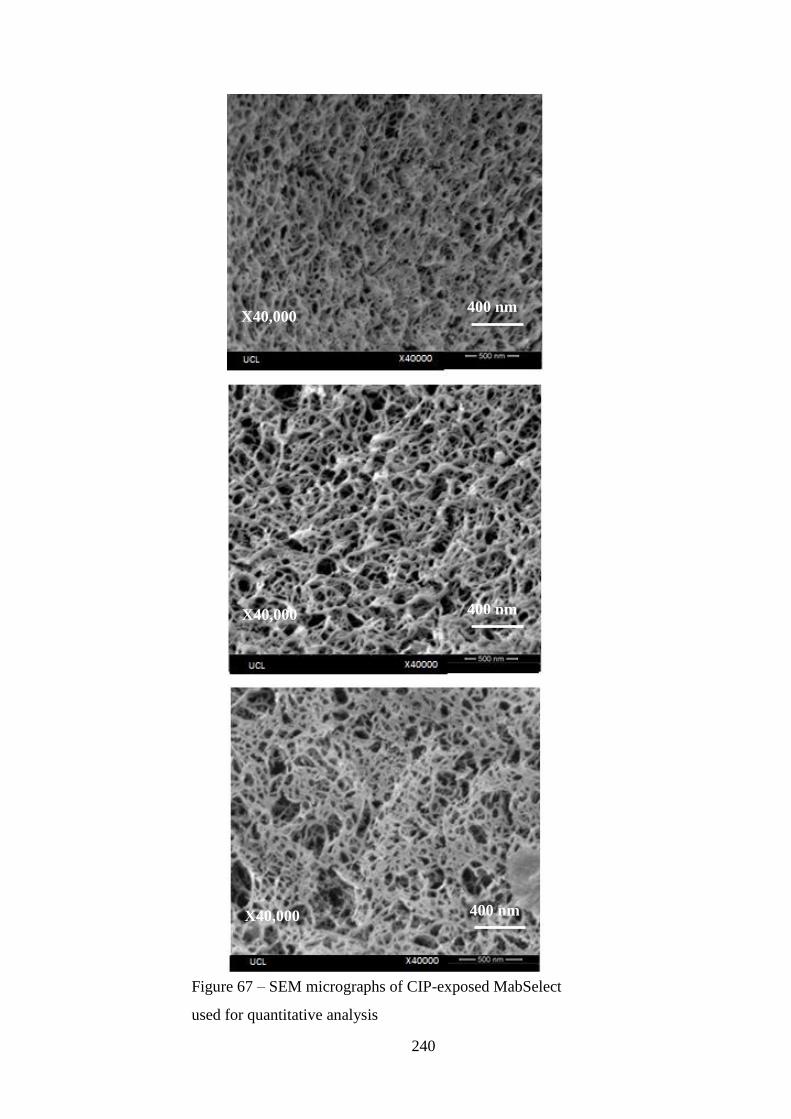
240
Figure 67 – SEM micrographs of CIP-exposed MabSelect
used for quantitative analysis
X40,000
X40,000
X40,000
400 nm
400 nm
400 nm
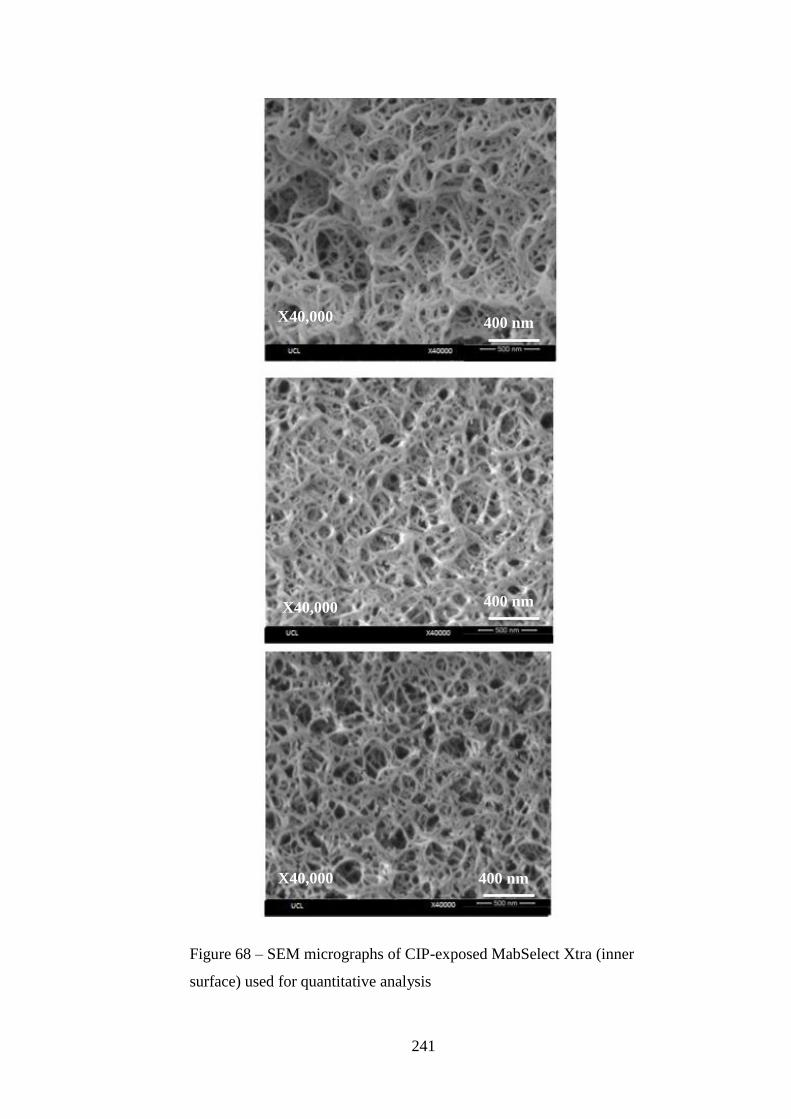
241
Figure 68 – SEM micrographs of CIP-exposed MabSelect Xtra (inner
surface) used for quantitative analysis
X40,000
X40,000
X40,000
400 nm
400 nm
400 nm

242
Figure 69 – SEM micrographs of CIP-exposed MabSelect Xtra
(outer surface) used for quantitative analysis
X40,000
X40,000
X40,000
400 nm
400 nm
400 nm

243
Figure 70 – SEM micrographs of CIP-exposed Q-Sepharose High
Performance used for quantitative analysis
X40,000
X40,000
X40,000
400 nm
400 nm
400 nm

244
Figure 71 – SEM micrographs of aged Capto Adhere
used for quantitative analysis
X40,000
X40,000
X40,000
400 nm
400 nm
400 nm

245
Figure 72 – SEM micrographs of aged MabSelect used for
quantitative analysis
X40,000
X40,000
X40,000
400 nm
400 nm
400 nm

246
Figure 73 – SEM micrographs of aged MabSelect Xtra used for
quantitative analysis
X40,000
X40,000
X40,000
400 nm
400 nm
400 nm
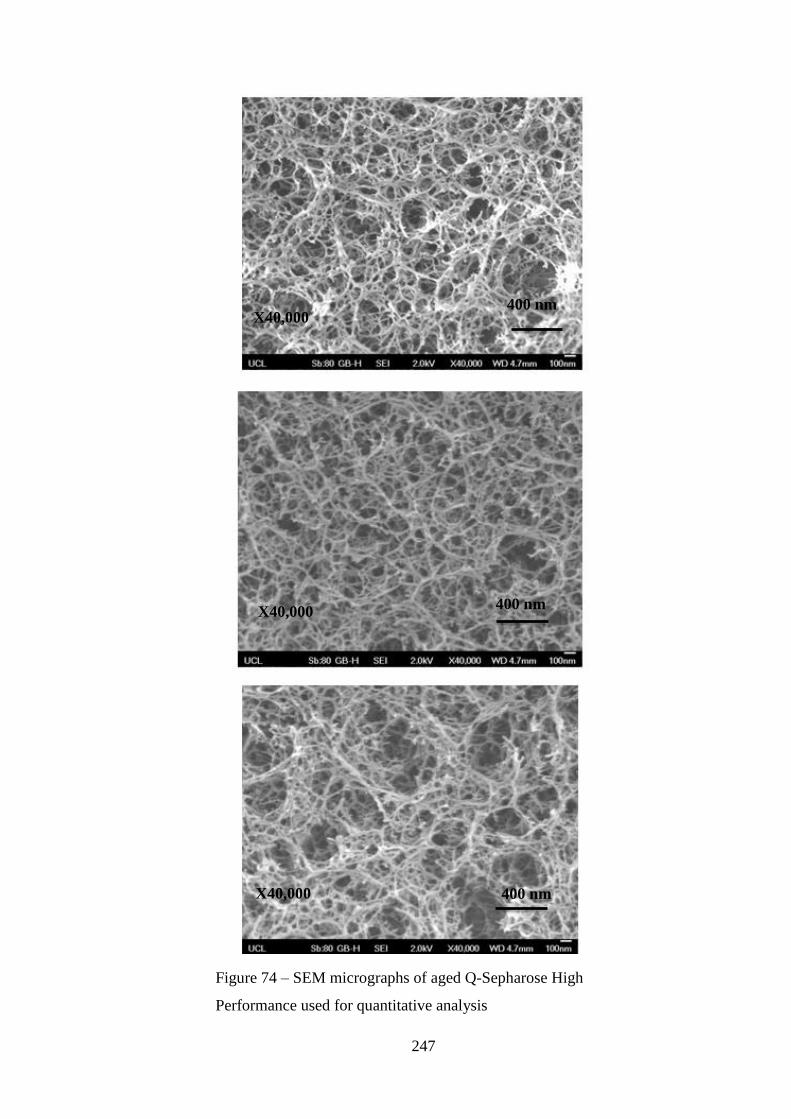
247
Figure 74 – SEM micrographs of aged Q-Sepharose High
Performance used for quantitative analysis
X40,000 400 nm
X40,000
X40,000
400 nm
400 nm

248
Figure 75 – Slurry resistance vs critical velocity for MS (red), MSX
(blue) and QHP (green). The squares represent fresh resin data and the
circles represent aged resin data