Chromatographic analysis of inks for forensic science applications
14
FORENSIC SCIENCE REVIEW VOWME TIIKEE • NUMIIER.lWO • DEC. l'Wl Contents Chromatographic Analysis of Inks for Forensic Science Applications....................................... 71 I. R. Tebbett De{Jartment of Pharmacodynamics Untversity of Ullinois at Chicago Chicago, Illinois Unitea States of America Detection of Fingerprints on Skin ...................................•....................•....................•...••...•.........•....• 83 D. S. Allman and C. A. Pounds Forensic Science Service Central Research and Support Establishment Aldermaston, Reading, Berkshire United Kingdom Forensic Analysis of Lubricants ................................................................................•.•............•....•..•.. 91 R. Hirz Department of Forensic Science Federal Ministry of Inner Affairs Vienna Austria Sample Differentiation: Cocaine Example..................................................................................... 101 L. D. Baugh Roche Biomedical Laboratories Birmingham, Alabama United States of America R. H. Liu Graduate Program in Forensic Science De{Jartment oi Criminal Justice University of Alabama at Birmingham Birmingham, Alabama United-states of America Solid Phase Extraction of Abused Drugs from Urine ................................................................... 117 G .. E. Platoff, Jr. and J. A. Gere U.S. Army Forensic Toxicology Drug Testing Laboratory Ft. Meade, Maryland United States of America U.S. Army Medical Materiel Development Activity Ft. Detrick, Maryland United States of America
description
This article reviews the use of chromatography for the separation and comparison of ink components. Thin layer chromatography (TLC) is the standard chromatographic procedure presently employed for the comparison of inks. Thin layer chromatography systems are described for the separation of different types of ink. The greater sensitivity and resolution offered by high performance liquid chromatography (HPLC) make it an attractive alternative to TLC for ink analysis, and recent work in this field is also outlined.
Transcript of Chromatographic analysis of inks for forensic science applications

FORENSIC SCIENCE REVIEW VOWME TIIKEE • NUMIIER.lWO • DEC. l'Wl
Contents
Chromatographic Analysis of Inks for Forensic Science Applications....................................... 71
I. R. Tebbett De{Jartment of Pharmacodynamics Untversity of Ullinois at Chicago Chicago, Illinois Unitea States of America
Detection of Fingerprints on Skin ...................................•....................•....................•...••...•.........•....• 83
D. S. Allman and C. A. Pounds Forensic Science Service Central Research and Support Establishment Aldermaston, Reading, Berkshire United Kingdom
Forensic Analysis of Lubricants ................................................................................•.•............•....•..•.. 91
R. Hirz Department of Forensic Science Federal Ministry of Inner Affairs Vienna Austria
Sample Differentiation: Cocaine Example..................................................................................... 101
L. D. Baugh Roche Biomedical Laboratories Birmingham, Alabama United States of America
R. H. Liu Graduate Program in Forensic Science De{Jartment oi Criminal Justice University of Alabama at Birmingham Birmingham, Alabama United-states of America
Solid Phase Extraction of Abused Drugs from Urine ................................................................... 117
G .. E. Platoff, Jr. and J. A. Gere U.S. Army Forensic Toxicology Drug Testing Laboratory Ft. Meade, Maryland United States of America
U.S. Army Medical Materiel Development Activity Ft. Detrick, Maryland United States of America
Chromatographic Analysis of Inks for Forensic Science Applications
I. R. Tebbett Department of Pharmacodynamics University of Illinois at Chicago
Chicago, IL 60680 U.S.
TABLE OF CONTENTS
I. INTRODUCTION ................... ......... ...... ............................. ........ ......... ..... ..... 72
II. PAPER CHROMATOGRAPHY AND ELECTROPHORESIS .................... 72
III. THIN LAYER CHROMATOGRAPHY .. .. .. ............. .... .................. .. .. ....... .... 72
IV. HIGHPERFORMANCETHINLAYERCHROMATOGRAPHY ............... 73
V. HIGH PERFORMANCE LIQUID CHROMATOGRAPHY (HPLC) ........... 74
A. Ball-Point Pen Inks................................................................................... 74
B. Nonball-Point Pen Inks ............................................................................ 74
C. Detectors................................................................................................... 75
D. EvaluationofHPLC Systems ................................................................... 75
VI. DATING OF INKS......................................................................................... 78
A. Date of Initial Production......................................................................... 78
B. Agingofinks ............................................................................................ 78
C. Accelerated Aging of inks .. .. .. .. . . .. . . . . . .. .. .. .. . . . . . .. . . . . . .. . . . . . . . . . .. . . . . .. . . . . . .. . . .. . . . .. 80
VII. CONCLUSION AND FUTURE TRENDS.................................................... 80
REFERENCES .... .. .. .. ... .. .. .. .. .. .. . .. .. .. ..... .. .. .. .. .. ... .. .. .. .. ... .... .. .. .. . .. .. .. .. .. .. . .. .. .. .. .. 81
ABOUT THE AUTHOR ................................................................................ 82
1042-7201/03-02-91/71-82/$6.00 • Copyright© 1991 Central Police University Press
Chromatographic Analysis of Inks for Forensic Science Applications
REFERENCE: Tebbett IR: Chromatographic analysis of inks for forensic science applications; Forensic Sci Rev 3:71; 1991.
ABSTRACT: This article reviews the use of chromatography for the separation and comparison of ink components. Thin layer chromatography (TLC) is the standard chromatographic procedure presently employed for the comparison of inks. Thin layer chromatography systems are described for the separation of different types of ink. The greater sensitivity and resolution offered by high performance liquid chromatography (HPLC) make it an attractive alternative to TLC for ink analysis, and recent work in this field is also outlined. Both techniques have been used for the measurement of changes occurring in the composition of inks with time, as a means of determining the age of an ink. Related analytical techniques, recent research, and future trends in ink analysis are also described.
KEY WORDS: Chromatography, HPLC, ink analysis, questioned documents, TLC.
I. INTRODUCTION
The introduction of chromatographic methods for the comparison of writing inks has had a major impact on the detection of fraudulent documents. Subtle alterations to documents such as tax returns, wills, insurance claims, and divorce settlements, can have significant financial implications. The detection of alterations or additions to a document and an assessment of when the document was written has therefore become a prime concern of document examiners and ink chemists. The comparison of two inks involves both chemical and physical examinations [4,6,21,35], making use of optical microscopy, infrared (IR) reflectance and luminescence [41], ultraviolet (UV) fluorescence, solubility tests [13], and thin layer chromatography (TLC). Thin layer chromatography is the most successful method presently used for the separation and subsequent comparison of ink components, being rapid and relatively simple to use [29]. Thin layer chromatography has succeeded paper chromatography as a means of ink comparison, and high perfonnance liquid chromatography (HPLC) promises to offer even greater capabilities in the analysis of inks. In addition, several chromatographic and spectroscopic techniques are presently being evaluated for their application to ink examination.
The introduction of chromatographic methods for ink comparisons has been slow, due largely to the reluctance of the courts to accept "destructive" techniques. Before 1950, inks on questioned documents were primarily examined by photography, using filters to enhance differences between different inks. The document was additionallyexamined underUV, visible,andiRlight. Chemical tests were also used to detect metals such as copper, vanadium, and chromium. Over the past few years,
however, associated with the improved sensitivity of various TLC techniques, the removal of small amounts of ink from a document, for analytical purposes, has become accepted practice.
II. PAPER CHROMATOGRAPHY AND ELECTROPHORESIS
The early work concerning the chromatography of inks involved the use of paper chromatography, which demonstrated that only micro amounts of ink were necessary for analysis and that destruction of the document was minimal [42].
A logical progression from paper chromatography was the use of paper electrophoresis. Brown and Kirk [3] showed that electrophoresis could be employed for the separation of ball-point pen inks. They compared electrophoresis with paper chromatography, and showed that electrophoresis could separate those compounds not separated by paper chromatography. In the wake of this research were reported numerous studies comparing paper chromatography and electrophoresis and those describing solvent systems for the development of paper chromatograms [38].
III. THIN LAYER CHROMATOGRAPHY
Thin layer chromatography was introduced in the early 1960s and the improved resolution over paper chromatography offered by this technique was quickly applied to ink analysis. In 1960, Thol [48] showed thatTLCcould be used effectively to separate dyes and other components of writing inks. With the introduction of techniques pennitting the separation of the dye components of writ-
Forensic Science Review • Volume Three Number Two • December 1991
ing inks, attempts were made to characterize different inks based on their dye composition. MacDonnell [34] used a combination of porous glass chromatography and electrophoresis for this purpose, concentrating on a series of fountain pen inks. The fmal separations took place in an 'optically transparent medium that allowed direct spectral measurement of the separated components. In a similar vein, Crown et al. [13] studied blue ball-point inks and showed that they could be divided into several distinct categories.
Nakamura and Shimoda [39] used "homemade" micro-TLC plates prepared from microscope slides for the comparison of ball-point pen inks. They found a solvent system consisting of n-butanol/ethanol/water (50:10:15) was effective for the majority ofball-pointpeninks. Since then, several TLC systems have been described for ink analyses [50], including the use of UV fluorescence [18] and IR luminescence [2,27] as a means to enhance the visualization of the chromatographic spots. TLC also has applications in the examination of inks used in typewriter ribbon ink [5].
As with most other areas of forensic science, several attempts have been made to standardize procedures used for the examination of inks. In particular, systematic approaches to ink comparison and identification have been described.by Brunelle and Pro [4]. Their proposed methods can be summarized as follows: About 1 to 10 plugs of ink are removed from the document with the blunted end of a hypodermic syringe (0.5 mm). Approximately 40 to 60 ng of dried ink are found per plug. The ink is dissolved in a minimum amount of suitable solvent as determined by solubility tests. The dissolved ink is then spotted on an Eastman Kodak (Rochester, NY) precoated silica gel1LC plate using a 5-J.LL micropipette. The plate is developed in a solvent system consisting of ethyl acetate/ethanol/distilled water (70:35:30) for 30 min. The plate is then allowed to dry and viewed under normal day and UV light.
73
After this initial chromatographic examination, the ink under investigation is compared with inks having similar chromatographic patterns by TLC on Merck silica gel glass plates using two solvent systems: ethyl acetate/ ethanol/water (70:35:30) and n-butanol/ethanol/water (50: 10:30).
In addition to the method outlined above, Kelly and Cantu [25] proposed a second standard method for ink identification. This involved the use ofboth silica gel and cellulose plates. The eluent systems consisted of nbutanol/isopropanol/distilled water (2: I: 1) and n-butanol/ethanol/10% aqueous oxalic acid (50:10:15). The use of reversed phase TLC plates for the examination of inks is an interesting concept discussed by Siouffi and Guiochon. [ 44]. Reversed phase TLC plates allow the separation of highly polar components of the ink which normally stay near the baseline of regular silica 1LC plates.
IV. HIGH PERFORMANCE TLC
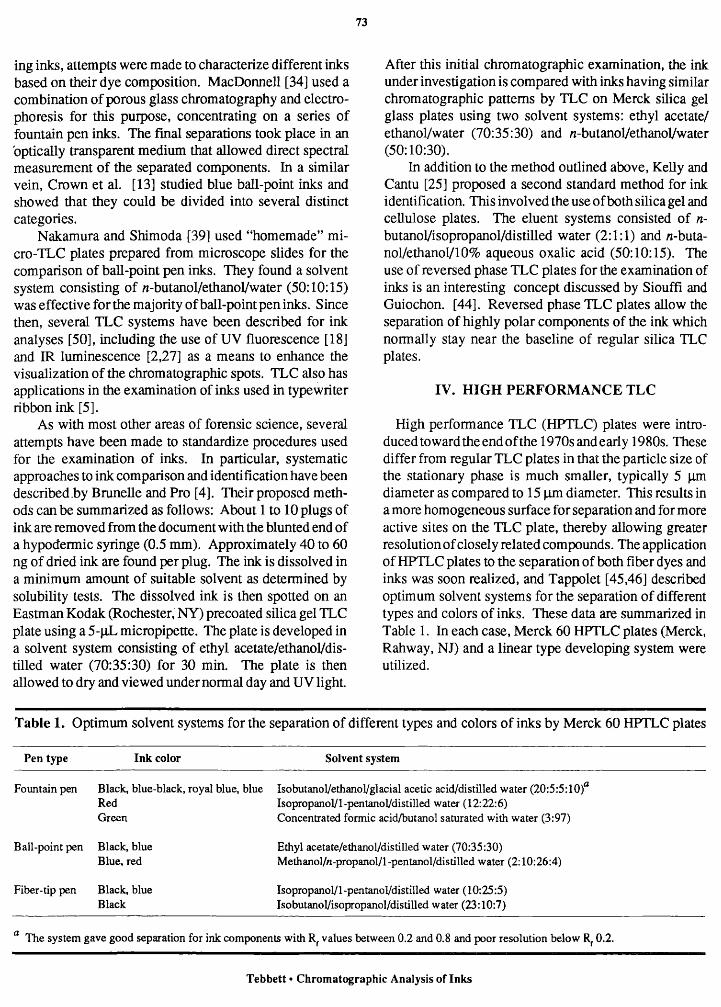
High performance TLC (HPTLC) plates were introducedtowardtheendofthe 1970sandearly 1980s. These differ from regular TLC plates in that the particle size of the stationary phase is much smaller, typically 5 J.Lffi diameter as compared to 15 J.U11 diameter. This results in a more homogeneous surface for separation and for more active sites on the TLC plate, thereby allowing greater resolution of closely related compounds. The application ofHPTLC plates to the separation of both fiber dyes and inks was soon realized, and Tappolet [ 45,46] described optimum solvent systems for the separation of different types and colors of inks. These data are summarized in Table 1. In each case, Merck 60 HPfLC plates (Merck, Rahway, NJ) and a linear type developing system were utilized.
Table 1. Optimum solvent systems for the separation of different types and colors of inks by Merck 60 HPTLC plates
Pen type Ink color Solvent system
Fountain pen Black, blue-black, royal blue, blue Isobutanol/ethanol/glacial acetic acid/distilled water (20:5:5:10)a Red Isopropanol/1-pentanol/distilled water (12:22:6) Green Concentrated formic acid/butanol saturated with water (3:97)
Ball-point pen Black, blue Ethyl acetate/ethanol/distilled water (70:35:30) Blue, red Methanol/n-propanol/1-pentanol/distilled water (2: 10:26:4)
Fiber-tip pen Black, blue Isopropanol/1-pentanol/distilled water (10:25:5) Black Isobutanol/isopropanol/distilled water (23:10:7)
a The system gave good separation for ink components with Rr values between 0.2 and 0.8 and poor resolution below Rr 0.2.
Tebbett • Chromatographic Analysis of Inks

The greater resolution offered by HPfLC plates also resulted in an improvement in the sensitivity of the technique. Tappolet reported that for the spot sizes and measurement requirements he used, roughly 600 ng ofink were required for analysis using HPTLC plates, whereas regularTLC analysis requires the use of microgram quantities. The improved resolution and generally less diffuse spots also make HPTLC more amenable to quantitative analysis using a densitometer.
Most procedures now employed for the co~parison and identification of inks generally involve the use of both low resolution and HPTLC plates. The method employed by the Internal Revenue Service's laboratory (Chicago, IL) for the identification of an ink is typical of these procedures, and is summarized in the following paragraph [24].
Low resolution TLC plates, being relatively inexpensive, may be used for the screening of inks. Those that are chromatographically similar can then be examined in greater detail by the use of HPTLC plates. In cases for which it is necessary to determine the "identity" of an ink, questioned inks are placed side by side on a low resolution TLC plate (Eastman Kodak, Rochester, NY). The plate separates the ink into its most basic components. An ink library, which contains thin layer chromatograms of most available inks, is then searched. Inks in the library are arranged in families, each family having the same ink color and type (ball-point pen or nonball-point pen) and similar dye components. The individual members of a family are compared to the questioned ink using Merck HPTLC plates until a match is found. The use of the ink library not only allows the ink to be "identified" (within those in the library), it also gives information as to the initial date of manufacture of the ink. This allows a statement to be made as to whether the questioned ink was available at the time the document was supposedly prepared. This library approach to the dating of inks is discussed later (Section VI).
V. HIGH PERFORMANCE LIQIDD CHROMATOGRAPHY
Thin layer chromatography has been used for over 30 years for the comparison and dating of inks. It does, however, lack the sensitivity and resolving power of some of the more sophisticated analytical techniques. High performance liquid chromatography has the potential to give greater separation of dyestuffs than TLC, with an increase in the sensitivity of detection. It therefore follows that liquid chromatography should be applied to the analysis of inks.
74
A. Ball-Point Pen Inks
The majority of work in the area ofHPLC of inks has been limited to the examination of ball-point pen inks. Early investigations were carried out by Colwell and Karger [ 12], who attempted to separate ball-point pen inks using a normal phase silica column with an eluent consisting of methanol/form amide (98:2) and with detection at both 254 and 580 nm~ In this study, ratios were made between peak heights at both wavelengths. The assumption was that inks having similar dye composition (i.e., having similar chromatograms at 580 nm) may differ in their resin content and show differences in the chromatograms at 254 nm. In fact, the dyes themselves also show some absorbance at 254 nm, which may interfere with these calculations. Nonetheless, 25 different ball-point pen inks could be distinguished by this method.
Another normal phase chromatographic system, developed by Colwell and Karger, utilized a silica column and a mobile phase ofheptane/isopropanol (98:2) and UV detection at 254 nm. This system gave information about the vehicle components of the inks but was not suitable for the analysis of the dyes.
The use of reversed phase HPLC for ink analysis was first described by Lyter [32]. Using a C-18 coliunn and a mobile phase of acetonitrile/water (80:20) together with 0.005 M heptane sulfonic acid and 0.02% acetic acid to suppress ionization of the dyes, severalball-pointpen inks could be separated using absorbance detection at 580 run. The inks were extracted from the paper with 40 J.1L of mobile phase and injected directly onto the HPLC column. Subsequent work by Lyter [33] was able to distinguish ten ball-point pen inks that were difficult to differentiate by TLC. A reversed phase column was used for the separation and the eluent was monitored at both 254 and 546 run. The resins could not be detected, however, and the sensitivity was poor, requiring the use of about 1 em of an inked line for each analysis. High perfonnance liquid chromatography has also been shown to be applicable to the comparison of inks used in counterfeit currency [26].
B. Nonball-point pen Inks
Very little work has been done on HPLC analysis for nonball-point pen inks, since the majority of questioned document cases have, until recently, involved ball-point pen inks. With the development of the "rolling ball" pen, however, interest in nonball-point pen inks has increased.
As with ball-point pen ink, nonball-point pen inks contain two fractions, colored and noncolored. The colored fraction consists of many different types of acidic and basic dyes adapted from the textile industry. Lyter [32]
Forensic Science Review • Volume Three Number Two • December 1991
suggested that the HPLC analysis for nonball-point pen inks should be directed solely at the dye fraction of the ink, since the solvents present are unlikely to persist on the paper once the ink is dry. Nonnal phase conditions for the examination of nonball-point pen inks have been suggested by Colwell and Karger [12] using a silica column and a mobile phase of dichloroethane/ethanol/fonnamide (89: 10:1). Only a limited number of inks were analyzed, and at this time no chromatographic conditions have been adequately examined as to allow the routine examination of nonball-point pen inks by HPLC.
C. Detectors
Two significant problems are associated with the use of HPLC analysis for inks: the lack of sensitivity, necessitating the use of about 1 em of an inked line, and the fact that when a single wavelength is monitored it is necessary to replicate analyses at different wavelengths in order to adequately detect the different dye components. Multiwavelength detectors of the diode array type are capable of rapidly scanning through the UV and visible spectrum (180 to 800 run) many times per second. The full spectral map of a sample can be stored in a single run and easily retrieved. In combination with HPLC, this detector can produce a full spectral analysis of each eluting peak. The chromatogram in this case appears in three dimensions representing absorbance time and wavelength. The advantages of this type of detector are numerous: the UV spectra of each component in the mixture can be obtained and compared to the spectra of standard dyes, etc., as an aid to identification; the instrument provides immediate qualitative assessment of peak homogeneity and rapid distinction of spectral differences and similarities. In other words, chromatograms of mixtures that seem identical using a fixed wavelength detector may display subtle differences when the complete UV /visible spectrum is examined. This type of detector gives far more infonnation about the ink components than a fixed wavelength detector [14 ].
Multi wavelength detectors also have the advantage of allowing the differentiation of compounds based on their absorbance ratios [50]. The absorbance of a particular compound at a number of different wavelengths has important implications in the identification of that compound. This concept has been illustrated in work involved in the analysis of ink and fiber dyes by HPLC with diode array detection. One wavelength was chosen as the reference wavelength and absorbance ratios were determined for each component of the chromatogram. For example, if 450 run is chosen as the reference, then the calculated absorbance ratios will be A450/ A400, A450/
75
A350, A450/ A250, etc. A great deal of numerical data is thus generated about each solute. Under specified conditions, for example, solvent and pH, the absorbance spectrum of a solute and, hence, absorbance ratios should remain constant. Since the absorbance ratios describe the spectral characteristics of the solute, these can be used in conjunction with retention time data to conclusively identify that compound. Thistechniquehasbeenappliedtothe examination of ball-point pen inks. While only ten inks were compared in this study, only 1 to 5 mm of ink removed from an ink line was necessary for the analysis. Although TLC could not differentiate some of the inks, and the HPLC chromatograms monitored at 590 nm were almost identical, the absorbance ratio values using multiwavelength detection proved conclusively that the inks did not contain the same components. Chromatographic separation in this case was achieved using a reversed phase column with an eluent of acetonitrile/tetrahydrofuran/water (924:432:644). Ionization was suppressed by the addition of citric acid and hexane sulfonic acid and the pH was adjusted to 4.0 with ammonium hydroxide. This system was reported to give a good separation of neutral and basic dyes present in the ball-point pen inks [50]. Acidic dyes were not separated using this system. Inks were eluted from the paper with the eluent described above and injected directly onto the HPLC column.
The use ofHPLC with a multi wavelength detector for the examination of inks was recently described [47]. This study concentrated on a family of 113 blue nonball-point pen inks, mostofwhich could not be readily differentiated by TLC. Samples of 113 different nonball-point pen inks in the fonn of 1 x 0.5 ern pieces of paper soaked in the ink were obtained from the ink library maintained by the forensic laboratory of the U.S. Internal Revenue Service. This family of inks was subdivided into 17 subgroups based on preliminary TLC examination. Subsequent TLC examination of this family of inks with both regular TLC plates (Eastman Kodak) and HPTLC plates could not readily differentiate the majority of the samples. HPLC was therefore employed in an attempt to further separate the inks. The procedure and results are further detailed in Section V.D.
D. Evaluation of High Performance Liquid Chromatography Systems
Ink samples for HPLC analysis can be removed from the document in the same way as was described for TLC comparison. In the study of nonball-point pen inks (see above), microplugs of the ink were removed from the paper using a hallow syringe needle, and placed in a tapered tube with 50 JlL of mobile phase HPLC. The
Tebbett • Chromatographic Analysis of Inks

76
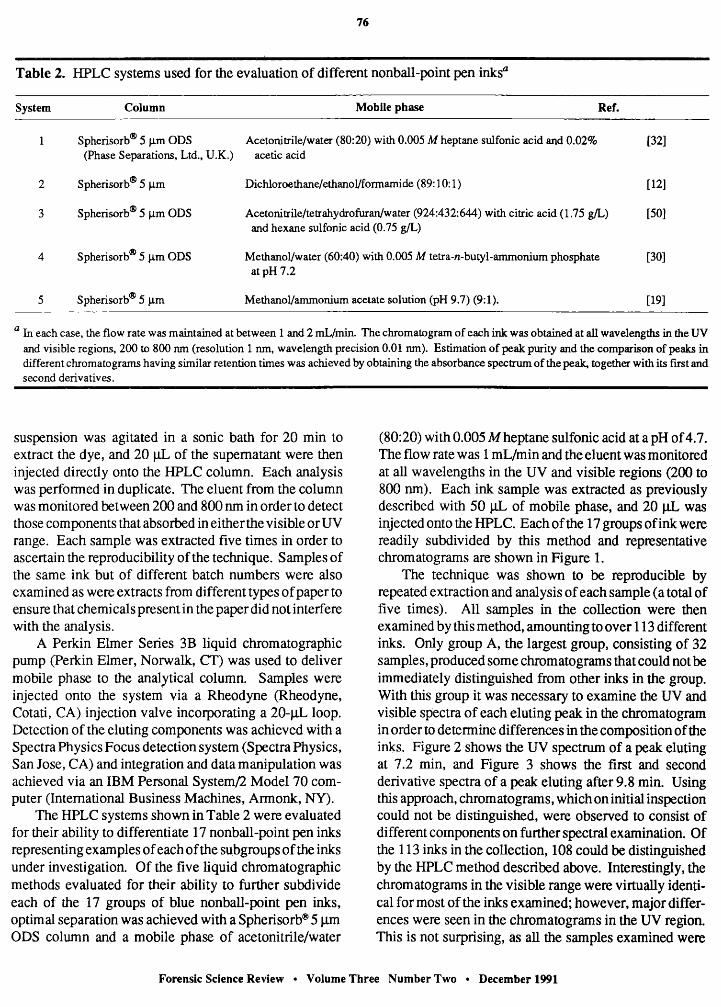
Table 2. HPLC systems used for the evaluation of different nonball-point pen inksa
System Column Mobile phase Ref.
Spherisorb® 5 J.Lm ODS Acetonitrile/water (80:20) with 0.005 M heptane sulfonic acid and 0.02% [32] (Phase Separations, Ltd., U.K.) acetic acid
2 Spherisorb® 5 J.Lm Dichloroethane/ethanoVformamide (89: 10: 1) [12]
[50] 3 Spherisorb® 5 J.Lm ODS Acetonitrile/tetrahydrofuran/water (924:432:644) with citric acid (1.75 g/L) and hexane sulfonic acid (0. 75 giL)
4 Spherisorb® 5 J.Lm ODS Methanol/water (60:40) with 0.005 M tetra-n-butyl-ammonium phosphate at pH 7.2
[30]
5 Spherisorb® 5 J.Lm Methanol/ammonium acetate solution (pH 9.7) (9:1). [19]
a In each case, the flow rate was maintained at between 1 and 2 mL/min. The chromatogram of each ink was obtained at all wavelengths in the UV and visible regions, 200 to 800 nm (resolution 1 run, wavelength precision 0.01 nm). Estimation of peak purity and the comparison of peaks in different chromatograms having similar retention times was achieved by obtaining the absorbance spectrum of the peak, together with its first and second derivatives.
suspension was agitated in a sonic bath for 20 min to extract the dye, and 20 ~ of the supernatant were then injected directly onto the HPLC column. Each analysis was perfonned in duplicate. The eluent from the column was monitored between 200 and 800 nm in order to detect those components that absorbed in either the visible or UV range. Each sample was extracted five times in order to ascertain the reproducibility of the technique. Samples of the same ink but of different batch numbers were also examined as were extracts from different types of paper to ensure that chemicals present in the paper did not interfere with the analysis.
A Perkin Elmer Series 3B liquid chromatographic pump (Perkin Elmer, Norwalk, Cf) was used to deliver mobile phase to the analytical column. Samples were injected onto the system via a Rheodyne (Rheodyne, Cotati, CA) injection valve incorporating a 20-J.lL loop. Detection of the eluting components was achieved with a Spectra Physics Focus detection system (Spectra Physics, San Jose, CA) and integration and data manipulation was achieved via an IBM Personal System/2 Model 70 computer (International Business Machines, Annonk, NY).
The HPLC systems shown in Table 2 were evaluated for their ability to differentiate 17 nonball-point pen inks representing examples of each of the subgroups of the inks under investigation. Of the five liquid chromatographic methods evaluated for their ability to further subdivide each of the 17 groups of blue nonball-point pen inks, optimal separation was achieved with a Spherisorb® 5 J.Lm ODS column and a mobile phase of acetonitrile/water
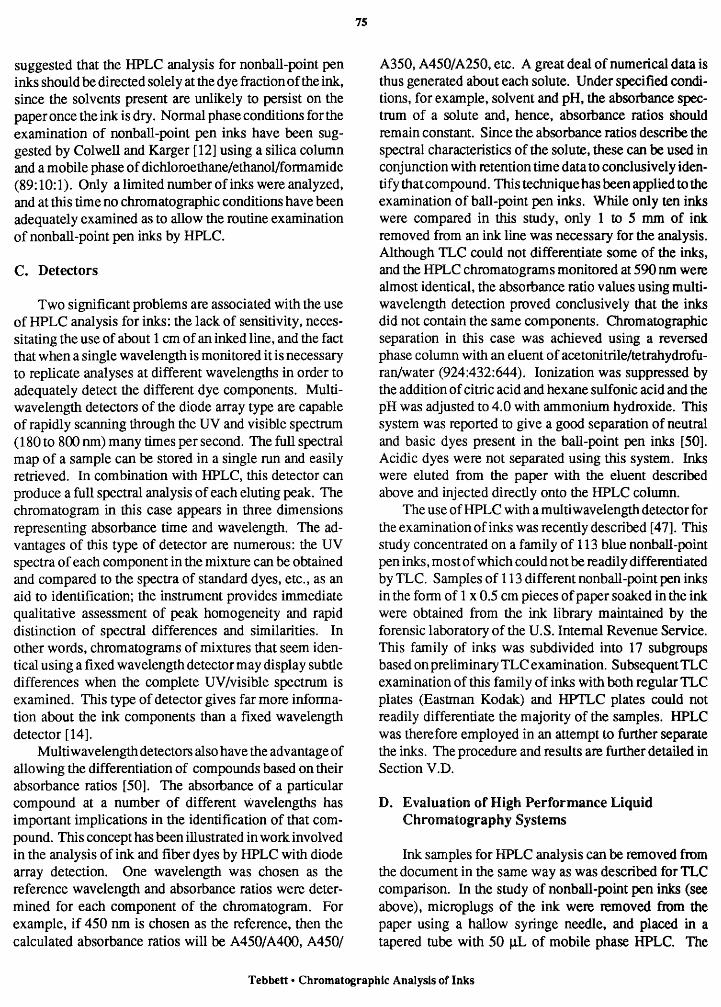
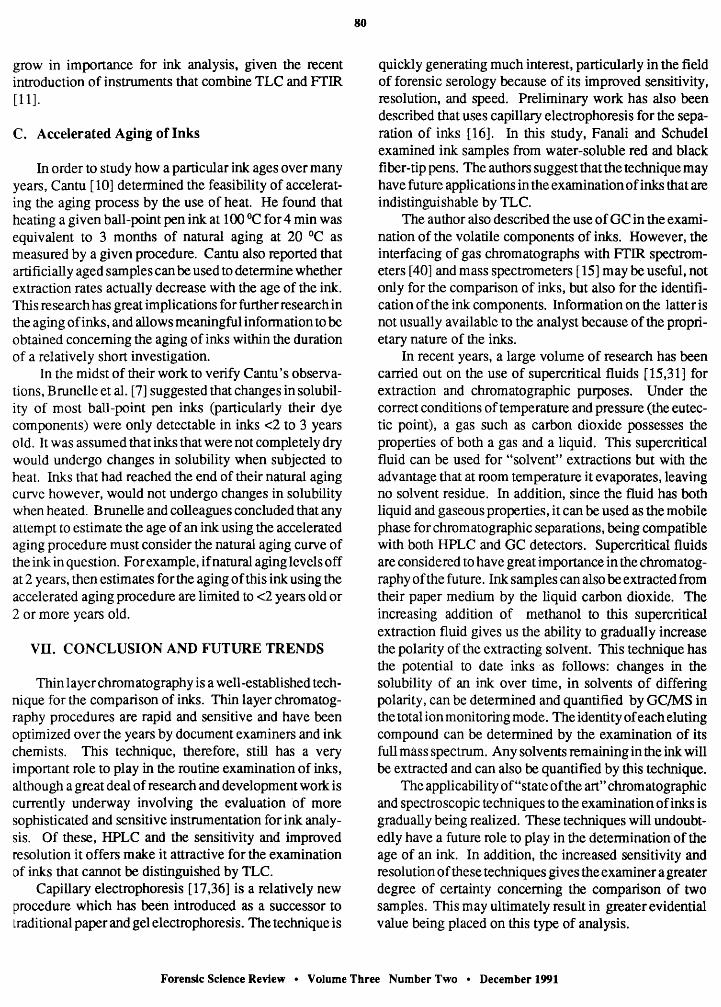
(80:20) with 0.005 M heptane sulfonic acid at a pH of 4. 7. The flow rate was 1 mL/min and the eluent was monitored at all wavelengths in the UV and visible regions (200 to 800 nm). Each ink sample was extracted as previously described with 50 J.lL of mobile phase, and 20 J1L was injected onto the HPLC. Each of the 17 groups ofink were readily subdivided by this method and representative chromatograms are shown in Figure 1.
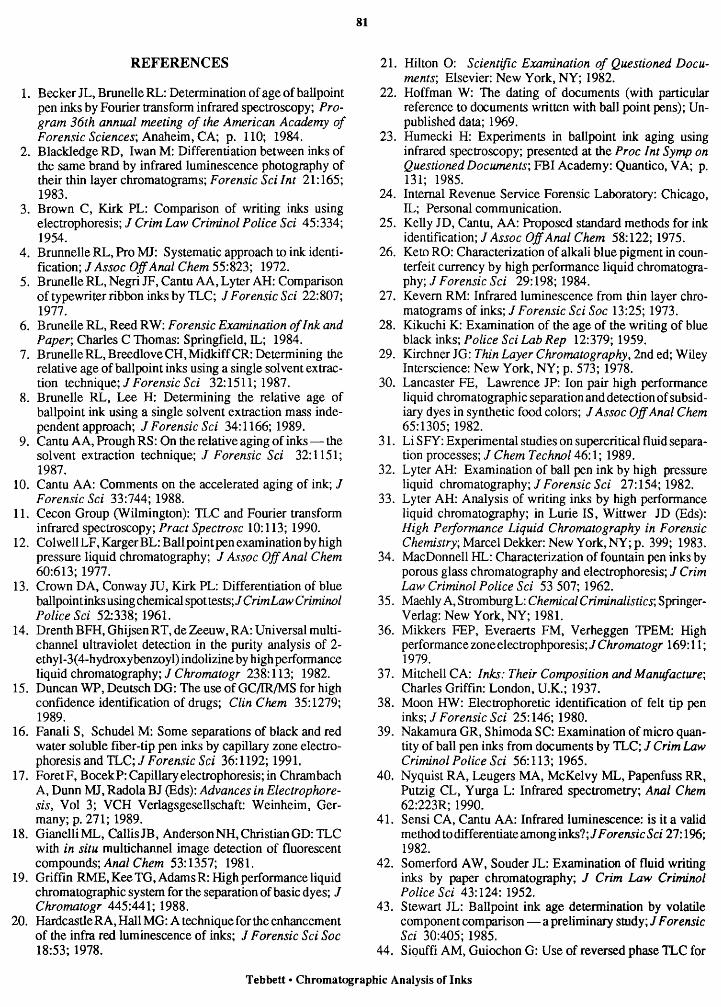
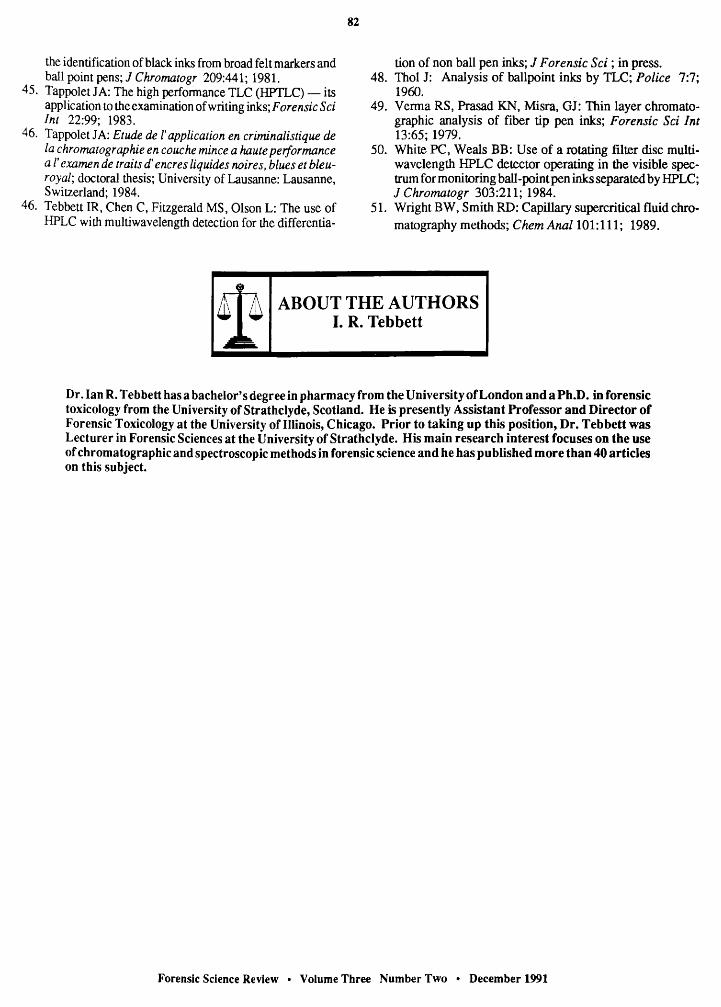
The technique was shown to be reproducible by repeated extraction and analysis of each sample (a total of five times). All samples in the collection were then examined by this method, amounting to over 113 different inks. Only group A, the largest group, consisting of 32 samples, produced some chromatograms that could not be immediately distinguished from other inks in the group. With this group it was necessary to examine the UV and visible spectra of each eluting peak in the chromatogram in order to detennine differences in the composition of the inks. Figure 2 shows the UV spectrum of a peak eluting at 7.2 min, and Figure 3 shows the first and second derivative spectra of a peak eluting after 9.8 min. Using this approach, chromatograms, which on initial inspection could not be distinguished, were observed to consist of different components on further spectral examination. Of the 113 inks in the collection, 108 could be distinguished by the HPLC method described above. Interestingly, the chromatograms in the visible range were virtually identical for most of the inks examined; however, major differences were seen in the chromatograms in the UV region. This is not surprising, as all the samples examined were
Forensic Science Review • Volume Three Number Two • December 1991
76
Table 2. HPLC systems used for the evaluation of different nonball-point pen inksa
System Column Mobile phase Ref.
Spherisorb® 5 Jlm ODS Acetonitrile/water (80:20) with 0.005 M heptane sulfonic acid and 0.02% [32] (Phase Separations, Ltd., U.K.) acetic acid
2 Spherisorb® 5 Jlm Dichloroethane/ethanoVformamide (89: 10: 1) [12]
[50] 3 Spherisorb® 5 Jlm ODS Acetonitrile/tetrahydrofuran/water (924:432:644) with citric acid (1.75 g/L) and hexane sulfonic acid (0.75 giL)
4 Spherisorb® 5 Jlm ODS Methanol/water (60:40) with 0.005 M tetra-n-butyl-anunonium phosphate at pH 7.2
[30]
5 Spherisorb® 5 Jlm Methanol/ammonium acetate solution (pH 9.7) (9:1). [19]
a In each case, the flow rate was maintained at between 1 and 2 mL/min. The chromatogram of each ink was obtained at all wavelengths in the UV and visible regions, 200 to 800 nm (resolution 1 run, wavelength precision 0.01 nm). Estimation of peak purity and the comparison of peaks in different chromatograms having similar retention times was achieved by obtaining the absorbance spectrum of the peak, together with its first and second derivatives.
suspension was agitated in a sonic bath for 20 min to extract the dye, and 20 ~ of the supernatant were then injected directly onto the HPLC column. Each analysis was performed in duplicate. The eluent from the column was monitored between 200 and 800 nm in order to detect those components that absorbed in either the visible or UV range. Each sample was extracted five times in order to ascertain the reproducibility of the technique. Samples of the same ink but of different batch numbers were also examined as were extracts from different types of paper to ensure that chemicals present in the paper did not interfere with the analysis.
A Perkin Elmer Series 3B liquid chromatographic pump (Perkin Elmer, Norwalk, Cf) was used to deliver mobile phase to the analytical column. Samples were injected onto the system via a Rheodyne (Rheodyne, Cotati, CA) injection valve incorporating a 20-J.l.L loop. Detection of the eluting components was achieved with a Spectra Physics Focus detection system (Spectra Physics, San Jose, CA) and integration and data manipulation was achieved via an IBM Personal System/2 Model 70 computer (International Business Machines, Armonk, NY).
The HPLC systems shown in Table 2 were evaluated for their ability to differentiate 17 nonball-point pen inks representing examples of each of the su,bgroups of the inks under investigation. Of the five liquid chromatographic methods evaluated for their ability to further subdivide each of the 17 groups of blue nonball-point pen inks, optimal separation was achieved with a Spherisorb® 5 J.lffi ODS column and a mobile phase of acetonitrile/water
(80:20) with 0.005 Mheptane sulfonic acid at a pH of 4.7. The flow rate was 1 mL/min and the eluent was monitored at all wavelengths in the UV and visible regions (200 to 800 nm). Each ink sample was extracted as previously described with 50 J.1L of mobile phase, and 20 J1L was injected onto the HPLC. Each of the 17 groups of ink were readily subdivided by this method and representative chromatograms are shown in Figure 1.
The technique was shown to be reproducible by repeated extraction and analysis of each sample (a total of five times). All samples in the collection were then examined by this method, amounting to over 113 different inks. Only group A, the largest group, consisting of 32 samples, produced some chromatograms that could not be immediately distinguished from other inks in the group. With this group it was necessary to examine the UV and visible spectra of each eluting peak in the chromatogram in order to determine differences in the composition of the inks. Figure 2 shows the UV spectrum of a peak eluting at 7.2 min, and Figure 3 shows the first and second derivative spectra of a peak eluting after 9.8 min. Using this approach, chromatograms, which on initial inspection could not be distinguished, were observed to consist of different components on further spectral examination. Of the 113 inks in the collection, 108 could be distinguished by the HPLC method described above. Interestingly, the chromatograms in the visible range were virtually identical for most of the inks examined; however, major differences were seen in the chromatograms in the UV region. This is not surprising, as all the samples examined were
Forensic Science Review • Volume Three Number Two • December 1991

0.0050
0.0040
0.0030
0.0020
0.0010
0.0000
0.0030
0.0024
0.0018
0.0012
0.0006
o.oooo
0.00
o.oo
0.0100
0.0080
0.0060
0.0040
0.0020
0.0000 o.oo
3.92
4.00
4.00
77
lllfilirf 200
230 260
290 320
350
7.84 11.76 15.68 19.60
-lf!.200
230 260
290 320
350
8.oo 12.00 16.00 20.00
~~~~~200 230 260
290 320
350
8.oo 12.00 16.00 20.00
Figure 1. High perfonnanceliquid chromatograms of three different blue nonball-point pen inlCs that could not be readily distinguished by TLC.
0.0020
0.0016
0.0012
0.0008
0.0004
0.0000 200
7.279
240 280 320 360
Figure 2. UV absorbance spectrum of a peak eluting at 7.2 min in an HPLC chromatogram.
Tebbett • Chromatographic Analysis of lnks

blue inks. It is likely that the manufacturers employ similar dyestuffs, but with different vehicles (the noncolored fraction) which absorb in the UV region of the spectrum.
The great advantage that this type of detection system has over traditional HPLC detectors is that complete chromatographic and spectral data can be collected simultaneously using a sample size of a few nanograms. Those inks that cannot be immediately differentiated based on their chromatographic data can be further examined by comparison oftheirUVorvisible spectra and, if required, the derivative spectra of individual peaks.
It has been shown that by using a simple isocratic HPLC system, together with a highly sensitive multiwavelength detection system, even very closely related inks can be distinguished. The sensitivity of the technique suggests that meaningful data could be obtained from a much smaller sample size, if required. The detector was typically operated at 0.01 absorbance units full scale (AUFS) for a 5-mm line of ink. A stable baseline was possible, however, with a sensitivity setting of 0.0005 A UFS, representing a 20-X increase in sensitivity. In fact, it was feasible to obtain complete chromatographic and spectral data from a single period or comma extracted from a handwritten document.
VI. DATING OF INKS
A. Date of Initial Production
The present method of determining whether a document is as old as claimed- comparison with a reference collection of standards- was first described by Hofmann [22], who used a combination of chemical and chromato-
78
graphic tests. This approach was developed in the U.S. by Brunelle et al. [7] with the introduction of a comprehensive ink reference collection that is presently maintained by the U.S. Secret Service (Washington, D.C.).
The dating of an ink is approached by comparing the properties of a questioned sample against a library of samples of known age and origin. As described above, this is usually achieved by the comparison of the TLC pattern of the ink under investigation to that of the known sample. If the two inks are found to match, the manufacturer's files are consulted to determine the initial manufacture date of the ink. While this approach can be useful in determining the authenticity of a document, it is limited in that it is only possible to say that a document could not have been written before a certain date; it is not possible to determine the actual date that the document was prepared.
In some cases, inks can be dated by the identification of tags or other unique components added by the manufacturer. This also has limitations since only a few inks actually contain these tags.
B. Aging of Inks
A great deal of interest in the 1980s was fostered by the attempt to determine the actual age of a document by examination of the ink. Although some progress has been made in this field, the solution continues to elude researchers and document examiners alike. The ability to determine when a document was written would rate as one of the major breakthroughs in forensic science, having a significant impact on the detection of all kinds of fraud. This would result in a corresponding financial benefit to both State and Federal administrations.
9.821 1 9.821 11
+ I ,,
I / "' I \
\
\ I t
' I '
0 I ' I \
I ' I \
\ I
200
\
\
\ 1 I I
I I
r' I\ ' ........
,' \; -" I I ' ... /'
1\ \ I
I I I I
"-I ,' .\ : I
\~II I \
\ I ,,
240
\:.I
I I
\,'
280
r -
I , II I I
I I I I I I
I I
I I
I I
1/
, \ / ... I\ I I
......... \ I I I I \ I A '- ..-/
-../ , I II I,
,' ~ I I
~
t', I
' II I I
' I I I I - I B I I
I I I ' I l
I I
l \ I
I I \
' I I I I I \ I I I \
I I
I I I I ' -~ ' I I 1/ I
'.I II
320 360
Figure 3. First (A) and second (B) derivative spectra of a peak eluting at 9.8 min in an HPLC chromatogram.
Forensic Science Review • Volume Three Number Two • December 1991

Several analytical approaches have been tried by different workers to detennine the age of an ink. The most successful of these include the effect of time on the relative solubility of the ink in different solvents, changes in the relative concentrations of dyestuffs and solvents in the ink as determined by chromatographic and/or spectral methods, and changes in theIR absorbance spectrum of the ink over time.
The detennination of the absolute age of a document by examination of the ink has been the subject of several studies over the past 20 years. However, in contrast to the numerous articles in the literature for the differentiation of inks, only a few researchers have published procedures for dating inks. As early as 1937, chemical tests on iron gallotannate inks were described as having potential for the estimation of the age of a document [37]. In 1959, Kikuchi [28] laid the foundation for the solvent extraction techniques in use today for estimating the age of writing inks. This work involved the measurement of the time taken for blue-black inks to disperse when solvents were applied to the ink on paper. Kikuchi observed that older inks dispersed more slowly than newer inks. Much later, Cantu and Prough [9] employed the principles applied by Kikuchi to develop a procedure for estimating the age of ball-point pen ink. They found that a relationship existed between the age ofball-pointpen ink and the rate at which the ink could be extracted from paper using low and medium polarity solvents such as toluene, isopropanol, and butanol. The longer the ink had been applied to the paper, the drier it became, and the slower it extracted into solvents. If known dated inks covering a span of years are present on the questioned document, for example, in a ledger, it is then possible to closely estimate when a questioned entry was written by a comparison of the extraction rates. This approach is only useful, however, if the known and dated inks are of the same ink fonnulation and are on the same paper, thereby eliminating storage condition variables. In addition, by detennining the amount of dye extracted into a given solvent at two or more times, these amounts can be compared as ratios. In essence this approach, known as the R-ratio method, allows a particular ink to be described numerically by virtue of these amount ratios. The concentrations of ink extracted by the solvent were detennined by means of their absorbance in the UV /visible spectrum. This was measured using a densitometer after the application of a known volume of the extract to a TLC plate. If the ink contains fluorescent compounds, the amount of fluorescence in the extract can also be monitored. The use of a fluorescence spectrophotometer improves the sensitivity of the analysis, but is susceptible to interference from fluorescent compounds in the paper.
79
The use of sequential solvent extraction techniques for ball-point pen inks was also described. Two solvents, one weak and one strong, were used to sequentially extract an ink sample. The amount of ink extracted by the first (weak) solvent can be expressed as a percentage of the total amount of ink extracted by the second (strong- all extracting) solvents. A combination of toluene as the first extraction solvent followed by benzyl alcohol was reported [4] to give optimal results for ball-point pen inks.
In 1987, Brunelle et al. [7] developed a single sol vent extraction procedure that was able to estimate the age of ball-point pen inks. Like Cantu and Prough's work, this procedure also involved the extraction ofinks with weakly polar solvents, spotting the extract onto a TLC plate and measuring the amount of ink extracted by the use of a densitometer. Age of the ink was estimated by comparison with known dated inks. The main limitation of this technique is that it is mass dependent and requires that equal samples of questioned and known ink be removed for analysis. Brunelle and co-workers later used TLC to separate their ink extracts with a mobile phase of ethyl acetate/ethanol/water (75 :35 :30). The relative concentrations of different dye components in the extract were compared [8]. This represents one of the most extensive pieces of work available on the age detennination of inks. The calculated ratios of the relative concentrations of the dyes are independent of the amount of ink obtained for analysis. The effect of using different extraction solvents, the effect of the paper, and the reproducibility of the technique were detennined.
Two other analytical approaches to the aging of inks deserve mention in this review of the literature. In 1985, Stewart [43] reported a gas chromatography (GC) procedure for comparing the relative age of ball-point inks. His study was based on the gradual disappearance with time of the solvents contained in ball-point pen inks. Stewart found that these solvents remain in dried ink on paper for up to 1 year and longer for some ball-point pen inks. This technique involved (1) extraction of dried inks on paper with strong solvents such as methanol and (2) comparison of the relative concentrations of vehicle by GC.
Also in 1985, Humecki [23] reported on a technique for measuring the relative age of ball-point pen inks using Fourier transform infrared (FfiR) spectroscopy with a microscope attachment. Changes in the hydroxyl, methyl, and carbonyl absorption bands were seen as the ink aged. Humecki found a decrease in the ratio of hydroxyl to methyl bonds in ball-point pen ink up to 22 years. This work was limited to only one ball-point pen ink fmmulation and has not been verified. Fourier transfonn infrared spectroscopy for the examination of inks was also reported by Becker and Brunelle [1]. This technique may
Tebbett • Chromatographic Analysis of Inks
grow in importance for ink analysis, given the recent introduction of instruments that combine TLC and FfiR [ 11].
C. Accelerated Aging of Inks
In order to study how a particular ink ages over many years, Cantu [ 10] determined the feasibility of accelerating the aging process by the use of heat. He found that heating a given ball-point pen ink at 100 °C for4 min was equivalent to 3 months of natural aging at 20 °C as measured by a given procedure. Cantu also reported that artificially aged samples can be used to determine whether extraction rates actually decrease with the age of the ink. This research has great implications for further research in the aging ofinks, and allows meaningful information to be obtained concerning the aging of inks within the duration of a relatively short investigation.
In the midst of their work to verify Cantu's observations, Brunelle et al. [7] suggested that changes in solubility of most ball-point pen inks (particularly their dye components) were only detectable in inks <2 to 3 years old. It was assumed that inks that were not completely dry would undergo changes in solubility when subjected to heat. Inks that had reached the end of their natural aging curve however, would not undergo changes in solubility when heated. Brunelle and colleagues concluded that any attempt to estimate the age of an ink using the accelerated aging procedure must consider the natural aging curve of the ink in question. For example, if natural aging levels off at 2 years, then estimates for the aging of this ink using the accelerated aging procedure are limited to <2 years old or 2 or more years old.
VII. CONCLUSION AND FUTURE TRENDS
Thin layer chromatography is a well-established technique for the comparison of inks. Thin layer chromatography procedures are rapid and sensitive and have been optimized over the years by document examiners and ink chemists. This technique, therefore, still has a very important role to play in the routine examination of inks, although a great deal of research and development work is currently underway involving the evaluation of more sophisticated and sensitive instrumentation for ink analysis. Of these, HPLC and the sensitivity and improved resolution it offers make it attractive for the examination of inks that cannot be distinguished by TLC.
Capillary electrophoresis [17 ,36] is a relatively new procedure which has been introduced as a successor to traditional paper and gel electrophoresis. The technique is
80
quickly generating much interest, particularly in the field of forensic serology because of its improved sensitivity, resolution, and speed. Preliminary work has also been described that uses capillary electrophoresis for the separation of inks [16]. In this study, Fanali and Schudel examined ink samples from water-soluble red and black fiber-tip pens. The authors suggest that the technique may have future applications in the examination of inks that are indistinguishable by TLC.
The author also described the use ofGC in the examination of the volatile components of inks. However, the interfacing of gas chromatographs with FriR spectrometers [ 40] and mass spectrometers [ 15] may be useful, not only for the comparison of inks, but also for the identification of the ink components. Information on the latter is not usually available to the analyst because of the proprietary nature of the inks.
In recent years, a large volume of research has been carried out on the use of supercritical fluids [15,31] for extraction and chromatographic purposes. Under the correct conditions of temperature and pressure (the eutectic point), a gas such as carbon dioxide possesses the properties of both a gas and a liquid. This supercritical fluid can be used for "solvent" extractions but with the advantage that at room temperature it evaporates, leaving no solvent residue. In addition, since the fluid has both liquid and gaseous properties, it can be used as the mobile phase for chromatographic separations, being compatible with both HPLC and GC detectors. Supercritical fluids are considered to have great importance in the chromatography of the future. Ink sam pies can also be extracted from their paper medium by the liquid carbon dioxide. The increasing addition of methanol to this supercritical extraction fluid gives us the ability to gradually increase the polarity of the extracting solvent. This technique has the potential to date inks as follows: changes in the solubility of an ink over time, in solvents of differing polarity, can be determined and quantified by GC/MS in the total ion monitoring mode. The identity of each eluting compound can be determined by the examination of its full mass spectrum. Any solvents remaining in the ink will be extracted and can also be quantified by this technique.
The applicability of" state of the art" chromatographic and spectroscopic techniques to the examination ofinks is gradually being realized. These techniques will undoubtedly have a future role to play in the determination of the age of an ink. In addition, the increased sensitivity and resolution of these techniques gives the examiner a greater degree of certainty concerning the comparison of two samples. This may ultimately result in greater evidential value being placed on this type of analysis.
Forensic Science Review • Volume Three Number Two • December 1991
REFERENCES
1. Becker JL, Brunelle RL: Determination of age of ballpoint pen inks by Fourier transform infrared spectroscopy; Program 36th annual meeting of the American Academy of Forensic Sciences; Anaheim, CA; p. 110; 1984.
2. Blackledge RD, I wan M: Differentiation between inks of the same brand by infrared luminescence photography of their thin layer chromatograms; Forensic Sci Int 21:165; 1983.
3. Brown C, Kirk PL: Comparison of writing inks using electrophoresis; J Crirn Law Criminal Police Sci 45:334; 1954.
4. Brunnelle RL, Pro MJ: Systematic approach to ink identification; J Assoc Off Anal Chern 55:823; 1972.
5. Brunelle RL, Negri JF, Cantu AA, Lyter AH: Comparison of typewriter ribbon inks by TLC; J Forensic Sci 22:807; 1977.
6. Brunelle RL, Reed RW: Forensic Examination of Ink and Paper; Charles C Thomas: Springfield, IL; 1984.
7. BrunelleRL, BreedloveCH,MidkiffCR: Determining the relative age of ballpoint inks using a single solvent extraction technique; J Forensic Sci 32:1511; 1987.
8. Brunelle RL, Lee H: Determining the relative age of ballpoint ink using a single solvent extraction mass independent approach; J Forensic Sci 34:1166; 1989.
9. CantuAA,ProughRS: On therelativeagingofinks-the sol vent extraction technique; J Forensic Sci 32: 1151; 1987.
10. Cantu AA: Comments on the accelerated aging of ink; J Forensic Sci 33:744; 1988.
11. Cecon Group (Wilmington): TLC and Fourier transform infrared spectroscopy; Pract Spectrosc 10:113; 1990.
12. ColwellLF,KargerBL: Ballpoint pen examination by high pressure liquid chromatography; J Assoc Off Anal Chern 60:613; 1977.
13. Crown DA, Conway JU, Kirk PL: Differentiation of blue ballpoint inks using chemical spot tests; J CrirnLaw Criminol Police Sci 52:338; 1961.
14. Drenth BFH, Ghijsen RT, de Zeeuw, RA: Universal multichannel ultraviolet detection in the purity analysis of 2-ethyl-3(4-hydroxybenzoyl)indolizinebyhighperfonnance liquid chromatography; J Chromatogr 238: 113; 1982.
15. Duncan WP, Deutsch 00: The use ofGC/IR/MS for high confidence identification of drugs; Clin Chern 35:1279; 1989.
16. Fanali S, Schudel M: Some separations of black and red water soluble fiber-tip pen inks by capillary zone electrophoresis and TLC; J Forensic Sci 36: 1192; 1991.
17. Foret F, Bocek P: Capillary electrophoresis; in Chram bach A, Dunn MJ, Radola BJ (Eds): Advances in Electrophoresis, Vol 3; VCH Verlagsgesellschaft: Weinheim, Germany; p. 271; 1989.
18. GianelliML, CallisJB, AndersonNH, Christian GD: TLC with in situ multichannel image detection of fluorescent compounds; Anal Chern 53: 1357; 1981.
19. Griffin RME, Kee TG, Adams R: High performance liquid chromatographic system for the separation of basic dyes; J Chromatogr 445:441; 1988.
20. HardcastleRA, Hall MG: A technique for the enhancement of the infra red luminescence of inks; J Forensic Sci Soc 18:53; 1978.
81
21. Hilton 0: Scientific Examination of Questioned Documents; Elsevier: New York, NY; 1982.
22. Hoffman W: The dating of documents (with particular reference to documents written with ball point pens); Unpublished data; 1%9.
23. Humecki H: Experiments in ballpoint ink aging using infrared spectroscopy; presented at the Proc Int Symp on Questioned Documents; FBI Academy: Quantico, VA; p. 131; 1985.
24. Internal Revenue Service Forensic Laboratory: Chicago, IL; Personal communication.
25. Kelly JD, Cantu, AA: Proposed standard methods for ink identification; J As soc Off Anal Chem 58: 122; 1975.
26. Keto RO: Characterization of alkali blue pigment in counterfeit currency by high performance liquid chromatography; J Forensic Sci 29:198; 1984.
27. Kevem RM: Infrared luminescence from thin layer chromatograms of inks; J Forensic Sci Soc 13:25; 1973.
28. Kikuchi K: Examination of the age of the writing of blue black inks; Police Sci Lab Rep 12:379; 1959.
29. Kirchner JG: Thin Layer Chromatography, 2nd ed; Wiley Interscience: New York, NY; p. 573; 1978.
30. Lancaster FE, Lawrence JP: Ion pair high performance liquid chromatographic separation and detection of subsidiary dyes in synthetic food colors; J Assoc Off Anal Chern 65:1305; 1982.
31. Li SFY: Experimental studies on supercritical fluid separation processes; J Chern Techno/46: 1; 1989.
32. Lyter AH: Examination of ball pen ink by high pressure liquid chromatography; J Forensic Sci 27:154; 1982.
33. Lyter AH: Analysis of writing inks by high performance liquid chromatography; in Lurie IS, Wittwer JD (Eds): High Performance Liquid Chromatography in Forensic Chemistry; Marcel Dekker: New York, NY; p. 399; 1983.
34. MacDonnell HL: Characterization of fountain pen inks by porous glass chromatography and electrophoresis; 1 Crim Law Criminal Police Sci 53 507; 1962.
35. Maehly A,StromburgL: ChemicalCriminalistics; SpringerVerlag: New York, NY; 1981.
36. Mikkers FEP, Everaerts FM, Verheggen TPEM: High performancezoneelectrophporesis;J Chromatogr 169:11; 1979.
37. Mitchell CA: Inks: Their Composition and Manufacture; Charles Griffin: London, U.K.; 1937.
38. Moon HW: Electrophoretic identification of felt tip pen inks; J Forensic Sci 25: 146; 1980.
39. Nakamura GR, Shimada SC: Examination of micro quantity of ball pen inks from documents by TLC; J Crim Law Criminal Police Sci 56:113; 1965.
40. Nyquist RA, Leugers MA, McKelvy ML, Papenfuss RR, Putzig CL, Yurga L: Infrared spectrometry; Anal Chem 62:223R; 1990.
41. Sensi CA. Cantu AA: Infrared luminescence: is it a valid method to differentiate among inks?; 1 Forensic Sci 27: 196; 1982.
42. Somerford AW, Souder JL: Examination of fluid writing inks by paper chromatography; 1 Crim Law Criminol Police Sci 43:124: 1952.
43. Stewart JL: Ballpoint ink age determination by volatile component comparison- a preliminary study; 1 Forensic Sci 30:405; 1985.
44. Siguffi AM, Guiochon G: Use of reversed phase TLC for
Tebbett • Chromatographic Analysis of Inks
the identification of black inks from broad felt markers and ball point pens; J Chromatogr 209:441; 1981.
45. Tappolet JA: The high performance TLC (HPTLC)- its application to the examination of writing inks; ForensicS ci I nt 22:99; 1983.
46. Tappolet JA: Etude del' application en criminalistique de Ia chromatographie en couche mince a haute performance a l' examen de traits d' encres liquides noires, blues et bleuroyal; doctoral thesis; University of Lausanne: Lausanne, Switzerland; 1984.
46. Tebbett IR, Chen C, Fitzgerald MS, Olson L: The use of HPLC with multiwavelength detection for the differentia-
82
tion of non ball pen inks; J Forensic Sci; in press. 48. Thol J: Analysis of ballpoint inks by TLC; Police 7:7;
1960. 49. Verma RS, Prasad KN, Misra, GJ: Thin layer chromato
graphic analysis of fiber tip pen inks; Forensic Sci Int 13:65; 1979.
50. White PC, Weals BB: Use of a rotating filter disc multiwavelength HPLC detector operating in the visible spectrum for monitoring ball-point pen inks separated by HPLC; J Chromatogr 303:211; 1984.
51. Wright BW, Smith RD: Capillary supercritical fluid chro-
matography methods; ChemAna/101:111; 1989.
ABOUT THE AUTHORS I. R. Te b bett
Dr. Ian R. Tebbett has a bachelor's degree in pharmacy from the University of London and a Ph.D. in forensic toxicology from the University of Strathclyde, Scotland. He is presently Assistant Professor and Director of Forensic Toxicology at the University of Illinois, Chicago. Prior to taking up this position, Dr. Tebbett was Lecturer in Forensic Sciences at the University of Strathclyde. His main research interest focuses on the use of chromatographic and spectroscopic methods in forensic science and he has published more than 40 articles on this subject.
Forensic Science Review • Volume Three Number Two • December 1991