Working with graduates Lesley Hassall Careers Centre [email protected].

1
Study design and mark-recapture estimates of dispersal: a case study with the
endangered damselfly Coenagrion mercuriale1
Christopher Hassall • David John Thompson
Abstract
Accurate data on dispersal ability are vital to the understanding of how species are affected by
fragmented landscapes. However, three factors may limit the ability of field studies to detect a
representative sample of dispersal events: (i) the number of individuals monitored, (ii) the area over
which the study is conducted and (iii) the time over which the study is conducted. Using sub-sampling
of mark-release-recapture data from a study on the endangered damselfly Coenagrion mercuriale
(Charpentier), we show that maximum dispersal distance is strongly related to the number of
recaptured individuals in the mark-release-recapture study and the length of time over which the study
is conducted. Median dispersal distance is only related significantly to the length of the study. Spatial
extent is not associated with either dispersal measure in our analysis. Previously consideration has
been given to the spatial scale of dispersal experiments but we demonstrated conclusively that
temporal scale and the number of marked individuals also have the potential to affect the
measurement of dispersal. Based on quadratic relationships between the maximum dispersal
distance, recapture number and length of study, we conclude that a previous study was of sufficient
scale to characterise the dispersal kernel of C. mercuriale. Our method of analysis could be used to
ensure that the results of mark-release-recapture studies are independent of levels of spatial and
temporal investment. Improved confidence in dispersal estimates will enable better management
decisions to be made for endangered species.
Keywords: damselfly, dispersal, dragonfly, mark-release-recapture, movement, study design.
Introduction
Landscape-scale conservation measures, particularly the design and implementation of networks of
nature reserves, require knowledge of the dispersal abilities of species which are to be the focus of
those conservation measures. The quantification of dispersal requires a substantial investment of
resources due to the need to consider a sufficient spatial and temporal scale within which the full
range of dispersal events can be observed. Consideration of scale is vital since the costs associated
with carrying out such studies increase with the size of the study area (Slatkin 1985). Where
resources are limited there is a desire to maximise data while minimising investment, although
insufficient investment can lead to misleading results (Koenig et al. 1996).
A simple solution to the problem of finite spatial scale is to design the dispersal experiment at a scale
that is sufficient to encompass the range of dispersal events of the subject species. However, this
requires exactly the kind of a priori knowledge of dispersal that many such experiments are
attempting to establish. A second method is to correct observed dispersal distances according to the
likelihood of detecting them given the size of the study area and the number of unsurveyed, suitable
habitat patches outside of the study area (Baker et al. 1995; Barrowclough 1978). However, such
corrections thicken the tail of the dispersal distribution but do not extend it and knowledge of the
suitability of the landscape beyond the study area is required. This method cannot be applied in
cases where the study area constitutes an isolated habitat fragment, i.e. there is no more suitable
habitat within a reasonable distance of the study area. Finally, post-hoc methods may be used to
1 Version of record can be viewed at the publishers and should be cited as: Hassall, C. & Thompson, D. J. 2012.
Study design and mark recapture estimates of dispersal: a case study with the endangered damselfly
Coenagrion mercuriale. Journal of Insect Conservation, 16, 111-120.

2
check that the results of dispersal studies are independent of the scale of the study. Such methods
may include randomised sub-sampling of the data to investigate relationships with the area of the
study site (Franzén and Nilsson 2007). Post-hoc validation is clearly less preferable than
incorporating dispersal knowledge into the study design or correcting for finite study area, as the
results may demonstrate conclusively that the study was unable to provide meaningful data aside
from the observation that the study was not of sufficient scale. However, this validation does
constitute a method that can be used in all cases. While limitations on the quality of data imposed by
study design are almost universal, there are relatively few studies explicitly investigating them.
Exceptions include inter-study comparisons of mark-release-recapture studies of the butterfly Maniola
jurtina (L.) showing that the mean dispersal distance recorded was strongly correlated to study area
size (Schneider 2003) and evidence of a similar effect for the damselfly Coenagrion mercuriale
(Hassall and Thompson 2008a).
In Odonata the primary mechanism for dispersal is flight. While there have been documented cases
of dispersal in the egg and larval forms these are thought to comprise a negligible proportion of
dispersal events (Angelibert and Giani 2003), although it is possible that passive dispersal in lotic
systems could be common. Teneral (newly-emerged, reproductively immature) individuals are known
to exhibit a negative taxis with respect to reflecting surfaces, including water (Corbet 1999). This
results in emigration from the natal water body. However, this “maiden flight” rarely involves
distances of more than a few tens of metres (Corbet 1962). Mark-release-recapture studies of
odonate dispersal have focused primarily on networks of lentic water bodies (Angelibert and Giani
2003; Conrad et al. 1999). The discontinuous distribution of potential movement distances between
those water bodies means that the dispersal kernel cannot be accurately quantified along its entire
length. Species inhabiting networks of linear water bodies such as water meadow ditch systems (e.g.
Allen and Thompson 2009; Purse et al. 2003) provide an easier system within which to calculate
dispersal. Even when adequately designed to encompass the maximum dispersal distance of a
species, the chances of catching one of the rare individuals that actually make that movement are low
(Corbet 1962). This highlights the rarely-considered aspect of recapture number in mark-release-
recapture or the number of tagged individuals in radio-tracking.
Despite a growing number of large-scale studies of dispersal in Odonata, there have been relatively
few attempts to validate the results of those studies. We seek to validate data from a mark-release-
recapture study on the endangered odonate Coenagrion mercuriale (Rouquette and Thompson 2007;
Watts et al. 2004), which reaches the edge of its range in southern England and generally occurs in
isolated populations. The species is classified as “near threatened” on the IUCN’s Red List (Boudot
2006) as well as featuring in Annex II of the EU Habitats Directive. Habitat for C. mercuriale is well-
characterised and scarce (Rouquette and Thompson 2005), with none found within several kilometres
of the study site. For this reason we do not apply a mathematical correction using Baker et al's (1995)
methods. This original study detected a median dispersal distance of 31.9 m and a maximum
dispersal distance of 1.79 km, with 66% of individuals moving <50 m in their lifetimes. By sub-
sampling the spatial extent of the study area and the temporal length of the study, we test two
hypotheses: (i) the accuracy of the detection of maximum and median dispersal distances of C.
mercuriale increases with diminishing returns as both spatial extent and temporal length of the study
increase, and (ii) the original study was of sufficient temporal and spatial scope to accurately
characterise the dispersal kernel of C. mercuriale. The first hypothesis is motivated by a lack of
knowledge concerning the effect of the nature of study design on the results of dispersal experiments.
The second hypothesis is motivated by evidence suggesting that the spatial scale of previous studies
has influenced the maximum dispersal distance that can be measured in this species (Hassall and
Thompson 2008a). The results presented here also address concerns of conservation agencies
about the extent of the original study.

3
Materials and Methods
Data collection
A mark-release-recapture study to quantify the dispersal ability and population genetic variation of C.
mercuriale was carried out in southern England for 43 days beginning on 12 June 2001. The study
site comprised a series of eight sub-sites located along the Itchen Valley, of which five were directly
adjacent (Fig. 1). Mature adult damselflies were caught and marked with a dot of paint on the dorsum
of the thorax and a unique alphanumeric code on the wing. The locations of each capture as well as
subsequent recaptures or sightings were recorded using GPS to the nearest meter (m). For details of
this study see Watts et al. (2004) and Rouquette and Thompson (2007).
Sub-sampling
The dataset was divided according to the five contiguous sub-sites (A, B, C, D and E, Fig. 1) and
these were used in combinations to give study areas of varying spatial extents (Fig. 2). Since
individuals moved between adjacent sub-sites, only adjacent sub-sites could be combined while
preserving these movements in the resulting data. This resulted in 15 combinations of sites with
areas (calculated by taking the area of the convex hull surrounding the recorded GPS locations)
varying from 0.13 km2 (Itchen Valley Upper only) to 1.34 km
2 (all sub-sites). Data were also divided
according to the week of recording (with the extra day included in the final week), with adjacent time
periods being combined. This resulted in a sample of 21 time periods varying from 7 to 43 days (Fig.
2). Study areas and time periods were combined in a factorial design to give 315 subsets of the
original data relating to a range of different study site areas and temporal lengths. Each of these
constitutes a "simulated study".
Data analysis
For each simulated study the gross dispersal distances (sum of Euclidean distances between
sightings) were calculated for each individual and the maximum and median gross dispersal distances
were calculated for the population. Gross dispersal distances can be considered the most
ecologically relevant dispersal measure in the context of metapopulations, as they provide an
estimate of the total potential distance that an individual can move. Alternative measures are the "net
dispersal distance", measuring the distance between the locations at which each individual was first
and last seen and "individual dispersal distances", measuring the distances covered between
sightings. However, the ecological relevance of net dispersal distance is unclear given the varying
rates of philopatry and uncertainties over what factors affect the tendency to disperse (Beirinckx et al.
2006). Thus an individual may gravitate back to approximately the same location where it was first
sighted, but this tells us nothing about its ability to move between habitat patches. In a similar way,
individual movements may involve short patrol flights along stretches of stream which fulfil an entirely
different function (e.g. territoriality, mate searching) than directed dispersal. In contrast, by calculating
the sum total of these individual flights, the potential distance that an individual could move can be
calculated.
Gross dispersal distances were plotted against spatial extent (area in km2) and recapture number to
evaluate the relationships between each of these factors. We acknowledge that there is a lack of
independence between data from the results of the 315 simulated studies (Fig. 2 demonstrates that
different simulated studies use the same data). For example, if there are large movements in a given
week, there will be large movements in all models involving data from that week. We therefore need
to account for variation between datasets that include or do not include the data from that week. We
introduce a random factor to account for the variation between the datasets due to the shared
presence of the movements from each week or sub-site. Therefore, in each model, the presence or
absence of the five sub-sites or six sampling weeks were included as random effects, leading to 11
random effect terms in total. Finding that the main effects are still significant even accounting for the
variation between weeks and sub-sites suggests that the main effects are significant regardless of the
lack of independence in the data. LMEs were constructed to explain maximum gross dispersal
4
distance and median gross dispersal distance in each of the simulated studies. Fixed effects in each
model were the area of the study site, the length of the study (in weeks) and the number of recaptured
individuals.
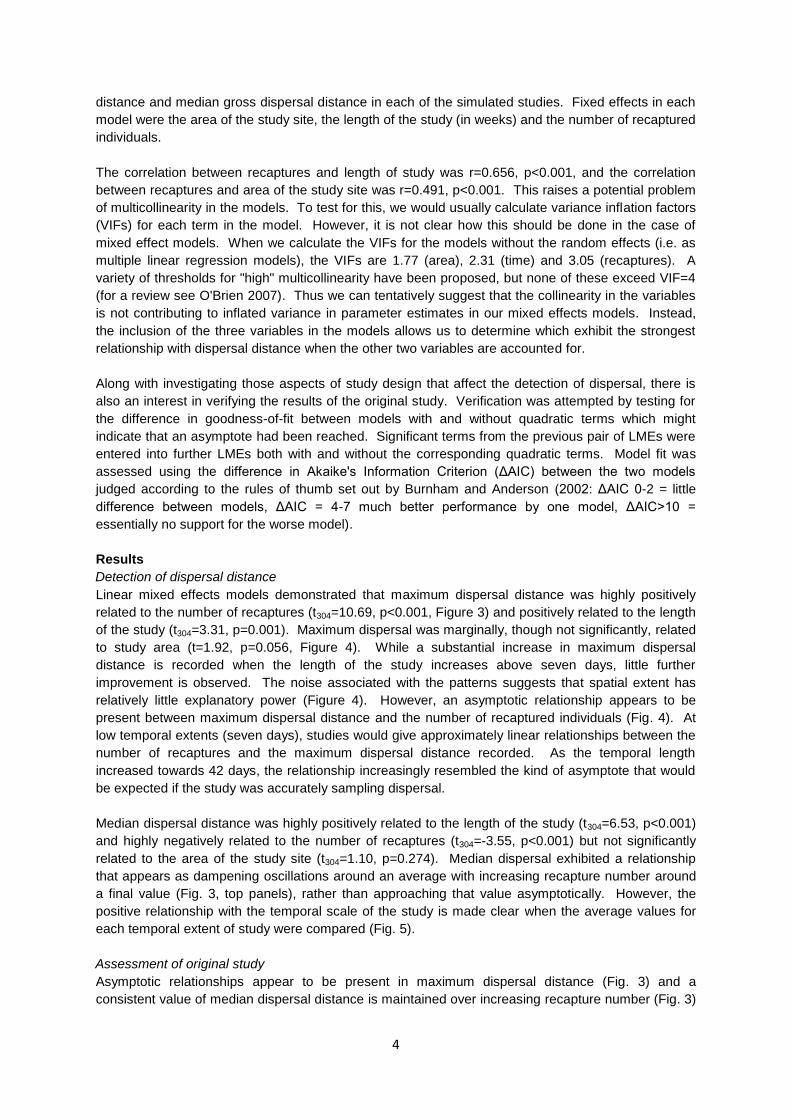
The correlation between recaptures and length of study was r=0.656, p<0.001, and the correlation
between recaptures and area of the study site was r=0.491, p<0.001. This raises a potential problem
of multicollinearity in the models. To test for this, we would usually calculate variance inflation factors
(VIFs) for each term in the model. However, it is not clear how this should be done in the case of
mixed effect models. When we calculate the VIFs for the models without the random effects (i.e. as
multiple linear regression models), the VIFs are 1.77 (area), 2.31 (time) and 3.05 (recaptures). A
variety of thresholds for "high" multicollinearity have been proposed, but none of these exceed VIF=4
(for a review see O'Brien 2007). Thus we can tentatively suggest that the collinearity in the variables
is not contributing to inflated variance in parameter estimates in our mixed effects models. Instead,
the inclusion of the three variables in the models allows us to determine which exhibit the strongest
relationship with dispersal distance when the other two variables are accounted for.
Along with investigating those aspects of study design that affect the detection of dispersal, there is
also an interest in verifying the results of the original study. Verification was attempted by testing for
the difference in goodness-of-fit between models with and without quadratic terms which might
indicate that an asymptote had been reached. Significant terms from the previous pair of LMEs were
entered into further LMEs both with and without the corresponding quadratic terms. Model fit was
assessed using the difference in Akaike's Information Criterion (ΔAIC) between the two models
judged according to the rules of thumb set out by Burnham and Anderson (2002: ΔAIC 0-2 = little
difference between models, ΔAIC = 4-7 much better performance by one model, ΔAIC>10 =
essentially no support for the worse model).
Results
Detection of dispersal distance
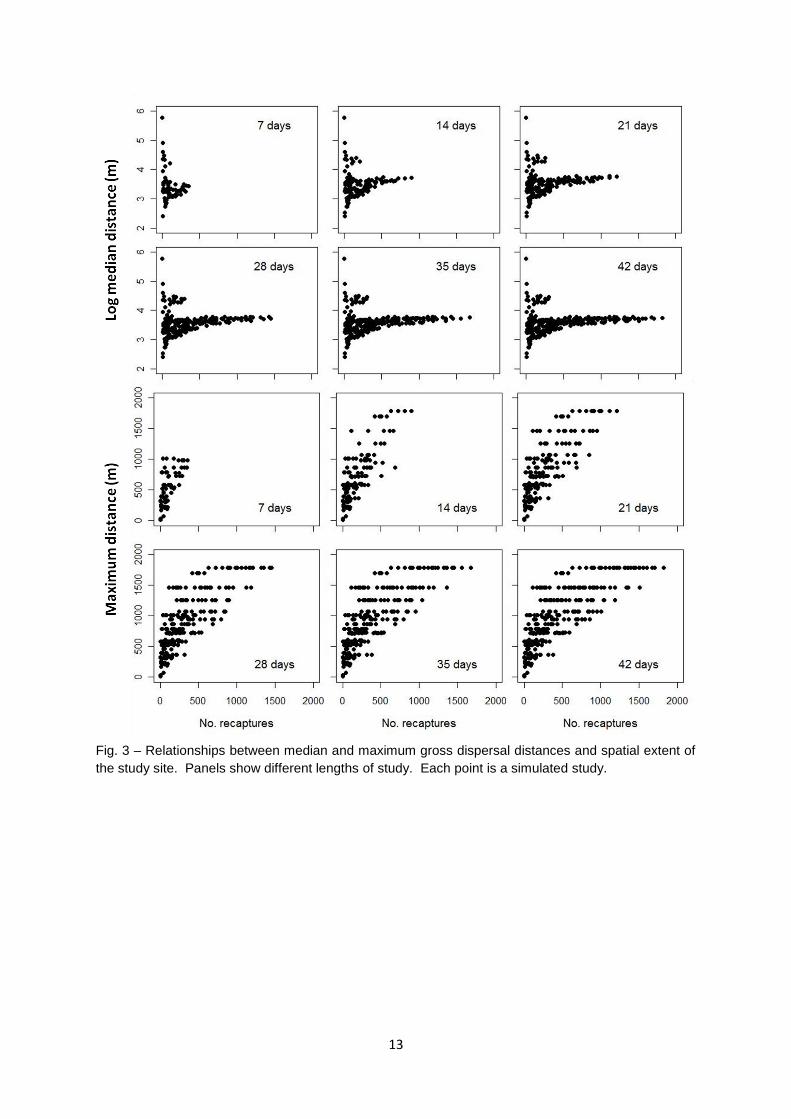
Linear mixed effects models demonstrated that maximum dispersal distance was highly positively
related to the number of recaptures (t304=10.69, p<0.001, Figure 3) and positively related to the length
of the study (t304=3.31, p=0.001). Maximum dispersal was marginally, though not significantly, related
to study area (t=1.92, p=0.056, Figure 4). While a substantial increase in maximum dispersal
distance is recorded when the length of the study increases above seven days, little further
improvement is observed. The noise associated with the patterns suggests that spatial extent has
relatively little explanatory power (Figure 4). However, an asymptotic relationship appears to be
present between maximum dispersal distance and the number of recaptured individuals (Fig. 4). At
low temporal extents (seven days), studies would give approximately linear relationships between the
number of recaptures and the maximum dispersal distance recorded. As the temporal length
increased towards 42 days, the relationship increasingly resembled the kind of asymptote that would
be expected if the study was accurately sampling dispersal.
Median dispersal distance was highly positively related to the length of the study (t304=6.53, p<0.001)
and highly negatively related to the number of recaptures (t304=-3.55, p<0.001) but not significantly
related to the area of the study site (t304=1.10, p=0.274). Median dispersal exhibited a relationship
that appears as dampening oscillations around an average with increasing recapture number around
a final value (Fig. 3, top panels), rather than approaching that value asymptotically. However, the
positive relationship with the temporal scale of the study is made clear when the average values for
each temporal extent of study were compared (Fig. 5).
Assessment of original study
Asymptotic relationships appear to be present in maximum dispersal distance (Fig. 3) and a
consistent value of median dispersal distance is maintained over increasing recapture number (Fig. 3)

5
and temporal scale (Fig. 5) supporting the conclusion that the original study was of sufficient scope to
detect the entire range of potential dispersal distances (i.e. up to and including the maximum
dispersal distance). That maximum dispersal distance is accurately recorded for this particular
landscape is further supported by data from the full study that included three additional northern sites
at varying distances from the complex included here. The full dataset still only recorded a maximum
dispersal distance of 1790m despite increasing the number of recaptures to 2523 compared to a total
of 1823 in the subset of the data used here.
The AIC values for the models describing maximum dispersal (maximum dispersal = recaptures +
time vs. maximum dispersal = recaptures + recaptures2 + time + time
2) were 4359 for the linear model
and 4331 for the quadratic model. The ΔAIC of 29 suggests far greater support for the quadratic and
the conclusion that the results demonstrate the actual maximum dispersal distance of C. mercuriale.
Solving the quadratic function for the maxima of the equation describing the relationship between
maximum dispersal distance and length of study and number of recaptures gives a maximum
dispersal of 1832m, only 42m greater than empirical observations. This maximum is found with a
recapture number of 1875 and a study length of 3.621 weeks. For median dispersal distance, the AIC
values for the models describing maximum dispersal (median dispersal = recaptures + time vs.
median dispersal = recaptures + recaptures2 + time + time
2) were 2601 for the linear model and 2622
for the quadratic model. The ΔAIC value of 21 suggests that the quadratic model for median
dispersal performs substantially worse than the linear model.
Discussion
Contrary to previous assumptions and the results of previous studies (Franzén and Nilsson 2007), we
present results that show that the ability of a mark-release-recapture study to measure a species'
dispersal ability may not be dependent on the spatial extent of the study area. However, we note that
the key result – the relationship between study site area and maximum dispersal distance – was
marginally non-significant (p=0.056), which means that we cannot confidently accept the null
hypothesis that area has no effect on the detection of dispersal. This is further supported by the
solutions of the quadratic functions describing maximum dispersal, which provide estimates which are
slightly greater than those that were detected. However, the methods of analysis presented in this
study permit the quantification of this effect so that the results of the study can be weighed against the
limitations of scale.
Spatial extent may be important in its own right in providing space within which monitored individuals
can move. However, spatial dimensions may also determine the number of individuals that can be
recaptured (based on population density), which in our analysis is the most important factor in
estimating maximum dispersal ability. We also show that the temporal scope of a study, an often
overlooked aspect of study design, is important in determining both median and maximum dispersal
distances. It is commonly assumed that a study area of greater spatial extent will enhance the tails of
dispersal kernels, thus providing better estimates of what is occurring at those extremes. In the case
of C. mercuriale, while additional LDD events are observed, it may serve also to increase the number
of individuals that are recaptured. The sufficiency of the scale of the original dispersal study
(described in Rouquette and Thompson 2007) is supported by low estimates of gene-flow between
sub-sites (Watts et al. 2004) as well as the support for and solutions from quadratic functions of study
scale against maximum dispersal distance. Low dispersal in C. mercuriale is further supported by
evidence from other sites of genetic differentiation over small spatial scales (Watts et al. 2006) and an
unsuccessful search for long-distance dispersal in the periphery of another study site (Thompson and
Purse 1999).
The differentiation of these three components of study design – number of individuals observed,
spatial extent and temporal extent – is important. Spatial extent limits the distance over which the
study can detect dispersal and temporal extent limits the time over which observed individuals can
6
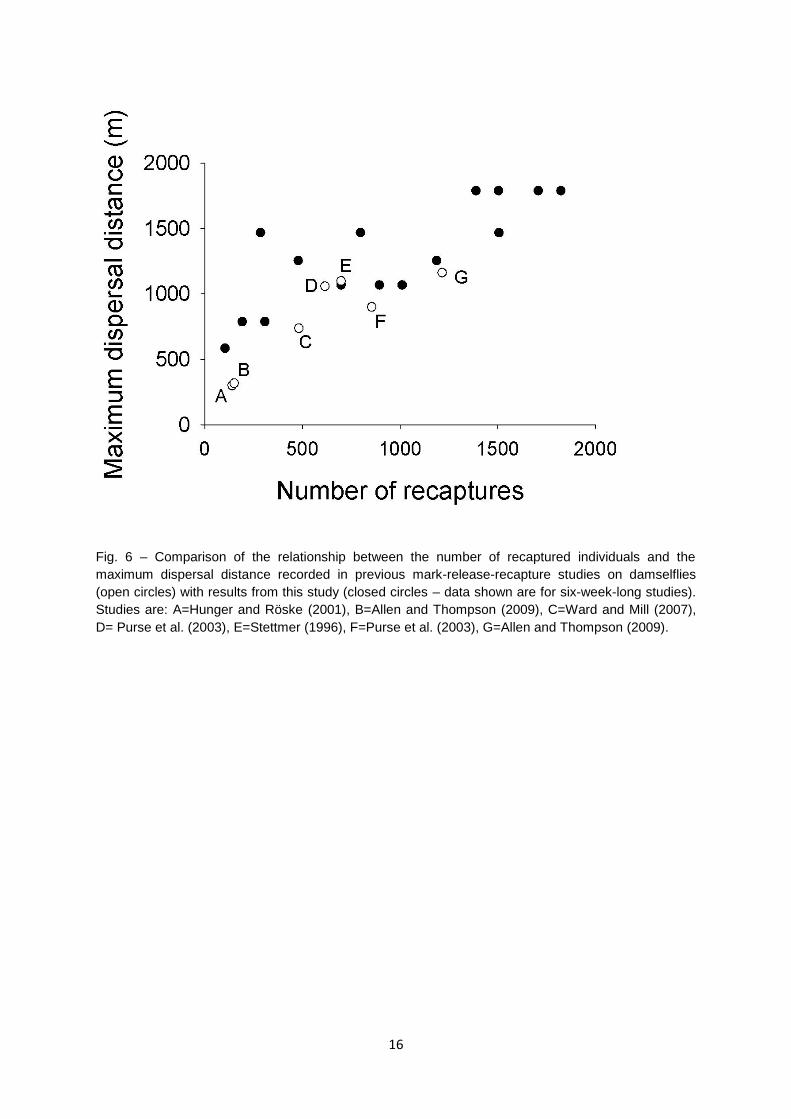
make dispersal movements. While the relationship between recapture number and dispersal distance
is less intuitive, plotting the maximum dispersal distances recorded in this study alongside those
detected in other studies suggests that the pattern may not be unique to this study (Fig. 6). The
location of some studies below the general trend is likely due to the shorter study length in some
cases (four studies were conducted for four weeks or fewer). A similar relationship has been
demonstrated in a meta-analysis of the spatial extent of study areas and recorded dispersal distance
(Schneider 2003), with the two shown to be significantly correlated.
The number of recaptured individuals may affect dispersal estimates in one of two ways. First, while
capable of larger movements, many individuals may be sedentary through lack of necessity for
dispersal. Thus finding individuals that fulfil their dispersal potential may require sampling of larger
number of individuals. Secondly, there may be a proportion of individuals that are pre-disposed to
philopatry and a proportion that are dispersive, leading to a bimodal distribution of dispersal distance.
Sampling from the dispersive individuals requires greater sample sizes which, in turn, provide better
estimates of dispersal. Estimates of philopatry in odonates vary markedly between species, from
1.5% recaptures to 90.2% recaptures (Beirinckx et al. 2006), while this study found a recapture rate of
29.0% (Rouquette and Thompson 2007). Philopatry is also present in mammals (Waser and Jones
1983) and birds, where a review of passerine birds showed levels of philopatry between 0% and
39.7% (Weatherhead and Forbes 1994). A wide variety of factors have been implicated in affecting
the extent to which odonates disperse. These include body size (Anholt 1990; cf. Conrad et al. 2002;
Thompson 1991) – a pattern which is seen across taxa (Jenkins et al. 2007) – immune activity
(Suhonen et al. 2009), ectoparasitic mite burden (Conrad et al. 2002), sex (Beirinckx et al. 2006;
Conrad et al. 2002) and age {Michiels, 1991 #1340}. This age-dependent dispersal tendency could
potentially result in increased dispersal later in the season. However, we find no evidence of this in
the present study. Female polymorphisms (Bots et al. 2009), proximity to range margins (Hassall and
Thompson 2008b) and landscape structure (Taylor and Merriam 1995) have also been suggested as
factors affecting flight ability via changes in morphology.
The logistical constraints placed on studies that seek to characterise dispersal may be eased with the
development of novel technologies. Chief among these is radio-tracking, the use of which is generally
limited to larger vertebrates and some terrestrial invertebrates. However, the technology has also
been adapted for terrestrial beetles (Rink and Sinsch 2007), bees (Sumner et al. 2007) and even
aquatic fly larvae (Hayashi and Nakane 1989). Radio frequency identification (RFID) tags have now
been used to track the movements of individual Anax junius (Drury) on their annual migration over
North America (Wikelski et al. 2006), although this species is one of the largest and strongest flyers
out of the Odonata. An alternative method which has successfully been applied to smaller insects,
including bees (Riley et al. 1996) and butterflies (Cant et al. 2005) is harmonic radar. The recent,
preliminary application of this technique to odonates (Libellula fulva (Müller) and Aeshna mixta
(Latreille)) suggests that this may be a profitable area of research in the future (Hardersen 2007).
However, the current limits to the range of the radar (1 km, Cant et al. 2005) make it unsuitable for
detecting LDD. The alternative group of methods rely on the quantification of genetic variation across
the landscape (e.g. Watts et al. 2007). Arguably this is the more valuable technique in terms of
conservation management, as it incorporates the movement of genes and not just the movement of
individuals. However, the measurement of gene-flow depends on the magnitude of genetic variation
within and between the studied populations, which, in the case of C. mercuriale, can be very low
(Watts et al. 2006). Furthermore, there is conflicting evidence for a correlation between "direct
observations" of dispersal (i.e. mark-recapture studies) and "indirect observations" of dispersal (e.g.
gene-flow estimates) (Koenig et al. 1996; but cf Bohonak 1999).
In order to make full use of dispersal data (Rouquette and Thompson 2007), knowledge about habitat
requirements (Rouquette and Thompson 2005) and population genetics (Watts et al. 2006) of C.
mercuriale, information is required concerning its rates of persistence in habitats. Currently this exists
7
only for a handful of North American odonates (Gibbons et al. 2002). Incorporating persistence with
dispersal, habitat and population genetics data would permit both metapopulation modelling and
population viability analysis approaches to be used in the prediction and management of C.
mercuriale. This is of particular relevance given the current decline of the species (Boudot 2006) and
the low genetic variability found in some populations (Watts et al. 2006).
The “pandemic lack of data” not only in dispersal ecology but in conservation biology as a whole has
led to the application of theory without due consideration to its limitations (Doak and Mills 1994).
Despite the enormity of the dispersal literature, “there are...disappointingly few available estimates of
dispersal variables from natural populations” (Macdonald and Johnson 2001). This is particularly the
case with LDD, which is the aspect of dispersal that is both the most important to conservation biology
and most difficult to measure (Trakhtenbrot et al. 2005). The amount of money required to produce a
viable, long-term network of habitat conservation areas in the United States has been estimated at
$5-8 billion per year over 40 years (Lerner et al. 2007). However, the implementation of networks of
habitat conservation areas is undermined by the current lack of understanding concerning how
animals may move between (Schultz 1998) and even within (Woodroffe and Ginsberg 1998) those
areas. Clearly planning for the allocation of such a vast sum of money requires a firm evidence base
from which to draw.
In addition to the design of static nature reserves, the onset of global climate change has enhanced
the need to understand how species move through the landscape. Range shifts have been well-
documented in a range of taxa (Hickling et al. 2006; Parmesan 2006), but it is unclear whether these
species are keeping pace with shifting isotherms. Synergistic effects of climate change and habitat
loss have been demonstrated using modelling approaches (Travis 2003), with range shifts hindered
by poorly connected habitat (Opdam and Wascher 2004). This has led to concerns that static nature
reserves may be insufficient to protect wildlife in the face of climate-induced range shifts (Araújo et al.
2004).
Mark-recapture or capture resight methods have been used to study dispersal in invertebrates such
as beetles (Turchin and Thoeny 1993), snails (Baur 1986) and odonates (Rouquette and Thompson
2007), as well as in small (Diffendorfer et al. 1995) and large mammals (Støen et al. 2006), birds
(Haas 1995) and whales (Smith et al. 1999). Many such studies produce data which is amenable to
validation using our methods. Future study design should include aspects of the dispersal of the focal
species that have previously been studied, such as the maximum dispersal distance recorded with
different numbers of recaptured individuals. The spatial scale of the experiment may still be important
but this importance may lie in ensuring a sufficient number of individuals are included. Analyses of
results of these types of studies should include sub-sampling of data to ensure that the final results
are independent of the scope of the study.
Acknowledgements
The fieldwork was funded by the Natural Environment Research Council (NER/A/S/2000/01322) and
the Environment Agency. We thank Tim Sykes for his enthusiasm and help at all stages of the project
and Jim Rouquette for his project management skills. Dan Bert, Kath Allen, Tom Sherratt and Brett
Sandercock provided valuable comments on the manuscript. Coenagrion mercuriale is protected
under Schedule 5 of the UK Wildlife & Countryside Act (1981) and all work was carried out under
licence from Natural England. CH was funded by a Government of Canada Postdoctoral Research
Fellowship.
8
References
Allen KA, Thompson DJ (2009) Movement characteristics of the Scarce Blue-tailed Damselfly,
Ischnura pumilio. Insect Conservation and Diversity, 3: 5-14.
Angelibert S, Giani N (2003) Dispersal characteristics of three odonate species in a patchy habitat.
Ecography, 26: 13-20.
Anholt BR (1990) Size-biased dispersal prior to breeding in a damselfly. Oecologia, 83: 385-387.
Araújo MB, Cabezas M, Thuiller W, Hannah L, Williams PH (2004) Would climate change drive
species out of reserves? An assessment of existing reserve-selection methods. Global Change
Biology, 10: 1618-1626.
Baker M, Nur N, Geupel GR (1995) Correcting biased estimates of dispersal and survival due to
limited study area: theory and an application using wrentits. Condor, 97: 663-674.
Barrowclough GF (1978) Sampling bias in dispersal studies based on finite area. Bird-Banding, 49:
333-341.
Baur B (1986) Patterns of dispersion, density and dispersal in alpine populations of the land snail
Arianta arbustorum (L.) (Helicidae). Ecography, 9: 117-125.
Beirinckx K, Van Gossum H, Lajeunesse MJ, Forbes MR (2006) Sex biases in dispersal and
philopatry: insights from a meta-analysis based on capture-mark-recapture studies of damselflies.
Oikos, 113: 539-547.
Bohonak AJ (1999) Dispersal, gene flow, and population structure. The Quarterly Review of Biology,
74: 21-45.
Bots J, Breuker CJ, Van Kerkhove A, Van Dongen S, De Bruyn L, Van Gossum H (2009) Variation in
flight morphology in a female polymorphic damselfly: intraspecific, intrasexual, and seasonal
differences. Canadian Journal of Zoology, 87: 86-94.
Boudot J-P (2006) Coenagrion mercuriale. In: IUCN 2009. IUCN Red List of Threatened Species.
Version 2009.1 www.iucnredlist.org, Accessed 26 October 2009.
Burnham KP, Anderson DR (2002) Model Selection and Multimodel Inference: A Practical
Information-Theoretic Approach, 2nd edn. Springer-Verlag, New York.
Cant ET, Smith AD, Reynolds DR, Osborne JL (2005) Tracking butterfly flight paths across the
landscape with harmonic radar. Proceedings of the Royal Society - Biological Sciences (B), 272: 785-
790.
Conrad KF, Willson KH, Harvey IF, Thomas CJ, Sherratt TN (1999) Dispersal characteristics of seven
odonate species in an agricultural landscape. Ecography, 22: 524-531.
Conrad KF, Willson KH, Whitfield K, Harvey IF, Thomas CJ, Sherratt TN (2002) Characteristics of
dispersing Ischnura elegans and Coenagrion puella (Odonata): Age, sex, size, morph and
ectoparasitism. Ecography, 25: 439-445.
Corbet PS (1962) A Biology of Dragonflies Witherby, London.
Corbet PS (1999) Dragonflies: Behaviour and Ecology of Odonata Harley, Colchester.
Diffendorfer JE, Gaines MS, Holt RD (1995) Habitat fragmentation and movements of three small
mammals (Sigmodon, Microtus, and Peromyscus). Ecology, 76: 827-839.
Doak DF, Mills LS (1994) A Useful Role for Theory in Conservation. Ecology, 75: 615-626.
Franzén M, Nilsson SG (2007) What is the required minimum landscape size for dispersal studies?
Journal of Animal Ecology, 76: 1224-1230.
Gibbons LK, Reed JM, Chew FS (2002) Habitat requirements and local persistence of three damselfly
species (Odonata: Coenagrionidae). Journal of Insect Conservation, 6: 47-55.
Haas CA (1995) Dispersal and use of corridors by birds in wooded patches on an agricultural
landscape. Conservation Biology, 9: 845-854.
Hardersen S (2007) Telemetry of Anisoptera after emergence - first results (Odonata). International
Journal of Odonatology, 10: 189-202.
Hassall C, Thompson DJ (2008a) The impacts of environmental warming on Odonata: a review.
International Journal of Odonatology, 11: 131-153.
9
Hassall C, Thompson DJ (2008b) Latitudinal variation in morphology in two sympatric damselfly
species with contrasting range dynamics (Odonata: Coenagrionidae). European Journal of
Entomology, 105: 939-944.
Hayashi F, Nakane M (1989) Radio tracking and activity monitoring of the dobsonfly larva,
Protohermes grandis (Megaloptera: Corydalidae). Oecologia, 78: 468-472.
Hickling R, Roy DB, Hill JK, Fox R, Thomas CD (2006) The distributions of a wide range of taxonomic
groups are expanding polewards. Global Change Biology, 12: 1-6.
Hunger H, Röske W (2001) Short-range dispersal of the southern damselfly (Coenagrion mercuriale)
defined experimentally using UV fluorescent ink. Zeitschrift für Ökologie und Naturschutz, 9: 181-187.
Jenkins DG, Brescacin CR, Duxbury CV, Elliott JA, Evans JA, Grablow KR, Hillegass M, Lyon BN,
Metzger GA, Olandese ML, Pepe D, Silvers GA, Suresch HN, Thompson TN, Trexler CM, Williams
GE, Williams NC, Williams SE (2007) Does size matter for dispersal distance? Global Ecology and
Biogeography, 16: 415.
Koenig WD, Van Vuren D, Hooge PN (1996) Detectability, philopatry, and the distribution of dispersal
distances in vertebrates. Trends in Ecology & Evolution, 11: 514-517.
Lerner J, Mackey J, Casey F (2007) What's in Noah's Wallet? Land conservation spending in the
United States. Bioscience, 57: 419-423.
Macdonald DW, Johnson DDP (2001) Dispersal in theory and practice: consequences for
conservation biology. In: J. Clobert, E. Danchin, A.A. Dhondt & J.D. Nichols (ed) Dispersal. Oxford
University Press, Oxford.
Opdam P, Wascher D (2004) Climate change meets habitat fragmentation: Linking landscape and
biogeographical scale levels in research and conservation. Biological Conservation, 117: 285-297.
Parmesan C (2006) Ecological and evolutionary responses to recent climate change. Annual Review
of Ecology, Evolution and Systematics, 37: 637-669.
Purse BV, Hopkins GW, Day KJ, Thompson DJ (2003) Dispersal characteristics and management of
a rare damselfly. Journal of Applied Ecology, 40: 716-728.
Riley JR, Smith AD, Reynolds DR, Edwards AS, Osborne JL, Williams IH, Carreck NL, Poppy GM
(1996) Tracking bees with harmonic radar. Nature, 379: 29-30.
Rink M, Sinsch U (2007) Radio-telemetric monitoring of dispersing stag beetles: implications for
conservation. Journal of Zoology, 272: 235-243.
Rouquette JR, Thompson DJ (2005) Habitat associations of the endangered damselfly, Coenagrion
mercuriale, in a water meadow ditch system in southern England. Biological Conservation, 123: 225-
235.
Rouquette JR, Thompson DJ (2007) Patterns of movement and dispersal in an endangered damselfly
and the consequences for its management. Journal of Applied Ecology, 44: 692-701.
Schneider C (2003) The influence of spatial scale on quantifying insect dispersal: an analysis of
butterfly data. Ecological Entomology, 28: 252-256.
Schultz CB (1998) Dispersal behavior and its implications for reserve design in a rare Oregon
butterfly. Conservation Biology, 12: 284-292.
Slatkin M (1985) Gene flow in natural populations. Annual Review of Ecology and Systematics, 16:
393-430.
Smith TD, Allen J, Clapham PJ, Hammond PS, Katona S, Larsen F, Lien J, Mattila D, Palsbøll PJ,
Sigurjónsson J, Stevick PT, ØIen N (1999) An ocean-basin-wide mark-recapture study of the north
atlantic humpback whale (Megaptera novaeangliae). Marine Mammal Science, 15: 1-32.
Stettmer C (1996) Colonisation and dispersal patterns of banded (Calopteryx splendens) and
beautiful demoiselles (C. virgo) (Odonata: Calopterygidae) in south-east German streams. European
Journal of Entomology, 93: 579-593.
Støen O-G, Zedrosser A, Sæbø S, Swenson J (2006) Inversely density-dependent natal dispersal in
brown bears Ursus arctos. Oecologia, 148: 356-364.
Suhonen J, Honkavaara J, Rantala MJ (2009) Activation of the immune system promotes insect
dispersal in the wild. Physiological Ecology, Online early: DOI 10.1007/s00442-009-1470-2.
10
Sumner S, Lucas E, Barker J, Isaac N (2007) Radio-tagging technology reveals extreme nest-drifting
behavior in a eusocial insect. Current Biology, 17: 140-145.
Taylor PD, Merriam G (1995) Wing morphology of a forest damselfly is related to landscape structure.
Oikos, 73: 43-48.
Thompson DJ (1991) Size-biased dispersal prior to breeding in a damselfly: conflicting evidence from
a natural population. Oecologia, 87: 600-601.
Thompson DJ, Purse BV (1999) A search for long-distance dispersal in the southern damselfly,
Coenagrion mercuriale (Charpentier). Journal of the British Dragonfly Society, 15: 46-50.
Trakhtenbrot A, Nathan R, Perry G, Richardson DM (2005) The importance of long-distance dispersal
in biodiversity conservation. Diversity and Distributions, 11: 173-181.
Travis JMJ (2003) Climate change and habitat destruction: a deadly anthropogenic cocktail.
Proceedings of the Royal Society - Biological Sciences (Series B), 270: 467-473.
Turchin P, Thoeny WT (1993) Quantifying dispersal of southern pine beetles with mark-recapture
experiments and a diffusion model. Ecological Applications, 3: 187-198.
Ward L, Mill PJ (2007) Long range movements by individuals as a vehicle for range expansion in
Calopteryx splendens (Odonata: Zygoptera). European Journal of Entomology, 104: 195-198.
Waser PM, Jones WT (1983) Natal philopatry among solitary mammals. Quarterly Review of Biology,
58: 355-390.
Watts PC, Rouquette JR, Saccheri IJ, Kemp SJ, Thompson DJ (2004) Molecular and ecological
evidence for small-scale isolation by distance in an endangered damselfly, Coenagrion mercuriale.
Molecular Ecology, 13: 2931-2945.
Watts PC, Rousset F, Saccheri IJ, Leblois R, Kemp SJ, Thompson DJ (2007) Compatible genetic and
ecological estimates of dispersal rates in insect (Coenagrion mercuriale: Odonata: Zygoptera)
populations: Analysis of 'neighbourhood size' using a more precise estimator. Molecular Ecology, 16:
737-751.
Watts PC, Saccheri IJ, Kemp SJ, Thompson DJ (2006) Population structure and the impact of
regional and local habitat isolation upon levels of genetic diversity of the endangered damselfly
Coenagrion mercuriale (Odonata: Zygoptera). Freshwater Biology, 51: 193-205.
Weatherhead PJ, Forbes MRL (1994) Natal philopatry in passerine birds: genetic or ecological
influences? Behav. Ecol., 5: 426-433.
Wikelski M, Moskowitz D, Adelham JS, Cochran J, Wilcove DS, May ML (2006) Simple rules guide
dragonfly migration. Biology Letters, 2: 325-329.
Woodroffe R, Ginsberg JR (1998) Edge Effects and the Extinction of Populations Inside Protected
Areas. Science, 280: 2126-2128.
11
Figures
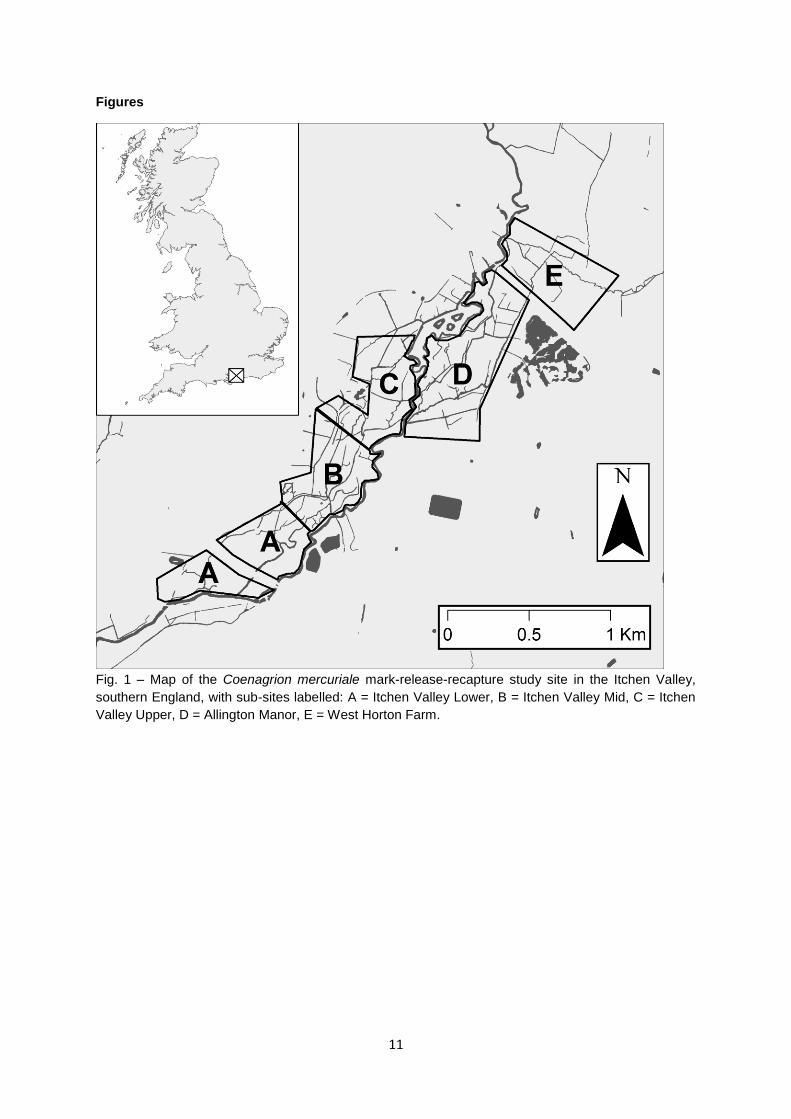
Fig. 1 – Map of the Coenagrion mercuriale mark-release-recapture study site in the Itchen Valley,
southern England, with sub-sites labelled: A = Itchen Valley Lower, B = Itchen Valley Mid, C = Itchen
Valley Upper, D = Allington Manor, E = West Horton Farm.

12
Fig. 2 – Diagram showing how subsets of the spatial (left) and temporal (right) extent of the original
study were defined. Each column corresponds to a different sub-site (see diagram at the base of the
columns) or week in the study (see dates at the base of the columns) and shading indicates the
inclusion of data from that specific sub-site or week in the model. Each row corresponds to a different
combination of the sub-sites or weeks. Each of the 15 spatial configurations is combined with each
of the 21 temporal configurations to give the 315 model runs described in the text.
13
Fig. 3 – Relationships between median and maximum gross dispersal distances and spatial extent of
the study site. Panels show different lengths of study. Each point is a simulated study.

14
Fig. 4 – Relationship between the median and maximum dispersal distances detected in simulated
studies and the number of individuals recaptured. Panels show different lengths of study. Each point
is a simulated study.

15
Fig. 5 – Effect of length of study on the median dispersal distance recorded for Coenagrion
mercuriale. Error bars are 1 SE.
16
Fig. 6 – Comparison of the relationship between the number of recaptured individuals and the
maximum dispersal distance recorded in previous mark-release-recapture studies on damselflies
(open circles) with results from this study (closed circles – data shown are for six-week-long studies).
Studies are: A=Hunger and Röske (2001), B=Allen and Thompson (2009), C=Ward and Mill (2007),
D= Purse et al. (2003), E=Stettmer (1996), F=Purse et al. (2003), G=Allen and Thompson (2009).