Christopher Dougherty EC220 - Introduction to econometrics (review chapter) Slideshow: expected...
17
Christopher Dougherty EC220 - Introduction to econometrics (review chapter) Slideshow: expected value of a random variable Original citation: Dougherty, C. (2012) EC220 - Introduction to econometrics (review chapter). [Teaching Resource] © 2012 The Author This version available at: http://learningresources.lse.ac.uk/141/ Available in LSE Learning Resources Online: May 2012 This work is licensed under a Creative Commons Attribution-ShareAlike 3.0 License. This license allows the user to remix, tweak, and build upon the work even for commercial purposes, as long as the user credits the author and licenses their new creations under the identical terms. http://creativecommons.org/licenses/by-sa/3.0/ http://learningresources.lse.ac.uk/
-
Upload
alexus-cooksey -
Category
Documents
-
view
229 -
download
0
Transcript of Christopher Dougherty EC220 - Introduction to econometrics (review chapter) Slideshow: expected...

Christopher Dougherty
EC220 - Introduction to econometrics (review chapter)Slideshow: expected value of a random variable
Original citation:
Dougherty, C. (2012) EC220 - Introduction to econometrics (review chapter). [Teaching Resource]
© 2012 The Author
This version available at: http://learningresources.lse.ac.uk/141/
Available in LSE Learning Resources Online: May 2012
This work is licensed under a Creative Commons Attribution-ShareAlike 3.0 License. This license allows the user to remix, tweak, and build upon the work even for commercial purposes, as long as the user credits the author and licenses their new creations under the identical terms. http://creativecommons.org/licenses/by-sa/3.0/
http://learningresources.lse.ac.uk/

EXPECTED VALUE OF A RANDOM VARIABLE
1
The expected value of a random variable, also known as its population mean, is the weighted average of its possible values, the weights being the probabilities attached to the values.
Definition of E(X), the expected value of X:
n
iiinn pxpxpxXE
111 ...)(

Definition of E(X), the expected value of X:
EXPECTED VALUE OF A RANDOM VARIABLE
2
Note that the sum of the probabilities must be unity, so there is no need to divide by the sum of the weights.
n
iiinn pxpxpxXE
111 ...)(

xi
x1
x2
x3
x4
x5
x6
x7
x8
x9
x10
x11
3
EXPECTED VALUE OF A RANDOM VARIABLE
This sequence shows how the expected value is calculated, first in abstract and then with the random variable defined in the first sequence. We begin by listing the possible values of X.

xi pi
x1 p1
x2 p2
x3 p3
x4 p4
x5 p5
x6 p6
x7 p7
x8 p8
x9 p9
x10 p10
x11 p11
4
EXPECTED VALUE OF A RANDOM VARIABLE
Next we list the probabilities attached to the different possible values of X.
xi pi xi pi
x1 p1 x1 p1
x2 p2
x3 p3
x4 p4
x5 p5
x6 p6
x7 p7
x8 p8
x9 p9
x10 p10
x11 p11
5
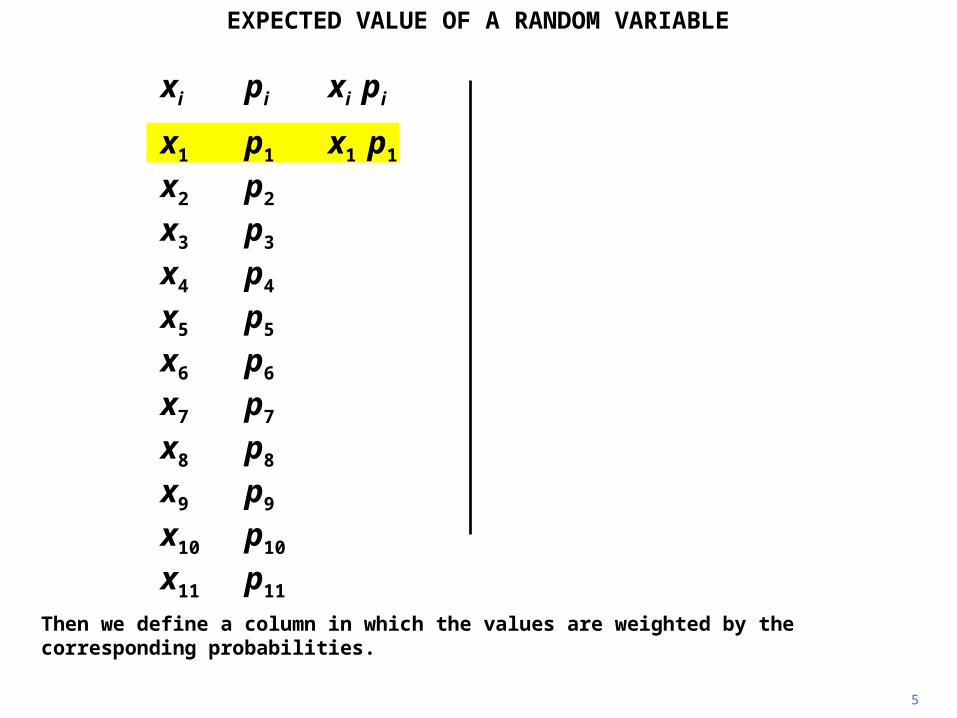
EXPECTED VALUE OF A RANDOM VARIABLE
Then we define a column in which the values are weighted by the corresponding probabilities.

xi pi xi pi
x1 p1 x1 p1
x2 p2 x2 p2
x3 p3
x4 p4
x5 p5
x6 p6
x7 p7
x8 p8
x9 p9
x10 p10
x11 p11
6
EXPECTED VALUE OF A RANDOM VARIABLE
We do this for each value separately.

xi pi xi pi
x1 p1 x1 p1
x2 p2 x2 p2
x3 p3 x3 p3
x4 p4 x4 p4
x5 p5 x5 p5
x6 p6 x6 p6
x7 p7 x7 p7
x8 p8 x8 p8
x9 p9 x9 p9
x10 p10 x10 p10
x11 p11 x11 p11
7
EXPECTED VALUE OF A RANDOM VARIABLE
Here we are assuming that n, the number of possible values, is equal to 11, but it could be any number.

xi pi xi pi
x1 p1 x1 p1
x2 p2 x2 p2
x3 p3 x3 p3
x4 p4 x4 p4
x5 p5 x5 p5
x6 p6 x6 p6
x7 p7 x7 p7
x8 p8 x8 p8
x9 p9 x9 p9
x10 p10 x10 p10
x11 p11 x11 p11
xi pi = E(X)
8
EXPECTED VALUE OF A RANDOM VARIABLE
The expected value is the sum of the entries in the third column.

xi pi xi pi xi pi
x1 p1 x1 p1 2 1/36
x2 p2 x2 p2 3 2/36
x3 p3 x3 p3 4 3/36
x4 p4 x4 p4 5 4/36
x5 p5 x5 p5 6 5/36
x6 p6 x6 p6 7 6/36
x7 p7 x7 p7 8 5/36
x8 p8 x8 p8 9 4/36
x9 p9 x9 p9 10 3/36
x10 p10 x10 p10 11 2/36
x11 p11 x11 p11 12 1/36
xi pi = E(X)
9
EXPECTED VALUE OF A RANDOM VARIABLE
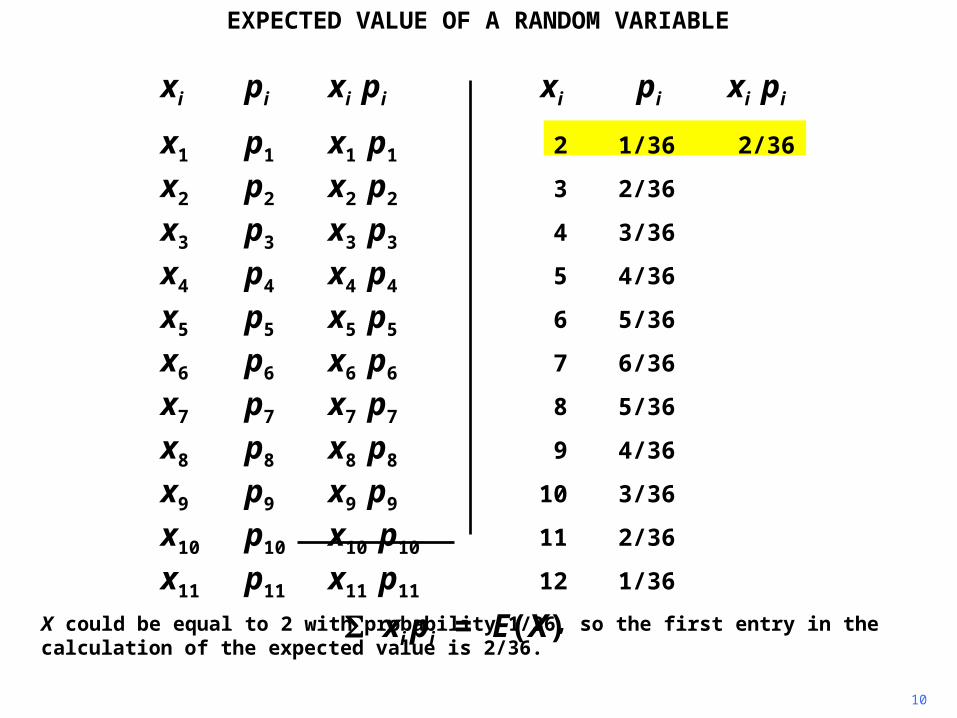
The random variable X defined in the previous sequence could be any of the integers from 2 to 12 with probabilities as shown.
xi pi xi pi xi pi xi pi
x1 p1 x1 p1 2 1/36 2/36
x2 p2 x2 p2 3 2/36
x3 p3 x3 p3 4 3/36
x4 p4 x4 p4 5 4/36
x5 p5 x5 p5 6 5/36
x6 p6 x6 p6 7 6/36
x7 p7 x7 p7 8 5/36
x8 p8 x8 p8 9 4/36
x9 p9 x9 p9 10 3/36
x10 p10 x10 p10 11 2/36
x11 p11 x11 p11 12 1/36
xi pi = E(X)
10
EXPECTED VALUE OF A RANDOM VARIABLE
X could be equal to 2 with probability 1/36, so the first entry in the calculation of the expected value is 2/36.

xi pi xi pi xi pi xi pi
x1 p1 x1 p1 2 1/36 2/36
x2 p2 x2 p2 3 2/36 6/36
x3 p3 x3 p3 4 3/36
x4 p4 x4 p4 5 4/36
x5 p5 x5 p5 6 5/36
x6 p6 x6 p6 7 6/36
x7 p7 x7 p7 8 5/36
x8 p8 x8 p8 9 4/36
x9 p9 x9 p9 10 3/36
x10 p10 x10 p10 11 2/36
x11 p11 x11 p11 12 1/36
xi pi = E(X)
11
EXPECTED VALUE OF A RANDOM VARIABLE
The probability of x being equal to 3 was 2/36, so the second entry is 6/36.

xi pi xi pi xi pi xi pi
x1 p1 x1 p1 2 1/36 2/36
x2 p2 x2 p2 3 2/36 6/36
x3 p3 x3 p3 4 3/36 12/36
x4 p4 x4 p4 5 4/36 20/36
x5 p5 x5 p5 6 5/36 30/36
x6 p6 x6 p6 7 6/36 42/36
x7 p7 x7 p7 8 5/36 40/36
x8 p8 x8 p8 9 4/36 36/36
x9 p9 x9 p9 10 3/36 30/36
x10 p10 x10 p10 11 2/36 22/36
x11 p11 x11 p11 12 1/36 12/36
xi pi = E(X)
12
EXPECTED VALUE OF A RANDOM VARIABLE
Similarly for the other 9 possible values.
xi pi xi pi xi pi xi pi
x1 p1 x1 p1 2 1/36 2/36
x2 p2 x2 p2 3 2/36 6/36
x3 p3 x3 p3 4 3/36 12/36
x4 p4 x4 p4 5 4/36 20/36
x5 p5 x5 p5 6 5/36 30/36
x6 p6 x6 p6 7 6/36 42/36
x7 p7 x7 p7 8 5/36 40/36
x8 p8 x8 p8 9 4/36 36/36
x9 p9 x9 p9 10 3/36 30/36
x10 p10 x10 p10 11 2/36 22/36
x11 p11 x11 p11 12 1/36 12/36
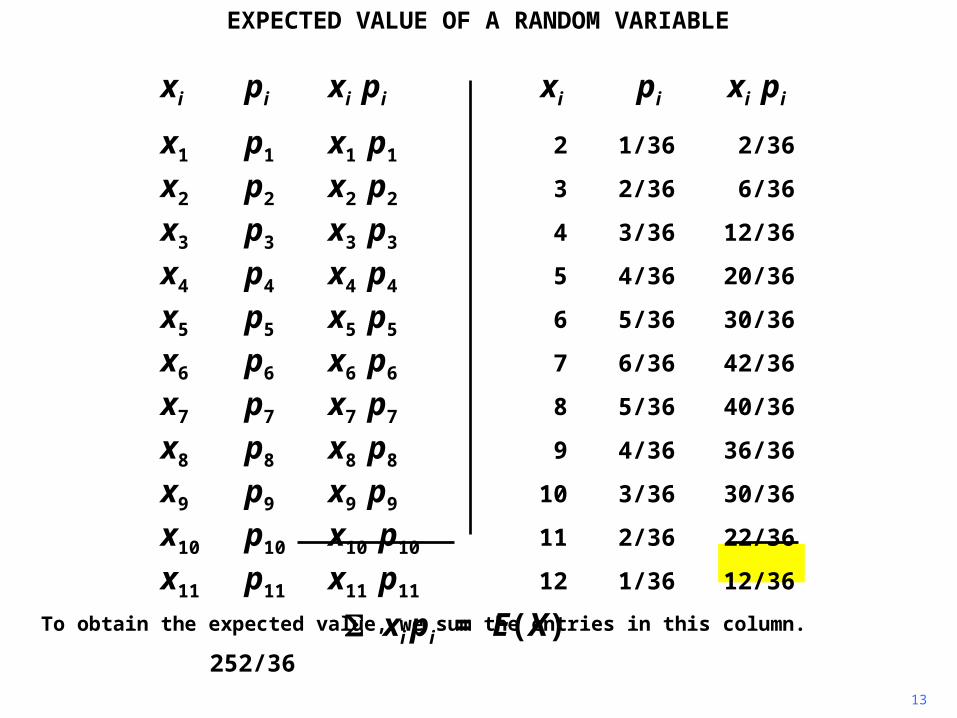
xi pi = E(X) 252/36
13
To obtain the expected value, we sum the entries in this column.
EXPECTED VALUE OF A RANDOM VARIABLE

14
The expected value turns out to be 7. Actually, this was obvious anyway. We saw in the previous sequence that the distribution is symmetrical about 7.
EXPECTED VALUE OF A RANDOM VARIABLE
xi pi xi pi xi pi xi pi
x1 p1 x1 p1 2 1/36 2/36
x2 p2 x2 p2 3 2/36 6/36
x3 p3 x3 p3 4 3/36 12/36
x4 p4 x4 p4 5 4/36 20/36
x5 p5 x5 p5 6 5/36 30/36
x6 p6 x6 p6 7 6/36 42/36
x7 p7 x7 p7 8 5/36 40/36
x8 p8 x8 p8 9 4/36 36/36
x9 p9 x9 p9 10 3/36 30/36
x10 p10 x10 p10 11 2/36 22/36
x11 p11 x11 p11 12 1/36 12/36
xi pi = E(X) 252/36 = 7

Very often the expected value of a random variable is represented by , the Greek m. If there is more than one random variable, their expected values are differentiated by adding subscripts to .
15
EXPECTED VALUE OF A RANDOM VARIABLE
Definition of E(X), the expected value of X:
Alternative notation for E(X): E(X) = X
n
iiinn pxpxpxXE
111 ...)(

Copyright Christopher Dougherty 2011.
These slideshows may be downloaded by anyone, anywhere for personal use.
Subject to respect for copyright and, where appropriate, attribution, they may be
used as a resource for teaching an econometrics course. There is no need to
refer to the author.
The content of this slideshow comes from Section R.2 of C. Dougherty,
Introduction to Econometrics, fourth edition 2011, Oxford University Press.
Additional (free) resources for both students and instructors may be
downloaded from the OUP Online Resource Centre
http://www.oup.com/uk/orc/bin/9780199567089/.
Individuals studying econometrics on their own and who feel that they might
benefit from participation in a formal course should consider the London School
of Economics summer school course
EC212 Introduction to Econometrics
http://www2.lse.ac.uk/study/summerSchools/summerSchool/Home.aspx
or the University of London International Programmes distance learning course
20 Elements of Econometrics
www.londoninternational.ac.uk/lse.
11.07.25