
Christmas Island Geographic Information System … · Christmas Island Geographic Information...
102
Christmas Island Geographic Information System System Documentation 2006 Release Prepared for the Territories Office, Commonwealth Department of Transport and Regional Services by Keith Porritt and Jonathon Conkey Geoscience Australia Commonwealth Department of Industry, Tourism and Resources 2006 GA Catalogue #61838
Transcript of Christmas Island Geographic Information System … · Christmas Island Geographic Information...

Christmas Island
Geographic Information System System Documentation
2006 Release
Prepared for the Territories Office, Commonwealth Department of
Transport and Regional Services
by Keith Porritt and Jonathon Conkey Geoscience Australia
Commonwealth Department of Industry, Tourism and Resources
2006
GA Catalogue #61838

Christmas Island GIS 2006 Page 2 of 102
Disclaimer The data in this GIS were assembled by the Mineral Resources and Advice Project of the Geoscience Australia (GA). In compiling the product, GA has translated and integrated data as received from many other sources. GA has undertaken initial checks as to the accuracy or completeness of these externally supplied datasets and the result of these examinations are reported throughout this documentation manual. It should be noted that the Christmas Island GIS datasets may contain information that is not totally accurate or complete. Therefore you should not rely solely on the information in this GIS when making a commercial decision. Please read the accompanying documentation and where further information is required please contact: Eddie West Territories Office Perth Department of Transport and Regional Services PO BOX Z5048, Perth, 6831 Ph: (08) 9225-1404 Fax: (08) 9225-1419 or John Wildermuth Christmas Island Administration PO Box 863 Christmas Island Indian Ocean 6798 Ph: 08 9164 7901 ext 7913 Fax: 08 9164 8245 [email protected] The CIGIS manuals and CD ROMs should remain with your employer if you leave your present position to work for another organisation.
1/03/2007 Page 2 of 102
Christmas Island GIS 2006 Page 3 of 102
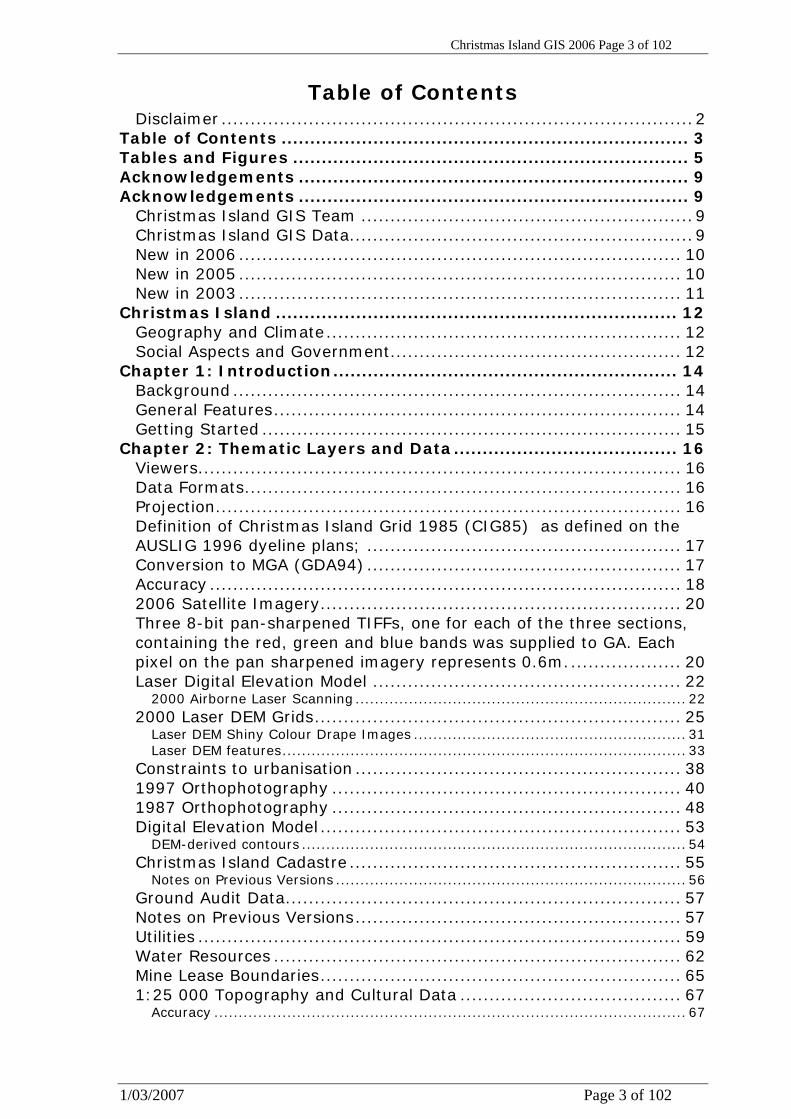
Table of Contents Disclaimer .................................................................................2
Table of Contents ....................................................................... 3 Tables and Figures ..................................................................... 5 Acknowledgements .................................................................... 9 Acknowledgements .................................................................... 9
Christmas Island GIS Team .........................................................9 Christmas Island GIS Data...........................................................9 New in 2006 ............................................................................ 10 New in 2005 ............................................................................ 10 New in 2003 ............................................................................ 11
Christmas Island ...................................................................... 12 Geography and Climate............................................................. 12 Social Aspects and Government.................................................. 12
Chapter 1: Introduction............................................................ 14 Background ............................................................................. 14 General Features...................................................................... 14 Getting Started ........................................................................ 15
Chapter 2: Thematic Layers and Data....................................... 16 Viewers................................................................................... 16 Data Formats........................................................................... 16 Projection................................................................................ 16 Definition of Christmas Island Grid 1985 (CIG85) as defined on the AUSLIG 1996 dyeline plans; ...................................................... 17 Conversion to MGA (GDA94) ...................................................... 17 Accuracy ................................................................................. 18 2006 Satellite Imagery.............................................................. 20 Three 8-bit pan-sharpened TIFFs, one for each of the three sections, containing the red, green and blue bands was supplied to GA. Each pixel on the pan sharpened imagery represents 0.6m.................... 20 Laser Digital Elevation Model ..................................................... 22
2000 Airborne Laser Scanning .................................................................... 22 2000 Laser DEM Grids............................................................... 25
Laser DEM Shiny Colour Drape Images ........................................................ 31 Laser DEM features................................................................................... 33
Constraints to urbanisation ........................................................ 38 1997 Orthophotography ............................................................ 40 1987 Orthophotography ............................................................ 48 Digital Elevation Model .............................................................. 53
DEM-derived contours ............................................................................... 54 Christmas Island Cadastre ......................................................... 55
Notes on Previous Versions ........................................................................ 56 Ground Audit Data.................................................................... 57 Notes on Previous Versions........................................................ 57 Utilities ................................................................................... 59 Water Resources ...................................................................... 62 Mine Lease Boundaries.............................................................. 65 1:25 000 Topography and Cultural Data ...................................... 67
Accuracy ................................................................................................. 67
1/03/2007 Page 3 of 102

Christmas Island GIS 2006 Page 4 of 102
Data source ............................................................................................. 68 Manipulation of Data ................................................................................. 68 ‘Auslg25k’ national park boundaries ............................................................ 68
1:1 000 Detailed Topography and Cultural Data............................ 72 Accuracy ................................................................................................. 72 1:1000 scale National Park boundaries ........................................................ 73 Roads 1:25000 scale update ...................................................................... 77
Town Plan ............................................................................... 79 Crazy Ant Grid ......................................................................... 80 Pinnacle Field Boundaries .......................................................... 81 Vegetation .............................................................................. 82 Geology .................................................................................. 84 Valley Networks ....................................................................... 85 Irvine Hill Forest Boundaries ...................................................... 86
Christmas Island Animation Flyaround..................................... 87 GA Catalog details for the 2004 Christmas Island GIS (#61838) ..... 91
Chapter 3: cd-rom HTML documentation .................................. 93 Chapter 4: Metadata ................................................................. 94 Chapter 5: Ground Audit Listing ............................................... 95 Table 1: Order of fields in cadastre spreadsheet listing Chapter 6: Data Licensing and Agreements ........................................... 95 Chapter 6: Data Licensing and Agreements .............................. 96
Commonwealth Christmas Island GIS data licence ........................ 96 TO—DoLA Arrangement for cadastre ......................................... 100
Chapter 7: Ecowise Environmental Data Documentation ........ 101 Chapter 8: Christmas Island GIS Data CD-ROMs..................... 102
1/03/2007 Page 4 of 102

Christmas Island GIS 2006 Page 5 of 102
Tables and Figures Figure 1: Shows the roads and buildings shapefiles which have been
shifted to align with the background Laser DEM image. A high level of fit between the two can be seen........................................... 18
Figure 2: 2006 Satellite Imagery of eastern area of Christmas Island. 20Figure 3: 2006 Satellite imagery of a central area of Christmas Island
showing development of new buildings. .................................... 21 Figure 4: North-western edge of Christmas Island as shown by the 2006
Satellite Imagery................................................................... 21 Figure 5: Airborne Laser Scanning system components. ................... 22 Figure 7: Points from a laser last return shapefile – typical density. At
the roundabout. .................................................................... 24 Figure 8: Laser DEM tile plan of the eastern half of Christmas Island
flown 11-16 September 2000. ................................................. 24 Figure 9: Shapefiles containing locations in MGA (GDA94) of heights in
metres of the ground surface of the eastern half of Christmas Island. ................................................................................. 25
Figure 10: Interpolation methods showing the most noise due to flight path overlap using the spline method. Maximum detail with minimal flight path noise was produced using the IDW (power = 3, nearest neighbours = 7) .................................................................... 27
Figure 11: Image noise due to fight path overlap present when the spline interpolation method is used, and greatly reduced when the IDW method is used. ............................................................. 28
Figure 12: Shows data spikes present in the image when the spline interpolation method is used. These spikes are not present when the IDW method is used. ............................................................. 29
Figure 13: Laser DEM grids in the CIGIS GDA94. ............................. 30 Figure 14: Laser DEM shiny colour drape images. ............................ 32 Figure 15: Shiny colour drape Laser DEM image showing the regular
check pattern associated with overlapping edges of the airborne laser scanner flight paths........................................................ 33
Figure 16: 2000 Laser DEM image, 1987 DEM image and orthophotography of the same area of Christmas Island. The Laser DEM image shows topographic features which are not apparent in the 1987 DEM due to vegetation cover. .................................... 34
Figure 17: 2000 Laser DEM image, 1987 DEM image and orthophotography of the Poon Saan area of Christmas Island. The laser DEM image shows the ground surface beneath the trees in the SE. ...................................................................................... 34
Figure 18: Caves and sinkholes (in the vicinity of the research station) amongst thick rainforest become apparent on the colour images derived from the 2000 laser DEM............................................. 35
Figure 19: The 2000 laser DEM reveals gullies in the forest. The gullies are interpreted as being due to near surface volcanic rocks that cause runoff and groundwater outflow resulting in the erosion seen. This example is down slope from the dryers at Drumsite. ............ 36
1/03/2007 Page 5 of 102

Christmas Island GIS 2006 Page 6 of 102
Figure 20: 2000 Laser DEM of coastline South of the golf course showing ground features not previously shown by orthophotography or contour lines due to the heavy vegetation cover. This has been interpreted as a land slip that occurred a long time ago. ............. 37
Figure 21: 1987 orthophotography of the same area as figure 17 with contour lines derived from stereo plotting of the 1987 aerial photography. Due to the dense vegetation cover the cliff faces and broken terrain are not evident. ................................................ 37
Figure 22: Shows whole of Christmas Island classified as either severely constrained, mildly constrained, moderately constrained or unconstrained for urbanisation or development.......................... 40
Figure 23: An image captured from the Christmas Island GIS orthophotography at approximately 1:800 scale, showing clarity and resolution of land and underwater features. The current orthophotography was created from aerial photography flown in 1997.................................................................................... 41
Figure 24: Laecena (dark grey – green stipple pattern) growing along tracks, Saw Tooth Fern (pale green growing amongst pinnacles in areas of higher grade phosphate) and Macaranga regrowth trees (bright green). ...................................................................... 42
Figure 25: Flight lines and photo centres of the 1997 aerial photographs used for the Christmas Island GIS orthophotography. Flight lines are numbered at one end of the line......................................... 43
Figure 26: Shows the limits of the 1997 orthophotography coverage. . 43 Figure 27: Index of the 1997 orthophotography showing the names and
limits of each orthophotography coverage. Each .ecw file is associated with an .ers file which georeferences the image. The index file is stored as a shapefile (97_ecw_plan.shp) for use within ArcView and ArcExplorer......................................................... 44
Figure 28: Index of the orthophotography showing the names and extent of each orthophotography tile made to date. Each .tif file is associated with a .tfw file which georeferences the image. The index file is stored as a shapefile (97_1ktilebnd.shp) for use within ArcView and ArcExplorer......................................................... 44
Figure 29: 1997 orthophotography example showing National Parks Australia nursery. .................................................................. 45
Figure 30: 1997 orthophotography example in the vicinity of Rocky Point suburb. ................................................................................ 45
Figure 31: 1997 orthophotography example showing newer homes in west Silver City. .................................................................... 46
Figure 32: 1997 orthophotography example showing the Christmas Island hospital. ..................................................................... 46
Figure 33: 1987 orthophotography showing fill being spread over mined pinnacles at Toms Ridge. ........................................................ 47
Figure 34: 1997 orthophotography of the same site at Toms Ridge ten years later............................................................................ 47
Figure 35: An image captured from the Christmas Island GIS orthophotography at approximately 1:800 scale, showing clarity and resolution of land and underwater features................................ 48
1/03/2007 Page 6 of 102

Christmas Island GIS 2006 Page 7 of 102
Figure 36: One Km graticule providing the base layout for the 157 1Km X 1Km orthophotography tiles created for the Christmas Island GIS from the 1987 aerial photographs. Where a tile would have only a small land component it was generally amalgamated with the adjacent tile and the top left number for the joined pair was used (see Fig. 6)........................................................................... 50
Figure 37: Flight lines and photo circles of the 1987 aerial photographs used for the Christmas Island GIS orthophotography. Flight lines are numbered at one end of the line......................................... 51
Figure 38: Index of the orthophotography showing the names and extents of each orthophotography tile. Each ‘.tif’ file is associated with a ‘.tfw’ file which georeferences the image. The index file is stored as a shapefile (‘1ktilebnd.shp’) for use within ArcView and ArcExplorer projects............................................................... 52
Figure 39: Three-dimensional drape of orthophotography over DEM (South Point area), showing that the DEM surface is not always the ground surface. In this case much of the DEM surface is tree canopy. The DEM cell size over rainforest is 5 metres, while over disturbed areas it is 1 metre. .................................................. 53
Figure 40: Shiny colour drape DEM tiles supplied with the CIGIS. Further tiles can be generated by GA. The colour range for each tile has been generated so as to give a maximum of information, hence colours may not match at adjoining edges. ............................... 54
Figure 41: Highlighting differences in current and lodged. As the current layer is assumed to have been digitised (email from DLI 14-Feb-‘05), when lodged data is integrated the area is spatially upgraded with the new survey data (lodged data) as this is assumed to be more accurate....................................................................... 56
Figure 42: All utilities layers with default symbology in Poon Saan area............................................................................................ 59
Figure 43: Default drainage symbology if the GHD font is not installed............................................................................................ 60
Figure 44: Examples of utilities legends in ArcView after installation of the font containing the GHD symbol set. ................................... 61
Figure 45: Christmas Island Aquifer classification map produced by Ecowise - from the Ecowise Groundwater Investigations and Monitoring Report November 1999........................................... 63
Figure 46: Register of National Estate attributes for the Administrators House are shown in the 'Identify Results' dialog box................... 64
Figure 47: Mine Lease 133B with orthophotography. ........................ 65 Figure 48: Coastline, Cliffs, Streams, Pools and National Park (1:25000
data). .................................................................................. 69 Figure 49: Vegetation of Christmas Island (1:25000 data). ............... 70 Figure 50: Built Environment (1:25000 data, township region). ......... 70 Figure 51: Ten metre contours (1:25000 data)................................ 71 Figure 52: Spot height data points (1:25000 data). ......................... 71 Figure 53: Screen capture of part of Rocky Point showing typical line
and point features of the 1:1000 detail survey data. This data was
1/03/2007 Page 7 of 102

Christmas Island GIS 2006 Page 8 of 102
digitised directly from the 1987 aerial photography so when compared to the orthophotography it matches very well. ............ 72
Figure 54: Point infrastructure of north-east region (1:1000 data). .... 74 Figure 55: Line Infrastructure of north-east region (1:1000 data, detail
of phosphate loading area, Flying Fish Cove). ............................ 74 Figure 56: Vegetation of north-east region (1:1000 data, detail of Poon
Saan Area with roads added for reference)................................ 75 Figure 57: One metre urban and two metre elsewhere contours of
north-east region (1:1000 data). ............................................. 76 Figure 58: Spot heights for north-east region (1:1000 data) ............. 76 Figure 59: Spatial and attribute updates from the Shire of Christmas
Island roads shapefile. ........................................................... 77 Figure 60: The updated roads file showing the alterations made to the
Golf Course and Casino Road and also the intersection of Lily Beach Road and Quarry Road. .......................................................... 78
Figure 61: Data from the Christmas Island Town Planning Scheme (TPS) as prepared by the WA Ministry of Planning............................... 79
Figure 62: Crazy ant grid showing concentration of ants at each site. . 81 Figure 63: Pinnacle field area east of the airport (50m across N-S). The
automated classification process has produced a smooth boundary at this close scale. ................................................................. 82
Figure 64: Vegetation boundaries in the southern coastline of Christmas Island. ................................................................................. 83
Figure 65: Geology boundaries and lineations in the northern section of Christmas Island. .................................................................. 85
Figure 66: Valley Networks derived from the 1999 DEM of Christmas Island. ................................................................................. 86
Figure 67: Limits of the Irvine Hill forest boundaries with orthophotography as a backdrop.............................................. 87
Figure 68: Shows a bathymetry image captured from the beginning of the Christmas Island animation. .............................................. 88
Figure 69: Shows the terraces on South Point as captured from the Christmas Island animation..................................................... 88
Figure 70: Shows Flying Fish Cove as captured from the Christmas Island animation. Note large arcuate slip structure. ................... 89
Figure 71: Shows the Murray Hill area as at 1997 from the air as captured from the Christmas Island animation........................... 89
Figure 72: Christmas Island GIS GA Catalog entry — #61838. .......... 92
Table 1: Order of fields in cadastre spreadsheet listing ..................... 95
1/03/2007 Page 8 of 102

Christmas Island GIS 2006 Page 9 of 102
Acknowledgements
Christmas Island GIS Team The Mineral Resources and Advice Project of Geoscience Australia (GA) would like to acknowledge the support of Ms Deb Blaskett, Ms Roban Clarke and Mr. John Wildermuth of Territories Office whose efforts made the undertaking of this work possible. A number of people from GA contributed to the Christmas Island GIS. Dr. William McKay provided management support and advice. For the 2003 release, Ms Jane Bryan produced the 2000 Laser DEM images, converted the 2002 shapefiles into the MGA (GDA94) projection, and provided documentation edits and updates for the 2003 version of the GIS. For the October 2002 release, Mr. Kane Orr produced the data dictionary, provided documentation edits and updates of metadata sheets, and revamped the HTML document. Mr. Martin Sholtez developed a substantial proportion of the original HTML documentation and contributed data edits and documentation for a number of June 2001 datasets. Mr. Andrew Lucas had a substantial input to the development of the 1996, 2001, and 2002 versions of the Christmas Island GIS. Through this team effort, valuable spatial and attribute data that over time may have become lost are now widely distributed and readily accessible in one integrated system.
Christmas Island GIS Data The Commonwealth (usually Territories Office) commissioned data capture in a variety of projects over the last fifteen years for nearly all of the data. Geoscience Australia generated the 1997 orthophotography in 2002 from aerial photography flown by Fugro in November 1997. Geoscience Australia also generated the Laser DEM using data obtained from an airborne laser scanning survey of Christmas Island. This survey was conducted by AAM Surveys Pty Ltd in September 2000. BHP Engineering, Land Technologies Division generated orthophotography in 1996 from aerial photography flown by the Australian Survey Office Canberra on 16-Aug-87 to 1-Sep-87. The Australian Land Information Group (AUSLIG) Western Region office digitised cultural and topographic themes at 1:1,000 scale for Christmas Island in the early 1990's on behalf of Territories Office.
1/03/2007 Page 9 of 102

Christmas Island GIS 2006 Page 10 of 102
The Western Australian Ministry of Planning was commissioned by the Commonwealth Government to carry out a planning study that assembled the Town Planning Scheme data, which was completed on the 24th September 1996. The Western Australian Department of Lands Administration (DOLA) extracted the cadastre snapshot packaged on this cd-rom set from the DoLA database on 22-May-01. Responsibility for the cadastral information passed from AUSLIG to DOLA in 1992. On-going maintenance of cadastre is undertaken by DOLA under a Memorandum of Arrangement with Territories Office. AUSLIG, DOLA and the Australian Valuation Office (AVO) jointly developed data underpinning the March 1996 ground audit of Christmas Island through Australian Estate Management (AEM) as consultants to Territories Office. The Australian Land Information Group (AUSLIG) Canberra office digitised cultural and topographic themes at 1:25000 scale for the Christmas Island to produce the AUSLIG 1995 1:25,000 topographic map of Christmas Island. New in 2006 The 2006 release sees the inclusion of a new – user friendly interface for the accompanying cd-roms. A fifth cd-rom has also been included containing Christmas Island Utility CAD files. Additionally, Quickbird satellite imagery of Christmas Island has been incorporated. The imagery was commissioned by the Department of Environment and Heritage in mid 2003 and supplied to the Australian Government by DigitalGlobe in March 2006. It took this long (over 2 years) due to persistent scattered cloud over Christmas Island and many sensed scenes, not being up to 'cloud free' specifications. The Quickbird satellite recorded reflectance data of the islands in the red, green, blue, near infra-red and panchromatic bands, in 16 bit format. All sharpened imagery has a resolution of 0.6m/pixel.
New in 2005 In December of 2004 Geoscience Australia received the scheduled cadastral update for Christmas Island. As with the July version this contained two shape files. One contained current tenure, the other lodged changes to tenure. As described in the cadastre section of Chapter 2 these files were used in the creation of the current cadastre.shp and lodged.shp supplied with this release.
1/03/2007 Page 10 of 102

Christmas Island GIS 2006 Page 11 of 102
In January of 2005 Geoscience Australia received the scheduled update of the mine lease boundaries. As described in the Mine Lease section of Chapter 2 this contained both current and prospecting licenses, and was used to create the ‘minelease.shp’ and ‘mineral_tenements.shp’ supplied with this release. Geoscience Australia has also included on the CIGIS cd-roms a 3D animation flyaround of Christmas Island for use by CIGIS licenced users some sample images from this can be found on pages 85–87 of this manual.
New in 2003 Following on from the 2002 release of the Christmas Island GIS, Geoscience Australia has added a number of new features and layers. Most significantly is the Laser DEM shiny colour drape images and Laser DEM grids of the eastern half of Christmas Island. For the 2003 version of the CIGIS, all layers have been converted to the Map Grid of Australia (MGA) coordinate system using the GDA94 datum. For the purposes of the CIGIS, this coordinate system is equivalent to the UTM projection using the WGS84 datum, and means that the CIGIS now uses the coordinate system most commonly used in Australia, and is compatible with commonly used GPS. A plan of Christmas Island, with the entire Island classified as either mildly, moderately, or severely constrained to urbanisation or unconstrained to urbanisation is also present on the 2003 version of the CIGIS. See the “What’s new in 2003” section on cd-rom #1 for more detail about any of the above.
1/03/2007 Page 11 of 102

Christmas Island GIS 2006 Page 12 of 102
Christmas IslandChristmas Island is located in the Indian Ocean, at latitude 10° 30' South and longitude 105° 40' East. It is approximately 380 kilometres south of Java Head at the southern entrance to the Sunda Strait, approximately 1,350 kms from Singapore and approximately 2,650 kms from Perth. The nearest point of the Australian mainland is Northwest Cape which lies approximately 1,565 kms to the south east. The island has an area of 135 square kilometres.
Geography and Climate The Island is the summit of a submarine mountain. It rises steeply to a central plateau dominated by stands of rainforest. The plateau reaches heights of up to 361 metres and consists mainly of limestone with layers of volcanic rock. The Island's 80 kilometre coastline is an almost continuous sea cliff, ranging in height to 20 metres. In a few places (about 13) breaks in the cliff give way to shallow bays and small sand and coral beaches. The largest of these bays forms the Island's port at Flying Fish Cove. The Island is surrounded by an encircling coral reef. There is virtually no coastal shelf and the sea plummets to a depth of about 5000 metres within 200 metres of the shore. The climate is tropical and temperatures range from 21°C to 32°C. Humidity is around 80-90% and south-east trade winds provide pleasant weather for most of the year. During the wet season, between November and April it is common for some storm activity to occur, producing a swell in seas around the island. The average rainfall is 2,000 mm per annum.
Social Aspects and Government The 2001 Census indicated that there were 1408 people ordinarily resident in Christmas Island. Results from the 1996 census indicated that the population of the island has an ethnic composition of approximately 70% Chinese, 20% European and 10% Malay. Local Government legislation based on that of Western Australia was introduced in 1992. The Shire Council is comprised of nine members and has similar responsibilities to a local government in mainland Australia. For the purposes of enrolment and voting in federal elections, Christmas Island is an electoral district of the Commonwealth Division of the Northern Territory. The Commonwealth is currently responsible for delivering Commonwealth, State and some Local Government type
1/03/2007 Page 12 of 102

Christmas Island GIS 2006 Page 13 of 102
services to Christmas Island. State Government type services are provided through Service Delivery Arrangements (SDAs) between the Commonwealth and WA State Government agencies, through informal arrangements with WA agencies, directly by the Christmas Island Administration and through agency arrangements with other Government bodies and the Shire Council. The Australian Federal Police provide policing and regulatory services, such as immigration and customs.
1/03/2007 Page 13 of 102

Christmas Island GIS 2006 Page 14 of 102
Chapter 1: Introduction
Background This documentation accompanies the delivery of the Christmas Island Geographic Information System (CI GIS) 2004 release to the Territories Office, Department of Territories and Regional Services (DoTaRS) and also to CI GIS stakeholders under a support and supply arrangement with DoTaRS. The CI GIS was first developed by the Australian Geological Survey Organisation (AGSO) for DoTaRS in 1996. Subsequently there were ad hoc updates through follow-on CI GIS data development projects and the provision of three on-Island-training courses to PRL, CIA, PANCI and CI Shire during 1998. Fostering and facilitating data sharing between CI GIS stakeholders and the supply of CI GIS cd-roms and manuals is now on a more formal basis through a Memorandum of Understanding (MoU) with Territories Office dated 23rd May 2000. In November 2001 AGSO merged with AUSLIG to form Geoscience Australia.
General Features The Christmas Island Geographic Information System is a collection of spatial data, viewing and analysis tools dealing with the Christmas Island. The data include orthophotography, topographic, cultural and environmental features both of the islands and the ocean immediately surrounding them. The data are presented in both ESRI ArcView and ArcExplorer projects. The ArcView projects require a licensed copy of ArcView. ArcExplorer is a free viewer and is distributed on the Christmas Island GIS cd-rom #1. Data are stored as ESRI shapefiles and therefore readily useable with most modern GIS applications. Data were received from a variety of custodians and in many cases had no accompanying documentation. Lack of documentation made it difficult for AGSO and now GA to interpret, translate and document the data. GA has attempted to include metadata for many of the datasets to the ANZLIC core metadata standards, but the value of this is limited by the poor initial documentation. In some cases further work could be done by GA to improve the value of the data. As data is improved or new data is developed and agreed as available it will be distributed to stakeholders on an annual basis under the scope of the current MoU.
1/03/2007 Page 14 of 102

Christmas Island GIS 2006 Page 15 of 102
Getting Started CD-ROM # 1 automatically runs a web (HTML) document containing details and tools for getting started with the Christmas Island GIS. A hard copy of most of the HTML documentation is included in this guide in Chapter 3.
1/03/2007 Page 15 of 102
Christmas Island GIS 2006 Page 16 of 102
Chapter 2: Thematic Layers and Data
Viewers The Christmas Island GIS cd-rom # 1 contains ESRI’s free data viewer ArcExplorer 2.0. This enables viewing of all the vector data and the TIFF versions of the raster data. If editing or more complex GIS analysis is required, ArcView GIS is recommended. GA has gone to considerable effort to correct errors in the source data that might have obstructed use by GIS software packages. Use of the data in ArcInfo or most other available GIS software packages should be straightforward.
Data Formats The Christmas Island GIS uses ESRI shapefiles as its major vector format. This enables editing within ESRI ArcView GIS rather than requiring a more expensive software package. It also allows preservation of 3-D data components. The existence of a 3-D component, which enables viewing in a 3-D viewer such as ArcView’s 3-D Analyst, was preserved wherever possible to maximise data value. In cases where this may limit shapefile portability to other software packages, the 3-D component can be removed by saving as a 2-D shapefile from ArcView. The primary format for raster data is uncompressed Tagged Image File Format (TIFF) full colour. A secondary image format is the Enhanced Compressed Wavelet (ECW) (a compressed file format distributed with ERMapper and viewable in ArcView after the installation of a plug-in). This format significantly reduces file size and loads to view quickly in ArcView. GA has observed some spatial accuracy variability at higher resolutions with some ECW format images. Source files are in a variety of formats, as received from the data custodian. Source formats include Microstation Design Files (DGN), ESRI Shapefiles, ESRI Coverages, ESRI ArcInfo Export (E00), MapInfo (TAB, MID/MIF) as well as various tabular and database formats.
Projection Data within the CIGIS is in the Map Grid of Australia (MGA) projection using the GDA94 datum. This projection is equivalent to the UTM WGS 84 projection. Previous versions of the CIGIS supplied data in Christmas Island Grid 1985 (CIG85) projection. This was previously the most commonly used map projection for the island.
1/03/2007 Page 16 of 102

Christmas Island GIS 2006 Page 17 of 102
Definition of Christmas Island Grid 1985 (CIG85) as defined on the AUSLIG 1996 dyeline plans; CIG85 is a plane rectangular grid coordinate system with True Origin coinciding with a point at UTM GRID ZONE 48 coordinates 570 000mE and 8 840 000mN (WGS72). At that point the false origin is 20 000mW and 60 000mS of True origin. CIG85 is thus merely a shift on UTM (WGS 72), a 550 000m shift for eastings, and an 8780000m shift for northings. The current CIGIS uses the MGA (GDA94) projection and is therefore compatible with the most common map system used Australia wide. The MGA (GDA94) projection is considered to be equivalent to the Universal Transverse Mercator (UTM) projection using the WGS84 datum. The CIGIS is therefore also compatible with standard GPS coordinates which utilise the UTM WGS84 system.
Conversion to MGA (GDA94) Datasets from previous versions of the CIGIS were in CIG85 projection, and an x y shift was used for conversion to MGA in this particular instance. It was assumed, given the smallness of the island, that the shape of the earth would have minimal effect and that an XY shift would therefore suffice. This assumption was confirmed by subsequent tests. Pre-existing datasets in the CIGIS were converted into MGA (GDA94) by reversing the easting and northing shift that defines the CIG85. This consisted of an easting shift of 550000mE and a northing shift of 8780000mN, thereby producing data in UTM (WGS 72) projection. A further shift was applied to then project the data from UTM (WGS 72) to MGA GDA94 (WGS 84 equivalent). The magnitude of this shift was determined by overlaying several newly projected UTM (WGS 72) surfaces onto AAM Laser DEM images which had been recorded in MGA (GDA94) units. The UTM (WGS 72) surfaces were then shifted to align with the AAM data.
1/03/2007 Page 17 of 102

Christmas Island GIS 2006 Page 18 of 102
Figure 1: Shows the roads and buildings shapefiles which have been shifted to align with the background Laser DEM image. A high level of fit between the two can be seen.
This shift consisted of adding 15m to the eastings, and 1m to the northings. Thus the shift used to convert from CIG85 to MGA (GDA94) was Eastings: + 550 015mE Northings: + 8780001mN A shift of similar magnitude is used by Gutteridge Haskins & Davey (GHD) Pty Ltd in their process of projecting from CIG85 to GDA94. The GHD conversion can be seen by opening the file ‘cigis\documents\GHD_prj_conv.jpg’.
Accuracy The accuracy of this shift was assessed by comparing the eastings and northings generated using the shift with GPS coordinates of points obtained on site in the ‘85contrl.shp’ shapefile. This shapefile consists of orthophotography control points and is located in the ‘cigis\orthophoto\orth1987’ directory. The comparison indicated that the difference between the GPS UTM (WGS84) coordinates and the shifted MGA (GDA94) coordinates were sub-metre for the north east portion of the island. Greater variability occurred in the south of the island. The eastings in the south of the island differed between 1 and
1/03/2007 Page 18 of 102

Christmas Island GIS 2006 Page 19 of 102
5m, whilst the northings differed from 3 to 7m. Differences also varied in the western half of the island, with eastings differing between 0.3 to 8m, and northings differing between 0.3 and 11m. The high level of fit between the different coordinate sets in the north east portion of the island is probably due to the fact that it was shapefiles zoomed over the north east that were fitted to MGA Laser DEM images and used to generate the XY shift. AAM advises that the positional accuracy of the airborne laser scanning is within 0.4m, indicating a high level of accuracy for the Laser DEM images (airborne laser scanning accuracy can be seen in the ‘als_horiz_accur.txt’ document located in the ‘cigis\documents\als_horiz_accur.txt’ directory. Thus the positional accuracy of the CIGIS is good for the north eastern part of the island, and mimics the accuracy of the 2000 AAM Laser DEM images, but variable on the rest of the island.
1/03/2007 Page 19 of 102

Christmas Island GIS 2006 Page 20 of 102
2006 Satellite Imagery Quickbird satellite imagery of Christmas Island was commissioned by the Department of Environment and Heritage in mid 2003 and supplied to the Australian Government by DigitalGlobe in March 2006. It took this long (over 2 years) due to persistent scattered cloud over Christmas Island and many sensed scenes, not being up to 'cloud free' specifications. The Quickbird satellite recorded reflectance data of the islands in the red, green, blue, near infra-red and panchromatic bands, in 16 bit format. All sharpened imagery has a resolution of 0.6m/pixel.
Figure 2: 2006 Quickbird satellite imagery of the Casino Resort situated on the eastern coastline of Christmas Island.
Three 8-bit pan-sharpened TIFFs, one for each of the three sections, containing the red, green and blue bands were supplied to GA. Each pixel on the pan sharpened imagery represents 0.6m.
1/03/2007 Page 20 of 102

Christmas Island GIS 2006 Page 21 of 102
Figure 3: 2006 Satellite imagery of the temporary Immigration Reception & Processing Centre (IRPC) & the new recreation building near the oval in the central north-east of Christmas Island.
Figure 4: Port of Christmas Island as shown by the 2006 Satellite Imagery.
1/03/2007 Page 21 of 102

Christmas Island GIS 2006 Page 22 of 102
Laser Digital Elevation Model A Digital Elevation Model (DEM) was constructed for the eastern half of Christmas Island from ground heights obtained from an airborne laser scanning survey flown September 2000. Shiny colour drape images of the ground surface were then produced from this DEM.
2000 Airborne Laser Scanning In 2000 AAM surveys was commissioned by the Commonwealth to fly an airborne laser scanning survey of Christmas Island. Here is a description of the technology from an article on the web by AAM: "An Airborne Laser Scanning system consists of three components:
• A Global Positioning System (GPS) to position the moving aircraft in space.
• An Inertial Measurement Unit (IMU) to record the aircraft attitude and acceleration.
• A laser light source which directs a stream of discrete laser points towards the ground at approximately ninety degrees to the line of flight. The time taken for each of these discrete points to return to the aircraft is accurately recorded.
• In addition, a ground based GPS unit is required to be operating within 20km to 50 km of the survey area, depending on survey accuracy required. The coordinates of this base must be known. Data from the station is used to compute a differential GPS solution for the aircraft.
The system components are shown diagrammatically below.
Direction of flight
GPS satellites
One GPS ground station
Figure 5: Airborne Laser Scanning system components.
Depending on the ALS manufacturer at least two recordings of each of the laser points emitted are stored by the system. These include the
1/03/2007 Page 22 of 102

Christmas Island GIS 2006 Page 23 of 102
first return received and the last return received. The first return may be from the top of a tree while the last may represent the ground beneath the tree. Coordinates are computed for both the first and last returns. First Return: Measures the distance to the first object encountered – in this case, the tree foliage. Last Return: Measures the distance to the last object … in this case, the ground. By acquiring first and last return data simultaneously, it is possible to measure both the tree-heights and
b
Ibpf
P Ag(eeAiA2 Pttspsw
1
Figure 6: First return (from a tree) and last return (from the ground)that would go back to the plane.
the topography of the ground eneath in a single pass.
nformation from the three ALS components is combined with ground ase station GPS data to produce XYZ co-ordinates of the reflected oints. These are then separated automatically into points reflected rom the ground and those reflected from above ground features."
rocessing undertaken by Geoscience Australia
AM surveys divided the eastern part of the island into 36 2km x 2km rid tile squares. Geoscience Australia processed the set of last returns mostly ground heights), and the GPS location in MGA (GDA94) units of ach height, for each of the 36 tiles. Geoscience Australia converted ach height dataset into a text file and imported each file into Microsoft ccess. This height dataset was then exported in dbf format, and
mported into ArcView. The databases were added as event themes into rcView and converted to shapefiles corresponding to each of the 36 km x 2km tiles.
revious versions of CIGIS had produced DEM tiles based on a different ile system. The 36 shapefiles were adjusted to align with this previous ile system. This was done by merging shapefiles adjacent in the north-outh direction and clipping them according to the extent of the reviously used tile. In order to minimize areas of ocean or no data, hapefiles containing less than 30% land within the new 2km x 2km tile ere merged with adjacent shapefiles, and then clipped to remove
/03/2007 Page 23 of 102

Christmas Island GIS 2006 Page 24 of 102
excess areas of ocean or no data. As a result, coastal shapefiles, and inland tiles located at the extent of the airborne laser scanner flight path deviate from the standard 2km x 2km tile size. The end result was 27 shapefiles, 17 of which were 2km x 2km.
Figure 7: Points from a laser last return shapefile – typical density. At the roundabout.
Figure 8: Laser DEM tile plan of the eastern half of Christmas Island flown 11-16 September 2000.
These shapefiles are stored in the directory ‘on cd-rom #3 at cigis\LaserDEM\als_height’. For the purpose of providing a straightforward answer, our interpretation of the accuracy statements provided by AAM is that the heights and the XY locations are nearly always within half a metre (see files "cigis\documents\aam_laserdem_readme.pdf" and "cigis\documents\als_horiz_accur.txt" respectively, both on cd-rom #1).
1/03/2007 Page 24 of 102

Christmas Island GIS 2006 Page 25 of 102
Figure 9: Shapefiles containing locations in MGA (GDA94) of heights in metres
of the ground surface of the eastern half of Christmas Island.
2000 Laser DEM Grids A DEM grid tile was interpolated from each of these shapefiles using the inverse distance weighted (IDW) method of grid interpolation. Seven nearest neighbours and a power of three were used to interpolate the grid tiles. This combination was chosen because trials conducted by GA found that it minimized noise due to overlap between adjacent laser scanner flight paths and maximised detail in the images produced from the 2000 Laser DEM grids. The output grid cell size was set to one meter. Inspection of the source data shapefiles indicates the original last return data density averages to better than a 4 X 4 meter cell size. For example; tile 2261 has 471,251 last (mostly ground) laser returns and over the whole of the 2 X 2 Km tile this gives an average of one ground laser return every eight square meters (less than a 3 x 3 meter cell size). Similarly, tile 2263 has 285,622 data points averaging one data point every fourteen square meters which is slightly better than a 4 x 4 meter cell size on average. Laser returns are distributed fairly randomly. Buildings are often not included in the last return data - the laser reflections from buildings are mostly filtered into the first return data files (not processed by Geoscience Australia). By overlaying the original
1/03/2007 Page 25 of 102

Christmas Island GIS 2006 Page 26 of 102
laser point data stored in the shapefiles, an opinion can be formed for the particular location in question about the certainty of the values read from the grid. The author has interpreted the metadata from the data provider (AAM Surveys) as indicating a vertical accuracy for the source data points of nearly always better than half a meter (see file AAM_Survey_readme.doc). The AAM metadata section reports that comparisons with 105 test points gave an accuracy of within 0.23 meters at the 68% confidence level. Here are excerpts of some explanations kindly provided by David Jonas, AAM Surveys: "The laser light used is very close to the visible spectrum, so in deciding whether the feature will be measured or not, consider the analogy of a torch. If you were in the aircraft shining a 0.2m diameter torch beam onto the surface, everything that you "see" illuminated by the torch beam, will be measured by the ALS. A building will definitely reflect the beam, so will be measured very well. The very top wispy parts of a tree may not reflect much of the torch beam, so that may not be measured. A bitumen road is both black and has a dispersive surface, so reflections from the road can be less than from dirt tracks. If you are seeing gaps in the ALS data where buildings should be, it is because you are looking at a file comprising those laser strikes classified as "ground". Laser points did hit the building and were duly recorded, but subsequent data processing recognised these as being "non-ground" features and therefore removed from the terrain definition. Similarly, in areas of dense vegetation, the point density of "ground" strikes will be less, as some of the laser beams would have hit the canopy and not penetrated through to the ground. In this case, the density of laser points classified as "ground" is an indication of the density of the tree canopy. In areas of dense vegetation or radical "moonscape", the software may have become confused when classifying the data into "ground" and "non-ground" laser strikes. So in such terrain shapes, it is unwise to describe the terrain model as accurate to 0.23m, even though the individual points are accurate to that level."
1/03/2007 Page 26 of 102

Christmas Island GIS 2006 Page 27 of 102
Figure 10: Interpolation methods showing the most noise due to flight path overlap using the spline method. Maximum detail with minimal flight path noise was produced using the IDW (power = 3, nearest neighbours = 7)
1/03/2007 Page 27 of 102

Christmas Island GIS 2006 Page 28 of 102
Figure 11: Image noise due to fight path overlap present when the spline interpolation method is used, and greatly reduced when the IDW method is used.
1/03/2007 Page 28 of 102

Christmas Island GIS 2006 Page 29 of 102
The spline interpolation method also produced frequent data spikes in the image. One further advantage of using the IDW grid interpolation method is these data spikes were absent.
Figure 12: Shows data spikes present in the image when the spline
interpolation method is used. These spikes are not present when the IDW method is used.
The Laser DEM grids produced from the grid interpolation process are stored on cd-rom#3 in the directory ‘cigis\LaserDEM\LaserDEM_grids’.
1/03/2007 Page 29 of 102

Christmas Island GIS 2006 Page 30 of 102
Figure 13: Laser DEM grids in the CIGIS GDA94.
The laser DEM grids are stored in a zip file. When extracting grids from this file, the relevant grid file as well as the entire ‘info’ directory must be unzipped for the grid file to be fully operational. Using the grids, height values can be inspected and contours can be generated however this requires additional software (eg ArcView Spatial Analyst). AAM Surveys provided the following metadata with the airborne laser scanning data: - DATA CHARACTERISTICS Characteristic Description Format ASCII xyz Size 18,492,000 ground and 29,123,000 non-ground points
(approx) Terrain model 1.4m estimated point density, separated into ground & non-
ground Classification Single classification applied to whole site REFERENCE SYSTEMS Horizontal Vertical Datum GDA94 CIHD Projection MGA Zone 48 N/A Geoid Model N/A EGM96 Reference Point Christmas 13 Christmas 13
1/03/2007 Page 30 of 102

Christmas Island GIS 2006 Page 31 of 102
575492.624 E 256.959 Ellipsoidal Ht 8844717.025 N 260.194 Orthometric Ht Height Redatuming Heights corrected with EGM96
were subsequently redatumed by 0.32m to agree with supplied test points
SOURCE DATA Source Description Ref No Date Primary control DOLA SSM Report 3578697 05.05.2000 Laser Scanning AAM Geodan 10,000 Hz 325087 11-16.09.00 Test points GHD Surveys ACCURACY Measured
Point Derived Point
Basis of Estimation
Vertical data 0.23 Comparison with 105 test points Test points unknown ACCURACY NOTES: • Values shown represent standard error (68% confidence level or 1 sigma), in
metres • “Derived points” are those interpolated from a terrain model. • “Measured points” are those observed directly. • Standard errors shown above are derived from the differences between data
supplied in this volume and test points. No allowance has been made for errors in the test points.
USE OF DATA• Intended use : Planning, Conceptual Design • Intended scale of use : 1:500 LIMITATIONS OF DATA • The definition of the ground under trees may be less accurate. • This data has not been field tested for completeness.
Laser DEM Shiny Colour Drape Images A wet look shiny colour drape algorithm was applied to each DEM tile using ERmapper® and the results saved as 8 bit (256 colour) and 24 bit (16 million colour) Tagged Image File Format (TIFF). The 8 bit TIFFs are stored in the cigis\LaserDEM\TIFF directory, and the 24 bit TIFFs are stored on cd-rom #4 at cigis\LaserDEM\TIFF_24 directory. Each DEM tile was also saved as an Enhanced Compressed Wavelet (ecw) image. These ecws are stored on cd-rom #2 at cigis\LaserDEM\ecw directory. The colour range for each individual tile has been optimized to give maximum information. A consequence of this is that colours may not match at adjoining edges. Each tile has a 1 metre pixel size. Most inland tiles and several coastal tiles have a 2km x 2km size. The inland
1/03/2007 Page 31 of 102

Christmas Island GIS 2006 Page 32 of 102
tiles located at edge of the laser scanner flight path and most coastal tiles deviate from the 2km x 2km standard tile because adjacent shapefiles were merged to minimize areas of no data and ocean.
Figure 14: Laser DEM shiny colour drape images.
Although the grid interpolation method minimised the amount of noise due to flight path overlap in the image, some noise still remains. Image noise occurs in varying degrees across all of the shiny colour drape images.
1/03/2007 Page 32 of 102

Christmas Island GIS 2006 Page 33 of 102
Figure 15: Shiny colour drape Laser DEM image showing the regular check pattern associated with overlapping edges of the airborne laser scanner flight paths.
Laser DEM features The advantage of the new Laser DEM over previous DEMs is its ability to penetrate vegetation cover. This means that topographic features overgrown with vegetation are apparent on the 2000 Laser DEM images, where in previous versions of CIGIS DEMs they were not. The 1987 DEM present in earlier versions of the CIGIS included tree heights as part of the elevation of the land surface. The 2000 Laser DEM does not include tree heights, and is therefore a more accurate representation of the land surface of the eastern half of Christmas Island.
1/03/2007 Page 33 of 102

Christmas Island GIS 2006 Page 34 of 102
Figure 16: 2000 Laser DEM image, 1987 DEM image and orthophotography of the same area of Christmas Island. The Laser DEM image shows topographic features which are not apparent in the 1987 DEM due to vegetation cover.
Figure 17: 2000 Laser DEM image, 1987 DEM image and orthophotography of the Poon Saan area of Christmas Island. The laser DEM image shows the ground surface beneath the trees in the SE.
1/03/2007 Page 34 of 102

Christmas Island GIS 2006 Page 35 of 102
Figure 18: Caves and sinkholes (in the vicinity of the research station) amongst thick rainforest become apparent on the colour images derived from the 2000 laser DEM.
1/03/2007 Page 35 of 102

Christmas Island GIS 2006 Page 36 of 102
Figure 19: The 2000 laser DEM reveals gullies in the forest. The gullies are interpreted as being due to near surface volcanic rocks that cause runoff and groundwater outflow resulting in the erosion seen. This example is down slope from the dryers at Drumsite.
1/03/2007 Page 36 of 102

Christmas Island GIS 2006 Page 37 of 102
Figure 20: 2000 Laser DEM of coastline south of the golf course showing ground features not previously shown by orthophotography or contour lines due to the heavy vegetation cover. This has been interpreted as a land slip that occurred a long time ago.
Figure 21: 1987 orthophotography of the same area as figure 17 with contour lines derived from stereo plotting of the 1987 aerial photography. Due to the dense vegetation cover the cliff faces and broken terrain are not evident.
1/03/2007 Page 37 of 102

Christmas Island GIS 2006 Page 38 of 102
Constraints to urbanisation In January 2004, Koltasz Smith (KS) supplied GA with CAD files, which when overlaid produced a map showing the appropriateness of urbanisation and development on Christmas Island (see Plan 5 in Christmas Island draft local planning strategy located in the ‘cigis/documents/Draft_Local_Planning_Strategy_Text_Plans1to5.pdf on cd-rom#1). Areas where urbanisation is mildly, moderately, and severely constrained, as well as unconstrained areas, appear on this map. GA was not supplied with the map in its entirety in digital form. A considerable amount of effort has gone into converting the eleven CAD files that make up this map into one ESRI shapefile. KS used the following components in CAD file format to produce areas of mild, moderate and severe constraint: Mildly constrained: Slope 10–20 degrees, Active mining leases, Crabs (routes, movement, nesting) Moderately constrained: Vegetation1, Vegetation2, Buffers around radio transmitters Severely constrained: Slope 20-30 degrees, Slope 30–40 degrees, Slope > 40 degrees, Bird nesting sites, APSC satellite centre KS has not explicitly stated the reasons for each component being labelled as mild, moderate, or severe. However a discussion about each constraint can be found in the Draft Local Planning Strategy located on cd_rom#1 (cigis/documents/ Draft_Local_Planning_Strategy_Text_Plans1to5.pdf). GA converted the above eleven separate CAD files into 2D shapefiles. A "mild" constraint shapefile was then created by joining the 'slope 10-20', 'active mining leases', and 'crabs' shapefiles using the union option in the ArcView Geoprocessing Wizard. Both "severe" and "moderate" constraint shapefiles were created using the same method. The "moderate" shapefile was created by joining the "vegetation1", "vegetation2" and "buffers around radio transmitters" shapefiles. The "severe" shapefile was created by joining the "slope 20-30". "slope 30-40", "slope>40", "bird nesting sites" and "APSC satellite centre" shapefiles. A 'constraint' field was added to the table of each of the mild, moderate, and severe shapefiles. This field listed all polygons in the mild shapefile as "mild", the severe shapefile as "severe", and the moderate shapefile as "moderate". The dissolve option in the ArcView Geoprocessing Wizard was then used to remove overlapping polygons and produce contiguous
1/03/2007 Page 38 of 102

Christmas Island GIS 2006 Page 39 of 102
areas of mild, moderate, and severe constraint in each of the mild, moderate and severe shapefiles respectively. The mild, moderate and severe shapefiles were then joined to form one shapefile using the union option in the ArcView Geoprocessing Wizard. The "constraint" field in this shapefile was edited so that where polygons overlapped; the classification was always the most severe category. The dissolve option in ArcView Geoprocessing Wizard was then used to produce contiguous areas classified as either mildly, moderately or severely constrained. KS did not produce a CAD file containing unconstrained areas, but considered unconstrained areas to be places on Christmas Island not covered by any of the eleven component CAD files. GA produced a set of polygons corresponding to these unconstrained areas. This was done by creating a shapefile with one polygon covering the whole island. The "intersect" option in ArcView was then used to intersect this whole island shapefile with the shapefile created by GA containing the mild, moderate and severe constraints. This produced a set of polygons at the locations in the mild, moderate and severe constraints shapefile where there were no constraints. These polygons were then converted to a shapefile. This shapefile then contained the unconstrained areas of Christmas Island. Unconstrained areas in Christmas Island were then joined to the shapefile containing the mild, moderate and severe constraints, using the union option in the ArcView Geoprocessing Wizard. This produced a shapefile containing the whole of Christmas Island classified as either mildly, moderately, severely constrained or unconstrained. This shapefile is called "constraints.shp" and is located in the 'cigis/planning/constraints.shp' directory. KS supplied the CAD files in CIG85. GA projected the final "constraints.shp" to MGA (UTM Zone 48) using an XY shift (X shift = 550015, Y shift = 8780001).
1/03/2007 Page 39 of 102

Christmas Island GIS 2006 Page 40 of 102
Figure 22: Shows whole of Christmas Island classified as either severely constrained, mildly constrained, moderately constrained or unconstrained for urbanisation or development.
1997 Orthophotography Digital orthophotography has been prepared from aerial photography that was flown by Fugro Spatial Solution Pty Ltd on the 2nd November 1997 (commissioned by Parks Australia North Christmas Island). In June 2002, Geoscience Australia commissioned Fugro to generate orthophotography from the 1997 aerial photography at minimal cost as a component of the Christmas Island GIS project and as part of other work undertaken on behalf of Territories Office in 2002.
1/03/2007 Page 40 of 102

Christmas Island GIS 2006 Page 41 of 102
Figure 23: An image captured from the Christmas Island GIS orthophotography at approximately 1:800 scale, showing clarity and resolution of land and underwater features. The current orthophotography was created from aerial photography flown in 1997.
The orthophotography has a 15cm on-the-ground pixel size. The quality of the orthophotography is impressive, with reasonable resolution down to 1:500 scale. The pale red colour associated with the image is a result of GA trying to best highlight variances in vegetation species related to revegetation in areas of mining disturbances. The image also has warping in localised areas, in particular building outlines. This may be a result of the image having been pinned down by a broader DEM. The 1997 orthophotography was generated in Christmas Island Grid 1985 (CIG85) by directly correlating the 1997 aerial photography with the 1987 aerial photography for which there had been good survey control points. In September 2003, GA projected the orthophotography into the MGA (GDA94) projection. The MGA coordinates in the north east of the island agree with the 1987 ground control points to within one meter; the south and west of the island are variable in their accuracy. To decrease storage, GA has supplied the 1997 orthophotography in two reduced size formats: 1. As 256 colour .tif tiles suited to both ArcExplorer and ArcView (pixels
were down sampled to 30cm). See figure 6 for converted .tif tiles, and
1/03/2007 Page 41 of 102

Christmas Island GIS 2006 Page 42 of 102
2. As full colour, 15cm pixels Enhanced Compressed Wavelet (ECW) compressed imagery. See figures 4 and 5 for ECW coverage that can be viewed in ArcView using a plug-in1 provided on the cd-roms.
Figure 24: Laecena (dark grey – green stipple pattern) growing along tracks, Saw Tooth Fern (pale green growing amongst pinnacles in areas of higher grade phosphate) and Macaranga regrowth trees (bright green).
ORTHOPHOTOGRAPHY DETAILS Aerial Photography: Fugro Spatial Solutions Pty Ltd Division: Geomatics Address: 121 Hill Street, East Perth WA 6004 Phone: 61-8-9325 2644 Aerial Photography for Christmas Island (Indian Ocean) Film No: - Film Type: colour Photo Scale: 1:10000 Dates: 2/11/97 O/Lap: 60% approx. Project Name: CHRISTMAS ISLAND 1997 Run No(s): 1 to 9 Scanning for CHRISTMAS ISLAND GIS: Fugro Spatial Solutions Pty Ltd Orthorectification for Christmas Island GIS: Fugro Spatial Solutions Pty Ltd
TP
1PT File ‘ArcView_3.2a_ECW_Plugin_v2.5.exe’ is on CD2 in folder '\tools\extensions'.
1/03/2007 Page 42 of 102

Christmas Island GIS 2006 Page 43 of 102
Figure 25: Flight lines and photo centres of the 1997 aerial photographs used for the Christmas Island GIS orthophotography. Flight lines are numbered at one end of the line.
Figure 26: Show
1/03/2007
Limits of 1997 Orthophotography
s the limits of the 1997 orthophotography coverage.
Page 43 of 102

Christmas Island GIS 2006 Page 44 of 102
CI-west1.ecw
CI-west
Figure 27: Index of the 1997 orthopof each orthophotography coverage.file which georeferences the image. (97_ecw_plan.shp) for use within A
1265
1262 1362
1263 1363
Figure 28: Index of the orthophotogeach orthophotography tile made to.tfw file which georeferences the im(97_1ktilebnd.shp) for use within Ar
1/03/2007
CI-margaret-beaches.ecw
CI_west3.ec
CI-NE-point.ecw
CI-urban.ecw
CI-west4.ecw
2.ecw
CI-south-point.ecw
hotography showing the names and limits Each .ecw file is associated with an .ers The index file is stored as a shapefile rcView and ArcExplorer.
2668
22531953
2669
25682468
2467
2466
2368
2367
23662266
2265
2153
2267
2469 25692369
raphy showing the names and extent of date. Each .tif file is associated with a age. The index file is stored as a shapefile cView and ArcExplorer.
Page 44 of 102

Christmas Island GIS 2006 Page 45 of 102
Figure 29: 1997 orthophotography example showing National Parks Australia nursery.
Figure 30: 1997 orthophotography example in the vicinity of Rocky Point suburb.
1/03/2007 Page 45 of 102

Christmas Island GIS 2006 Page 46 of 102
Figure 31: 1997 orthophotography example showing newer homes in west Silver City.
Figure 32: 1997 orthophotography example showing the Christmas Island hospital.
1/03/2007 Page 46 of 102

Christmas Island GIS 2006 Page 47 of 102
The images below provide an example of the quality of the 1987 and 1997 orthophotography and how they can be used to examine changes on Christmas Island over a 10 year period. Figure 30 and 31 were used in a presentation to identify an area of Toms Ridge that had already been mined.
Figure 33: 1987 orthophotography showing fill being spread over mined pinnacles at Toms Ridge.
Figure 34: 1997 orthophotography of the same site at Toms Ridge ten years later.
1/03/2007 Page 47 of 102

Christmas Island GIS 2006 Page 48 of 102
1987 Orthophotography Digital orthophotography has been prepared from aerial photography flown on the 16th, 20th, and 21st of August and the 1st September 1987 by the Australian Survey Office Canberra. AGSO commissioned BHP Engineering, Land Technologies Division to generate orthophotography from the 1987 aerial photography as a component of this Christmas Island GIS project that AGSO undertook on behalf of Territories Office in 1996. The orthophotography has a 30cm on-the-ground pixel size. A 'pixel' or 'picture element' is the smallest component in a digital image — a pixel is an individual square of colour. The quality of the orthophotography is impressive, with reasonable resolution down to 1:500 scale.
Figure 35: An image captured from the Christmas Island GIS orthophotography at approximately 1:800 scale, showing clarity and resolution of land and underwater features.
The orthophotography is considered to be the most accurately located dataset overall. This high quality locational accuracy results from the use of surveyed ground control points in conjunction with recognisable features and a 3D model. In addition, there are intersecting flight lines, which also underpin positional accuracy. Hardcopy sketches of the survey ground control points are held in archive and are available for inspection.
1/03/2007 Page 48 of 102

Christmas Island GIS 2006 Page 49 of 102
Orthophotography was generated in Christmas Island Grid 1985 (CIG85) by directly applying the aerial photography survey control as it was originally surveyed on the ground in CIG85. From ongoing use of the orthophotography and subsequent GPS checks, GA expects the Christmas Island orthophotography over the Island to generally be within a metre of its true position. Exceptions to this high level of accuracy could be the more inaccessible parts of the Island such as SW point, which did not have reliable ground control available (see Fig 30 in the 1996 System Documentation). In September 2003 GA projected the orthophotography into the MGA (GDA94) projection. The MGA coordinates in the north east of the island agree with the original ground control points to within one metre. Thus the high level of positional accuracy of the 1987 orthophotography is retained for the MGA version in this part of the island. The accuracy of the south and west of the island is variable. The original orthophotography consists of one hundred and fifty-seven 1km X 1km 24-bit colour Tagged Image File Format ('.tif') tiles taking up about 5.4 GB of disk space for the whole of the Island. To decrease storage, GA supplied orthophotography in two reduced size formats: 3. as 256 colour '.tif' tiles suited to both ArcExplorer and ArcView use,
and 4. as full colour Enhanced Compressed Wavelet (ECW) compressed
imagery which can be viewed in ArcView using a plug-in2 provided on cd-rom #2.
An attempt has been made to match the digital orthophotography colour to that of the source aerial photography.
TP
'
1
ORTHOPHOTOGRAPHY DETAILS Aerial Photography: Australian Survey Office, Canberra Aerial Photography for Christmas Island (Indian Ocean) Film No: SOC 728 & SOC 729, Film Type: colour Photo Scale: 1:10000 Dates: 16-8-87, 20-8-87, 21-8-87, and 1-9-87 O/Lap: 60% approx. Project Name: CHRISTMAS ISLAND Run No(s): 1 to 17 Scanning for CHRISTMAS ISLAND GIS: Kevron Aerial Surveys Orthorectification for Christmas Island GIS: BHP Engineering Land Technologies Division
2
PT File ‘ArcView_3.2a_ECW_Plugin_v2.5.exe’ is on CD1 in folder \cigis\tools\freeware'.
/03/2007 Page 49 of 102

Christmas Island GIS 2006 Page 50 of 102
2768
2767
2766
2765
2764
2763
2669
2668
2667
2666
2665
2664
2663
2569
2568
2567
2566
2565
2564
2563
2562
2561
2469
2468
2467
2466
2465
2464
2463
2462
2461
2460
2458
2369
2368
2367
2366
2365
2364
2363
2362
2361
2360
2359
2358
2357
2356
2355
2354
2353
2352
2268
2267
2266
2265
2264
2263
2262
2261
2260
2259
2258
2257
2256
2255
2254
2253
2252
2166
2165
2164
2163
2162
2161
2160
2159
2158
2157
2156
2155
2154
2153
2152
2065
2064
2063
2062
2061
2060
2059
2058
2057
0858
2055
2054
2053
2052
1965
1964
1963
1962
1961
1960
1959
1958
1957
1956
1955
1954
1953
1864
1863
1862
1861
1860
1859
1858
1857
1764
1763
1762
1761
1760
1759
1758
1664
1663
1662
1661
1660
1659
1658
1564
1563
1562
1561
1560
1559
1558
1464
1463
1462
1461
1460
1459
1458
1364
1363
1362
1361
1360
1359
1265
1264
1263
1262
1261
1260
1259
1166
1165
1164
1163
1162
1161
1160
1159
1066
1065
1064
1063
1062
1061
1060
1059
1058
0965
0964
0961
0960
0959
0958
0860
0859
2056
Figure 36: One Km graticule providing the base layout for the 157 1Km X 1Km
orthophotography tiles created for the Christmas Island GIS from the 1987 aerial photographs. Where a tile would have only a small land component it was generally amalgamated with the adjacent tile and the top left number for the joined pair was used (see Fig. 6).
1/03/2007 Page 50 of 102

Christmas Island GIS 2006 Page 51 of 102
Figure 37: Flight lines and photo circles of the 1987 aerial photographs used for the Christmas Island GIS orthophotography. Flight lines are numbered at one end of the line.
1/03/2007 Page 51 of 102

Christmas Island GIS 2006 Page 52 of 102
1764
1954
1955
1464
1265
1759
1066
1160 13601260
1063
1957
1659
2255
1953
0961
1965
2253
2254
2252
2562
2663
1064
1065
2763
0958
2668
2357
15591459
0860
2669
2154
22562156
2153
2155
225721572057
2152
2358225821582058195818580858
235922592159205919591859105909590859
246023602260216020601960186017601660156014601060
2056
24612361226121612061196118611761166115611461136112611161
2464
24622362226221622062196218621762166215621462136212621162
2164
2368
2569
256324632363226321632063196318631663156313631263
276426642564
2468
23642264
2365
20641864
2567
2165
13641164
1165
2568
266525652465
2667
2265
2467
23662166 2266
2367
266625662466
2065
2052
2369
2267
2356
2469
2765
2766
1956
1062
2561
2767
1564 1664
2458
Figure 38: Index of the orthophotography showing the names and extents of each orthophotography tile. Each ‘.tif’ file is associated with a ‘.tfw’ file which georeferences the image. The index file is stored as a shapefile (‘1ktilebnd.shp’) for use within ArcView and ArcExplorer projects.
1/03/2007 Page 52 of 102

Christmas Island GIS 2006 Page 53 of 102
Digital Elevation Model The CIGIS Cd-roms contain representations of a Digital Elevation Model (DEM) prepared by BHP Engineering as part of the orthophotography production. GA applied a shiny colour drape algorithm to the DEM tiles in ERMapper® and the results were saved as 8-bit (256 colour) Tagged Image File Format (TIFF) images. These are stored on cd-rom #1 in the ‘cigis\orthophots\dem1987’ directory. The colour range for each individual tile has been optimised so as to give a maximum of information. A consequence of this is that colours may not match at adjoining edges. Tiles over disturbed areas have a one metre cell size, while those over primary rainforest have a five metre cell size.
Figure 39: Three-dimensional drape of orthophotography over DEM (South Point area), showing that the DEM surface is not always the ground surface. In this case much of the DEM surface is tree canopy. The DEM cell size over rainforest is 5 metres, while over disturbed areas it is 1 metre.
1/03/2007 Page 53 of 102

Christmas Island GIS 2006 Page 54 of 102
Figure 40: Shiny colour drape DEM tiles supplied with the CIGIS. Further tiles can be generated by GA. The colour range for each tile has been generated so as to give a maximum of information, hence colours may not match at adjoining edges.
There is one 4 kilometres by 4 kilometres tile (tile number 2469) at the north-eastern extremity of the island. Other tiles are 2 kilometres by 2 kilometres (except for some partial tiles along the coast). Further TIFF images like these can be prepared on a cost recovered basis. The original DEMs are not supplied on cd-rom #1 or #2 as they take up a large amount of space and are not useful without additional software.
DEM-derived contours A useful spin off of the digital orthophotography is the opportunity to get one metre contours over the disturbed areas of the Island. For the north-east area of the Island 2km X 2km DEM contour tiles have been trialled in the CIGIS. Most are at a contour interval of 5 metres but tiles 2269 and 2469 have been done at a one metre contour interval. They have been saved on cd-rom #4 in the ‘cigis\orthophotography\dem1987’ directory. The DEM contours are surface contours. They pick up the reflective surface beneath the aircraft. The reflective surface may be a surface other than the ground (e.g. dense vegetation canopy, rooftops). Further one metre contour coverage can be prepared on a cost recovered basis. In September 2003 GA projected the DEM tiles and contours into the MGA (GDA94) projection using an XY shift (X=550015, Y=8780001).
1/03/2007 Page 54 of 102

Christmas Island GIS 2006 Page 55 of 102
Christmas Island Cadastre In December 2004 Geoscience Australia received the scheduled cadastral update from the Department of Land Information (DLI) in Perth. This data was in the form of two ESRI shapefiles projected in UTM (using the GDA94 datum). Also included in the release of data were two Microsoft Access databases. Finally the release included metadata and other documentation to go with the release. One of the ESRI shapefiles contained cadastral information relating to current property boundaries. The other contained proposed changes to property boundaries on the island. One Microsoft Access database contained information on current property ownership. The other database contained reserve data for Christmas Island. Incorporating these files Geoscience Australia assembled the final cadastral release as follows: Initially discussion with the users of the GIS took place to find the most common usage as well as ways to increase clarity. From this it was decided that the shapefiles of current property boundaries and proposed changes to property boundaries should be kept separate. As such the following steps were applied to both layers. These layers are stored in the \CIGIS\cadastre\ folder. The layer containing current property boundaries is ‘cadastre.shp’ and the layer containing lodged property boundary changes is ‘lodged.shp’ To increase clarity GA removed the field LOT_TYPE from the cadastre. This field had been found to be automatically generated and was misleading, showing only limited subsets of certain tenure types. Tenure type in the cadastre is recorded in the PI_PARCEL field, a 16 character field of letters and numbers. Geoscience Australia obtained an electronic copy of the ‘NORM manual3’ from DLI. The NORM manual contains definitions of field attributes for data used in shapefiles. From this Geoscience Australia was able to include an expanded description in the table of the land tenure called TENURE. Following this street address data was extracted from previous releases of the cadastre and joined on polygon pin number. 3 NORM files are a series of sequential files which DLI (formerly DoLA) uses to disseminate spatial and tenure data. Each of the files contains attribute data for a single tenure or spatial entity. The content of the NORM files is generally normalised, with data from different files related through common key attributes. Taken from ‘NORM files’ September 2—2, by DoLA
1/03/2007 Page 55 of 102

Christmas Island GIS 2006 Page 56 of 102
Next zoning information was extracted from tables supplied to Geoscience Australia by Peter Brockmeulen of the Department for Planning and Infrastructure (DPI, formerly DoLA) based on his ground audit work on the island. This data was joined on the PI_PARCEL field. Finally reserve data supplied by Tony Yeomans of DLI in Perth was joined onto the cadastre, also using the PI_PARCEL field. All data that was included in the cadastre was assessed on an individual basis for its clarity and it’s usefulness to increase understanding of the cadastre. As such not all data fields available were included. These fields are included with the source data in the \CIGIS\cadastre\source\ directory.
Figure 41: Highlighting differences in current and lodged. As the current layer is assumed to have been digitised (email from DLI 14-Feb-‘05), when lodged data is integrated the area is spatially upgraded with the new survey data (lodged data) as this is assumed to be more accurate.
Notes on Previous Versions In June 2004 the Western Australian Department of Land Administration (DoLA, now DLI and DPI) supplied Geoscience Australia with an updated cadastre. For the first time this update contained both proposed changes to property tenements as well as current property boundaries. Geoscience Australia modified these files to include boundary status information before combining them (note that in the latest version the files are no longer combined). Description data was preserved from the previous version of the cadastre through joining on the PIN field. Those fields which did not join on PIN were spatially joined to description data.
1/03/2007 Page 56 of 102

Christmas Island GIS 2006 Page 57 of 102
In September 2003 Geoscience Australia projected the 2002 cadastre into MGA (GDA94) projection using an XY shift as follows: X+550015 Y+8780001 The 2002 Cadastre was supplied to Geoscience Australia by DoLA in the form of an ESRI shapefile extracted from their database. This shapefile was dated 1st of August 2002. The shapefile was modified as follows:
1. Polygon outlines were set as the default display for the cadastre using an .avl file.
2. The data was projected into CIG85 which was the standard projection for all Christmas Island data in 2002.
3. Duplicate polygons were deleted from the cadastre. 4. Location numbers were extracted from the PI_PARCEL field both
as a string for sorting and as a number for numerical queries. It should be noted that lot numbers now come as a standard part of the cadastral release from DLI (the LOT_NUMBER field).
5. Field names from the attribute table were updated to conform to suggestions received from Christmas Island Administration in August 2002. Requested attributes that were not present in the cadastre but were present in the ground audit were then copied from the ground audit attribute table to the cadastre attribute table. This was done through joining the tables on the PIN field. All information relating to income, value, ownership etc was removed from the CIGIS public release in line with government guidelines on privacy.
Ground Audit Data In late 2004 a new ground audit was conducted on Christmas Island by DLI in Perth. This information was used to compile attribute tables supplied by Peter Brockmeulen of DPI in Excel format. It was also used to classify areas of the island as reserves, particularly religious sites. On Christmas Island the Chinese-Malay community has more than 50 worshipping sites around the island which previously were not classified as reserves. These sites are now being incorporated into the cadastre as part of the proposed changes to land tenure.
Notes on Previous Versions The ground audit cadastre version from the 2001 CIGIS release is included in the 2002 and 2003 release for comparison and verification purposes. Australian Estate Management (AEM) supplied ground audit data in a flat MS Access table in 1997 (in contrast to the relational database structure identified in the Ground Audit Module 1 Final Report). In
1/03/2007 Page 57 of 102

Christmas Island GIS 2006 Page 58 of 102
addition to this data GA identified and joined data from other sources where value could be added. Filling of the attributes appears incomplete. Examples of probable missing data are:
• Some fields have no data in them for all records; • Nearly all fields have some blank entries; • A postcode is only entered for some lots.
GA originally joined the ground audit data to the cadastral shapefile through conversion to a database and joining on the PIN field in ArcView.
1/03/2007 Page 58 of 102

Christmas Island GIS 2006 Page 59 of 102
Utilities Utilities data were supplied to GA by Gutteridge Haskins & Davey Pty Ltd (GHD) via cd-rom on 25th May 2001. Utilities data supplied are of the following major categories; electrical, stormwater, telecommunications (Telstra), wastewater, water sources and water supply. The cd-rom contained all data as ESRI shapefiles with the original CAD files in a subdirectory.
Figure 42: All utilities layers with default symbology in Poon Saan area.
An example of the utilities data can be seen above. It shows a zoomed in area at Poon Saan with all the utilities themes turned on, orthophotography and the 1998 cadastre has been included as a backdrop. GHD compiled the utilities data from original CAD drawings collected over many years through management of island infrastructure by the Commonwealth Department of Administrative Services. These were converted into ESRI shapefiles by GHD and georeferenced to align with CIG85. In September 2003, GA projected these shapefiles into the MGA (GDA94) projection using an XY shift (X = 550015, Y = 8780001). GHD has also updated several of these shapefiles in 2006 and these have been included in the GIS.
1/03/2007 Page 59 of 102

Christmas Island GIS 2006 Page 60 of 102
The cd-rom supplied by GHD contained a number of customisations to enhance ArcView’s interface. These included a ‘metatool’ (for viewing the utilities metadata sheet), hotlinks to CAD files and a GHD special font set.
Figure 43: Default drainage symbology if the GHD font is not installed.
The GHD-supplied custom font allows ArcView to generate point theme legends with custom symbols preferred by GHD. Examples of these can be seen in Figure 29. GA considers that GHD did not adequately document how to implement this special font Premade ArcView projects on the GHD-supplied cd-rom contained hotlinks that attempt to display original CAD drawings with the new utilities vector layers. Through investigation of the GHD cd-rom this feature can be utilised by copying the necessary data using the folder structure found on the cd-rom and installing a GHD-supplied ArcView extension. Some of the GHD enhancements required registry edits, installation of DLLs in addition to ArcView extension (AVX) files. This is requires a level of system access not available on most public service PCs. Consequently these particular enhancements were not implemented by GA. The font used for GHD symbology is stored on CIGIS cd-rom #1 as ‘cigis\infra_topo\water_res\ghdsym.ttf’. In order to view the symbols as GHD intended, install this font by opening your windows font directory (eg. C:\winnt\fonts), clicking ‘File|Install New Font…’, navigating to ‘cigis\infra_topo\water_res’, selecting 'GHD Utilities Geocomp Symbols (TrueType)' and pressing ‘OK’.
1/03/2007 Page 60 of 102

Christmas Island GIS 2006 Page 61 of 102
Figure 44: Examples of utilities legends in ArcView after installation of the font containing the GHD symbol set.
1/03/2007 Page 61 of 102

Christmas Island GIS 2006 Page 62 of 102
Water Resources Water resources data for Christmas Island were supplied on cd-rom by Ecowise Environmental in Canberra. These data were assembled as part of ongoing groundwater investigations and monitoring undertaken on Christmas Island during the period from October 1996 to June 1999. The relevant reports are supplied as PDF documents on cd-rom #1. The Ecowise report describing the supplied data layers is in Chapter 7 (it is stored as ‘cigis\documents\ecowise\Report.pdf’). Layers were supplied as ESRI shapefiles in CIG85 projection. They include aquifer boundaries (both saline and freshwater), bores and wells, caves and sections. In September 2003, GA projected these shapefiles into the MGA (GDA94) projection using an XY (X=550015, Y=8780001) shift. GA is impressed by the quality of the data and documentation supplied by EcoWise. The following table lists the shapefiles supplied to GA by Ecowise.
Directory Shapefiles
.\Cigis\infra_topo\water_res Mb_pre1996.shp mb_install1996.shp non_developed.shp water_collection_locations.shp caves.shp h_brackish_saline.shp h_vulnerability.shp vh_vulnerability.shp vh_vuln_line.shp basal_aquifer_brackish.shp basal_aquifer_fresh.shp perched_aquifer_fresh.shp perched_aquifer_line.shp
1/03/2007 Page 62 of 102

Christmas Island GIS 2006 Page 63 of 102
Figure 45: Christmas Island Aquifer classification map produced by Ecowise - from the Ecowise Groundwater Investigations and Monitoring Report November 1999.
Register of National Estate The Register of National Estate is maintained by the Australian Heritage Commission (AHC), Environment Australia. AHC provided three ESRI shapefiles containing point and polygon spatial data for Christmas Island national heritage sites. Associated attributes contain name, class and status information about each site. The ‘class’ field distinguishes natural heritage and historic heritage data. Data attribute classes apply to the polygon themes and was subsequently used to separate the natural heritage data from the historic heritage data. Natural heritage data extends beyond the coastline and covers areas of pinnacle fields. The original data supplied to AGSO by AHC was in Latitude - Longitude and needed to be converted into the CIGIS85 coordinate system, so a projection to WGS72 was done. The translation between projections highlighted differences in accuracy of the polygon data between the historic class and natural class. To resolve the offset in the historic data GA shifted these data by 16.5 metres westward to match existing data. The polygon data was then all merged together, but because of polygon overlap natural heritage data was converted into its own shapefile. In
1/03/2007 Page 63 of 102

Christmas Island GIS 2006 Page 64 of 102
September 2003, GA projected the data into the MGA (GDA94) projection using an XY (X=550015, Y=8780001) shift.
Figure 46: Register of National Estate attributes for the Administrators House are shown in the 'Identify Results' dialog box.
1/03/2007 Page 64 of 102

Christmas Island GIS 2006 Page 65 of 102
Mine Lease Boundaries In January 2005 Geoscience Australia was supplied with the latest mine lease boundary information by Ian Robertson of the Department of Industry and Resources WA (DoIR). The data was packaged as an ESRI shapefile and pre projected in UTM (GDA94 datum). Comparing lease boundary accuracy to the cadastre Geoscience Australia found that the projection was within an acceptable margin of error. As such Geoscience Australia did not reproject this data. The data from DoIR was split into separate mine lease parcels before being spatially joined to the mine lease number (obtained from previous data). The field TSTAT_ENG (tenement status in English) was again included, dividing mining leases between ‘Miscellaneous licenses’ and ‘Prospecting licenses’. Prospecting licenses were removed from the ‘minlease.shp’ file for clarity. Also included in the \CIGIS\mining\ folder is ‘mineral_tenements.shp’ which contains both the Miscellaneous licenses as well as the Prospecting licenses. Finally it should be noted that the large Prospecting licenses covering the whole of Christmas Island and the eastern half of Christmas Island are extremely unlikely to have and effect on development due to the large amounts of work required to survey this area.
Figure 47: Mine Lease 133B with orthophotography.
1/03/2007 Page 65 of 102

Christmas Island GIS 2006 Page 66 of 102
Notes on Previous Versions In August 2004 Geoscience Australia was supplied with a shape file by Bob Taylor of DoIR WA, via DoTaRS Christmas Island. This data was supplied in lat/long format and Geoscience Australia undertook to reproject this data into GDA94. GA also introduced the TSTAT_ENG field as well as spatially joining mine lease numbers to the supplied data. This was also the first year that Geoscience Australia included a separate ‘mineral_tenements’ shape file. 2003 consisted of a re-projection of the 2002 data file into MGA (GDA94) through the use of an XY shift with the following values:
X+550015 Y+8780001
November 2002 saw the checking of mine lease boundaries against the 2002 cadastral boundaries for discrepancies. Minelease ML133A was also updated from the 2002 cadastre. The changes relate to airport land and a communications tower in the North. Around 1995 the Department of Minerals and Energy W.A. (DoMEWA) became the designated authority for mine leases on Christmas Island on behalf of the Commonwealth. In 1998 the Commonwealth allowed an increase in the mine lease area up to the forest edge where the mine lease abuts Crown land, but not where it abuts National Park. In response to this allowance, changes to the mine lease data were supplied to the Australian Geological Survey Organisation (AGOS, now Geoscience Australia) in 1998 by the surveyor to PRL at the time (Russell Payne). This data came to AGSO as a series of ESRI shapefiles, each containing a mine lease polygon. These boundaries were produced by digitising off the orthophotography in conjunction with site visits. AGSO merged all individual polygons that were supplied into the one ESRI shapefile, so as to allow easier access to the data. The mine lease boundaries supplied in 1996 Christmas Island GIS were captured several years earlier by AUSLIG W.A. from field visits to Christmas Island in conjunction with the use of the 1987 aerial photography. AUSLIG W.A. set the boundaries back from the forest edge.
1/03/2007 Page 66 of 102

Christmas Island GIS 2006 Page 67 of 102
1:25 000 Topography and Cultural Data This data set contains 1:25000 scale topographic data originating from the Australian Surveying and Land Information Group, Department of Administrative Services, Canberra, ACT, Australia (AUSLIG). Topographic data has been reproduced with permission of the General Manager, AUSLIG. The data covers the whole island, and includes polygons, lines and points describing both natural and built environment.
The AUSLIG data includes the following 1:25000 layers: • roads, • 10 metre contours, • coastlines and cliffs, • spot heights, • buildings and other structures, • hydrology, • boundaries for the national park, • boundaries for the mining leases and • boundaries for four vegetation types. The 1995 release of the AUSLIG digital data for Christmas Island was published at the 1:25000 scale. For this release the existing 1988 map was updated. The data was provided in Arc/Info format in the Christmas Island Grid projection. Only ‘feature coded’ data was available as AUSLIG do not see there being many sales of this dataset. Feature coded data are the lowest level of release for Arc/Info data by AUSLIG. There was basically no documentation with the data - only a list of feature codes and their frequency. GA has had to re-work the data into its present form. In September 2003, GA projected the AUSLIG 1:25000 shapefiles into the MGA (GDA94) projection using an XY shift (X=550015, Y=8780001). The AUSLIG data are subject to copyright and GA hold a licence. The cost was $300. Licence / royalty arrangement pro forma were submitted by GA for Territories Office and PRL in January 1996. Maps produced and distributed beyond the licensee that include the AUSLIG data are required to carry the following acknowledgment: Topographic data reproduced with permission of the General Manager, Australian Surveying and Land Information Group, Department of Administrative Services, Canberra, ACT.
Accuracy Publication at the 1:25000 scale has important implications for the use of the AUSLIG topographic data. Some of the plots GA has produced include enlargements to scales of 1:2000. This means the AUSLIG data are being displayed at over ten times its published scale. Users should
1/03/2007 Page 67 of 102

Christmas Island GIS 2006 Page 68 of 102
view AUSLIG lines on such enlargements as representing a line around ten times as thick, the true line occurring somewhere within that much thicker line. It is far more expensive to capture data at small scales. As the data was originally intended to be used at 1:25000 scale, zooming in past this will show visible offset from the orthophotography, potentially by as much as 25 metres. On zooming, the orthophotography will be more accurate, having error of at most 6 metres.
Data source The original data was obtained as two Arc/Info export files (xmas.e00 and xmasrel.e00), containing general data and contour/spot-height data respectively. Considerable work was necessary to make this useful for the GIS.
Manipulation of Data A series of Arc/Info macros were used to strip out different feature classes and build them as separate point, line or polygon coverage’s as appropriate. In generating polygon coverage’s cleaning was required. To suit use in Surpac mining software a version of the contours as polygons was created.
‘Auslg25k’ national park boundaries The AUSLIG 1:25000 scale national park boundaries were found to be of insufficient accuracy for a number of requirements of the CIGIS. This data subset has been moved to the ‘defunct’ subdirectory and should not be used. The value of keeping this data in the system is to help eliminate any spurious national park boundary data sets that may turn up from other sources over the years. The best set of national park boundaries Geoscience Australia could locate are stored in the ‘CIA’ directory. These were obtained from Auslig Perth as part of the 1987 cadastre data set and are accurate to 1:1000 scale.
1/03/2007 Page 68 of 102

Christmas Island GIS 2006 Page 69 of 102
Figure 48: Coastline, Cliffs, Streams, Pools and National Park (1:25000 data).
1/03/2007 Page 69 of 102

Christmas Island GIS 2006 Page 70 of 102
Figure 49: Vegetation of Christmas Island (1:25000 data).
Figure 50: Built Environment (1:25000 data, township region).
1/03/2007 Page 70 of 102

Christmas Island GIS 2006 Page 71 of 102
Figure 51: Ten metre contours (1:25000 data).
Figure 52: Spot height data points (1:25000 data).
1/03/2007 Page 71 of 102

Christmas Island GIS 2006 Page 72 of 102
1:1 000 Detailed Topography and Cultural Data
Figure 53: Screen capture of part of Rocky Point showing typical line and point features of the 1:1000 detail survey data. This data was digitised directly from the 1987 aerial photography so when compared to the orthophotography it matches very well.
The data presented in the 1:1000 detailed survey was prepared by AUSLIG (Western Region) for Christmas Island Administration and this work was paid for by the Commonwealth. This data is 1:1000 scale data and covers the north-east portion of the Island. It contains essentially the same features as the AUSLIG 1:25000 topographic and cultural data but in more detail and more precisely located.
Accuracy This data should be correct to about 1 metre. For most of the north east portion of the Island this data and the orthophotography have a very good correlation ⎯ usually well under one metre in difference. Around tall buildings and cliffs there may be discrepancies between the data and the orthophotography. This is a factor of aerial photography angles and interpretation and in these cases the 1:1000 vectors should be more reliable than the orthophotography. The dataset includes contours where the ground could be estimated using a stereo plotter (see figure. 46). These contours do not have height values attached as the source CAD file did not include this. However, using spot heights (spot_hgt.shp) and the ArcView annotation layer called “contours” in the “.\infra_topo\topo1k” directory,
1/03/2007 Page 72 of 102

Christmas Island GIS 2006 Page 73 of 102
Geoscience Australia have observed 1m contours in the urban areas and 2m contours elsewhere. These intervals were confirmed by looking at the 1987 Christmas Island AUSLIG 1:1000 and 1:2000 map series.
In the western most extremity of the data set the accuracy has been called into question by the orthophotography contractor. They observed, after checking the orthophotography against results from analytical stereo plotters, that “it appears that in the vicinity of the market garden, the mapping data supplied... may be in error by approximately 5 m in east”. The data was provided as six Arc/Info export files that are stored on the cd-rom #1 of the 2001 release in the directory ‘Cigis\Cia\source\e00’: Detail of manipulation of the data for use in CIGIS is presented in the 1996 CIGIS System Documentation at Appendix 1. Separate data themes were split out of the provided export files via Arc/Info routines. In the 1996 Appendix 1 there is an example and description of the Arc/Info macro series that were used to do this. In 2003, GA projected the 1:1000 Detailed Topographic and Cultural Data shapefiles into the MGA (GDA94) projection using an XY shift (X=550015, Y=8780001).
1:1000 scale National Park boundaries The national park boundaries in this directory cover the whole of Christmas Island and are the best GA could obtain. They originate from AUSLIG Perth as part of the 1987 cadastre data set and are accurate to 1:1000 scale. The cadastral data did not include internal boundaries of the park. Thus it was necessary for GA to add the mining lease boundaries (supplied as part of the cadastral data) to the data of national park boundaries to create the full national park boundaries. This process is explained in more detail in the 1996 CIGIS System Documentation at Appendix 1.
1/03/2007 Page 73 of 102

Christmas Island GIS 2006 Page 74 of 102
Figure 54: Point infrastructure of north-east region (1:1000 data).
Figure 55: Line Infrastructure of north-east region (1:1000 data, detail of phosphate loading area, Flying Fish Cove).
1/03/2007 Page 74 of 102

Christmas Island GIS 2006 Page 75 of 102
Figure 56: Vegetation of north-east region (1:1000 data, detail of Poon Saan Area with roads added for reference).
1/03/2007 Page 75 of 102

Christmas Island GIS 2006 Page 76 of 102
Figure 57: One metre urban and two metre elsewhere contours of north-east region (1:1000 data).
Figure 58: Spot heights for north-east region (1:1000 data)
1/03/2007 Page 76 of 102

Christmas Island GIS 2006 Page 77 of 102
Roads 1:25000 scale update In 2002, GA received a shape file (coordshp_cig85.shp) from the Shire of Christmas Island that allowed considerable improvements to GA’s 1:25000 roads shape file. The street names were added to the majority of the island’s roads and additional roads, not known to GA, were also added using ArcView vector editing tools.
Figure 59: Spatial and attribute updates from the Shire of Christmas Island roads shapefile.
In 2002 GA redefined the Golf Course and Casino Road from the “coordshp_cig85” shapefile. GA also altered the Lily Beach Road and Quarry Road junction. Both edits were performed using ArcView vector editing tools. An update of the road surface attributes to include recent work upon the road surfaces (unsealed to sealed, etc) was also performed. This data was obtained from Christmas Island Shire Council in 2002.
1/03/2007 Page 77 of 102

Christmas Island GIS 2006 Page 78 of 102
Figure 60: The updated roads file showing the alterations made to the Golf Course and Casino Road and also the intersection of Lily Beach Road and Quarry Road.
1/03/2007 Page 78 of 102

Christmas Island GIS 2006 Page 79 of 102
Town Plan The Christmas Island Town Planning Scheme (TPS) data was prepared by the WA Ministry of Planning for the Commonwealth on a fee for service basis. A copy of the TPS data was supplied to AGSO as Arc Info export files on cd-rom in March 1998. The TPS has been signed off by the Minister and initialled as approved. Endorsement by the Shire was then required before gazettal could proceed.
Figure 61: Data from the Christmas Island Town Planning Scheme (TPS) as prepared by the WA Ministry of Planning.
Reprojecting the Ministry of Planning data to Christmas Island Grid 1985 (CIG85) was nostraightforward. GA has endeavoured to integrate the TPS data with the rest of the CIGIS as best as possible. The TPS data was supplied in a zone 50 projection despite Christmas Island being in zone 48. Ministry oPlanning advised by phone that a standard Australian Map Grid had been used. Howeverboth AGD66 and AGD85 gave data over 200mout of place to the NE and so by trial and erroa best match was sought and found to be WGS84. ArcInfo projection files (z50_geo.prj and ll_cig85.prj in the planning directory) wereused to unproject the data to geographics and
t
f
r
then reproject it to zone
SILVER CITY
ROAD
PHOSPHATE
HILL
SILVER
ROADCITY
ROAD
LOWER
POON
SAAN
DRIVE
ROA
D
GA
ZE
ROA
D
PANT
AI
POON SAAN
MU
RRAY
MURRAY
R40
R40
R80
R80
R17.5
R17.5R17.5
R17.5
R40R17.5R17.5
R17.5
R17.5
R17.5
R17.5
R40
R80R80
R40
R80
R80 R80R80
R40R40
R40
R40R80
1/03/2007 Page 79 of 102

Christmas Island GIS 2006 Page 80 of 102
48 CIG85. Note - there was a necessary final adjustment of two metesouth and two meters west to get the TPS data into a better ultimate alignment with CIG85.
rs
A "special points" dataset was included with the Ministry of Planning data. A number of inaccuracies in this data set were observed. The radio masts did not coincide with the masts visible on the orthophotography. GA moved five of these points by 20 to 70 metres so that they plot on top of a mast visible on the 1987 aerial photography. There are also some 'consult with Parks Australia' sites that could also well be similarly inaccurate. At two sites the radio mast points were duplicated in the TPS data. There was a cadastre dataset included with the Ministry of Planning data. It contained many spurious polygons. There were 295 of the 1136 polygons supplied that had an area less than 2 square metres. These 295 polygons were distributed over the whole of the Island, generally in the vicinity of the coastline and most commonly in the 'Dogs Head' area. These cadastre polygons of less than 2 square metres were judged to be errors and deleted from the final shapefile "mopcadas.shp" (Ministry of Planning cadastre). Selecting MoP cadastre polygons from 2 to 150 square metres in size showed land parcels of which some may actually be valid (e.g. a walkway of 28 sq metres). So a lesser selection was made of polygons between 2 and 20 square metres and this yielded 282 of the 841 remaining MoP cadastre dataset polygons. A brief inspection indicated these were all on the coastline. They were presumed to be relict sliver polygons and deleted. This left 559 of the original 1136 polygons. If this MoP cadastre data set it to be taken seriously and used, a reliable way to select and eliminate these slivers needs be found (perhaps using the ratio of area and perimeter). In September 2003, GA projected the Town Plan shapefiles to the MGA (GDA94) projection using an XYshift (X=550015, Y=8780001).
Crazy Ant Grid An updated version of the crazy ant survey grid was received by Geoscience Australia from Parks Australia North Christmas Island (PANCI) in November 2001. This working version contains observation data made by PANCI employees during their research of the crazy ant colonies on Christmas Island. Each of the points represents a surveyed crazy ant site. Using field methods (e.g. number of ants running across a sheet of paper), PANCI employees estimated the concentration of ants at each site. The results were then represented as total ants and incorporated into the shapefile “crazyant_grid” in the “.cigis/environment/” directory”. In September
1/03/2007 Page 80 of 102
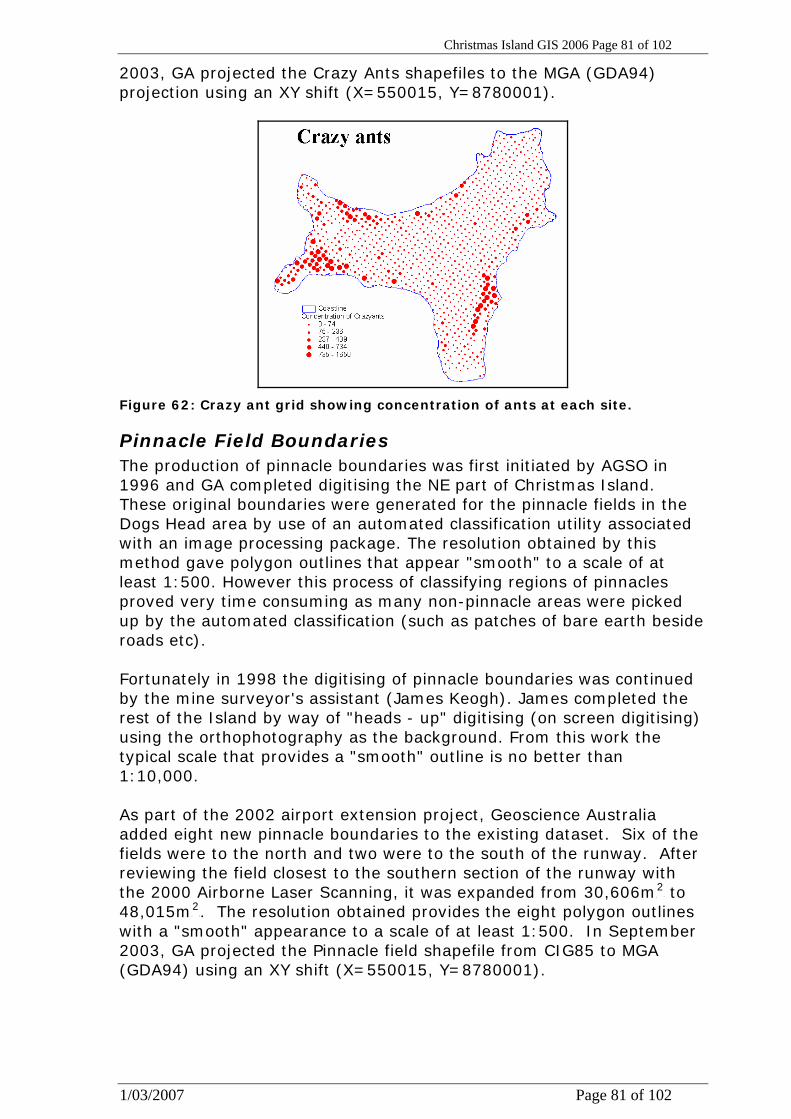
Christmas Island GIS 2006 Page 81 of 102
2003, GA projected the Crazy Ants shapefiles to the MGA (GDA94) projection using an XY shift (X=550015, Y=8780001).
Figure 62: Crazy ant grid showing concentration of ants at each site.
Pinnacle Field Boundaries The production of pinnacle boundaries was first initiated by AGSO in 1996 and GA completed digitising the NE part of Christmas Island. These original boundaries were generated for the pinnacle fields in the Dogs Head area by use of an automated classification utility associated with an image processing package. The resolution obtained by this method gave polygon outlines that appear "smooth" to a scale of at least 1:500. However this process of classifying regions of pinnacles proved very time consuming as many non-pinnacle areas were picked up by the automated classification (such as patches of bare earth beside roads etc). Fortunately in 1998 the digitising of pinnacle boundaries was continued by the mine surveyor's assistant (James Keogh). James completed the rest of the Island by way of "heads - up" digitising (on screen digitising) using the orthophotography as the background. From this work the typical scale that provides a "smooth" outline is no better than 1:10,000. As part of the 2002 airport extension project, Geoscience Australia added eight new pinnacle boundaries to the existing dataset. Six of the fields were to the north and two were to the south of the runway. After reviewing the field closest to the southern section of the runway with the 2000 Airborne Laser Scanning, it was expanded from 30,606mP
2P to
48,015mP
2P. The resolution obtained provides the eight polygon outlines
with a "smooth" appearance to a scale of at least 1:500. In September 2003, GA projected the Pinnacle field shapefile from CIG85 to MGA (GDA94) using an XY shift (X=550015, Y=8780001).
1/03/2007 Page 81 of 102

Christmas Island GIS 2006 Page 82 of 102
Figure 63: Pinnacle field area east of the airport (50m across N-S). The automated classification process has produced a smooth boundary at this close scale.
Vegetation The vegetation dataset is derived from the 1:25000 vegetation map of Christmas Island by J. Barrie in 1966. On behalf of Parks Australia North Christmas Island, in October 2001 Geoscience Australia used ArcInfo to perform ‘headsup’ digitising upon a scanned copy of the original to formulate a raster based copy in CIG85 projection. Upon formulation of this digital copy all attributes relating to vegetation boundaries were extracted from the map and incorporated into the ‘vegetation.shp’ table. ‘Vegetation.shp’ is located in the .data\environment directory on cd-rom #1. The table fields were based on Geoscience Australia’s data dictionary guidelines.
Alias Type Precision Width ------------------------------------------------- Shape FIELD_SHAPEPOLY 0 8 Ufi FIELD_DECIMAL 0 6 Area FIELD_DECIMAL 5 18 Perimeter FIELD_DECIMAL 5 18 Map_symb FIELD_CHAR 0 8 Desc FIELD_CHAR 0 64 Categories FIELD_CHAR 0 50 Feature FIELD_CHAR 0 12 Plotrank FIELD_DECIMAL 0 1
1/03/2007 Page 82 of 102

Christmas Island GIS 2006 Page 83 of 102
It should be noted that the positional accuracy of the scanned map is greater than the original 1966 map. The ‘headsup’ digitising process ensured that the original lines captured were many times larger than those on the printed map.
Figure 64: Vegetation boundaries in the southern coastline of Christmas Island.
1/03/2007 Page 83 of 102
Christmas Island GIS 2006 Page 84 of 102
Geology The Geology dataset was digitised from the 1:27400 geology map of Christmas Island created by J. Barrie in 1966. Geoscience Australia used ArcInfo to digitise a scanned version of the map and project it into the CIGIS projection. The map was then populated with attributes according to the Geoscience Australia data dictionary guidelines. All information relating to the geological and lineations faults were extracted from the 1966 map and incorporated into the corresponding attribute tables. Details of the “geology.shp” fields can be seen below:
Alias Type Precision Width
----------------------------------------------
Shape FIELD_SHAPEPOLY 0 8
Area FIELD_DECIMAL 5 18
Perimeter FIELD_DECIMAL 5 18
Map_symb FIELD_CHAR 0 20
Lith_desc FIELD_CHAR 0 254
Ufi FIELD_DECIMAL 0 6
Stratno FIELD_DECIMAL 0 7
Unitname FIELD_CHAR 0 64
Unitage FIELD_CHAR 0 100
Agerank FIELD_CHAR 0 10
Feature FIELD_CHAR 0 12
Rocktype FIELD_CHAR 0 50
Plotrank FIELD_DECIMAL 0 1 It should be noted that the positional accuracy of the scanned map is greater than the original 1966 map. The ‘headsup’ digitising process ensured the original lines captured are many times larger than those on the printed map. The attributes capture all the information that was supplied on the original map. The Geoscience Australia QA & QC process ensured that all the fields have maximum attributes attached and also contain fields that expand and value add to the original map. In 2003, GA projected the geology shapefile from CIG85 to MGA (GDA94) using an XY shift (X=550015, Y=8780001).
1/03/2007 Page 84 of 102

Christmas Island GIS 2006 Page 85 of 102
Figure 65: Geology boundaries and lineations in the northern section of Christmas Island.
Valley Networks The valley networks shapefile models the drainage networks for Christmas Island. It was produced from the 1999 DEM created from mostly 1:25000 scale vector data. The valley networks are not entirely representative of the island’s hydrology lines. The low elevation points are calculated from low elevation points in the DEM. The island primarily comprises of highly permeable limestone. Therefore, precipitation is not given the opportunity to form above ground streams or rivers shown in the ‘valley_net’ shapefile. The ‘valley_net’ shapefile does not take into account the sub-surface flows or sink holes that have a major bearing on the island’s hydrology networks. The shapefile ‘valley_net.shp’ was constructed using a sequence of ArcView hydro v1.1 extension grid commands, which produced filled sinks, flow direction, flow accumulation, and watersheds. Because of the size of the coverage’s (256Mb) they were left off the CIGIS CD-roms. In September 2003, GA projected the valley_net shapefile from the CIG85 to the MGA (GDA94) projection using an XY shift (X =550015, Y = 8780001).
1/03/2007 Page 85 of 102

Christmas Island GIS 2006 Page 86 of 102
Figure 66: Valley Networks derived from the 1999 DEM of Christmas Island.
Irvine Hill Forest Boundaries The Irvine Hill forest area can be found in the north -east part of Christmas Island. An example of the extent of the forest boundaries can be seen in the following figure. This data was collected by surveying in flags placed by a National Parks officer to enclose patches of primary forest for conservation consideration should the Irvine Hill area be developed for urban use. GA built the surveyed points into the polygon shapefile ' forestedge_irvineh.shp. In September 2003, GA projected this shapefile from CIG85 into MGA (GDA94) using an XY shift (X=550015, Y=8780001) There is possibly other data that may be of value in the source files from which these boundaries were extracted (see directory ‘cigis\environment\source’ on cd-rom #1).
1/03/2007 Page 86 of 102

Christmas Island GIS 2006 Page 87 of 102
Figure 67: Limits of the Irvine Hill forest boundaries with orthophotography as a backdrop.
Christmas Island Animation Flyaround
Geoscience Australia has produced an animated Island flyaround. It is an mpeg movie that runs for approximately three and a half minutes and includes 3D images of the whole island. This has been designed to be used as a promotional tool for the CIGIS as well as being a valuable aid when making presentations about Christmas Island. GA has made space on the CIGIS cd-roms to include the mpeg file. The following snapshots are taken from the movie.
1/03/2007 Page 87 of 102

Christmas Island GIS 2006 Page 88 of 102
Figure 68: Shows a bathymetry image captured from the beginning of the Christmas Island animation.
Figure 69: Shows the terraces on South Point as captured from the Christmas Island animation.
1/03/2007 Page 88 of 102

Christmas Island GIS 2006 Page 89 of 102
Figure 70: Shows Flying Fish Cove as captured from the Christmas Island animation. Note large arcuate slip structure.
Figure 71: Shows the Murray Hill area as at 1997 from the air as captured from the Christmas Island animation.
1/03/2007 Page 89 of 102

Christmas Island GIS 2006 Page 90 of 102
References Australian Geological Survey Organisation, 1996, Geographic Information System for
Christmas Island Phase II, System Documentation. Prepared for the Territories Office, Commonwealth Department of the Environment, Sport, and Territories.
Australian Geological Survey Organisation, 1997, Geographic Information System for Christmas Island Phase II, Cadastre Documentation. Prepared for the Territories Office, Commonwealth Department of the Environment, Sport, and Territories.
Australian Geological Survey Organisation, 1998, Geographic Information System for Christmas Island Phase IIA, Location Number Maps and Listing. Prepared for the Territories Office, Commonwealth Department of the Environment, Sport, and Territories.
Australian Estate Management with input from AUSLIG, AVO and AGS, 1996, Indian Ocean Territories Ground Audit Module 1 Final Report. Prepared for the Territories Office, Commonwealth Department of the Environment, Sport, and Territories.
Department of Land Administration (DOLA), 1992, Christmas Island & Cocos (Keeling) Islands Land Tenure System Project Planning & Detailed Costing Report
ECOWISE Environmental Pty Ltd, Dec 1999, Draft Report on Water Resources Component Christmas Island GIS, by Vince Hazell, prepared for Christmas Island Administration and the Australian Geological Survey Organisation
Tony Falkland, ACTEW Corporation Ltd and Rod Usback, Sustainable Environmental Solutions Pty Ltd, Oct 1999, Christmas Island Indian Ocean Water Management Plan, prepared for GHD Pty Ltd and Christmas Island Administration
Tony Falkland, ACTEW Corporation Ltd, Oct 1999, Christmas Island Indian Ocean Groundwater Investigations and Monitoring Report, prepared for GHD Pty Ltd and Christmas Island Administration
ANZLIC, 2001, ANZLIC Metadata Guidelines: Core metadata elements for geographic data in Australia and New Zealand Version 2 (February 2001), prepared for ANZLIC by the ANZLIC Metadata Working Group
1/03/2007 Page 90 of 102

Christmas Island GIS 2006 Page 91 of 102
GA Catalog details for the 2004 Christmas Island GIS (#61838)
Cat #: 61838 Flags Product: Y Publication: Y Dataset: Y Resource: N WWW: N
Title: Christmas Island GIS (June 2005 release)
Medium: Scale: 1000 Contact: Keith Porritt Type: Data Package Sub Type: Geothermic Project Id:
Pub'n Source: A - Geoscience Australia advice to DoTaRS Pub'n Year: 2005
Abstract: The Christmas Island Geographic Information System (CIGIS) is a collection of spatial data, viewing and analysis tools dealing with Christmas Island, Indian Ocean. The data include orthophotography, topographic, mining, cultural and environmental features of the island. This work is part of ongoing service to the Department of Transport and Regional Services. ------------ Bounding Rectangle ----------------------------------------------------------------------------------- N Latitude: -10.4 S Latitude: -10.583 W Longitude: 105.517 E
Longitude: 105.717 Comments:
Various nominal scales including down to 1:1,000. Projection is MGA (GDA) as well as Christmas Island Grid 1985 (two versions). ------------ List of Authors ------------------------------------------------------------------------------------------- Name:
1 Porritt, K.R. 2 Petersons, S.I.
Theme:
GIS culture information management topography mineral exploration
1/03/2007 Page 91 of 102

Christmas Island GIS 2006 Page 92 of 102
Figure 72: Christmas Island GIS GA Catalog entry — #61838.
1/03/2007 Page 92 of 102

Christmas Island GIS 2006 Page 93 of 102
Chapter 3: cd-rom HTML documentation Hard copy print of the HTML pages comprising the autorun content for cd-rom # 1.
1/03/2007 Page 93 of 102

Christmas Island GIS 2006 Page 94 of 102
Chapter 4: Metadata On the following pages is a printout of all the metadata sheets. These metadata sheets were created to comply with ANZLIC core metadata standards. To aid with understanding the nature of each dataset, a picture has been added to the top of each metadata sheet. Agencies who have involvement with the data for a particular metadata sheet are welcome to contribute back metadata element revisions or additions (by e-mail please) to improve that particular metadata sheet. Abbot's Booby Bird Nesting Sites 1987 Aerial Photography Plan Data - Flight lines and photograph centres 1987 Aerial Photography Plan Data - Photograph Circles 1987 Aerial Photography Survey Control Points 2000 Airborne Laser Scanning Height Data Auslig - 1:25000 Topography and Culture 2005 Cadastre 1966 Christmas Island Geology map Christmas Island GPS Tracks 2006 Christmas Island Satellite Imagery Christmas Island 1:1000 Topographic Data Constraints to Urbanisation Department of Land Administration (DOLA) Survey Control Dataset 1987 Digital Elevation Model Contours 1997 Digital Elevation Model Tiles 1987 Digital Elevation Model Tiles Field Rehabilitation Surveys Irvine Hill Forest Boundaries 2000 Laser Digital Elevation Model Grids 2000 Laser Digital Elevation Model Shiny Colour Drape Images Line and Peg Grid – Remnant Bulldozed Tracks Mine Lease Boundaries Old Geology and Vegetation Maps 1987 Orthophotography of Christmas Island 1997 Orthophotography of Christmas Island Parks Australia Crazy Ant Survey Pinnacle Field Boundaries Register of National Estate Site Pictures Data Town Plan Utilities Valley Networks 1985 Vegetation 1999 Water Resources
1/03/2007 Page 94 of 102

Christmas Island GIS 2006 Page 95 of 102
Chapter 5: Ground Audit Listing The following two spreadsheets list 33 fields of data from ‘cadastre.shp’ and ‘lodged.shp’ that are displayed in the attribute table. Records are sorted by the ‘LOC_STR’ field and then the ‘PIN’ field. The page order for columns is ‘Down, then over’. The excel spreadsheet files can be found on cd-rom 4.
Section one fields Section two fields LOC_STR PIPARCEL PIN LOT_TYPE TENURE RESERVE DESCRIPTIO PURPOSE SUBURB DATE_RETIR STNAME REFERENCE STNAMESFX RSV_VESTIN HOUSENO RESERVE_US USAGE_CODE LGA RENDER_NOR SALEDATENO CENTLAT PIN CENTLONG CALC_AREA DATE_CREAT DATE_MODIF LEGAL_AREA LEGAL_DERIV AREA_INDIC CENTROID_C DATE_BOUND PITYP CT
Table 1: Order of fields in cadastre spreadsheet listing
1/03/2007 Page 95 of 102

Christmas Island GIS 2006 Page 96 of 102
Chapter 6: Data Licensing and Agreements
The collection of nearly all the data sets on the four cd-roms comprising the Christmas Island GIS was commissioned by the Territories Office (Commonwealth Government) under a series of consultancy arrangements with various data suppliers over the past fifteen years. The Christmas Island GIS is an assembly of these multiple data collections (each of which may comprise some man-years of work) into a single easy-to-use integrated system and so represents a valuable Commonwealth asset.
Commonwealth Christmas Island GIS data licence
The copyright for all the data in the Christmas Island GIS resides with the Commonwealth (see data acknowledgments on page 9). Legal advice to Geoscience Australia and Territories Office recommends the protection of the Commonwealths interests in any distribution of the Christmas Island GIS by way of a licence agreement. Following are a one-page licence agreement and an associated covering letter. This licence now also includes the 1:25000 scale topographic and cultural data layers for which a separate AUSLIG licence was previously required. AUSLIG is now the National Mapping Division of Geoscience Australia.
Risks of not licensing the data include: - • allegations of liability for damages as a result of errors in the data, • commercialisation of the data, • proliferation of faceless data variants, • inequitable government support between competing businesses, • perceived breaches of privacy, and • potential future denial of access by the Commonwealth to the
data.
Arguments against licensing include: - • it may in some cases stultify legitimate and effective use of the
data for public good purposes, and • it introduces a cumbersome overhead for both the data supplier
and the data user.
The covering letter is only half a page. The Licence Terms are just over one page in length. It is important to retain this brevity. Experience indicates that long-winded licence agreements are often not read and their conditions are consequently at a greater risk of being ignored. Some users are put off using the data when there is a long and complex licence agreement to come to grips with. Consequently an important public-good benefit that might be delivered by the use of the data may never be realised.
1/03/2007 Page 96 of 102

Christmas Island GIS 2006 Page 97 of 102
An electronic copy of the Commonwealth Christmas Island GIS data licence is stored on the Christmas Island GIS cd-rom #1 at directory '\cigis\documents\licenses' in file 'cigis_license.doc'. A generic covering letter is also stored in this directory (file 'generic_licensecover.doc' and together the two documents comprise the licensing advice to each stakeholder. The covering letter should be edited to correctly describe the particular proposed licensee and two copies of both documents printed for packaging with the data. One original signed copy of the Commonwealth Christmas Island GIS data licence is to be retained by the licensee and one original signed copy is to be posted back.
1/03/2007 Page 97 of 102

Christmas Island GIS 2006 Page 98 of 102
TERMS OF A LICENCE CONCERNING DIGITAL DATA from
the Territories Office of the Commonwealth Department of Transport and Regional Services ('Licence')
IMPORTANT NOTES ‘Territories Office’ means the Commonwealth of Australia represented by the Territories Office of the Commonwealth Department of Transport and Regional Services. ‘Data‘ means the Licensed Data, including any copy, reproduction, modification, adaptation, digital manipulation or graphical representation of the Licensed Data made by the User in any form, including electronic or hard-copy form. ‘Fee’ means the fee payable to Territories Office for the right to use the data in accordance with this Licence. ‘including‘ is not a word of limitation. ‘Licensed Data’ means Territories Office’s data, including metadata and documentation, supplied by Territories Office under the letter from Territories Office to which these Licence Terms are attached. ‘Use’ as a noun means any use or disclosure, and, as a verb, has an equivalent meaning. ‘User’ means any person who Uses the Data, or, if the Use is in connection with the person’s employment, the person’s employer. The Data is intended for use only by people who have professional knowledge of the use and application of geographic information system (GIS) data. TERMS The User: (a) must pay the Fee to the
Commonwealth in accordance with Territories Office’s directions;
(b) may, on a non-exclusive basis, use and disclose the Data only for the User's internal business purposes carried out in person by its employees, or by the User's consultants exclusively for work on the User's internal business, or, if the User is an individual, the User's personal use ('Purpose');
(c) may make back-up copies of the Data; and
(d) must not, except as provided under paragraph (b), distribute or transmit the whole or any part of the Data, whether alone or in combination with any other data or information in any form, to any person.
Nothing in this Licence affects ownership of any person’s rights in the Data. WARRANTY
To the full extent allowed by the applicable law Territories Office excludes from this Licence all warranties, express or implied, including any warranty of fitness of the Data for any purpose. If Territories Office breaches any warranty that, by the applicable law, cannot be excluded, then Territories Office's sole liability to the User for that breach will be, at its choice, to resupply the Data without additional charge to the User or refund the Fee. ASSUMPTION OF RISK The User assumes sole risk and responsibility for its Use of the Data. Territories Office does not warrant or make any representations: (a) that the Data will be complete,
accurate, reliable or error free; (b) as to the accuracy, reliability or
content of any information obtained from Using the Data.
Territories Office disclaims any and all liability for any injury, damage or loss (including, but not limited to, economic loss) howsoever arising out of any Use of the Data. Territories Office is not responsible for any failure to carry out its obligations under this Licence if that failure is for any cause beyond Territories Office's reasonable control. TERMINATION Territories Office may terminate this Licence immediately by written notice if the User breaches this Licence or for convenience on 30 days notice. When this Licence ends the User must return or destroy all copies of the Data in its possession or under its control. APPLICABLE LAW This Licence will be interpreted according to the laws of the Australian Capital Territory, Australia. ALTERATION This Licence be altered only in writing signed by Territories Office and an authorised representative of the User. WAIVER Waiver of any provision or right under this Licence:
1/03/2007 Page 98 of 102

Christmas Island GIS 2006 Page 99 of 102
(a) must be in writing signed by the party
entitled to the benefit of that provision or right; and
(b) is effective only to the extent set out in the written waiver.
ENTIRE AGREEMENT This Licence: (a) constitutes the entire agreement
between Territories Office and the User as to its subject matter; and
(b) in relation to that subject matter, supersedes any prior understanding or agreement between Territories Office and the User and any prior condition, warranty, indemnity or representation imposed, given or made by Territories Office or the User.
UN CONVENTION Territories Office and the User agree that the provisions of the United Nations Convention on Contracts for the International Sale of Goods are expressly excluded from this Agreement. DISPUTE RESOLUTION The parties (meaning Territories Office and the User) must attempt to resolve any dispute or difference that may arise between them in relation to this Agreement (‘Dispute’) through amicable consultation, based on principles of mutual benefit, equality, cooperation and trust. Accordingly, a party must not start arbitration or court proceedings (except proceedings seeking interlocutory relief) about a Dispute unless it has complied with the following paragraphs (a) - (e): (a) A party claiming that a Dispute has
arisen must notify the other party to the Dispute giving details of the Dispute (‘Notification’);
(b) On receipt of a Notification each party must negotiate in good faith to resolve the Dispute and, if necessary to resolve the Dispute, involve the Chief Executive Officers or other senior officers of the parties directly in those negotiations;
(c) If the Dispute involves technical matters and has not been resolved by negotiations under paragraph (b) within a reasonable time, then the parties will refer the Dispute for determination by an independent expert agreed by the parties in the technical field the subject of the Dispute;
(d) If the Dispute is not resolved under paragraph (b) or (c) within thirty days (or longer period agreed between the parties), and if the User's principal address is in Australia, then the parties must refer the Dispute for mediation by the Australian Commercial Dispute Centre Limited (‘ACDC’) for resolution in accordance with the Mediation Rules of the ACDC;
(e) If the Dispute is not resolved under paragraph (b) or (c) within thirty days (or longer period agreed between the parties), and if the User's principal address is not in Australia, then the parties must refer the Dispute to arbitration for resolution in accordance with the UNCITRAL Model Law on International Commercial Arbitration. Notwithstanding any provision of the UNCITRAL rules to the contrary, the parties agree that:
(i) the number if arbitrators shall
be one; (ii) the place of arbitration will be
Canberra, Australian Capital Territory, Australia;
(iii) all proceedings will be conducted in the English Language;
(iv) the applicable law is the law of the Australian Capital Territory; and
(v) the determination of the arbitrator shall be final and binding on the parties and the costs of the arbitration shall be borne and paid for as the arbitrator directs.
(f) If the Dispute is not resolved under paragraph (d) or (e) within sixty days after referral (or longer period agreed between the parties) either party may initiate proceedings in a court
FURTHER INFORMATION Historical information may be contained in the Data, metadata or documentation of the Data. If the User requires further information about the Data or its history, then contact
Territories Office Perth, Department of Transport and Regional Services. Ph: (08) 9225-1400 Fax: (08) 9225-1429
1/03/2007 Page 99 of 102

Christmas Island GIS 2006 Page 100 of 102
TO—DoLA Arrangement for cadastre Through Territories Office, the Commonwealth pays the Western Australian Department of Lands Administration (DoLA) to maintain the cadastre as passed from Australian Land Information Group (AUSLIG) in 1992. A copy of the Arrangement under which Territories Office contract DoLA to do this work is included in prior versions of the CIGIS System Documentation. CI and Cocos cadastre is owned by the Commonwealth but maintained by DoLA. Prior to contracting DoLA in the 1990's, the Commonwealth through AUSLIG WA had maintained the cadastre data for Christmas Island and Cocos. Subsequently (in 1992) the Commonwealth Australian Surveying and Land Information Group, West Australian branch (AUSLIG WA) provided DoLA with the cadastre information for the IOTs. Ex-AUSLIG WA senior staff employed by the Commonwealth at the time include Matt Eagan (Ph 08 9268 4570 - now at LandInfo, a subsidiary of SKM), Ian Jackson and Glenn Bush. Matt reports that in the course of the data hand over to DoLA, the Commonwealth never relinquished ownership of the data. An interesting recent development has been the merging of AUSLIG and AGSO to form Geoscience Australia in November 2001. External customers seeking the IOT cadastre data from DoLA obtain it through the standard DoLA WA data provision system which includes a standard DoLA cadastre data licence agreement. DoLA staff have speculated that perhaps DoLA might introduce a separate licensing agreement for Christmas and Cocos data. However, it has been canvassed that there is convenience in a standard delivery system and extra cost and confusion could result from trying to run two licensing systems. The Arrangement between the Commonwealth (represented by Territories Office) and DoLA states in paragraph 4.1 that: - "4.1 All assets purchased in accordance with this
Arrangement and on the basis of reimbursement under this Arrangement, will be and continue to be the property of the Commonwealth."
1/03/2007 Page 100 of 102

Christmas Island GIS 2006 Page 101 of 102
Chapter 7: Ecowise Environmental Data Documentation
1/03/2007 Page 101 of 102

Christmas Island GIS 2006 Page 102 of 102
Chapter 8: Christmas Island GIS Data CD-ROMs
1/03/2007 Page 102 of 102


![Welcome to Christmas - Parks Australia · Christmas Island Christmas Island is a natural wonder — a remote tropical island famous ( } ] µ v ] µ v Z ] µ o v v µ o u ] P } v (](https://static.fdocuments.us/doc/165x107/5fd6d5cfebe2504c854f60d5/welcome-to-christmas-parks-australia-christmas-island-christmas-island-is-a-natural.jpg)