Christian D. Schunn & Kevin D. Ashley · tation of arguments instead ... Mandler and Ritchey 1977;...
24
1 23 International Journal of Artificial Intelligence in Education Official Journal of the International AIED Society ISSN 1560-4292 Int J Artif Intell Educ DOI 10.1007/s40593-016-0130-z The Impacts of Domain-General vs. Domain-Specific Diagramming Tools on Writing Brendan Barstow, Lisa Fazio, Jordan Lippman, Mohammad Falakmasir, Christian D. Schunn & Kevin D. Ashley
Transcript of Christian D. Schunn & Kevin D. Ashley · tation of arguments instead ... Mandler and Ritchey 1977;...

1 23
International Journal of ArtificialIntelligence in EducationOfficial Journal of the International AIEDSociety ISSN 1560-4292 Int J Artif Intell EducDOI 10.1007/s40593-016-0130-z
The Impacts of Domain-General vs.Domain-Specific Diagramming Tools onWriting
Brendan Barstow, Lisa Fazio, JordanLippman, Mohammad Falakmasir,Christian D. Schunn & Kevin D. Ashley
ARTICLE
The Impacts of Domain-General vs. Domain-SpecificDiagramming Tools on Writing
Brendan Barstow1 & Lisa Fazio1,2 &
Jordan Lippman1 & Mohammad Falakmasir1 &
Christian D. Schunn1 & Kevin D. Ashley1
# International Artificial Intelligence in Education Society 2016
Abstract Argument diagramming is the process of spatially representing an argumentby its component parts and their relationships. A growing body of evidence supportsthe use of argument diagramming to aid student learning and writing within disciplinesincluding science education. However, most of these studies have focused on basiccontrasts between diagramming and no diagramming. The purpose of this study was tolearn how different diagramming frameworks affect the benefits afforded by argumentdiagramming. Three groups of undergraduate students in psychology research methodslab courses were given either no diagramming support, support with a domain-generalframework, or support with a domain-specific framework to help them write a researchpaper introduction. Students given any diagramming support included more relevantcitations and considered opposing citations in their papers. Students using the domain-
Int J Artif Intell EducDOI 10.1007/s40593-016-0130-z
* Christian D. [email protected]
Brendan [email protected]
Lisa [email protected]
Jordan [email protected]
Mohammad [email protected]
Kevin D. [email protected]
1 Learning Research and Development Center, University of Pittsburgh, LRDC rm 821, 3939 OHaraSt, Pittsburgh, PA 15260, USA
2 Department of Psychology and Human Development, Vanderbilt University, Nashville, TN, USA
Author's personal copy
specific framework wrote more about the scientific validity of cited studies than theother two groups, whereas students using the domain-general framework trendedtowards included more supporting citations.
Keywords Argument diagram .Writing instruction . Science instruction . Educationalintervention . Representation
Introduction
Argumentation and argumentative writing are difficult skills for students to learn(Andrews 1995; Andrews and Mitchell 2001; Hahn and Oaksford 2012; Kuhn2013), yet these are important skills in a wide variety of disciplines (Wolfe 2011), eventhough the nature of what makes a good argument and how it is structured in text likelyvaries by discipline (De La Paz et al. 2012; Goldman 1994; Gustafson and Shanahan2007). Some have argued that argumentative writing is the most important kind ofwriting in undergraduate education (Andrews 2010) because it is both a kind ofdisciplinary-based form that is needed in participation in a discipline but also a goodway to learn underlying discipline content (Andrews 2010; Loll and Pinkwart 2013).Learning to argue means acquiring many cognitive skills related to the rules within thedisciplines, the relevant facts that can be used, and common argument forms (Wolfe2011; Wolfe et al. 2009). However, it also requires internalizing the social, epistemo-logical, and metacognitive dimensions involved in the production and evaluation ofargument (Kuhn et al. 2013).
Unfortunately, argumentative writing suffers from a dearth of practice opportunitiesin formal education—in high school, students may have only one or two opportunitiesper semester to write evidence-based essays in English class, and even fewer opportu-nities in other disciplines (Applebee and Langer 2011; Kiuhara et al. 2009). Further, inlower and mid-ranked American colleges, students’ writing skill shows little to noimprovement over four years—a problem apparent to employers as well as researchers(Arum and Roska 2011). Perhaps one cause of this lack of growth is that existinginstruction for argumentative writing tends to have misplaced emphasis on the presen-tation of arguments instead of their generation (Andrews 1995; Andrews and Mitchell2001; Oostdam et al. 1994; Oostdam and Emmelot 1991).
Like in other disciplines, writing assignments in both the natural and social sciencestypically involve argumentation (Wolfe 2011). Teaching and learning argumentation inscience can pose unique difficulties to both instructors and students (Osborne et al.2013). The breadth and depth of conceptual, procedural, and epistemic knowledge thatmany scientific arguments require can make their development and analysis both time-consuming and challenging. Scientific theories and scientific evidence are frequentlycomplex on their own, and their integration into a coherent argument is especiallycomplex. For example, a given research paper can have a range of findings—somefindings may contradict a theory, and other findings may be just irrelevant (Thomm andBromme in press). Scientific theories are frequently multi-faceted, with each facetrequiring its own support. The integration of argumentation into scientific instructiondoes not appear to come naturally, likely requiring a significant investment intoteachers’ professional development to achieve (Osborne et al. 2013).
Int J Artif Intell Educ
Author's personal copy
One kind of scientific argument structure that is especially challenging to bothdevelop and defend is the main argument for the research question(s) found in anintroduction to a research paper: an (often implicit) argument for why a question isimportant (Wolfe 2011). In contrast to typical dialogic argumentation where multiplesides of an argument must be explored but the goal is for one side to be definitivelystronger, research seeks to clarify open questions, issues for which prior knowledge isnot definitive. Thus, the writer must strike a balance in the introduction/literaturereview section to conclude in favor of the arguments for the test hypotheses, butmaintain a certain (and even desirable) ambiguity. Novice writers may not know thatscience uses methods to resolve open questions (Lederman 1992), and that a literaturereview serves as an argument for a hypothesis rather than just a historical summary. Inaddition, novices may fail to include strong support for their hypothesis (Schwarz et al.2003) or include obvious or unsupported arguments. Intermediate writers may fail toinclude any reason to doubt their tested hypothesis (i.e., fail to note possible counter-evidence) (Nussbaum and Schraw 2007).
Because of these issues in science writing, instructional tools can help studentsimprove their argumentative writing while minimizing instructional burdens. One tool,the Science Writing Heuristic, for example, seeks to provide students with moreopportunities to practice informal writing in science by developing a framework forstudents to reflect on and discuss course concepts (Keys et al. 1999). It specificallyinvolves templates of suggested strategies for students and teachers to use duringscience activities. For example, early in a science activity, students are given the promptBBeginning ideas—What are my questions?^ The next prompt is BTests—What did Ido?^ There are five other prompts related to observation, claims, evidence, reading, andreflection. These informal writing experiences appear to help students create richerrepresentations of scientific concepts and enable them to respond more deeply torelated test questions (Keys et al. 1999; Hand et al. 2002; Hand et al. 2004).Although a useful instructional tool, the Science Writing Heuristic emphasizes writingto learn science rather than learning to write formal scientific arguments (e.g., studentsdo not write formal reports, but rather are writing learning memos for themselves).Thus, the demand for a method to improve students’ formal writing in science stillremains.
In developing a solution to this problem, one question to ask is: what medium ofrepresentation is ideal for the problem domain beyond use of text itself? At the highestlevel of design, this means choosing a medium from a wide variety of possible media(e.g., visual-spatial, audio, video, simulations). Spatial representations have long beenunderstood to convey a number of benefits in memory (Shepard 1967; Standing 1973;Mandler and Ritchey 1977; Paivio 1986) and reasoning (Larkin and Simon 1987)including within the work of scientists (Cheng 1992; Cheng and Simon 1992; Novick2000; Trafton et al. 2005).
Argument diagrams are a form of spatial representation uniquely suited to the task oforganizing an argument in many different disciplines, and have been used for botharguing to learn and learning to argue, with and without embedded intelligent tutoringsystems that accompany the diagramming tools (Loll and Pinkwart 2013; Suthers2003). Argument diagramming is the process of visually representing an argumentby its component elements. The process of diagramming is cognitively demanding andmay temper benefits if not applied mindfully (Chang et al. 2002), but this may only be
Int J Artif Intell Educ
Author's personal copy
an issue for younger students as college students in psychology showed robust, long-term benefits of diagram creation (McCagg and Dansereau 1991). In spite of thevolume of research establishing these and other affordances of diagrams as a class ofrepresentation, much less research has focused on cognitive aspects of argumentdiagramming. In particular, how does the specific nature of the diagrams influencethe benefits gained from their employment for argumentation? The focus of the presentwork is to explore this question in the context of science writing.
Students who diagrammed new material in social studies performed better on afollow-up retention task than those who did not (Griffin et al. 1995), although thisappears to be an effect of having the diagram content itself rather than the student’screation of it (Stull and Mayer 2007). Further, it is unclear whether the benefits arebetter thought of related to knowledge mapping (i.e., explicitly organizing thoughts) vs.argument diagramming (i.e., creating a particular argument).
In philosophy education, multiple studies indicate the power of creating argumentdiagrams for improving students’ argument analysis skills (Harrell 2008, 2011, 2012)as well as their ability to generate arguments that are more elaborate and cohesive(Harrell 2013). Nussbaum and Schraw (2007) found that the practice of diagrammingarguments enabled students to refute more counterarguments in their opinion writing,although there were tradeoffs in essay quality between argument diagramming andmore traditional criteria instruction—possibly indicating a cost for this improvement.Chryssafidou (2014) also found that a general argumentation diagramming frameworktool improved undergraduates written argument quality in a carefully controlled labstudy. She also found evidence that the argument diagramming has two different kindsof effects: changing the writing planning process to improve semantic aspects of thewriting and supporting the linearization process of a written argument to improverhetorical aspects of the writing.
There is also some indirect evidence supporting the use of diagramming for argu-mentative writing in science education. Recent modeling work has established a directlink between the quality of college students’ diagrams and the resulting science writing,indicating that the coherence and complexity of a student’s diagram can be used topredict the grade earned by the resulting essay (Lynch et al. 2014; Lynch 2014). But itis not known whether the diagrams improve writing, or whether conceptual challengesrevealed in students’ diagrams are also found in students’ writing. Further, to assist inthe design of additional artificial intelligence tools to support writing instruction, it isimportant to learn what gaps remain with just the support of a diagramming tool on itsown.
A further open question relates to the choice of diagram framework (sometimes alsocalled an ontology), whether with or without additional intelligent tutoring support. Adiagram framework specifies the fundamental types of things or concepts that exist forpurposes of constructing a particular kind of argument, and sets out the relations amongthem. The framework used to represent an argument may differ significantly bydiscipline or assignment purposes. For example, a diagram of a research study coulduse hypotheses, findings, studies, and other science-specific node types, but one couldalso utilize a more generic framework like Toulmin’s (1958) which involves claims,warrants, and rebuttals. A number of researchers have explored the use of generalToulmin-style argument frameworks (e.g., Chryssafidou 2014; Stegmann et al. 2007;Stegmann et al. 2012). More general frameworks might be more useful for a wider
Int J Artif Intell Educ
Author's personal copy
range of writing and lend themselves more easily to knowledge transfer. Further,relatively few students taking science classes or even science majors in university goon to become scientists, and thus learning argument forms that are more broadly usefulcould be an important goal. However, a general framework still has some structure andmight seem like an unnecessary complex foreign language to learn that is not native toany discipline. For example, Loll and Pinkwart (2013) found that students struggled inlearning to use Toulmin diagrams (with explicit representations of datum, conclusion,warrant, backing, and rebuttal) relative to more simple frameworks (contributions thatwere either pro or contra other contributions) or domain-specific frameworks (hypoth-eses and facts that were pro or contra each other).
More specific frameworks, however, might better support student reasoning aboutthe concepts found within a discipline or writing genre. For example, in psychology theconcepts of a cited study’s relevance and validity are particularly important. To properlyjudge a piece of evidence in relation to a hypothesis, one needs to know the similarityof their goals and methods (i.e., the study’s relevance), and also the rigor of the citedstudy’s methods (i.e., its validity). Including these domain-specific elements in adiagram framework may be helpful for writing accurately in psychology, but perhapsadd complexity to how much must be learned at once. We are also curious howdiagramming support may generalize to situations of more or less complexity. It ispossible that diagramming is only helpful when students are being heavily challenged.
In sum, argument diagrams may help students think about the complex, multi-faceted relationships among hypotheses and prior findings needed to produce a strongargument for a hypothesis in a scientific paper introduction. The present study utilizedthe online diagramming software LASAD (Loll and Pinkwart 2013) to contribute tothis growing research area first by determining the effect of a diagramming activityversus no diagramming on university students’ writing quality of research paperintroductions, and secondly by determining how the domain-specificity of diagramscomponents impact this effect.
In students’ research paper introductions, we examined the following as measures ofwriting quality: 1) the inclusion of opposing evidence, a common problem in collegelevel writing (Perkins et al. 1991; Knudson 1992; Leitão 2003; Stapleton 2001); and 2)the relevance and validity of citations, a specific challenge in research writing. Wehypothesized that students who do any diagramming activity before writing would bemore likely to include supporting and opposing evidence in their introductions.Additionally, we expected that students who construct diagrams that explicitly promptthem to include information about the relevance and validity of citations would includemore of this information in their introductions.
We tested these hypotheses by analyzing introductions produced by students en-rolled in research methods classes across three different semesters (see Fig. 1). The firstgroup had an unaltered experience in the course to serve as a baseline for comparisons.The second group was given diagramming support for their papers in the form of ageneric argument framework. We did not use Toulmin diagrams because it producedunwieldy large diagrams when representing a scientific literature relevant to introduc-tion of a paper. Instead, a more general representation of science objects (hypotheses,claims, and citations) was used. The third group was also given diagramming support,but in the form of a psychology-specific argument framework that forced explicitrepresentation of key aspects of hypotheses, findings in studies, and the relationship
Int J Artif Intell Educ
Author's personal copy

between findings and hypotheses. The details of this third framework were built afterinitial analyses of weaknesses in the student writing from the first two groups. In otherwords, we used an iterative design-based approach (Anderson and Shattuck 2012) toour research with the goal of maximally supporting student performance.
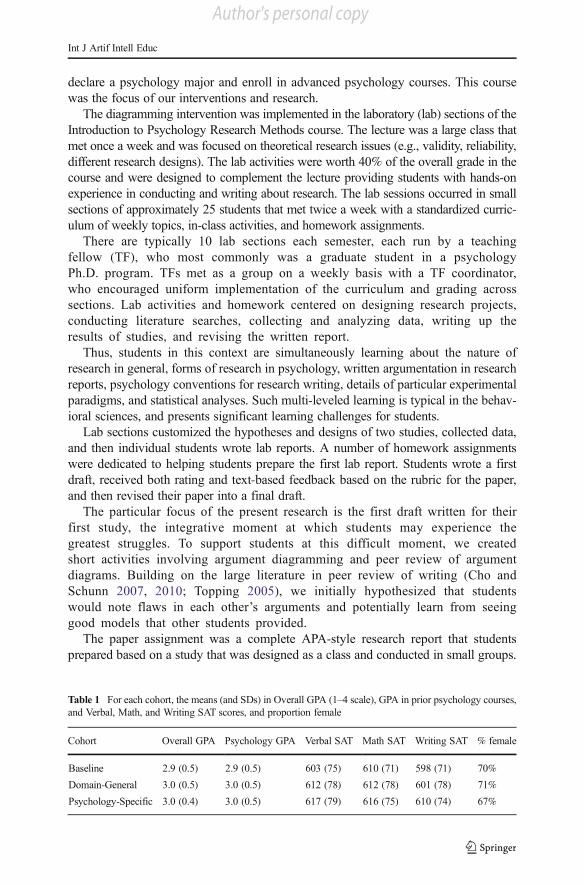
To address concerns about comparability across cohorts, the students across semes-ters were found to be closely matched on demographics and general academic perfor-mance (see Table 1), with at most d = 0.15 effect size in performance on any onedimension. In addition, reflecting a long-standing, many-sectioned course, there was asimilar pool of instructors with equivalent amounts of prior teaching experience (e.g.,half of the TFs each semester had previously taught this course) who enacted anotherwise shared and fixed curriculum.
Although random-assignment to condition has many benefits, it was not logisticallyfeasible to implement different interventions within a lab section in a given semester.Further, implementing the intervention across lab sections within a semester wouldhave raised the risk of confounding teaching fellow (TF) quality and intervention effectgiven the smaller pool of TFs. Finally, the design of the third group’s intervention arosefrom analyses of the strengths and weaknesses of the initial diagramming intervention,as is commonly done in design-based research.
Methods
Instructional Context
The current study was conducted within a psychology department at a large, relativelyselective public university in the United States. All undergraduate students at thisuniversity complete a composition course in their first year, which provides sometraining in argumentative writing. But due in part to the size of the university, manyof the other early general education courses have large-enrollments and require rela-tively little writing. The entry-level courses in psychology are typically large lectures(150 to 300 students) with little-to-no writing and a focus on textbook readings, andthus there is little early exposure to disciplinary argumentation in written form.Students’ first major introduction to disciplinary argumentation is in a psychologyresearch methods course, the successful completion of which is required to officially
Group 3Psychology -specific
framework
Group 2Domain -general
frameworkGroup 1
No support
Research reports
Coding of introductions
Fig. 1 Research design overview
Int J Artif Intell Educ
Author's personal copy
declare a psychology major and enroll in advanced psychology courses. This coursewas the focus of our interventions and research.
The diagramming intervention was implemented in the laboratory (lab) sections of theIntroduction to Psychology Research Methods course. The lecture was a large class thatmet once a week and was focused on theoretical research issues (e.g., validity, reliability,different research designs). The lab activities were worth 40% of the overall grade in thecourse and were designed to complement the lecture providing students with hands-onexperience in conducting and writing about research. The lab sessions occurred in smallsections of approximately 25 students that met twice a week with a standardized curric-ulum of weekly topics, in-class activities, and homework assignments.
There are typically 10 lab sections each semester, each run by a teachingfellow (TF), who most commonly was a graduate student in a psychologyPh.D. program. TFs met as a group on a weekly basis with a TF coordinator,who encouraged uniform implementation of the curriculum and grading acrosssections. Lab activities and homework centered on designing research projects,conducting literature searches, collecting and analyzing data, writing up theresults of studies, and revising the written report.
Thus, students in this context are simultaneously learning about the nature ofresearch in general, forms of research in psychology, written argumentation in researchreports, psychology conventions for research writing, details of particular experimentalparadigms, and statistical analyses. Such multi-leveled learning is typical in the behav-ioral sciences, and presents significant learning challenges for students.
Lab sections customized the hypotheses and designs of two studies, collected data,and then individual students wrote lab reports. A number of homework assignmentswere dedicated to helping students prepare the first lab report. Students wrote a firstdraft, received both rating and text-based feedback based on the rubric for the paper,and then revised their paper into a final draft.
The particular focus of the present research is the first draft written for theirfirst study, the integrative moment at which students may experience thegreatest struggles. To support students at this difficult moment, we createdshort activities involving argument diagramming and peer review of argumentdiagrams. Building on the large literature in peer review of writing (Cho andSchunn 2007, 2010; Topping 2005), we initially hypothesized that studentswould note flaws in each other’s arguments and potentially learn from seeinggood models that other students provided.
The paper assignment was a complete APA-style research report that studentsprepared based on a study that was designed as a class and conducted in small groups.
Table 1 For each cohort, the means (and SDs) in Overall GPA (1–4 scale), GPA in prior psychology courses,and Verbal, Math, and Writing SAT scores, and proportion female
Cohort Overall GPA Psychology GPA Verbal SAT Math SAT Writing SAT % female
Baseline 2.9 (0.5) 2.9 (0.5) 603 (75) 610 (71) 598 (71) 70%
Domain-General 3.0 (0.5) 3.0 (0.5) 612 (78) 612 (78) 601 (78) 71%
Psychology-Specific 3.0 (0.4) 3.0 (0.5) 617 (79) 616 (75) 610 (74) 67%
Int J Artif Intell Educ
Author's personal copy
Papers were approximately 10–12 double-spaced pages total with the introductiontypically 1 to 2 pages long. As described in the grading rubric given to all the students,the introduction of the lab report was to:
(a) Describe your research problem or question and say why it is important.(b) Contextualize your study and distinguish it from prior research.(c) Preview your study design.(d) Describe your hypotheses.(e) Provide a convincing justification for each hypothesis.All students read one common instructor-selected journal article on the topic, but
then students had to find their own articles to include in their research report assupporting a hypothesis. Students in this class were encouraged to investigate simplehypotheses of the following form: Independent variables (IVs) X and Y cause changesin a dependent variable (DV) Z (possibly among population W). For instance, thehypothesis may concern the effects of gender and time of day on gratitude amongcoffee drinkers or the role of seat location and class size on student participation inclass. TFs provided some feedback on the suitability of the research question. In thefirst two cohorts, students were instructed to include two hypotheses in their paper (Xand Y), but in the third cohort, students were given the option of including one or twohypotheses to study. This change was to determine if diagramming may be morehelpful at higher levels of task complexity. All students were instructed to include bothopposing and supporting studies as part of the justification for their hypotheses.
Participants
Exhaustively grading all students’ papers across all three cohorts exceeded theresources of the research project and would have been unnecessary from astatistical power perspective. Instead, stratified (by lab section) random samplesfrom each group were taken and carefully coded to represent the diverse labsections and students in each lab section.
Control Group The course instructor randomly selected thirty-two participants foranalysis from across eight different lab sections from one fall semester of researchmethods classes that did not receive diagramming support. Thirty essays (matching theN for the Domain-general group) from this sample were coded and analyzed.
Domain-General Group All students across nine different lab sections of the samecourse, also during the fall semester, but in the following year, were given diagrammingsupport using a generic argument framework. From this group, a stratified randomsample of 30 essays was coded and analyzed to represent all lab sections.
Psychology-Specific Group All students across nine different lab sections of the sameresearch methods course taught during the fall semester of a subsequent year weregiven diagramming support using a psychology-specific argument framework. Out ofnine original lab sections, data from six sections (n = 134) were retained. One TF didnot attend training sessions and another TF, teaching two sections, fundamentallyaltered the writing assignment. From this set, a stratified random sample of 60 essayswas coded and analyzed.
Int J Artif Intell Educ
Author's personal copy
Argument Diagrams
Domain-General Framework Our study in both diagramming conditions utilizedLASAD (Loll and Pinkwart 2013), an online diagramming tool that allows users tocreate visual representations of arguments, including both the elements of an argumentand their relationships. In LASAD, arguments are represented using a structuredargument framework of specific object and relationship types, and further there canbe pre-specified fields to be filled-in by students inside both objects and relationshipsbetween objects. Diagramming frameworks can be customized for each learningcontext. We customized the frameworks to represent the core elements of scientificargumentation that students were expected to include in the introductions to theirlaboratory reports. Specifically, our diagramming frameworks supported students inmapping out an argument for their hypotheses based on a review of studies andtheories.
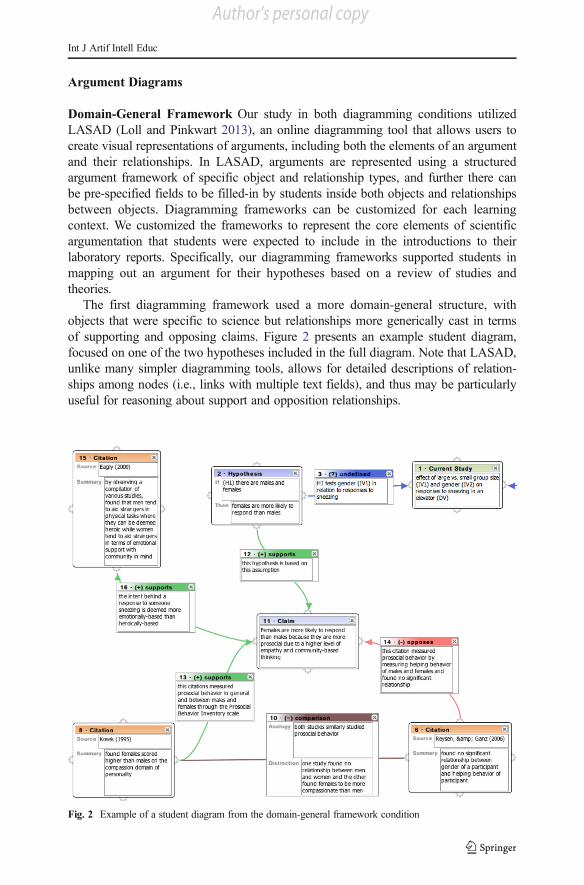
The first diagramming framework used a more domain-general structure, withobjects that were specific to science but relationships more generically cast in termsof supporting and opposing claims. Figure 2 presents an example student diagram,focused on one of the two hypotheses included in the full diagram. Note that LASAD,unlike many simpler diagramming tools, allows for detailed descriptions of relation-ships among nodes (i.e., links with multiple text fields), and thus may be particularlyuseful for reasoning about support and opposition relationships.
Fig. 2 Example of a student diagram from the domain-general framework condition
Int J Artif Intell Educ
Author's personal copy
The node types of the domain-general framework are illustrated in Fig. 2.Hypothesis nodes state the student’s prediction of a data pattern in the form of aconditional (if/then) statement about a prediction about a situation (the if part) andpredicted pattern (the then part) e.g., BIf it is a busy time of day and the area in questionhas low traffic, then drivers will not obey the law and will not stop at the stop sign.^Current Study nodes provide a general description of the study, usually just mentioningthe overall independent and dependent variables to be used in the study, with eachlabelled as such with BIV^and BDV .̂ Claim nodes provide reasoning for the hypothesis(analogous to Toulmin’s Warrant), in essence saying something about the underlyingmechanism. They are supported by Citation nodes (analogous to Toulmin’s Grounds/Evidence), which names the paper(s) and includes a short summary of the finding fromthe paper that is relevant to the connected claim.
In LASAD, links also have a box with structured content. Supports andOpposes are links that connect a Study to a Hypothesis node or a Claim nodeand explain why either relationship is indicated (e.g., why a finding supports aclaim). Sometimes the connections are obvious, but sometimes the exact con-structs named in the claim do not precisely match the variables measured in thestudy and the students need to articulate the mapping. Comparison links connecttwo Citation nodes or a Citation and the Current Study node on the basis of studydesign and findings, requiring students to articulate ‘analogies’ and ‘distinctions’(similarities and differences). The purpose of the comparison links is to helpstudents find reasons for why there are sometimes both supporting and opposingfindings for a claim, and thereby suggest a resolution to the opposition (e.g., underwhich circumstances the findings are obtained). To make the diagram complete, anBundefined^ link connected the hypotheses to the current study. All links except thecomparison links were directional, but the directions are not important to the interven-tion and students often had the arrows going in mismatching ways in their diagrams.
Psychology-Specific Framework For the second diagramming iteration, we sought todevelop and test a LASAD framework that was more domain-specific, especiallyincluding features particularly relevant and important for argumentation in psychology.The My-Study nodes now included an overall research question, description of thedesign in terms of variables but also details such as within vs. between subjects, and adescription of the content of the study (to help support reasoning about relevance ofprior work). Finding nodes replaced Claim nodes to represent the empirical findingssupported by one or multiple studies because some students were confused about whatexactly should go in a claim node. Specific fields were added to the Finding node,requiring students to note IVs and DVs and the observed relationships among variables.Study nodes were adjusted to require a comment about the context of the study to helpstudents reason about relevance of those studies to their own context. Note that multiplestudies could relate to one research finding (e.g., two studies both support the findingthat people are more likely to help when there are fewer bystanders), and one studycould produce multiple findings (e.g., a single study finds that within larger groupspeople are both less likely to help and slower to help).
Specific content was also added to the Supports and Opposes links, in whichstudents rated how relevant the finding was to their hypothesis or a study to a finding(close, medium, far, unsure), how valid it was (strong, medium, weak, unsure), and
Int J Artif Intell Educ
Author's personal copy
provided justification for both ratings. In addition, students were explicitly prompted towrite about the reasoning for the proposed relevance and validity. For the link betweena study and a finding, relevance was defined as how strongly the study supported thefinding (e.g. how large was the effect) and validity was determined by the methodo-logical soundness of the study. For the link between a finding and a hypothesis,relevance was the amount of conceptual overlap between the finding and hypothesis(e.g., did they use similar independent and dependent variables) and validity was theoverall validity of all the studies related to the finding.
The Comparison links were removed, because the content within the Finding andStudy nodes was now being used to explicitly support reasoning about relevance andvalidity and because the comparison links substantially complicate the diagrams thatnow contain much larger nodes. As a minor change, the Bundefined^ link was replacedby a Bpart of^ link to give a more sensible name to the link between multiplehypotheses and the Current Study (or My-Study) node.
By following one thread of a student’s argument diagram from Current Study toCitation, the nature of the diagramming framework differences can be better under-stood. In the domain-general framework (e.g., as shown in Fig. 2), the student’sCurrent Study is the effect of group size on responses to sneezing (e.g. BBless you^),and they Hypothesize that with a larger group less people will respond. ThisHypothesisis Supported by the Claim that larger group size inhibits prosocial behavior throughreduced personal connection; which is Supported by a Citation of BLevine andCrowther (2008)^ who found that larger group size inhibited helping behavior whenbystanders were strangers to a victim.
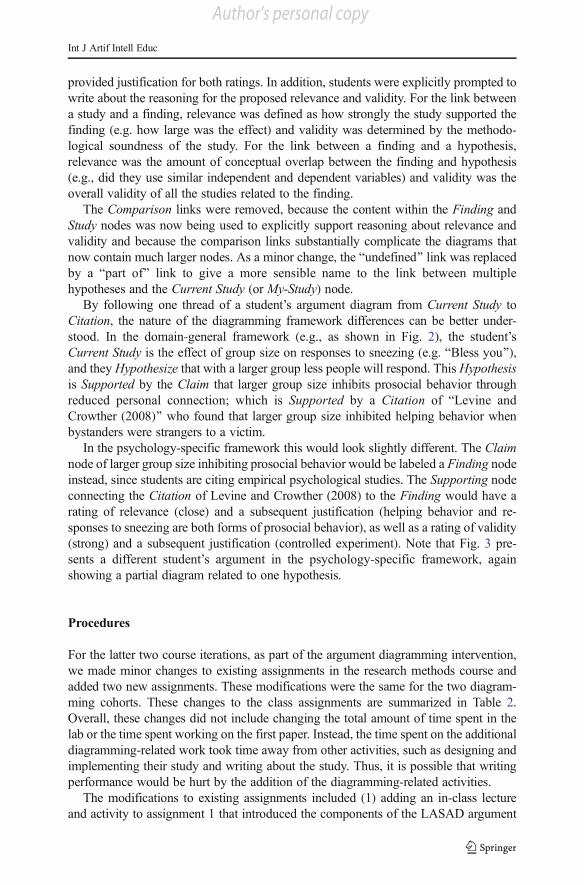
In the psychology-specific framework this would look slightly different. The Claimnode of larger group size inhibiting prosocial behavior would be labeled a Finding nodeinstead, since students are citing empirical psychological studies. The Supporting nodeconnecting the Citation of Levine and Crowther (2008) to the Finding would have arating of relevance (close) and a subsequent justification (helping behavior and re-sponses to sneezing are both forms of prosocial behavior), as well as a rating of validity(strong) and a subsequent justification (controlled experiment). Note that Fig. 3 pre-sents a different student’s argument in the psychology-specific framework, againshowing a partial diagram related to one hypothesis.
Procedures
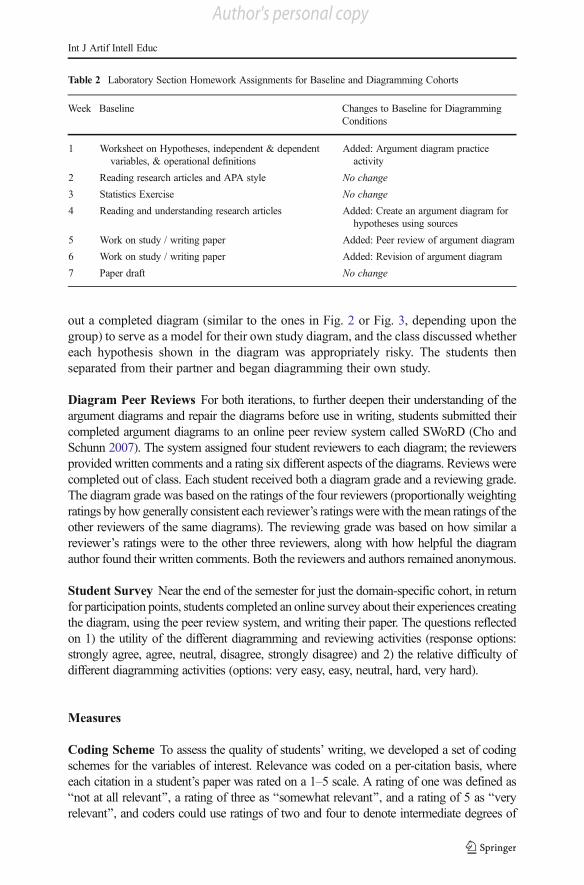
For the latter two course iterations, as part of the argument diagramming intervention,we made minor changes to existing assignments in the research methods course andadded two new assignments. These modifications were the same for the two diagram-ming cohorts. These changes to the class assignments are summarized in Table 2.Overall, these changes did not include changing the total amount of time spent in thelab or the time spent working on the first paper. Instead, the time spent on the additionaldiagramming-related work took time away from other activities, such as designing andimplementing their study and writing about the study. Thus, it is possible that writingperformance would be hurt by the addition of the diagramming-related activities.
The modifications to existing assignments included (1) adding an in-class lectureand activity to assignment 1 that introduced the components of the LASAD argument
Int J Artif Intell Educ
Author's personal copy

diagramming framework, and (2) adding to assignment 4 the task of creating an argumentdiagram that justified their hypotheses using the sources collected for assignments 3 and 4.Additional assignments included conducting blind peer reviews of three other student’sargument diagrams using the SWoRD online peer-review system (Cho and Schunn 2007)and a revision of their initial argument diagram based on peer feedback. The revisedargument diagram was submitted to their TF for grading. Students then used feedbackfrom their TFs on the argument diagram to generate a rough draft of their introductions fortheir lab reports. Thus, this study examines a naturalistic system of instruction usingargument diagrams (i.e., training, creation, peer review, and TF feedback all with argumentdiagrams), not just the initial task of creating the diagrams.
For training, students first made an argument diagram in pairs based on a short textdescribing a hypothetical student’s study, hypotheses and supporting and opposingstudies. When most pairs had completed at least half of the diagram, the teacher handed
Fig. 3 Example of a student diagram from the psychology-specific framework
Int J Artif Intell Educ
Author's personal copy
out a completed diagram (similar to the ones in Fig. 2 or Fig. 3, depending upon thegroup) to serve as a model for their own study diagram, and the class discussed whethereach hypothesis shown in the diagram was appropriately risky. The students thenseparated from their partner and began diagramming their own study.
Diagram Peer Reviews For both iterations, to further deepen their understanding of theargument diagrams and repair the diagrams before use in writing, students submitted theircompleted argument diagrams to an online peer review system called SWoRD (Cho andSchunn 2007). The system assigned four student reviewers to each diagram; the reviewersprovided written comments and a rating six different aspects of the diagrams. Reviews werecompleted out of class. Each student received both a diagram grade and a reviewing grade.The diagram grade was based on the ratings of the four reviewers (proportionally weightingratings by how generally consistent each reviewer’s ratingswerewith themean ratings of theother reviewers of the same diagrams). The reviewing grade was based on how similar areviewer’s ratings were to the other three reviewers, along with how helpful the diagramauthor found their written comments. Both the reviewers and authors remained anonymous.
Student Survey Near the end of the semester for just the domain-specific cohort, in returnfor participation points, students completed an online survey about their experiences creatingthe diagram, using the peer review system, and writing their paper. The questions reflectedon 1) the utility of the different diagramming and reviewing activities (response options:strongly agree, agree, neutral, disagree, strongly disagree) and 2) the relative difficulty ofdifferent diagramming activities (options: very easy, easy, neutral, hard, very hard).
Measures
Coding Scheme To assess the quality of students’ writing, we developed a set of codingschemes for the variables of interest. Relevance was coded on a per-citation basis, whereeach citation in a student’s paper was rated on a 1–5 scale. A rating of one was defined asBnot at all relevant^, a rating of three as Bsomewhat relevant^, and a rating of 5 as Bveryrelevant^, and coders could use ratings of two and four to denote intermediate degrees of
Table 2 Laboratory Section Homework Assignments for Baseline and Diagramming Cohorts
Week Baseline Changes to Baseline for DiagrammingConditions
1 Worksheet on Hypotheses, independent & dependentvariables, & operational definitions
Added: Argument diagram practiceactivity
2 Reading research articles and APA style No change
3 Statistics Exercise No change
4 Reading and understanding research articles Added: Create an argument diagram forhypotheses using sources
5 Work on study / writing paper Added: Peer review of argument diagram
6 Work on study / writing paper Added: Revision of argument diagram
7 Paper draft No change
Int J Artif Intell Educ
Author's personal copy
relevance. If a student did not include enough information to determine the relevance of acitation, it was coded as a 0 and not included in analyses. For each citation, the two coders’ratings were averaged (α = .62). Exhaustive double-coding produces a sufficient effectivereliability of the average ratings across coders. Then, these values were then averaged acrossall citations in a student’s paper to produce three values of mean, minimum, and maximumcitation relevance per student paper. Thirty essays each were coded for relevance from thecontrol and domain-general cohorts, and 40 from the psychology-specific cohort—a suffi-cient number to test this effect.
Thirty essays each were coded for a second set of dimensions from the control anddomain-general cohorts, while 60 essays were coded from the domain-specific cohort. In allcases, essayswere exhaustively double-coded to improve effective reliability. The second setof dimensions included: Clear hypotheses (k = .80), supporting citations (k = .68), opposingcitations (k = .70), and writing about validity (k = .52), coded as present (1) or absent (0) foreach dimension by two coders. For instance, if a student had at least one opposing citation,that dimension would be marked as present (1); if they had at least one instance of writingabout citation validity that dimension would be marked as present.
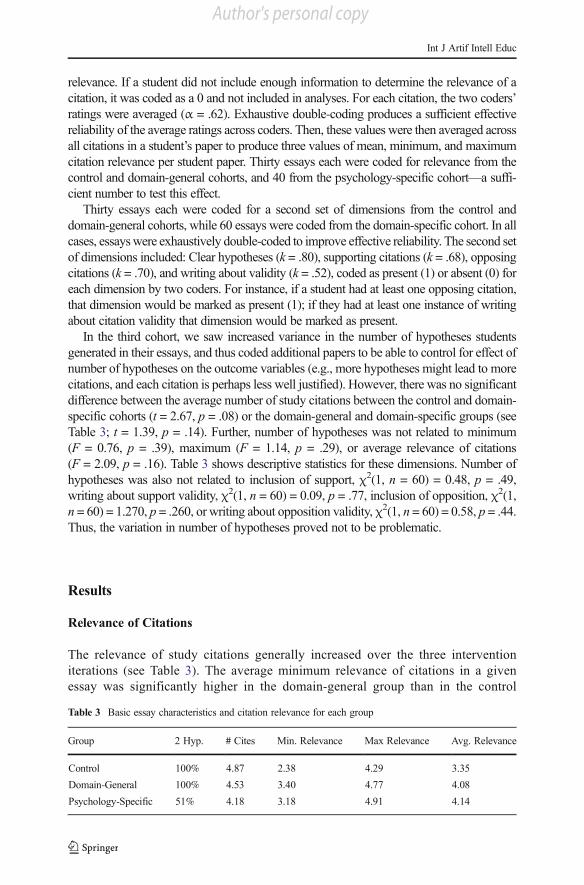
In the third cohort, we saw increased variance in the number of hypotheses studentsgenerated in their essays, and thus coded additional papers to be able to control for effect ofnumber of hypotheses on the outcome variables (e.g., more hypotheses might lead to morecitations, and each citation is perhaps less well justified). However, there was no significantdifference between the average number of study citations between the control and domain-specific cohorts (t = 2.67, p = .08) or the domain-general and domain-specific groups (seeTable 3; t = 1.39, p = .14). Further, number of hypotheses was not related to minimum(F = 0.76, p = .39), maximum (F = 1.14, p = .29), or average relevance of citations(F = 2.09, p = .16). Table 3 shows descriptive statistics for these dimensions. Number ofhypotheses was also not related to inclusion of support, χ2(1, n = 60) = 0.48, p = .49,writing about support validity, χ2(1, n = 60) = 0.09, p = .77, inclusion of opposition, χ2(1,n = 60) = 1.270, p = .260, or writing about opposition validity, χ2(1, n = 60) = 0.58, p = .44.Thus, the variation in number of hypotheses proved not to be problematic.
Results
Relevance of Citations
The relevance of study citations generally increased over the three interventioniterations (see Table 3). The average minimum relevance of citations in a givenessay was significantly higher in the domain-general group than in the control
Table 3 Basic essay characteristics and citation relevance for each group
Group 2 Hyp. # Cites Min. Relevance Max Relevance Avg. Relevance
Control 100% 4.87 2.38 4.29 3.35
Domain-General 100% 4.53 3.40 4.77 4.08
Psychology-Specific 51% 4.18 3.18 4.91 4.14
Int J Artif Intell Educ
Author's personal copy
group, t(57) = 4.10, p < .001, d = 1.09, and higher in the psychology-specificgroup than in the control group, t(65) = 3.21, p = .002, d = 0.80, but notdifferent between the domain-general and domain-specific groups, t(66) = .82,p = .41, d = 0.20. The average maximum relevance of citations in a givenessay was significantly higher for the domain-general group than the controlgroup t(57) = .27, p < .01, d = 0.73, and higher in the domain-specific groupthan the control group, t(65) = 4.65, p < .001, d = 1.15, but not differentbetween the domain-general and domain-specific groups. The average relevanceof study citations was higher in the domain-general, t(57) = 3.86, p < .001,d = 1.24, and domain-specific groups, t(65) = 5.04, p < .001, d = 1.25, thanthe control group, but was not different between the two diagramming frame-works, t(66) = .37, p = .70, d = 0.09. In sum, both types of diagrams improvedcitation relevance and they did so to an equivalent extent.
Inclusion of Supporting and Opposing Evidence
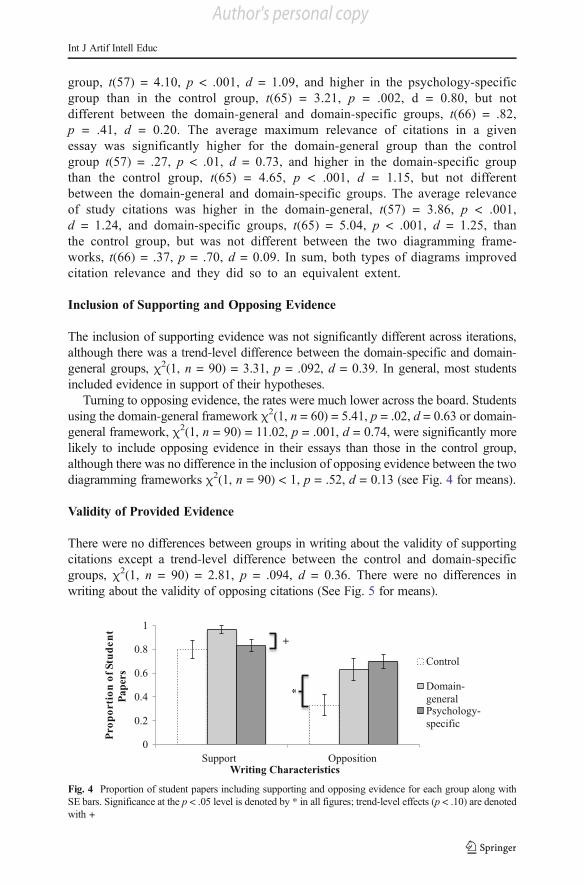
The inclusion of supporting evidence was not significantly different across iterations,although there was a trend-level difference between the domain-specific and domain-general groups, χ2(1, n = 90) = 3.31, p = .092, d = 0.39. In general, most studentsincluded evidence in support of their hypotheses.
Turning to opposing evidence, the rates were much lower across the board. Studentsusing the domain-general framework χ2(1, n = 60) = 5.41, p = .02, d = 0.63 or domain-general framework, χ2(1, n = 90) = 11.02, p = .001, d = 0.74, were significantly morelikely to include opposing evidence in their essays than those in the control group,although there was no difference in the inclusion of opposing evidence between the twodiagramming frameworks χ2(1, n = 90) < 1, p = .52, d = 0.13 (see Fig. 4 for means).
Validity of Provided Evidence
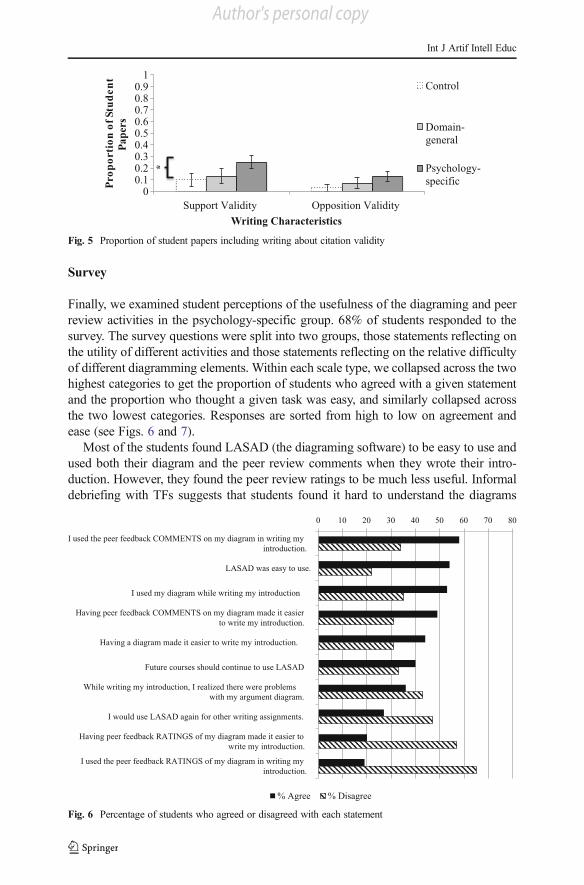
There were no differences between groups in writing about the validity of supportingcitations except a trend-level difference between the control and domain-specificgroups, χ2(1, n = 90) = 2.81, p = .094, d = 0.36. There were no differences inwriting about the validity of opposing citations (See Fig. 5 for means).
0
0.2
0.4
0.6
0.8
1
Support Opposition
tnedutSfonoitroporP
Pape
rs
Writing Characteristics
Control
Domain-generalPsychology-specific
+*
Fig. 4 Proportion of student papers including supporting and opposing evidence for each group along withSE bars. Significance at the p < .05 level is denoted by * in all figures; trend-level effects (p < .10) are denotedwith +
Int J Artif Intell Educ
Author's personal copy
Survey
Finally, we examined student perceptions of the usefulness of the diagraming and peerreview activities in the psychology-specific group. 68% of students responded to thesurvey. The survey questions were split into two groups, those statements reflecting onthe utility of different activities and those statements reflecting on the relative difficultyof different diagramming elements. Within each scale type, we collapsed across the twohighest categories to get the proportion of students who agreed with a given statementand the proportion who thought a given task was easy, and similarly collapsed acrossthe two lowest categories. Responses are sorted from high to low on agreement andease (see Figs. 6 and 7).
Most of the students found LASAD (the diagraming software) to be easy to use andused both their diagram and the peer review comments when they wrote their intro-duction. However, they found the peer review ratings to be much less useful. Informaldebriefing with TFs suggests that students found it hard to understand the diagrams
00.10.20.30.40.50.60.70.80.9
1
Support Validity Opposition Validity
tnedutSfonoitroporP
Pape
rs
Writing Characteristics
Control
Domain-general
Psychology-specific
*
Fig. 5 Proportion of student papers including writing about citation validity
0 10 20 30 40 50 60 70 80
I used the peer feedback COMMENTS on my diagram in writing myintroduction.
LASAD was easy to use.
I used my diagram while writing my introduction
Having peer feedback COMMENTS on my diagram made it easierto write my introduction.
Having a diagram made it easier to write my introduction.
Future courses should continue to use LASAD
While writing my introduction, I realized there were problemswith my argument diagram.
I would use LASAD again for other writing assignments.
Having peer feedback RATINGS of my diagram made it easier towrite my introduction.
I used the peer feedback RATINGS of my diagram in writing myintroduction.
% Agree % Disagree
Fig. 6 Percentage of students who agreed or disagreed with each statement
Int J Artif Intell Educ
Author's personal copy
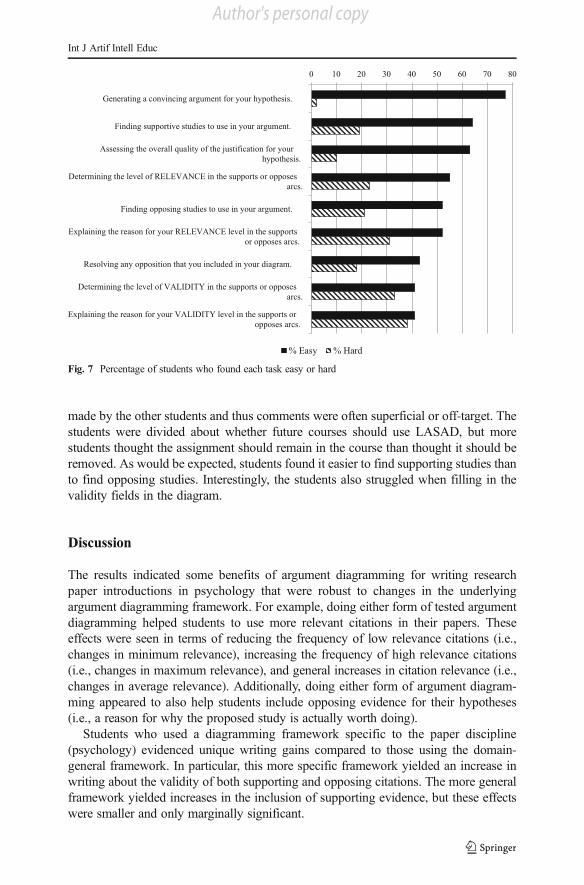
made by the other students and thus comments were often superficial or off-target. Thestudents were divided about whether future courses should use LASAD, but morestudents thought the assignment should remain in the course than thought it should beremoved. As would be expected, students found it easier to find supporting studies thanto find opposing studies. Interestingly, the students also struggled when filling in thevalidity fields in the diagram.
Discussion
The results indicated some benefits of argument diagramming for writing researchpaper introductions in psychology that were robust to changes in the underlyingargument diagramming framework. For example, doing either form of tested argumentdiagramming helped students to use more relevant citations in their papers. Theseeffects were seen in terms of reducing the frequency of low relevance citations (i.e.,changes in minimum relevance), increasing the frequency of high relevance citations(i.e., changes in maximum relevance), and general increases in citation relevance (i.e.,changes in average relevance). Additionally, doing either form of argument diagram-ming appeared to also help students include opposing evidence for their hypotheses(i.e., a reason for why the proposed study is actually worth doing).
Students who used a diagramming framework specific to the paper discipline(psychology) evidenced unique writing gains compared to those using the domain-general framework. In particular, this more specific framework yielded an increase inwriting about the validity of both supporting and opposing citations. The more generalframework yielded increases in the inclusion of supporting evidence, but these effectswere smaller and only marginally significant.
0 10 20 30 40 50 60 70 80
Generating a convincing argument for your hypothesis.
Finding supportive studies to use in your argument.
Assessing the overall quality of the justification for yourhypothesis.
Determining the level of RELEVANCE in the supports or opposesarcs.
Finding opposing studies to use in your argument.
Explaining the reason for your RELEVANCE level in the supportsor opposes arcs.
Resolving any opposition that you included in your diagram.
Determining the level of VALIDITY in the supports or opposesarcs.
Explaining the reason for your VALIDITY level in the supports oropposes arcs.
% Easy % Hard
Fig. 7 Percentage of students who found each task easy or hard
Int J Artif Intell Educ
Author's personal copy
Theoretical Implications
We see two possible explanations for the relative differences of these effects in theirrobustness to argument diagram framework. The first explanation is based on therelative salience of different features in the spatial representations of an argumentdiagram. Argument diagrams that generally connect evidence for and against makesalient the relevance of citations and the inclusion of opposition. Such diagrams leadstudents to think about whether citations they have found are indeed relevant, andperhaps clarify for which hypothesis they are relevant if multiple hypotheses areproposed. Opposition is made salient by showing clearly when there is in fact noopposition. In contrast, the validity of the supporting citations is not directly represent-ed in the spatial connections of the diagram and depends more upon the internal, moretextual aspects of the diagram. Thus it may be that explicit writing about the validity ofcitations was influenced by the framework because these distinctions are not supportedin the spatial layout of the diagram but rather within the text fields of the diagram (andthis is what varied primarily across frameworks). This explanation, however, does notexplain why the domain-general framework resulted in more students includingsupporting evidence, as this is a higher-level issue that should be made apparent byany spatial representation. It should be noted, though, that this effect was onlymarginally significant.
A second explanation is based on the relative difficulty of these specific writingchallenges, and that harder aspects of writing require more direct support. Therelevance of study citations and inclusion of opposition are relatively easy to spotand solve, and thus any diagramming activity regardless of quality of frameworkshould make dealing with them easier for students. In contrast, writing about thescientific validity of individual studies is more difficult, so students may need theadditional scaffolding provided by a psychology-specific framework in order toeffectively accomplish it. This explanation also lacks a strong prediction for whythe domain-general framework increased the inclusion of supporting evidence, butone can imagine that it is actually much easier to determine if a particular studydirectly opposes a hypothesis than it is to determine if it supports it. If thisdifficulty difference exists, it would explain the difference in results. It is alsopossible that both of these explanations play a role in the difference betweenframeworks.
Overall, it appears that some combination of these ideas (relative salience andrelative writing difficulty) are needed to fully account for the results. More generally,these data point to the two-part value contained in well-designed argument diagram-ming activities: 1) the spatial structure of argument diagrams makes some kinds ofargument aspects particularly salient, and 2) the detailed textual structure of argumentdiagram components make other aspects of an argument salient. Thus, argumentdiagrams are importantly a hybrid spatial-symbolic tool for supporting thinking andreasoning. Previous studies on argument diagramming lack theoretical explanations forits effects and are generally focused on classroom applications and implications ratherthan theoretical understanding. Our explanations may form a starting point for futureresearch to build a deeper theoretical understanding of these representations, whichshould include investigation of the cognitive mechanisms involved in creating andusing argument diagrams.
Int J Artif Intell Educ
Author's personal copy
Practical Implications
At a more practical level, the results of this study indicate that diagramming is a usefulpractice to employ in college-level psychology courses to improve students’ writing,and should be integrated into curricula. Our findings support previous research in thisarea showing that diagramming can be beneficial for students in many educationaldomains (Nussbaum and Shraw 2007; Harrell 2013; Griffin et al. 1995), includingscience writing. Previous work has looked at the inclusion of supporting and opposingevidence in argumentation, but we are the first to show that argument diagrammingbenefits citation relevance and writing about citation validity, important components ofscientific argumentation. Our research also explores diagramming framework varia-tions, building on the working of Loll and Pinkwart (2013), now showing that adaptinga diagramming framework to the task at hand (at least in psychology) confers additionalbenefits to students above and beyond those of a more domain-general diagramframework.
Regarding whether domain-general or domain-specific frameworks should be useddepends upon the relative importance of various learning objectives. Given that theunique effects of a domain-specific diagramming framework were small, a goodargument could be made for using more domain-general frameworks. Indeed, relativelyfew of the undergraduates in this course (or any introductory science course) will go onto become scientists. Such an emphasis would allow for students to use similardiagramming techniques across courses in various disciplines (Philosophy,Psychology, Physics, etc.). This would facilitate corroboration of scientific evidenceconcerning diagramming and narrow the diversity of diagramming frameworks forcomparison. Validity, however, is a central, deep structural concept in research, andperhaps the most important aspect of the research activity. Thus, from the perspective ofwriting-to-learn about science, the improvements in treatment of the validity conceptcould be deemed sufficiently important to warrant use of the domain-specific frame-work. More research is needed to determine the size of these specific improvements,though, as only trend-level increases were found in this study.
Limitations
This study did not utilize a strict experimental design (three iterations with threedifferent cohorts), meaning that cohort effects are possible alternative explanationsfor the condition differences. However, we attempted to control for this by ensuring thatall three cohorts were similar in GPA and other academic characteristics, and we used avariety of teaching fellows who themselves had similar characteristics (e.g., similarproportion of experienced instructors), making it unlikely that differences stemmedfrom a particularly effective teaching fellow. Further, the use of multiple teachingfellows shows some robustness of the effects across a range of qualities/styles ofinstructional support that are commonly found in these contexts. Nonetheless, itwould be valuable to conduct a randomized experiment that varies diagrammingframeworks to replicate the current results. Further, such an experiment mightfurther explore the effects of different features of the diagramming framework thatwere all varied at once in the current study (e.g., the types of nodes and the depthof support in the nodes).
Int J Artif Intell Educ
Author's personal copy
Another important consideration is the intervention’s use of a system of instructioninvolving argument diagrams (i.e., it involves creating diagrams, considering otherstudents’ diagrams, receiving feedback on diagrams). In particular, since the effects ofpeer review of diagrams, more explicit attention (of any form) to the components of agood introductory argument, or the specific implementation details of LASAD wereinseparable from the effects of a creating diagramming task in this study, we do notknow which of these elements of the diagramming intervention are responsible for theoverall effects. Based on their survey responses, however, students did not believe thepeer review process of diagrams to be very helpful to their writing. Only 50% ofstudents in the domain-specific group found peer feedback comments helpful to thetask, and only 20% of those students found peer feedback ratings helpful. Further,LASAD is similar to many other tools for diagramming at a basic structural level. Thusit is unlikely that factors beyond the core diagram structures themselves played a largerole in the writing gains seen here.
Conclusions
The use of argument diagramming in education has been supported by previousresearch in this area (Nussbaum and Shraw 2007; Harrell 2013; Griffin et al. 1995;Lynch et al. 2014; Lynch 2014), but this study presents the first attempt to rigorouslystudy differences in diagramming framework, in this case, the difference between adomain-general versus a domain (psychology)-specific framework. Our results supportprior findings (Nussbaum and Shraw 2007; Harrell 2013; Griffin et al. 1995) that anykind of diagramming activity can be helpful for writing – science writing in particular.Both of the studied diagramming frameworks helped students to include more relevantcitations in their papers and include evidence opposing their hypotheses. The data alsoindicate that these effects are relatively robust across diagramming framework changes,but that a psychology-specific framework can aid students in writing more about thevalidity of cited studies.
The difference in effects between the two diagramming framework types may beexplained by the level of writing issues, where high-level issues (relevance, opposition)can be identified using any spatial representation, but that lower-level issues (writingabout validity of citations) can be more easily identified with a domain-specificdiagramming framework. Alternatively or additionally, the difference may be explainedby the relative difficulty of writing issues. Citation relevance and the inclusion ofopposition may be easier for students to grasp, so any diagramming frameworkfacilitates their improvement; while writing about citation validity are harder todeal with so students require the extra scaffolding of a domain-specific frameworkin order to improve them. Additional research in this area will help determinewhich explanation is stronger, and what other benefits argument diagramming mayelicit for students.
Acknowledgements This research was supported by the National Science Foundation Grant IIS-1122504.Any opinions expressed in this work reflect those of the authors and do not necessarily reflect those of theNational Science Foundation or the University of Pittsburgh. We would like to thank Diane Litman and HuyNyugen for their help and feedback on this project.
Int J Artif Intell Educ
Author's personal copy
References
Anderson, T., & Shattuck, J. (2012). Design-based research a decade of progress in education research?Educational Researcher, 41(1), 16–25.
Andrews, R. (1995). Teaching and learning argument. London: Cassell.Andrews, R. (2010). Argumentation in higher education: improving practice through theory and research.
New York: Routledge.Andrews, R., & Mitchell, S. (2001). Essays in argument. Middlesex University Press.Applebee, A. N., & Langer, J. A. (2011). A snapshot of writing instruction in middle schools and high schools.
The English Journal, 100(6), 14–27.Arum, R., & Roska, J. (2011). Academically adrift: limited learning on college campuses. Chicago: University of
Chicago Press.Chang, K.-E., Sung, Y. T., &Chen, I.-D. (2002). The effect of concept mapping to enhance text comprehension and
summarization. The Journal of Experimental Education, 71(1), 5–23. doi:10.1080/00220970209602054.Cheng, P. C.-H. (1992). Diagrammatic reasoning in scientific discovery: modeling Galileo’s kinematic
diagrams. In H. Narayanan (Ed.), AAAI technical report on reasoning with diagrammatic representations(Report No. SS-92-02, pp. 33–38). Menlo Park: American Association for Artificial Intelligence.
Cheng, P. C.-H., & Simon, H. A. (1992). The right representation for discovery: finding the conservation ofmomentum. In D. Sleeman & P. Edwards (Eds.), Machine learning: proceedings of the ninth interna-tional conference (pp. 62–71). San Mateo: Kaufmann.
Cho, K., & Schunn, C. D. (2007). Scaffolded writing and rewriting in the discipline: a web-based reciprocalpeer review system. Computers and Education, 48(3), 409–426.
Cho, K., & Schunn, C. D. (2010). Developing writing skills through students giving instructional explana-tions. In M. K. Stein & L. Kucan (Eds.), Instructional explanations in the disciplines: talk, texts andtechnology. New York: Springer.
Chryssafidou, E. (2014). Argument diagramming and planning cognition in argumentative writing (Doctoraldissertation, University of Birmingham).
De La Paz, S., Ferretti, R., Wissinger, D., Yee, L., & MacArthur, C. (2012). Adolescents’ disciplinary use ofevidence, argumentative strategies, and organizational structure in writing about historical controversies.Written Communication, 29(4), 412–454.
Goldman, A. I. (1994). Argumentation and social epistemology. The Journal of Philosophy, 91(1), 27–49.Griffin, C. C., Malone, L. D., & Kameenui, E. J. (1995). Effects of graphic organizer instruction non fifth-grade
students. The Journal of Educational Research, 89(2), 98–107. doi:10.1080/00220671.1995.9941200.Gustafson, B. J., & Shanahan, M. C. (2007). Supporting inquiry in the elementary classroom: the role of
scientific argument. Science Educ, 38(2), 1.Hahn, U., & Oaksford, M. (2012). Rational argument. In K. J. Holyoak & R. G. Morrison (Eds.), The Oxford
handbook of thinking and reasoning (pp. 277–300). New York: Oxford University Press.Hand, B., Prain, V., & Wallace, C. (2002). Influences of writing tasks on students’ answers to recall and
higher-level test questions. Research in Science Education, 32, 19–34. doi:10.1023/A:1015098605498.Hand, B., Wallace, C. W., & Yang, E. (2004). Using a science writing heuristic to enhance learning outcomes
from laboratory activities in seventh-grade science: quantitative and qualitative aspects. InternationalJournal of Science Education, 26(2), 131–149. doi:10.1080/0950069032000070252.
Harrell, M. (2008). No computer program required: even pencil-and-paper argument mapping improvescritical thinking skills. Teaching Philosophy, 31, 351–374.
Harrell, M. (2011). Argument diagramming and critical thinking in introductory philosophy.Higher EducationResearch & Development, 30(3), 371–385.
Harrell, M. (2012). Assessing the efficacy of argument diagramming to teach critical thinking skills inintroduction to philosophy. Inquiry, 27(2), 31–38. doi:10.5840/inquirtyct201227210.
Harrell, M. (2013). Improving first-year writing using argument diagramming. Proceedings of the 35th AnnualConference of the Cognitive Science Society.
Keys, C. W., Hand, B., Prain, V., & Collins, S. (1999). Using the science writing heuristic as a tool for learningfrom laboratory investigations in secondary science. Journal of Research in Science Teaching, 36(10),1065–1084. doi:10.1002/(SICI)1098-2736(199912)36:10<1065::AID-TEA2>3.0.CO;2-I.
Kiuhara, S. A., Graham, S., & Hawken, L. S. (2009). Teaching writing to high school students: a nationalsurvey. Journal of Educational Psychology, 101, 136–160. doi:10.1037/a0013097.
Knudson, R. E. (1992). Analysis of argumentative writing at two grade levels. The Journal of EducationalResearch, 85(3), 169–179. doi:10.1080/00220671.1992.9944434.
Int J Artif Intell Educ
Author's personal copy
Kuhn, D. (2013). Reasoning. In P. Zelazo (Ed.), Oxford handbook of developmental psychology (pp. 744–764). New York: Oxford University Press.
Kuhn, D., Zillmer, N., Crowell, A., & Zavala, J. (2013). Developing norms of argumentation: metacognitive,epistemological, and social dimensions of developing argumentative competence. Cognition andInstruction, 31(4), 456–496. doi:10.1080/07370008.2013.830618.
Larkin, J. H., & Simon, H. A. (1987). Why a diagram is (sometimes) worth ten thousand words. CognitiveScience, 11(1), 65–100. doi:10.1111/j.1551-6708.1987.tb00863.x.
Lederman, N. G. (1992). Students' and teachers' conceptions of the nature of science: a review of the research.Journal of Research in Science Teaching, 29(4), 331–359.
Leitão, S. (2003). Evaluating and selecting counterarguments: studies of children’s rhetorical awareness.Written Communication, 20(3), 269–306. doi:10.1177/0741088303257507.
Loll, F., & Pinkwart, N. (2013). LASAD: flexible representations for computer-based collaborative argumenta-tion. International Journal of Human-Computer Studies, 71(1), 91–109. doi:10.1016/j.ijhcs.2012.04.002.
Lynch, C. (2014). The Diagnosticity of Argument Diagrams. Doctoral Dissertation, University of Pittsburgh.Lynch, C., Ashley, K. D., & Chi, M. (2014). Can diagrams predict essay grades? Lecture Notes in Computer
Science, 8474, 260–265. doi:10.1007/978-3-319-07221-0_32.Mandler, J. M., & Ritchey, G. H. (1977). Long-term memory for pictures. Journal of Experimental
Psychology, 3(4), 386–396. doi:10.3758/BF03196949.McCagg, E. C., & Dansereau, D. F. (1991). A convergent paradigm for examining knowledge mapping as a
learning strategy. Journal of Educational Research, 84, 317–324. doi:10.1080/00220671.1991.9941812.Novick, L. R. (2000). Spatial diagrams: key instruments in the toolbox for thought. Psychology of Learning
and Motivation, 40(2000), 279–325. doi:10.1016/s0079-7421(00)80023-7.Nussbaum, E. M., & Schraw, G. (2007). Promoting argument-counterargument integration in students’
writing. The Journal of Experimental Education, 76(1), 59–92. doi:10.3200/JEXE.76.1.59-92.Oostdam, R. J., & Emmelot, Y. W. (1991). Education in argumentation skills at Dutch secondary schools.
Proceedings of the Second International Conference on Argumentation. Amsterdam: Sic Sat.Oostdam, R., Glopper, K. D., & Eiting, M. H. (1994). Argumentation in written discourse: secondary school
students' writing problems. Studies in Pragma-dialectcs. Amsterdam: Sic Sat.Osborne, J., Simon, S., Christodoulou, A., Howell-Richardson, C., & Richardson, K. (2013). Learning to
argue: a study of four schools and their attempt to develop the use of argumentation as a commoninstructional practice and its impact on students. Journal of Research in Science Teaching, 50(3), 315–347. doi:10.1002/tea.21073.
Paivio, A. (1986). Mental representations: a dual coding approach. New York: Oxford University Press.Perkins, D. N., Faraday, M., & Bushey, B. (1991). Everyday reasoning and the roots of intelligence. In J. F.
Voss, D. N. Perkins, & J. W. Segal (Eds.), Informal reasoning and education (pp. 83–105). Hillsdale:Lawrence Erlbaum Associates.
Schwarz, B. B., Neuman, Y., Gil, J., & Ilya, M. (2003). Construction of collective and individual knowledge inargumentative activity. Journal of the Learning Sciences, 12(2), 219–256. doi:10.1207/S15327809JLS1202_3.
Shepard, R. N. (1967). Recognition memory for words, sentences, and pictures. Journal of Verbal Learningand Verbal Behavior, 6(1), 156–163. doi:10.1016/S0022-5371(67)80067-7.
Standing, L. (1973). Learning 10000 pictures. Quarterly Journal of Experimental Psychology, 25(2), 207–222. doi:10.1080/14640747308400340.
Stapleton, P. (2001). Assessing critical thinking in the writing of Japanese university students: insights aboutassumptions and content familiarity. Written Communication, 18(4), 506–548. doi:10.1177/0741088301018004004.
Stegmann, K., Weinberger, A., & Fischer, F. (2007). Facilitating argumentative knowledge construction withcomputer-supported collaboration scripts. International Journal of Computer-Supported CollaborativeLearning, 2(4), 421–447.
Stegmann, K., Wecker, C., Weinberger, A., & Fischer, F. (2012). Collaborative argumentation and cognitiveelaboration in a computer-supported collaborative learning environment. Instructional Science, 40(2),297–323.
Stull, A. T., & Mayer, R. E. (2007). Learning by doing versus learning by viewing: three experimentalcomparisons of learner-generated versus author-provided graphic organizers. Journal of EducationalPsychology, 99(4), 808–820. doi:10.1002/pfi.20028.
Suthers, D.D., (2003). Representational guidance for collaborative inquiry. In J. Andriessen, M. Baker, & D.Suthers, (Eds.), Arguing to learn: Confronting cognitions in computer-supported collaborative learningenvironments (Vol. 1), pp. 27–46. Springer Science & Business Media.
Int J Artif Intell Educ
Author's personal copy

Thomm, E., Bromme, R. (in press). How source information shapes lay interpretations of science conflicts: interplaybetween sourcing, conflict explanation, source evaluation, and claim evaluation. Reading and Writing.
Topping, K. J. (2005). Trends in peer learning. Educational Psychology, 25(6), 631–645.Toulmin, S. E. (1958). The uses of argument. Cambridge: Cambridge University Press.Trafton, J. G., Trickett, S. B., & Mintz, F. E. (2005). Connecting internal and external representations: spatial
transformations of scientific visualizations. Foundations of Science, 10, 89–106. doi:10.1007/s10699-005-3007-4.
Wolfe, C. R. (2011). Argumentation across the curriculum. Written Communication, 28(2), 193–219.Wolfe, C. R., Britt, M. A., & Butler, J. A. (2009). Argumentation schema and the myside bias in written
argumentation. Written Communication, 26, 183–209.
Int J Artif Intell Educ
Author's personal copy