Christian Breyer 2014 Paper North Eastasian Supergrid ...
40
preprint to be published as Technical Digest in the proceedings of the 6 th World Conference of Photovoltaic Energy Conversion (WCPEC-6), November 24 - 27, 2014, Kyoto, Japan North-East Asian Super Grid: Renewable Energy Mix and Economics Christian Breyer 1 , Dmitrii Bogdanov 1 , Keiichi Komoto 2 , Tomoki Ehara 3 , Jinsoo Song 4 , Namjil Enebish 5 1 Lappeenranta University of Technology, Skinnarilankatu 34, 53850 Lappeenranta, Finland, E-mail: [email protected] 2 Mizuho Information & Research Institute, Tokyo, 101-8443, Japan 3 E-konzal, Kyoto, 604-8074, Japan 4 Silla University, 140 Baeyang-daero, Sasang-gu, Busan, 617-736, Korea 5 National University of Mongolia, Ikh Surguuliin Gudamj – 1, Baga Toiruu, Ulaanbaatar, Mongolia PREREADING The authors have decided to publish in the WCPEC-6 proceedings only the abstract and the conclusions of the original research paper, due to the two pages limitation. The full research paper including full methodology, all assumptions, all results, discussion, outlook, all references and an appendix is published at ResearchGate 1 . ABSTRACT Further development of the North-East Asian energy system is at a crossroads due to severe limitations of the current conventional energy based system. The high growth rates of new renewable energy technology capacities enable the transformation of the energy system. For North-East Asia it is proposed that the excellent solar resources of the Gobi desert could be utilized for load centers in China, Korea and Japan as a contribution to the energy transformation ahead [1,2,3,4,5]. Based on that idea we have established a spatially and hourly resolved energy system model focused on 100% renewable energy supply for the electricity demand. The area is subdivided into 14 regions, which can be interconnected by a high voltage direct current (HVDC) transmission grid. Three different scenarios have been defined for highly centralized and highly decentralized energy futures for financial and technical assumptions for the reference years 2020 and 2030. The results for total system levelized cost of electricity (LCOE), including generation, curtailment, storage and HVDC transmission grid, are 0.077 €/kWh for the highly centralized approach for 2020 assumptions and 0.064 €/kWh and 0.081 €/kWh for the centralized and decentralized approaches for 2030 assumptions. The importing regions are Japan, Korea, East China and South China, which receive their energy mainly from Northeast China, North China and Central China. The electricity generation shares of the total system LCOE optimized system design deviate from 6% for PV and 1 www.researchgate.net/profile/Christian_Breyer 79% for wind energy (centralized, 2020) to 39% for PV and 47% for wind energy (decentralized, 2030) and additional hydro power utilization. Decrease in storage LCOE reduces the benefit of HVDC transmission considerably; nonetheless, the centralized system design is still lower in LCOE for the modeled system and applied assumptions. New effects of storage interaction have been found, such as discharging of batteries in the night for charging power-to-gas as a least total system cost solution and discharging of power-to-gas for power export via HVDC transmission. The presented results for 100% renewable resources-based energy systems are lower in LCOE by about 30-40% than recent findings in Europe for the non-sustainable alternatives nuclear energy, natural gas and coal based carbon capture and storage technologies. This research work clearly indicates that a 100% renewable resources-based energy system is THE real policy option. CONCLUSIONS The 100% renewable energy system in North-East Asia is no wishful thinking; it is a real policy option, in particular due to rapidly decreasing RE technology LCOE and improving storage economics. The HVDC transmission grid plays a key role since the established super grid enables a substantial cost decrease of the renewable resources-based energy system, as the total system LCOE decreases from 0.115 €/kWh to 0.077 €/kWh for the reference year of 2020 and from 0.081 €/kWh to 0.064 €/kWh for the reference year of 2030 for the region-wide and area-wide open trade scenarios, respectively. The major LCOE decrease is caused by cut-off of storages utilization and significantly reduced primary generation capacities. However, the LCOE spread of the scenarios is reduced significantly from 0.038 €/kWh (2020) to 0.017 €/kWh (2030), which may indicate that a very large scale RE integration could provide a too small economic benefit for its realization. Such results have already been found for the case of Germany [6,7], but one has to have in mind that the area of North-East Asia and Germany cannot easily be compared; nevertheless, the structure of results needs to be investigated in more detail.
Transcript of Christian Breyer 2014 Paper North Eastasian Supergrid ...
preprint to be published as Technical Digest in the proceedings of the
6th World Conference of Photovoltaic Energy Conversion (WCPEC-6), November 24 - 27, 2014, Kyoto, Japan
North-East Asian Super Grid: Renewable Energy Mix and Economics
Christian Breyer1, Dmitrii Bogdanov1, Keiichi Komoto2, Tomoki Ehara3, Jinsoo Song4, Namjil Enebish5
1 Lappeenranta University of Technology, Skinnarilankatu 34, 53850 Lappeenranta, Finland,
E-mail: [email protected] 2 Mizuho Information & Research Institute, Tokyo, 101-8443, Japan
3 E-konzal, Kyoto, 604-8074, Japan 4 Silla University, 140 Baeyang-daero, Sasang-gu, Busan, 617-736, Korea
5 National University of Mongolia, Ikh Surguuliin Gudamj – 1, Baga Toiruu, Ulaanbaatar, Mongolia
PREREADING
The authors have decided to publish in the
WCPEC-6 proceedings only the abstract and the
conclusions of the original research paper, due to the
two pages limitation. The full research paper including
full methodology, all assumptions, all results, discussion,
outlook, all references and an appendix is published at
ResearchGate1.
ABSTRACT
Further development of the North-East Asian
energy system is at a crossroads due to severe
limitations of the current conventional energy based
system. The high growth rates of new renewable energy
technology capacities enable the transformation of the
energy system. For North-East Asia it is proposed that
the excellent solar resources of the Gobi desert could be
utilized for load centers in China, Korea and Japan as a
contribution to the energy transformation ahead
[1,2,3,4,5]. Based on that idea we have established a
spatially and hourly resolved energy system model
focused on 100% renewable energy supply for the
electricity demand. The area is subdivided into 14
regions, which can be interconnected by a high voltage
direct current (HVDC) transmission grid. Three
different scenarios have been defined for highly
centralized and highly decentralized energy futures for
financial and technical assumptions for the reference
years 2020 and 2030. The results for total system
levelized cost of electricity (LCOE), including
generation, curtailment, storage and HVDC
transmission grid, are 0.077 €/kWh for the highly
centralized approach for 2020 assumptions and 0.064
€/kWh and 0.081 €/kWh for the centralized and
decentralized approaches for 2030 assumptions. The
importing regions are Japan, Korea, East China and
South China, which receive their energy mainly from
Northeast China, North China and Central China. The
electricity generation shares of the total system LCOE
optimized system design deviate from 6% for PV and
1 www.researchgate.net/profile/Christian_Breyer
79% for wind energy (centralized, 2020) to 39% for PV
and 47% for wind energy (decentralized, 2030) and
additional hydro power utilization. Decrease in storage
LCOE reduces the benefit of HVDC transmission
considerably; nonetheless, the centralized system design
is still lower in LCOE for the modeled system and
applied assumptions. New effects of storage interaction
have been found, such as discharging of batteries in the
night for charging power-to-gas as a least total system
cost solution and discharging of power-to-gas for power
export via HVDC transmission. The presented results
for 100% renewable resources-based energy systems are
lower in LCOE by about 30-40% than recent findings in
Europe for the non-sustainable alternatives nuclear
energy, natural gas and coal based carbon capture and
storage technologies. This research work clearly
indicates that a 100% renewable resources-based energy
system is THE real policy option.
CONCLUSIONS
The 100% renewable energy system in North-East
Asia is no wishful thinking; it is a real policy option, in
particular due to rapidly decreasing RE technology
LCOE and improving storage economics. The HVDC
transmission grid plays a key role since the established
super grid enables a substantial cost decrease of the
renewable resources-based energy system, as the total
system LCOE decreases from 0.115 €/kWh to 0.077
€/kWh for the reference year of 2020 and from 0.081
€/kWh to 0.064 €/kWh for the reference year of 2030
for the region-wide and area-wide open trade scenarios,
respectively. The major LCOE decrease is caused by
cut-off of storages utilization and significantly reduced
primary generation capacities. However, the LCOE
spread of the scenarios is reduced significantly from
0.038 €/kWh (2020) to 0.017 €/kWh (2030), which may
indicate that a very large scale RE integration could
provide a too small economic benefit for its realization.
Such results have already been found for the case of
Germany [6,7], but one has to have in mind that the area
of North-East Asia and Germany cannot easily be
compared; nevertheless, the structure of results needs to
be investigated in more detail.

preprint to be published as Technical Digest in the proceedings of the
6th World Conference of Photovoltaic Energy Conversion (WCPEC-6), November 24 - 27, 2014, Kyoto, Japan
In parallel the total capex requirements are reduced
substantially from about 6100 bn € to about 4400 bn €
for the reference year 2020 by taking the HVDC
transmission grid into account. The total capex
requirements for 2030 assumptions are reduced from
about 4600 bn € to about 3800 bn €. The total capex
requirements reflect the LCOE results.
The very good economics of wind energy heavily
influences the optimized energy system design.
However, some intended improvements of the model
will partly reduce the dominance of wind energy, such
as transmission losses of HVDC power lines, 1-axis
tracking PV systems and PV self-consumption of
prosumers.
Two quite interesting effects of the storage technology
operation modes have been found within this modelling
approach: firstly, discharging batteries during the nights
and charging of power-to-gas for maximized storing the
following day; secondly, extra discharging of power-to-
gas during daytime and charging of batteries to cover
the demand in night hours without any RE generation
for a PV dominated region. Such operational modes for
storage are an important aspect of a better understanding
of the role and interaction of different storage
technologies in 100% renewable energy systems.
The trade-off between grids and storage is well known.
The found LCOE difference of 0.038 €/kWh (2020) and
0.017 €/kWh (2030) between the area-wide and region-
wide open trade scenarios clearly documents the
assumed increasing competitiveness of storage solutions.
The attractiveness of a strongly interconnected
transmission grid over a large area is dependent on the
spread of the centralized and decentralized system
option. The smaller the LCOE difference of a highly
centralized to a highly decentralized energy system
becomes the less attractive will be a centralized
approach finally. More decentralized approaches might
be also in the long-run the cheaper option since very
large scale energy infrastructure projects are often
characterized by cost and time overruns and local
support of the population is typically higher for more
regional approaches. However, for some regions a more
centralized energy system in North-East Asia is very
relevant due to rather unattractive RE resource
availability (e.g. East China) or limited area for RE
utilization (e.g. South Korea).
The findings for the North-East Asian 100% renewable
resources-based energy system can be compared to most
recent insights in Europe about non-renewable options,
such as nuclear energy, natural gas and coal carbon
capture and storage (CCS) alternatives [8]. These
alternatives lead also to a decarbonized energy system,
which is of utmost relevance for a climate change
mitigation strategy. The LCOE of the alternatives are as
follows: 11.2 €/kWh for new nuclear (assumed for 2023
in the UK and Czech Republic), 11.2 €/kWh for gas
CCS (assumed for 2019 in the UK) and 12.6 €/kWh for
coal CCS (assumed for 2019 in the UK). However, a
recent report published by the European Commission
[9] concludes that CCS technology is not likely to be
commercially available before the year 2030. The
findings for Europe are assumed to be also valid for
North-East Asia in the mid-term. The 100% renewable
resources-based energy system options for North-East
Asia presented in this work are considerably lower in
cost (about 30-40 %) than the higher risk options, which
have still further disadvantages, such as nuclear melt-
down risk, nuclear terrorism risk, unsolved nuclear
waste disposal, remaining CO2 emissions of power
plants with CCS technology, diminishing conventional
energy resources base and high health cost due to heavy
metal emissions of coal fired power plants.
More research is needed for a better understanding of a
fully optimized renewable energy system in North-East
Asia, however, this research work clearly indicates that
a 100% renewable resources-based energy system is a
real policy option.
ACKNOWLEDGEMENTS
The LUT authors gratefully acknowledge the public
financing of Tekes, the Finnish Funding Agency for
Innovation, for the ‘Neo-Carbon Energy’ project under
the number 40101/14. The authors would like to thank
Michael Child for proofreading.
REFERENCES
[1] Komoto K., et al., (eds.), 2009. Energy from the Desert
– Very Large Scale Photovoltaic Systems: Socio-
economic, Financial, Technical and Environmental
Aspects, Earthscan, London
[2] Mano S., et al., 2014. Gobitec and Asian Super Grid for
Renewable Energies in Northeast Asia
[3] Song J., 2012. Cooperation with Neighboring Countries
for Super-Grid in Gobi desert (SG-Gobi Project),
Ulaanbaatar, Mongolia, November 11-12
[4] Song J., 2014. Super Grid in North-east Asia through
Renewable Energy, Asia-Pacific Tech Monitor, 31, 24-
27
[5] Komoto K., Enebish N., Song J., 2013. Very Large
Scale PV Systems for North-East Asia: Preliminary
project proposals for VLS-PV in the Mongolian Gobi
desert, 39th PVSC, Tampa, June 16-21
[6] Agora Energiewende, 2013. Kostenoptimaler Ausbau
der Erneuerbaren Energien in Deutschland, Berlin, May
[7] Breyer Ch., et al., 2014. Vergleich und Optimierung von
zentral und dezentral orienntierten Ausbaupfaden zu
einer Strommversorgung aus Erneuerbaren Energien in
Deutschland, Berlin, January
[8] Agora Energiewende, 2014. Comparing the Cost of
Low-Carbon Technologies: What is the Cheapest
Option?, Berlin, April
[9] [EC] – European Commission, 2014. Integration of
Renewable Energy in Europe, study prepared by KEMA
Consulting, DNV GL – Energy, Imperial College and
NERA Economic Consulting on behalf of DG Energy,
Brussels, June
preprint to be published in the proceedings of the 6th World Conference of Photovoltaic Energy Conversion (WCPEC-6), November 24 - 27, 2014, Kyoto, Japan
North-East Asian Super Grid: Renewable Energy Mix and Economics
Christian Breyer1, Dmitrii Bogdanov1, Keiichi Komoto2, Tomoki Ehara3, Jinsoo Song4, Namjil Enebish5
1 Lappeenranta University of Technology, Skinnarilankatu 34, 53850 Lappeenranta, Finland,
E-mail: [email protected] 2 Mizuho Information & Research Institute, Tokyo, 101-8443, Japan
3 E-konzal, Kyoto, 604-8074, Japan 4 Silla University, 140 Baeyang-daero, Sasang-gu, Busan, 617-736, Korea
5 National University of Mongolia, Ikh Surguuliin Gudamj – 1, Baga Toiruu, Ulaanbaatar, Mongolia
Abstract:
Further development of the North-East Asian energy system is at a crossroads due to severe limitations of the current
conventional energy based system. The high growth rates of new renewable energy technology capacities enable the
transformation of the energy system. For North-East Asia it is proposed that the excellent solar resources of the Gobi
desert could be utilized for load centers in China, Korea and Japan as a contribution to the energy transformation
ahead. Based on that idea we have established a spatially and hourly resolved energy system model focused on 100%
renewable energy supply for the electricity demand. The area is subdivided into 14 regions, which can be
interconnected by a high voltage direct current (HVDC) transmission grid. Three different scenarios have been defined
for highly centralized and highly decentralized energy futures for financial and technical assumptions for the reference
years 2020 and 2030. The results for total system levelized cost of electricity (LCOE), including generation,
curtailment, storage and HVDC transmission grid, are 0.077 €/kWh for the highly centralized approach for 2020
assumptions and 0.064 €/kWh and 0.081 €/kWh for the centralized and decentralized approaches for 2030
assumptions. The importing regions are Japan, Korea, East China and South China, which receive their energy mainly
from Northeast China, North China and Central China. The electricity generation shares of the total LCOE optimized
system design deviate from 6% for PV and 79% for wind energy (centralized, 2020) to 39% for PV and 47% for wind
energy (decentralized, 2030) and additional hydro power utilization. Decrease in storage LCOE reduces the benefit of
HVDC transmission considerably; nonetheless, the centralized system design is still lower in LCOE for the modeled
system and applied assumptions. New effects of storage interaction have been found, such as discharging of batteries
in the night for charging power-to-gas as a least total system cost solution and discharging of power-to-gas for power
export via HVDC transmission. The presented results for 100% renewable resources-based energy systems are lower
in LCOE by about 30-40% than recent findings in Europe for the non-sustainable alternatives nuclear energy, natural
gas and coal based carbon capture and storage technologies. This research work clearly indicates that a 100%
renewable resources-based energy system is THE real policy option.
Keywords: North-East Asia, China, Japan, Korea, Mongolia, Super Grid, 100% renewable energy, photovoltaics,
wind energy, storage, power-to-gas, energy system modeling, energy economics
1. Motivation
Besides ongoing climate changes [1,2], pollution provoked by human activity including the conventional energy sector
[3,4], increasing variability and an expected rise of fossil fuels cost [5,6,7], the idea of building a new, renewables-
based energy system becomes more and more feasible [8,9,10,11,12,13,14]. In recent years there have been projects
aimed at increasing utilization of renewables in renewable energy (RE) rich regions and delivering this energy to
electricity demand centers [15,16,17,18,19]. This, obviously, cannot be done without utilization of high voltage
preprint to be published in the proceedings of the 6th World Conference of Photovoltaic Energy Conversion (WCPEC-6), November 24 - 27, 2014, Kyoto, Japan
current (HVDC) transmission grids [20,21]. The idea of a global Super Grid for power supply was already discussed
some years ago [17], but attracted new attention by the Gobitec and North-East Asian Super Grid initiative
[17,18,19,22,24,25,26] influenced by the EU-MENA Desertec [15,19] even though it was originally initiated already
in 2003 [24]. A sustainable energy supply in North-East Asia needs to be based on renewable energy sources to
overcome the constraints of diminishing fossil resources, climate change impacts, health issues and security. The
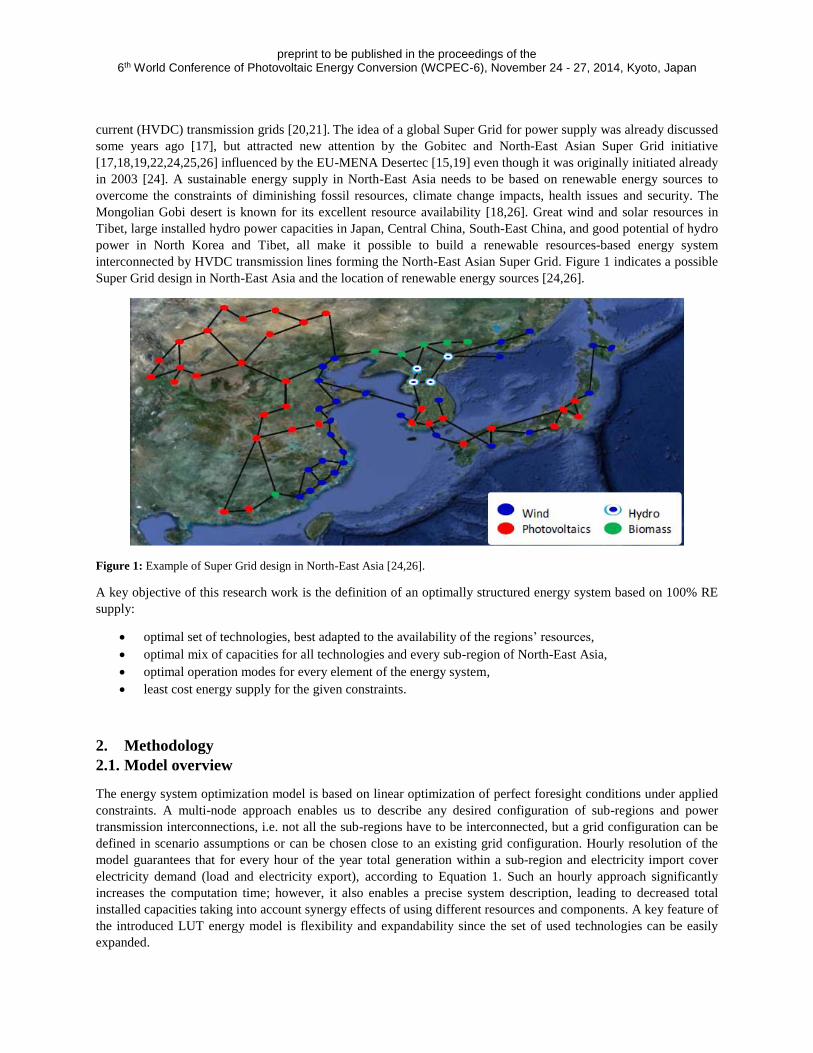
Mongolian Gobi desert is known for its excellent resource availability [18,26]. Great wind and solar resources in
Tibet, large installed hydro power capacities in Japan, Central China, South-East China, and good potential of hydro
power in North Korea and Tibet, all make it possible to build a renewable resources-based energy system
interconnected by HVDC transmission lines forming the North-East Asian Super Grid. Figure 1 indicates a possible
Super Grid design in North-East Asia and the location of renewable energy sources [24,26].
Figure 1: Example of Super Grid design in North-East Asia [24,26].
A key objective of this research work is the definition of an optimally structured energy system based on 100% RE
supply:
optimal set of technologies, best adapted to the availability of the regions’ resources,
optimal mix of capacities for all technologies and every sub-region of North-East Asia,
optimal operation modes for every element of the energy system,
least cost energy supply for the given constraints.
2. Methodology
2.1. Model overview
The energy system optimization model is based on linear optimization of perfect foresight conditions under applied
constraints. A multi-node approach enables us to describe any desired configuration of sub-regions and power
transmission interconnections, i.e. not all the sub-regions have to be interconnected, but a grid configuration can be
defined in scenario assumptions or can be chosen close to an existing grid configuration. Hourly resolution of the
model guarantees that for every hour of the year total generation within a sub-region and electricity import cover
electricity demand (load and electricity export), according to Equation 1. Such an hourly approach significantly
increases the computation time; however, it also enables a precise system description, leading to decreased total
installed capacities taking into account synergy effects of using different resources and components. A key feature of
the introduced LUT energy model is flexibility and expandability since the set of used technologies can be easily
expanded.

preprint to be published in the proceedings of the 6th World Conference of Photovoltaic Energy Conversion (WCPEC-6), November 24 - 27, 2014, Kyoto, Japan
∀h ∈ [1,8760] ∑ 𝐸𝑔𝑒𝑛,𝑡
𝑡𝑒𝑐ℎ
𝑡
+ ∑ 𝐸𝑖𝑚𝑝,𝑟
𝑟𝑒𝑔
𝑟
+ ∑ 𝐸𝑠𝑡𝑜𝑟𝑎𝑔𝑒,𝑑𝑖𝑠𝑐ℎ
𝑠𝑡𝑜𝑟𝑎𝑔𝑒
𝑡
= 𝐸𝑑𝑒𝑚𝑎𝑛𝑑 + ∑ 𝐸𝑒𝑥𝑝,𝑟
𝑟𝑒𝑔
𝑟
+ ∑ 𝐸𝑠𝑡𝑜𝑟𝑎𝑔𝑒,𝑐ℎ
𝑠𝑡𝑜𝑟𝑎𝑔𝑒
𝑡
+ 𝐸𝑐𝑢𝑟𝑡
(Eq. 1)
Equation 1: Constraints for the energy flows of a sub-region. Abbreviations: hours (h), technology (t), all modeled technologies
(tech), sub-region (r), all sub-regions (reg), electricity generation (Egen), electricity import (Eimp), storage technologies (storage),
electricity from discharging storages (Estorage,disch), electricity demand (Edemand), electricity exported (Eexp), electricity for charging
storages (Estorage,ch) and curtailed excess energy (Ecurt).
The aim of the LUT energy model is the cost optimized configuration of the electricity system, expressed by the target
function of minimized annual total energy system cost according to Equation 2.
min (∑ ∑(𝐶𝐴𝑃𝐸𝑋𝑡 ∙ 𝑐𝑟𝑓𝑡 + 𝑂𝑃𝐸𝑋𝑓𝑖𝑥𝑡) ∙ 𝑖𝑛𝑠𝑡𝐶𝑎𝑝𝑡,𝑟 + 𝑂𝑃𝐸𝑋𝑣𝑎𝑟𝑡 ∙ 𝐸𝑔𝑒𝑛,𝑡,𝑟 + 𝑟𝑎𝑚𝑝𝐶𝑜𝑠𝑡𝑡 ∙ 𝑡𝑜𝑡𝑅𝑎𝑚𝑝𝑡,𝑟
𝑡𝑒𝑐ℎ
𝑡=1
𝑟𝑒𝑔
𝑟=1
)
(Eq. 2)
Equation 2: Target function of LUT energy model for minimizing annual costs. Abbreviations: sub-regions (r, reg), energy
technologies (t, tech), capital expenditures for technology t (CAPEXt), capital recovery factor for technology t (crft), fixed
operational expenditures for technology t (OPEXfixt), variable operational expenditures technology t (OPEXvart), installed capacity
in the region r of technology t (instCapt,r), annual electricity generation by technology t in region r (Egen,t,r), cost of ramping of
technology t (rampCostt) and sum of power ramping values during the year for the technology t in the region r (totRampt,r).
2.2. Input data
The generic model is built by several types of different input data and constraints. These are, first, historical weather
data for direct and diffuse solar irradiation, wind speed and precipitation amounts; second, synthetic load data; third,
power yield of technologies; fourth, efficiency of energy conversion processes; fifth, capital expenditures, operational
expenditures and ramping costs for all technologies; sixth, limits for minimum and maximum installed capacity for
all energy technologies; seventh, configuration of regions and interconnections.
Data for solar irradiation, wind speed and precipitation are taken from NASA databases [27,28] and partly reprocessed
by the German Aerospace Center [29,30]. The spatial resolution of the data is 0.45˚x0.45˚. Time resolution is hourly
for wind speed and solar irradiation, and monthly for precipitation. The feed-in time series for fixed optimally-tilted
solar photovoltaic (PV) systems is computed in accordance to Gerlach et al. [29], based on Huld et al. [31]. The feed-
in time series for wind power plants is computed in accordance to Gerlach et al. [29] for standard 3 MW wind turbines
(E-101 [32]) for hub height conditions of 150 meters.
2.3. Applied technologies
The technologies taken into account for the modeling of optimal energy systems based on 100% RE supply for North-
East Asia can be divided into three main categories: conversion of RE resources into electricity, energy storages, and
electricity transmission.
preprint to be published in the proceedings of the 6th World Conference of Photovoltaic Energy Conversion (WCPEC-6), November 24 - 27, 2014, Kyoto, Japan
The technologies for converting RE resources into electricity applied in the model are ground-mounted and rooftop
solar photovoltaic (PV) systems, onshore wind turbines, hydro run-of-river (RoR) plants and hydro dams. Hydro dams
in this model embody a power generation and storage function. Ground-mounted and rooftop PV systems are unified
in the model into one entity with averaged parameters.
The electricity transmission grids are represented on two levels: power distribution and transmission within the sub-
regions are assumed to be based on standard alternating current (AC) grids and inter-regional transmission grids are
modeled on high voltage direct current (HVDC) technology. For the work presented in this paper, grid losses are not
included in the model.
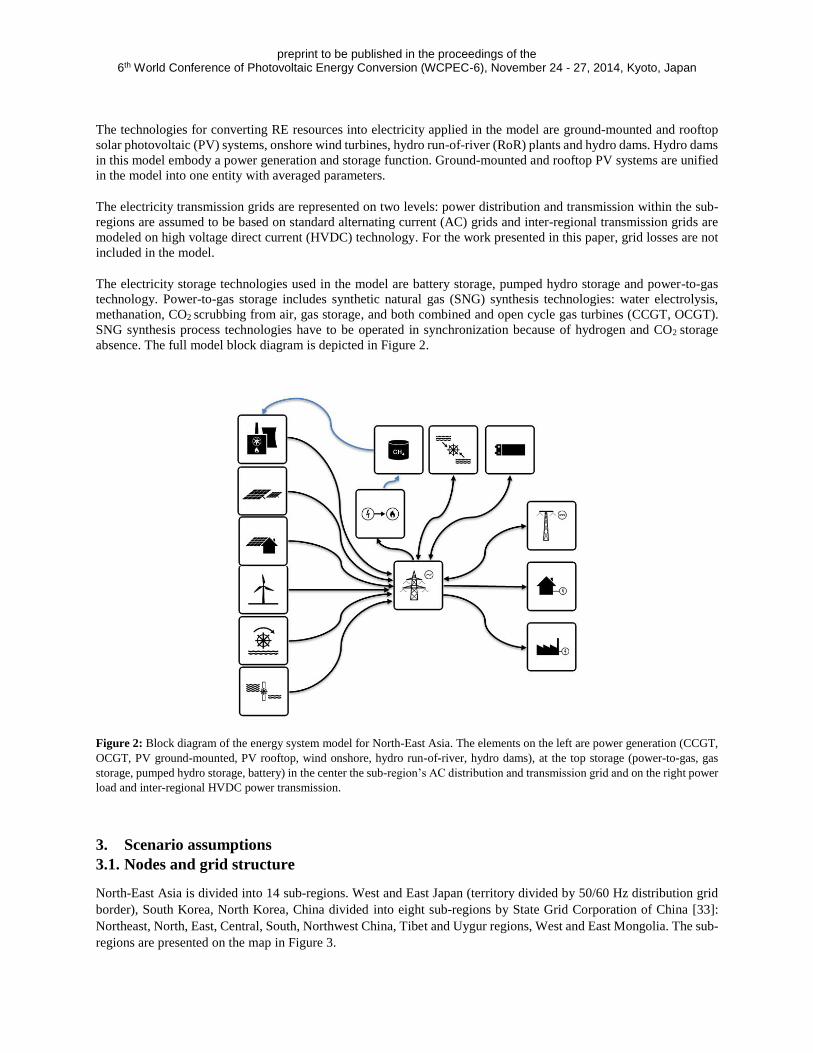
The electricity storage technologies used in the model are battery storage, pumped hydro storage and power-to-gas
technology. Power-to-gas storage includes synthetic natural gas (SNG) synthesis technologies: water electrolysis,
methanation, CO2 scrubbing from air, gas storage, and both combined and open cycle gas turbines (CCGT, OCGT).
SNG synthesis process technologies have to be operated in synchronization because of hydrogen and CO2 storage
absence. The full model block diagram is depicted in Figure 2.
Figure 2: Block diagram of the energy system model for North-East Asia. The elements on the left are power generation (CCGT,
OCGT, PV ground-mounted, PV rooftop, wind onshore, hydro run-of-river, hydro dams), at the top storage (power-to-gas, gas
storage, pumped hydro storage, battery) in the center the sub-region’s AC distribution and transmission grid and on the right power
load and inter-regional HVDC power transmission.
3. Scenario assumptions
3.1. Nodes and grid structure
North-East Asia is divided into 14 sub-regions. West and East Japan (territory divided by 50/60 Hz distribution grid
border), South Korea, North Korea, China divided into eight sub-regions by State Grid Corporation of China [33]:
Northeast, North, East, Central, South, Northwest China, Tibet and Uygur regions, West and East Mongolia. The sub-
regions are presented on the map in Figure 3.

preprint to be published in the proceedings of the 6th World Conference of Photovoltaic Energy Conversion (WCPEC-6), November 24 - 27, 2014, Kyoto, Japan
Figure 3: North-East Asian area composed of the 14 sub-regions taken into account for the model.
For the energy system analysis of North-East Asia, we have applied three scenarios: firstly, a region-wide open trade
scenario, in which all the regions are independent (no HVDC grid interconnections) and the electricity demand has to
be covered by the respective region’s own generation; secondly, country-wide open trade (Fig. 4), in which all sub-
regions of the same country are connected (no interconnections between countries); thirdly, area-wide open trade (Fig.
5), in which the different country-wide HVDC grids are interconnected and there are no limitations on international
power exchange. The Chinese HVDC grid configuration is based on the existing Chinese Grid operated by State Grid
Corporation of China and its development plans. Additional interconnections in the area-wide open trade scenario are:
West Japan to South Korea, South Korea to North Korea, South Korea to North China, North Korea to Northwest
China, and North China to East Mongolia.
Figure 4: Grid configuration of country-wide open trade scenario.

preprint to be published in the proceedings of the 6th World Conference of Photovoltaic Energy Conversion (WCPEC-6), November 24 - 27, 2014, Kyoto, Japan
Figure 5: Grid configuration of area-wide open trade scenario.
3.2. Financial and technical assumptions
The model optimization is carried out on an assumed cost basis and technological status for the year 2020 and the
overnight building approach. PV costs are assumed as an average of ground-mounted and rooftop PV systems. The
capex and opex numbers refer in general to kW of electrical power, in case of water electrolysis to kW of hydrogen
combustion thermal energy, and for CO2 scrubbing, methanation and gas storage to kW of methane combustion
thermal energy. Efficiencies of water electrolysis, CO2 scrubbing and methanation refer to the lower heating value of
hydrogen and methane, respectively.
Table 1. Financial assumptions for energy system components for the 2020 and 2030 reference years. The numbers for 2020 and
2030 are identical unless a second number indicates a change for 2030 assumptions. The financial assumptions for storage systems
refer to kWh of electricity, and gas storage refers to one thermal kWh of methane at the lower heating value. Financial numbers
for HVDC transmission lines and converter stations are given for the net transmission capacity (NTC). Assumptions are mainly
taken from Pleßmann et al. [8] but also other sources [15,34,35,36,37].
Technology Capex [€/kW] Opex fix [€/kW] Opex var [€/kWh] Lifetime [a]
PV 1008 / 731 15 / 11 0 30 / 35
Wind onshore 1179 / 1000 24 / 20 0 20 / 25
Hydro run-of-river 2000 40 0 50
Hydro dam 2000 40 0 50
Water electrolysis 685 / 380 24 / 13 0.0012 30
Methanation 421 / 234 18 / 5 0.0015 30
CO2 scrubbing 641 / 356 25 / 14 0.0013 30
CCGT 750 15 0.001 30
OCGT 380 7.6 0.001 30
Capex [€/kWh] Opex fix [€/kWh] Opex var [€/kWh] Lifetime [a]
Battery 300 / 150 10 / 10 0.0002 10 / 15
PHS 70 1.4 0.0002 50
Gas storage 0.05 0.001 0 50

preprint to be published in the proceedings of the 6th World Conference of Photovoltaic Energy Conversion (WCPEC-6), November 24 - 27, 2014, Kyoto, Japan
Capex [€/(kWNTC*km)] Opex fix [€/(kWNTC*km)] Opex var
[€/kWhNTC] Lifetime [a]
HVDC line on ground 0.612 0.0075 0 50
HVDC line submarine 0.992 0.0010 0 50
Capex [€/kWNTC] Opex fix [€/kWNTC] Opex var
[€/kWhNTC] Lifetime [a]
HVDC converter pair 180 1.8 0 50
Table 2. Energy to power ratio of storage technologies. Assumptions are mainly taken from Pleßmann et al. [8].
Technology Energy/Power Ratio [h]
Battery 6
PHS 8
Gas storage 80
Table 3. Efficiency assumptions for energy system components for the 2020 and 2030 reference years. Assumptions are mainly
taken from Pleßmann et al. [8].
Efficiency [%]
Battery 85
PHS 78
Gas storage 100
Water electrolysis 84
Methanation 77
CO2 scrubbing 78
CCGT 58
OCGT 38
3.3. Applied data
3.3.1. Feed-in for solar PV and wind energy
The derived values for full load hours and levelized cost of electricity (LCOE) for optimally tilted PV systems and
onshore wind energy generation in North-East Asia are presented in Figure 6.

preprint to be published in the proceedings of the 6th World Conference of Photovoltaic Energy Conversion (WCPEC-6), November 24 - 27, 2014, Kyoto, Japan
Figure 6: Full load hours (FLH, top) and levelized cost of electricity (LCOE) of solar PV systems and wind energy in North-East
Asia for the reference years 2020 (center) and 2030 (bottom). FLH diagrams are for optimally tilted PV systems (top, left) and
wind power plants (top, right). Please notice the different LCOE scaling for the reference years 2020 and 2030. The assumed wind
power plants consist of 3 MW wind turbines at 150 meters hub height. Dataset is used in a 0.45˚x0.45˚ spatial and hourly temporal
resolution for the real weather conditions of the year 2005. The LCOE numbers are calculated by applying cost numbers in Table
1 and applying Equation 4. Resource data are based on Gerlach et al. [29] using NASA data [27,28] reprocessed by the German
Aerospace Center [30].
Feed-in full load hours for sub-regions are computed on the basis of the 0.45˚x0.45˚ spatially resolved single sub-
areas’ data using a weighted average formula. The sub-regions’ numbers are calculated using the rule: 0%-10% best
sub-areas of a region are weighted by 0.3, 10%-20% best sub-areas of a region are weighted by 0.3, 20%-30% best
sub-areas of a region are weighted by 0.2, 30%-40% best sub-areas of a region are weighted by 0.1 and 40%-50% best
sub-areas of a region are weighted by 0.1. The computed average full load hours for optimally tilted PV systems and
wind power plants are presented in Table 4.
Table 4. Average full load hours and LCOE for optimally tilted PV systems and wind power plants in North-East Asian regions.
The LCOE numbers are calculated by applying cost numbers in Table 1 and applying Equation 4. Resource data are based on
Gerlach et al. [29]. The numbers for population and electricity demand are also tabulated for indicative reasons. The FLH and
LCOE values for the total area are weighted to 50% by area and to 50% by electricity demand of the sub-regions. Respective area
data are summarized in Table 6.
Region
Population
[mio. Pop]
Electricity
demand [TWh] PV FLH Wind FLH
PV LCOE 2020/
2030 [€/kWh]
Wind LCOE
2020/ 2030
[€/kWh]
Total area 1546 6030 1507 3025 0.064 / 0.045 0.047 / 0.037
East Japan 64 433 1275 3253 0.075 / 0.053 0.042 / 0.033
West Japan 64 427 1264 3034 0.076 / 0.053 0.045 / 0.035
South Korea 50 455 1435 2829 0.067 / 0.047 0.048 / 0.037
North Korea 25 19 1298 2561 0.074 / 0.052 0.053 / 0.041

preprint to be published in the proceedings of the 6th World Conference of Photovoltaic Energy Conversion (WCPEC-6), November 24 - 27, 2014, Kyoto, Japan
Northeast China 110 384 1444 3488 0.066 / 0.047 0.039 / 0.030
North China 261 913 1590 3535 0.060 / 0.042 0.038 / 0.030
East China 253 885 1321 2053 0.072 / 0.051 0.066 / 0.052
Central China 371 1299 1470 2606 0.065 / 0.046 0.052 / 0.041
South China 247 864 1413 2277 0.068 / 0.048 0.059 / 0.046
Tibet 3 11 1957 5140 0.049 / 0.034 0.026 / 0.021
Northwest China 75 262 1721 3668 0.056 / 0.039 0.037 / 0.029
Uygur 22 76 1661 2717 0.058 / 0.041 0.050 / 0.039
West Mongolia 1 1 1576 2837 0.061 / 0.043 0.048 / 0.037
East Mongolia 2 2 1538 3451 0.062 / 0.044 0.039 / 0.031
The aggregated profiles of solar PV and wind energy feed-in power normalized to maximum capacity averaged for
North-East Asia are presented in Figure 7.
Figure 7: Aggregated feed-in profiles for optimally tilted PV and wind power plants in for North-East Asia.
The feed-in values for hydro power are computed based on the monthly resolved precipitation data for the year 2005
as a normalized sum of precipitation in the regions. Such an estimate leads to a good approximation of the annual
generation of hydro power plants (deviation of computed data for all North-East Asian regions to public data is less
than 5%).
3.3.2. Upper and lower limitations on installed capacities
Lower and upper limits applied to renewable energy sources (optimally tilted PV, wind turbines, and hydro energy)
and pumped hydro storage. For gas turbines, battery and gas storage, and units of the power-to-gas process, the lower
limit is set to zero.
For lower limitations of optimally tilted PV systems, wind power plants, hydro power plants and PHS storage systems,
data of existing installed capacities in North-East Asian sub-regions have been taken from the Platts database [38].
Lower limits on already installed capacities in North-East Asian sub-regions are summarized in Table 5.
Table 5. Lower limits of installed capacities in North-East Asian regions.
Region
Installed capacity by Platts [MW]
Solar Wind Hydro
RoR and Dam PHS
Total area 1029 17984 215541 48197
East Japan 50 990 9470 9364
West Japan 47 560 10640 15762

preprint to be published in the proceedings of the 6th World Conference of Photovoltaic Energy Conversion (WCPEC-6), November 24 - 27, 2014, Kyoto, Japan
South Korea 116 357 1569 4390
North Korea 0 0 6354 0
Northeast China 0 4031 6762 600
North China 43 2245 32195 3216
East China 117 1709 9911 6064
Central China 6 607 68552 3840
South China 23 1273 51234 4848
Tibet 122 0 201 113
Northwest China 425 5564 17014 0
Uygur 81 649 1638 0
West Mongolia 0 0 0 0
East Mongolia 0 0 0 0
Upper limits for optimally tilted PV systems and wind power plants are based on land use limitations and the density
of capacity. The maximum area covered by PV systems is set to 6% of the total sub-regions’ territory and for wind
power plants to 4%, respectively. The capacity densities for optimally tilted PV systems is 75 MW/km2 and for onshore
wind power plants 8.4 MW/km2, respectively. Maximum installable capacities are computed by applying Equation 3.
𝐶𝑎𝑝𝑤𝑖𝑛𝑑 = 𝑎𝑟𝑒𝑎𝑡𝑜𝑡𝑎𝑙 ∙ 𝑙𝑖𝑚𝑖𝑡𝑤𝑖𝑛𝑑 ∙𝑃
(𝑑1 ∙ 𝑑2 ∙ 𝑑𝑟𝑜𝑡) (Eq. 3a)
𝐶𝑎𝑝𝑃𝑉 = 𝑎𝑟𝑒𝑎𝑡𝑜𝑡𝑎𝑙 ∙ 𝑙𝑖𝑚𝑖𝑡𝑃𝑉 ∙ (𝜂𝑃𝑉 ∙ 𝐺𝐶𝑅 ∙ 𝐼𝑆𝑇𝐶) (Eq. 3b)
Equation 3: Maximum installable capacities for PV and wind. Abbreviations: maximum installable capacity (Cap), area of sub-
region (areatotal), land use limitation (limit) of 6% for PV and 4% for wind, power of reference wind turbine (P) of 3 MW, rotor
diameter of reference wind turbine (drot) of 101 m, dimensionless distance constants (d1, d2) are set to d1 = 5 and d2 = 7 [39,40,41],
PV system efficiency (ηPV) of 15%, ground cover ratio (GCR) of 0.5 [23] and irradiation under standard test conditions (ISTC) of 1
kW/m2.
For hydro power plants and PHS storage, upper limits are set to 150% and 200% of already installed capacities by the
end of 2013 (Tab. 5). For North Korea the PHS upper limit is set equal to South Korea because of no installed PHS
capacity and obviously high potential in North Korea. All upper limits of installable capacities in North-East Asian
sub-regions are summarized in Table 6.
Table 6. Upper limits on installable capacities in North-East Asian regions.
Region
area Limits [GW]
[1000 km2] Solar Wind Run-of-River Hydro Dam PHS
Total area 11499 111287 8314 162 162 105
East Japan 195 876 65 7.1 7.1 19
West Japan 179 807 60 8.0 8.0 32
South Korea 99 444 33 1.2 1.2 8.8
North Korea 116 524 39 4.8 4.8 8.8
Northeast China 1308 14718 1100 5.1 5.1 1.2
North China 1154 12979 970 24 24 6.4
East China 479 863 64 7.4 7.4 12
Central China 1279 14391 1075 51 51 7.7
South China 1013 1824 136 38 38 10
Tibet 1127 12682 948 0.2 0.2 0.2
Northwest China 1380 15528 1160 13 13 0
Uygur 1618 18202 1360 1.2 1.2 0
West Mongolia 788 8870 663 0 0 0
East Mongolia 763 8579 641 0 0 0

preprint to be published in the proceedings of the 6th World Conference of Photovoltaic Energy Conversion (WCPEC-6), November 24 - 27, 2014, Kyoto, Japan
For gas turbines, battery, gas storage and power-to-gas technologies, upper limits are not specified.
Based on achievable LCOE and available area it is possible to compile a renewable potentials cost curve. The already
introduced PV and wind LCOE (Fig. 6 and Tab. 4) are used and sorted by the available area according to the upper
limits (Eq. 3 and Tab. 6). The renewable potentials cost curve is visualized in Figure 8.
Figure 8: Renewable energy potentials cost curve for North-East Asia for reference year 2020 (left) and 2030 (right). The RE
potentials cost curve is based on PV and wind LCOE (Fig. 6 and Tab. 4) and available area limits (Eq. 3 and Tab. 6).
For the financial and technical assumptions for the reference year 2020 more than 40,000 TWh are available for LCOE
of less than 0.05 €/kWh for the introduced weighted 4% area limit and for the reference year 2030 there are more than
100,000TWh utilizable for LCOE of less than 0.04 €/kWh available. The electricity demand of the year 2010 has been
about 6,000 TWh for North-East Asia and about 22,000 TWh globally. The renewable resource base in North-East
Asia provides a very high utilizable potential on a low cost basis.
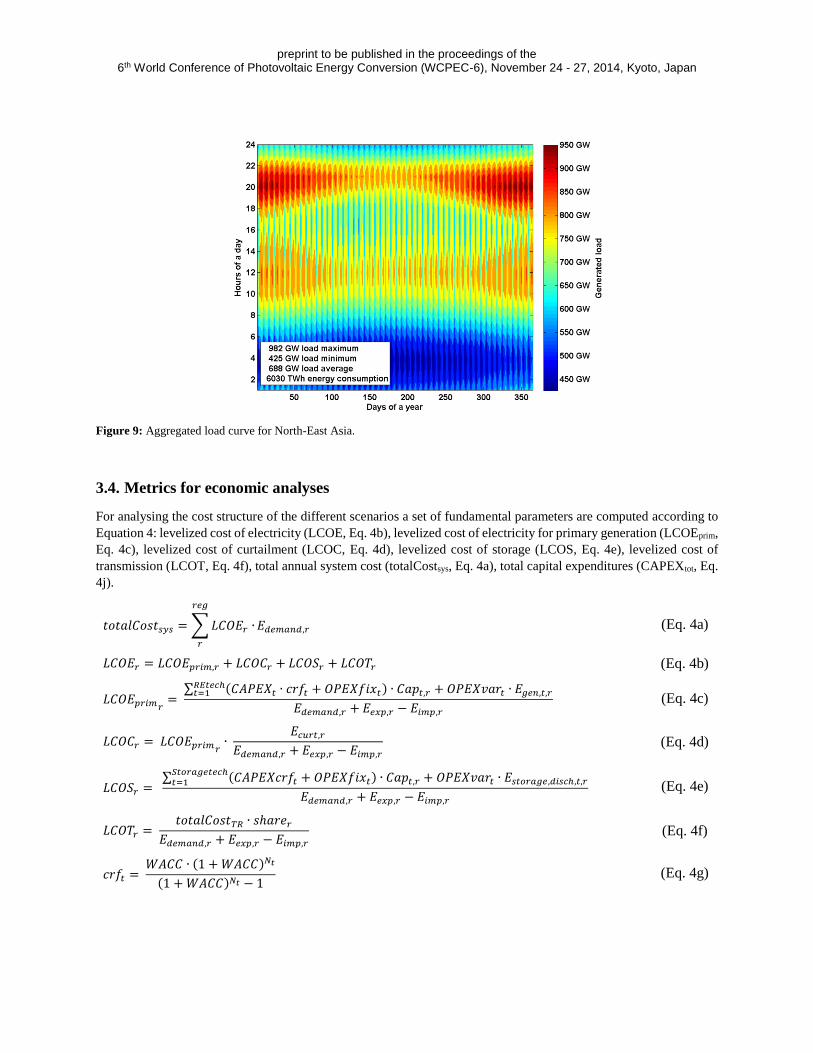
3.3.3. Load
The demand profiles for sub-regions are computed as a fraction of the total country demand based on synthetic load
data weighted by the sub-regions’ population. Figure 9 represents the area-aggregated demand of all sub-regions in
North-East Asia.
preprint to be published in the proceedings of the 6th World Conference of Photovoltaic Energy Conversion (WCPEC-6), November 24 - 27, 2014, Kyoto, Japan
Figure 9: Aggregated load curve for North-East Asia.
3.4. Metrics for economic analyses
For analysing the cost structure of the different scenarios a set of fundamental parameters are computed according to
Equation 4: levelized cost of electricity (LCOE, Eq. 4b), levelized cost of electricity for primary generation (LCOEprim,
Eq. 4c), levelized cost of curtailment (LCOC, Eq. 4d), levelized cost of storage (LCOS, Eq. 4e), levelized cost of
transmission (LCOT, Eq. 4f), total annual system cost (totalCostsys, Eq. 4a), total capital expenditures (CAPEXtot, Eq.
4j).
𝑡𝑜𝑡𝑎𝑙𝐶𝑜𝑠𝑡𝑠𝑦𝑠 = ∑ 𝐿𝐶𝑂𝐸𝑟 ∙
𝑟𝑒𝑔
𝑟
𝐸𝑑𝑒𝑚𝑎𝑛𝑑,𝑟 (Eq. 4a)
𝐿𝐶𝑂𝐸𝑟 = 𝐿𝐶𝑂𝐸𝑝𝑟𝑖𝑚,𝑟 + 𝐿𝐶𝑂𝐶𝑟 + 𝐿𝐶𝑂𝑆𝑟 + 𝐿𝐶𝑂𝑇𝑟 (Eq. 4b)
𝐿𝐶𝑂𝐸𝑝𝑟𝑖𝑚𝑟=
∑ (𝐶𝐴𝑃𝐸𝑋𝑡 ∙ 𝑐𝑟𝑓𝑡 + 𝑂𝑃𝐸𝑋𝑓𝑖𝑥𝑡) ∙ 𝐶𝑎𝑝𝑡,𝑟 + 𝑂𝑃𝐸𝑋𝑣𝑎𝑟𝑡 ∙ 𝐸𝑔𝑒𝑛,𝑡,𝑟𝑅𝐸𝑡𝑒𝑐ℎ𝑡=1
𝐸𝑑𝑒𝑚𝑎𝑛𝑑,𝑟 + 𝐸𝑒𝑥𝑝,𝑟 − 𝐸𝑖𝑚𝑝,𝑟
(Eq. 4c)
𝐿𝐶𝑂𝐶𝑟 = 𝐿𝐶𝑂𝐸𝑝𝑟𝑖𝑚𝑟∙
𝐸𝑐𝑢𝑟𝑡,𝑟
𝐸𝑑𝑒𝑚𝑎𝑛𝑑,𝑟 + 𝐸𝑒𝑥𝑝,𝑟 − 𝐸𝑖𝑚𝑝,𝑟
(Eq. 4d)
𝐿𝐶𝑂𝑆𝑟 = ∑ (𝐶𝐴𝑃𝐸𝑋𝑐𝑟𝑓𝑡 + 𝑂𝑃𝐸𝑋𝑓𝑖𝑥𝑡) ∙ 𝐶𝑎𝑝𝑡,𝑟 + 𝑂𝑃𝐸𝑋𝑣𝑎𝑟𝑡 ∙ 𝐸𝑠𝑡𝑜𝑟𝑎𝑔𝑒,𝑑𝑖𝑠𝑐ℎ,𝑡,𝑟
𝑆𝑡𝑜𝑟𝑎𝑔𝑒𝑡𝑒𝑐ℎ𝑡=1
𝐸𝑑𝑒𝑚𝑎𝑛𝑑,𝑟 + 𝐸𝑒𝑥𝑝,𝑟 − 𝐸𝑖𝑚𝑝,𝑟
(Eq. 4e)
𝐿𝐶𝑂𝑇𝑟 = 𝑡𝑜𝑡𝑎𝑙𝐶𝑜𝑠𝑡𝑇𝑅 ∙ 𝑠ℎ𝑎𝑟𝑒𝑟
𝐸𝑑𝑒𝑚𝑎𝑛𝑑,𝑟 + 𝐸𝑒𝑥𝑝,𝑟 − 𝐸𝑖𝑚𝑝,𝑟
(Eq. 4f)
𝑐𝑟𝑓𝑡 = 𝑊𝐴𝐶𝐶 ∙ (1 + 𝑊𝐴𝐶𝐶)𝑁𝑡
(1 + 𝑊𝐴𝐶𝐶)𝑁𝑡 − 1 (Eq. 4g)

preprint to be published in the proceedings of the 6th World Conference of Photovoltaic Energy Conversion (WCPEC-6), November 24 - 27, 2014, Kyoto, Japan
𝑡𝑜𝑡𝑎𝑙𝐶𝑜𝑠𝑡𝑇𝑅 = ∑ [(𝐶𝐴𝑃𝐸𝑋𝑇𝐿 ∙ 𝑐𝑟𝑓𝑇𝐿 + 𝑂𝑃𝐸𝑋𝑓𝑖𝑥𝑇𝐿) ∙ 𝐶𝑎𝑝𝑇𝐿,𝑙 ∙ 𝑑𝑙𝑇𝐿 + 𝑂𝑃𝐸𝑋𝑣𝑎𝑟𝑇𝐿 ∙ 𝐸𝑡𝑟𝑎𝑛𝑠𝑚,𝑡,𝑙
𝑙𝑖𝑛𝑒𝑠
𝑙=1
+ (𝐶𝐴𝑃𝐸𝑋𝐶𝑆 ∙ 𝑐𝑟𝑓𝐶𝑆 + 𝑂𝑃𝐸𝑋𝑓𝑖𝑥𝐶𝑆) ∙ 𝐶𝑎𝑝𝐶𝑆,𝑙 + 𝑂𝑃𝐸𝑋𝑣𝑎𝑟𝐶𝑆 ∙ 𝐸𝑡𝑟𝑎𝑛𝑠𝑚,𝑡,𝑙]
(Eq. 4h)
𝑠ℎ𝑎𝑟𝑒𝑟 = 0.5 ∙𝐸𝑒𝑥𝑝,𝑟
∑ 𝐸𝑒𝑥𝑝,𝑟𝑟𝑒𝑔𝑟
⁄ + 0.5 ∙𝐸𝑖𝑚𝑝,𝑟
∑ 𝐸𝑖𝑚𝑝,𝑟𝑟𝑒𝑔𝑟
⁄ (Eq. 4i)
𝐶𝐴𝑃𝐸𝑋𝑡𝑜𝑡 = ∑ ∑ 𝐶𝐴𝑃𝐸𝑋𝑡 ∙ 𝐶𝑎𝑝𝑡,𝑟
𝑡𝑒𝑐ℎ
𝑡
𝑟𝑒𝑔
𝑟
(Eq. 4j)
Equation 4: Levelized cost of electricity (LCOE) and total cost of sub-regions and total area. Abbreviations: sub-region (r),
technology (t), primary (prim), all sub-regions summarized (tot), transmission lines (TL), converter substation (CS), RE
technologies (REtech), such as PV, wind onshore, hydro RoR, hydro dams, storage technologies (Storagetech), such as batteries,
PHS, power-to-gas, all modeled technologies (tech), all sub-regions (reg), levelized cost of curtailment (LCOC), levelized cost of
storage (LCOS), levelized cost of transmission (LCOT), capital expenditures (CAPEX), capital recovery factor (crf), weighted
average cost of capital (WACC), lifetime (N), fixed operational expenditures (OPEXfix), variable operational expenditures
(OPEXvar), installed capacity (Cap), annual electricity generation (Egen), annually curtailed excess energy (Ecurt) and share of
region in grid utilization (share).
4. Results
4.1. Findings for the area and all sub-regions
For all three scenarios (Fig. 3 - 5) optimized electrical energy system configurations are derived and characterized by
optimized installed capacities of RE electricity generation, storage and transmission for every modelled technology,
leading to respective hourly electricity generation, storage charging and discharging, electricity export, import and
curtailment. In Table 7 the average financial results of the different scenarios according to Equation 3 are presented
for levelized cost of electricity (LCOE), levelized cost of electricity for primary generation (LCOE primary), levelized
cost of curtailment (LCOC), levelized cost of storage (LCOS), levelized cost of transmission (LCOT), total annualized
cost, total capital expenditures, total renewables capacity and total primary generation. Weighted average cost of
capital (WACC) is set to 7% for all scenarios.
Table 7. Financial results for the three scenarios and the year 2020 (top) and 2030 (bottom) applied in North-East Asia regions.
The scenarios are defined by Figures 3 - 5, Tables 1 - 3 and the financial metrics are according to Equation 4.
2020 Scenarios
Total
LCOE
LCOE
primary LCOC LCOS LCOT
Total ann.
cost
Total
CAPEX
RE
capacities
Generated
electricity
[€/kWh] [€/kWh] [€/kWh] [€/kWh] [€/kWh] [bn €] [bn €] [GW] [TWh]
Region-wide 0.115 0.068 0.008 0.040 0 696 6113 3888 7918
Country-wide 0.090 0.059 0.005 0.021 0.005 539 4949 3017 7434
Area-wide 0.077 0.054 0.005 0.011 0.007 459 4368 2593 7305
2030 Scenarios
Total
LCOE
LCOE
primary LCOC LCOS LCOT
Total ann.
cost
Total
CAPEX
RE
capacities
Generated
electricity
[€/kWh] [€/kWh] [€/kWh] [€/kWh] [€/kWh] [bn €] [bn €] [GW] [TWh]
Region-wide 0.081 0.052 0.005 0.025 0 490 4555 3810 7669
Country-wide 0.070 0.048 0.004 0.015 0.003 419 4041 3158 7319
Area-wide 0.064 0.046 0.003 0.010 0.004 383 3796 2819 7181
From Table 7 it can be easily seen for the 2020 assumptions a considerable decrease of electricity cost of the entire
system in case of area-wide open trade power transmission compared to the country-wide and region-wide scenarios
of about 15% and 37%, respectively. Grid utilization decreases the primary energy conversion capacities and

preprint to be published in the proceedings of the 6th World Conference of Photovoltaic Energy Conversion (WCPEC-6), November 24 - 27, 2014, Kyoto, Japan
generation by 25% and 35% in terms of installed capacities and by 7% and 9% in terms of generated electricity in
reference to country-wide and region-wide scenarios, respectively. Grid utilization leads to a significant decrease of
storage utilization (Tab. 8), whereas cost of transmission is relatively small in comparison to the decrease in primary
generation and storage costs. Decrease of curtailment cost in case of open trade between regions is significant,
however, the impact of energy excess on total cost is rather low.
For the 2030 assumptions the structure of the 2020 results can be confirmed; however, the simulated energy systems
are more shaped by the relatively improved PV LCOE and in particular by the significant cost reduction of storage.
The most prominent result is that the region-wide scenario of 2030 (0.081 €/kWh) costs more or less the same as the
area-wide scenario of 2020 (0.077 €/kWh). The spread in LCOE of the scenarios is reduced from 0.038 €/kWh (2020)
to 0.017 €/kWh (2030). Both numbers will further decrease in an updated version of our results since no loss of the
HVDC transmission is taken into account in this work. In the 2030 results the RE capacities increase mainly in the
country-wide and area-wide scenario whereas the generated electricity is reduced. This is a consequence of an
increased proportion of PV in the 2030 scenarios. In turn, this is a consequence of faster cost reduction of PV versus
wind energy and of the reduced storage cost. The result is a better competitive edge to the HVDC transmission. This
effect will be even stronger in an updated version including HVDC transmission losses.
Table 8. Overview on installed RE technologies and storage capacities for the three scenarios and the year 2020 (top) and 2030
(bottom) applied in North-East Asia regions. The scenarios are defined by Figures 3 - 5, Tables 1 - 3.
2020
Scenarios
Wind PV Hydro
RoR
Hydro
dams Battery PHS
PtG
electrolyzers CCGT OCGT
[GW] [GW] [GW] [GW] [GWh] [GWh] [GWel] [GW] [GW]
Region-wide 1403 2169 156 160 2702 102 372 299 167
Country-wide 1758 944 154 160 1131 102 232 233 180
Area-wide 1961 308 162 162 59 105 196 216 225
2030
Scenarios
Wind PV Hydro
RoR
Hydro
dams Battery PHS
PtG
electrolyzers CCGT OCGT
[GW] [GW] [GW] [GW] [GWh] [GWh] [GWel] [GW] [GW]
Region-wide 1310 2200 140 160 3326 100 346 236 180
Country-wide 1722 1135 141 160 1653 99 239 177 198
Area-wide 1895 620 142 162 637 105 224 161 226
In the case of the region-wide open trade scenario, all sub-regions of North-East Asia need to match their demand
using only their own renewable energy resources. In the case of the country-wide and area-wide open trade scenarios,
a division of regions into net exporters and net importers can be observed. Net exporters are sub-regions with the best
renewable resources and net importers are sub-regions with moderate ones. Annual import and export diagrams for
country-wide and area-wide open trade scenarios are presented in Figure 10.
preprint to be published in the proceedings of the 6th World Conference of Photovoltaic Energy Conversion (WCPEC-6), November 24 - 27, 2014, Kyoto, Japan
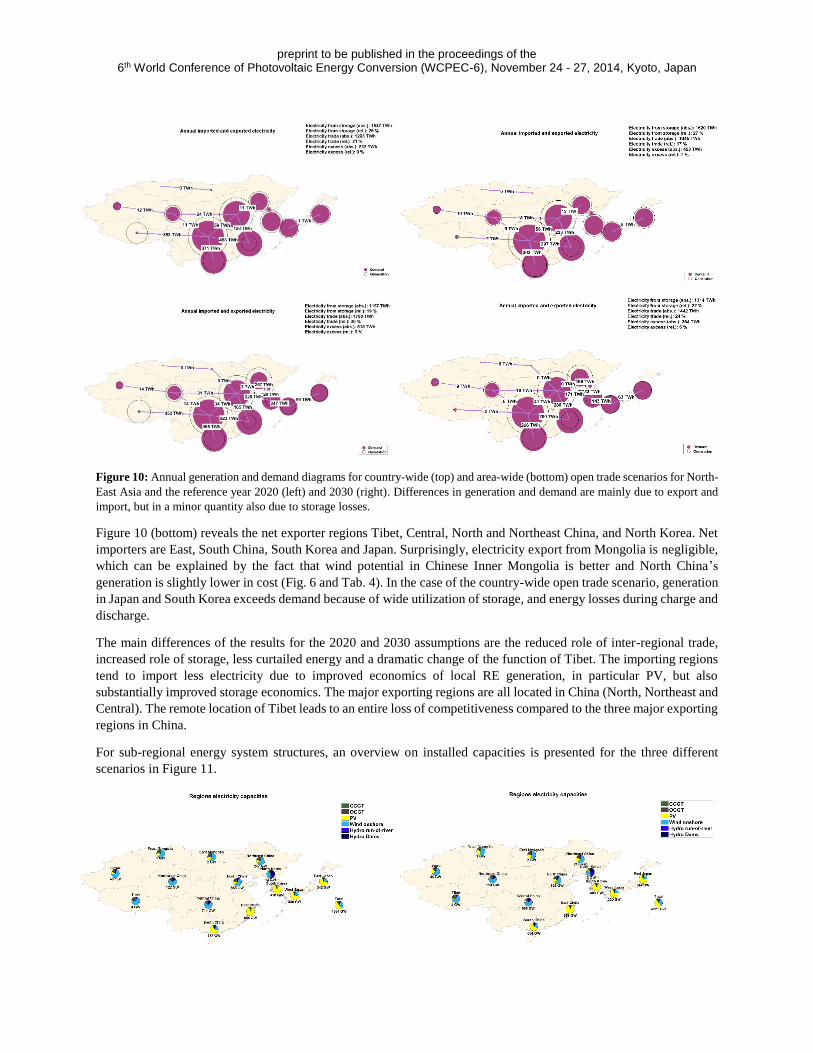
Figure 10: Annual generation and demand diagrams for country-wide (top) and area-wide (bottom) open trade scenarios for North-
East Asia and the reference year 2020 (left) and 2030 (right). Differences in generation and demand are mainly due to export and
import, but in a minor quantity also due to storage losses.
Figure 10 (bottom) reveals the net exporter regions Tibet, Central, North and Northeast China, and North Korea. Net
importers are East, South China, South Korea and Japan. Surprisingly, electricity export from Mongolia is negligible,
which can be explained by the fact that wind potential in Chinese Inner Mongolia is better and North China’s
generation is slightly lower in cost (Fig. 6 and Tab. 4). In the case of the country-wide open trade scenario, generation
in Japan and South Korea exceeds demand because of wide utilization of storage, and energy losses during charge and
discharge.
The main differences of the results for the 2020 and 2030 assumptions are the reduced role of inter-regional trade,
increased role of storage, less curtailed energy and a dramatic change of the function of Tibet. The importing regions
tend to import less electricity due to improved economics of local RE generation, in particular PV, but also
substantially improved storage economics. The major exporting regions are all located in China (North, Northeast and
Central). The remote location of Tibet leads to an entire loss of competitiveness compared to the three major exporting
regions in China.
For sub-regional energy system structures, an overview on installed capacities is presented for the three different
scenarios in Figure 11.
preprint to be published in the proceedings of the 6th World Conference of Photovoltaic Energy Conversion (WCPEC-6), November 24 - 27, 2014, Kyoto, Japan
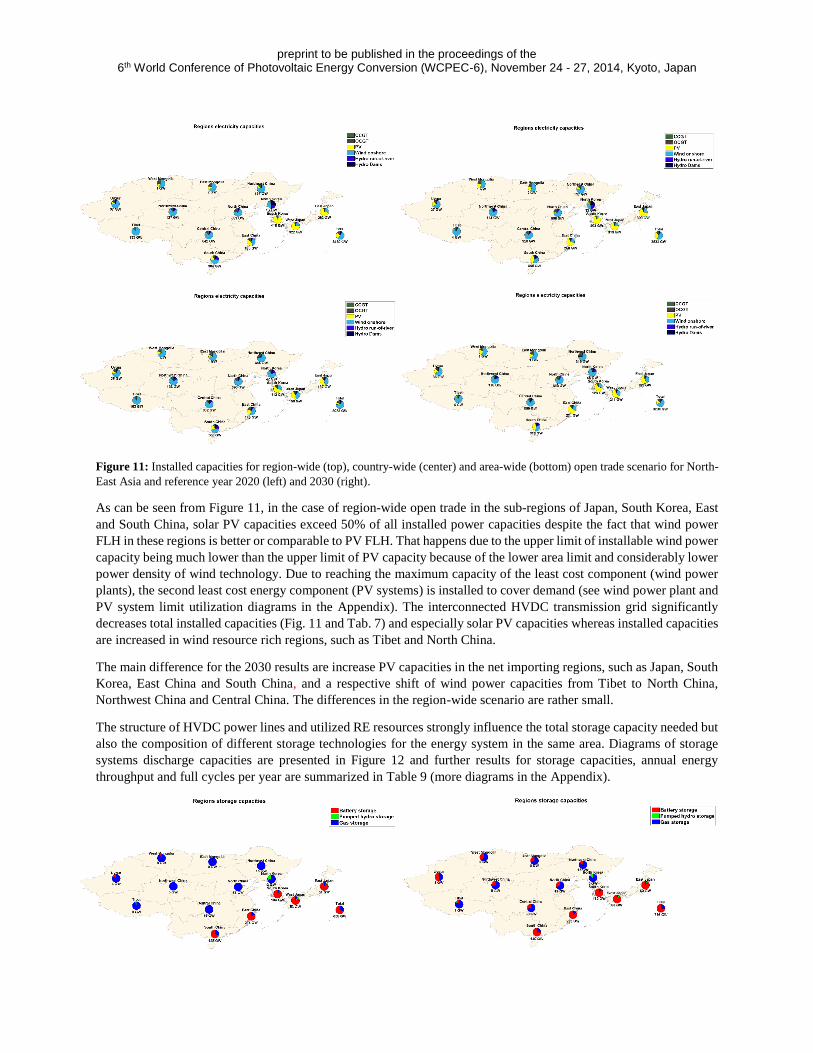
Figure 11: Installed capacities for region-wide (top), country-wide (center) and area-wide (bottom) open trade scenario for North-
East Asia and reference year 2020 (left) and 2030 (right).
As can be seen from Figure 11, in the case of region-wide open trade in the sub-regions of Japan, South Korea, East
and South China, solar PV capacities exceed 50% of all installed power capacities despite the fact that wind power
FLH in these regions is better or comparable to PV FLH. That happens due to the upper limit of installable wind power
capacity being much lower than the upper limit of PV capacity because of the lower area limit and considerably lower
power density of wind technology. Due to reaching the maximum capacity of the least cost component (wind power
plants), the second least cost energy component (PV systems) is installed to cover demand (see wind power plant and
PV system limit utilization diagrams in the Appendix). The interconnected HVDC transmission grid significantly
decreases total installed capacities (Fig. 11 and Tab. 7) and especially solar PV capacities whereas installed capacities
are increased in wind resource rich regions, such as Tibet and North China.
The main difference for the 2030 results are increase PV capacities in the net importing regions, such as Japan, South
Korea, East China and South China, and a respective shift of wind power capacities from Tibet to North China,
Northwest China and Central China. The differences in the region-wide scenario are rather small.
The structure of HVDC power lines and utilized RE resources strongly influence the total storage capacity needed but
also the composition of different storage technologies for the energy system in the same area. Diagrams of storage
systems discharge capacities are presented in Figure 12 and further results for storage capacities, annual energy
throughput and full cycles per year are summarized in Table 9 (more diagrams in the Appendix).

preprint to be published in the proceedings of the 6th World Conference of Photovoltaic Energy Conversion (WCPEC-6), November 24 - 27, 2014, Kyoto, Japan
Figure 12: Storage systems discharge capacities for region-wide (top), country-wide (center) and area-wide (bottom) open trade
scenarios for North-East Asia and the reference year 2020 (left) and 2030 (right).
Table 9. Overview on storage capacities, throughput and full cycles per year for the three scenarios and reference year 2020 (top)
and 2030 (bottom) applied in North-East Asia regions. The scenarios are defined by Figures 3 - 5, Tables 1 - 3.
Storage capacities Throughput of storage Full cycles per year
Scenario Battery PHS Gas Battery PHS Gas Battery PHS Gas
[TWhel] [TWhel] [TWhth] [TWhel] [TWhel] [TWhth] [-] [-] [-]
Region-wide 2.7 0.1 373.8 803 24 814 297.3 233.0 2.2
Country-wide 1.1 0.1 313.8 360 27 594 318.5 269.5 1.9
Area-wide 0.1 0.1 294.6 28 33 553 469.2 312.4 1.9
Storage capacities Throughput of storage Full cycles per year
Scenario Battery PHS Gas Battery PHS Gas Battery PHS Gas
[TWhel] [TWhel] [TWhth] [TWhel] [TWhel] [TWhth] [-] [-] [-]
Region-wide 3.3 0.1 364.1 997 22 722 299.7 218.2 2.0
Country-wide 1.7 0.1 305.4 545 24 561 329.5 239.0 1.8
Area-wide 0.6 0.1 404.0 223 23 546 350.2 215.6 1.4
The decrease of the PV generation fraction goes hand in hand with the decrease of short-term storage (batteries and
PHS). At the same time the increase of the wind generation fraction leads to an increase of long-term storage (gas
storage). Consequently, power transmission and decrease of PV generation share leads to a reduced share of battery
and PHS storage (in Japanese sub-regions and Korea PHS installed capacities reached the lower limits and cannot be
decreased further). The HVDC transmission grid interconnection dramatically decreases total storage requirements
since capacities for energy storage, discharge and storage throughput decrease from 190 TWhel,eq, 658 GW and 1234
TWhel,eq in the region-wide open trade scenario (reference year 2020), respectively, to 147 TWhel,eq, 176 GW and 337
TWhel,eq (reference year 2020) in the area-wide open trade scenario, respectively, where the thermal energy units are
converted to electrical energy units by applying the average efficiency of gas turbines (Tab. 3). Finally, it can be stated
that interconnected HVDC power lines substitute in particular for short-term storage, i.e. transfer of energy in time

preprint to be published in the proceedings of the 6th World Conference of Photovoltaic Energy Conversion (WCPEC-6), November 24 - 27, 2014, Kyoto, Japan
(storage) is substituted by transfer of energy in space (transmission) by reducing overall generation and storage
capacities and increasing in transmission capacities to reach a lower total energy system cost.
These structural changes lead to a shift in total energy system cost and in the structure of LCOE. Diagrams of LCOE
components are presented in Figure 13 and numeric values for LCOE components in all regions and scenarios are
summarized in Table 10.
Figure 13: LCOE components for region-wide (top), country-wide (center) and area-wide (bottom) open trade scenarios for North-
East Asia and the reference year 2020 (left) and 2030 (right).

preprint to be published in the proceedings of the 6th World Conference of Photovoltaic Energy Conversion (WCPEC-6), November 24 - 27, 2014, Kyoto, Japan
Table 10. Total LCOE components in all sub-regions for the three scenarios for the reference year 2030. The share of export is
defined as the ratio of net exported electricity to generated primary electricity of a sub-region and the share of import is defined
as the ratio of imported electricity to electricity demand. The area average is composed of sub-regions’ values weighted by
electricity demand. The same table for the reference year 2020 can be found in the Appendix. The scenarios are defined by Figures
3 - 5, Tables 1 - 3.
Region-wide LCOE primary LCOC LCOS LCOT LCOE total
[€/kWh] [€/kWh] [€/kWh] [€/kWh] [€/kWh]
Area average 0.052 0.005 0.025 0.000 0.081
East Japan 0.048 0.013 0.027 0.000 0.088
West Japan 0.055 0.003 0.026 0.000 0.084
South Korea 0.055 0.005 0.046 0.000 0.106
North Korea 0.073 0.015 0.016 0.000 0.104
Northeast China 0.046 0.005 0.017 0.000 0.068
North China 0.045 0.004 0.017 0.000 0.066
East China 0.061 0.005 0.047 0.000 0.113
Central China 0.049 0.002 0.011 0.000 0.062
South China 0.060 0.003 0.027 0.000 0.091
Tibet 0.030 0.003 0.012 0.000 0.045
Northwest China 0.042 0.004 0.009 0.000 0.056
Uygur 0.049 0.003 0.014 0.000 0.066
West Mongolia 0.051 0.007 0.024 0.000 0.082
East Mongolia 0.045 0.006 0.023 0.000 0.074
Country-wide LCOE primary LCOC LCOS LCOT LCOE total
export (-)/ import
(+)
[€/kWh] [€/kWh] [€/kWh] [€/kWh] [€/kWh] [%]
Area average 0.048 0.004 0.015 0.003 0.070 0.0
East Japan 0.048 0.007 0.022 0.001 0.078 -1.8
West Japan 0.054 0.004 0.026 0.001 0.085 1.8
South Korea 0.055 0.005 0.046 0.000 0.106 0.0
North Korea 0.073 0.015 0.016 0.000 0.104 0.0
Northeast China 0.040 0.005 0.011 0.003 0.059 -3.1
North China 0.042 0.003 0.012 0.003 0.060 -21.5
East China 0.054 0.001 0.016 0.012 0.084 58.8
Central China 0.048 0.003 0.008 0.003 0.062 -29.0
South China 0.061 0.002 0.012 0.005 0.080 35.0
Tibet 0.027 0.005 0.008 0.002 0.041 -15.6
Northwest China 0.039 0.004 0.005 0.002 0.050 -12.2
Uygur 0.048 0.002 0.012 0.002 0.064 12.5
West Mongolia 0.054 0.005 0.023 0.003 0.084 5.4
East Mongolia 0.051 0.004 0.020 0.001 0.076 -2.4
Area-wide LCOE primary LCOC LCOS LCOT LCOE total
export (-)/ import
(+)
[€/kWh] [€/kWh] [€/kWh] [€/kWh] [€/kWh] [%]
preprint to be published in the proceedings of the 6th World Conference of Photovoltaic Energy Conversion (WCPEC-6), November 24 - 27, 2014, Kyoto, Japan
Area average 0.046 0.003 0.010 0.004 0.064 0.0
East Japan 0.044 0.001 0.010 0.003 0.057 14.5
West Japan 0.050 0.001 0.012 0.003 0.067 18.8
South Korea 0.047 0.002 0.010 0.013 0.072 57.5
North Korea 0.052 0.007 0.004 0.008 0.071 -78.4
Northeast China 0.042 0.005 0.016 0.004 0.067 -30.1
North China 0.040 0.003 0.010 0.004 0.057 -34.2
East China 0.058 0.001 0.020 0.017 0.096 64.5
Central China 0.046 0.003 0.006 0.003 0.059 -29.2
South China 0.062 0.002 0.014 0.005 0.083 34.3
Tibet 0.027 0.005 0.007 0.002 0.042 -16.2
Northwest China 0.040 0.004 0.006 0.002 0.051 -11.5
Uygur 0.048 0.002 0.012 0.002 0.064 11.7
West Mongolia 0.049 0.005 0.020 0.003 0.077 9.1
East Mongolia 0.043 0.006 0.019 0.003 0.071 1.1
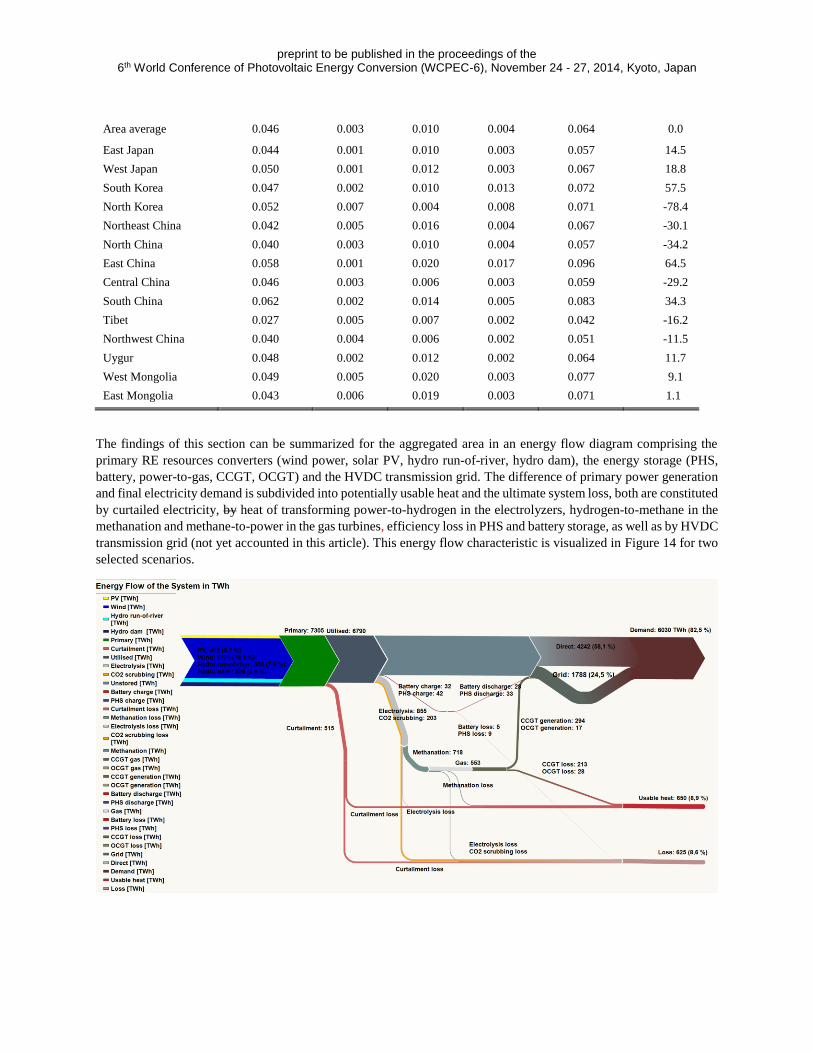
The findings of this section can be summarized for the aggregated area in an energy flow diagram comprising the
primary RE resources converters (wind power, solar PV, hydro run-of-river, hydro dam), the energy storage (PHS,
battery, power-to-gas, CCGT, OCGT) and the HVDC transmission grid. The difference of primary power generation
and final electricity demand is subdivided into potentially usable heat and the ultimate system loss, both are constituted
by curtailed electricity, by heat of transforming power-to-hydrogen in the electrolyzers, hydrogen-to-methane in the
methanation and methane-to-power in the gas turbines, efficiency loss in PHS and battery storage, as well as by HVDC
transmission grid (not yet accounted in this article). This energy flow characteristic is visualized in Figure 14 for two
selected scenarios.

preprint to be published in the proceedings of the 6th World Conference of Photovoltaic Energy Conversion (WCPEC-6), November 24 - 27, 2014, Kyoto, Japan
Figure 14: Energy flow of the system for the scenarios area-wide open trade for the reference year 2020 (top) and region-wide
open trade for the reference year 2030 (bottom). Please note the ‘usable heat’ is accounted as loss in this work, however it could
be used in the heat sector in case of temporal and spatial match of demand and supply.
The area-wide open trade scenario for the reference year 2020 costs 0.077 €/kWh whereas the cost of the region-wide
open trade scenario for the reference year 2030 is calculated at 0.081 €/kWh. Due to the different reference years, the
total LCOE of the energy system cannot directly be compared, but roughly the same absolute costs have to be raised
to cover the same electricity demand. However, the two energy systems differ structurally since in the area-wide
scenario 24% of the generated energy is traded inter-regionally, 1% is stored and contribution shares of solar PV and
wind energy are about 6% and about 79%. In the region-wide scenario the same final electricity demand is covered
by 0% inter-regional trade, 33% storage contribution, 39% solar PV generation and 47% wind energy generation. The
ultimate system loss and the potentially usable heat differ slightly in the two scenarios with 9% and 9% (area-wide)
and 12% and 10% (region-wide), respectively. The potentially usable heat is accumulated closer to the energy demand
centers in the region-wide open trade scenario, leading to a higher probability of actual usage, providing a higher value
to that heat. However, this potentially usable heat can only be beneficial in case of temporal and spatial match of
demand and availability. Future research which also integrates the heat sector can derive an economic value for the
potentially useful heat being lost. This represents a constraint of the work presented in this article.
4.2. Findings about specific characteristics or effects
The largest decrease of sub-regional total power system LCOE can be observed in the net importing sub-regions, such
as Japan, South Korea, South and East China. Interestingly, this can also lead to increase in LCOE in net exporting
sub-regions, such as Tibet, because of additional transmission cost. An interesting effect of international electricity
trade can be observed in East China. After considerable decrease in LCOE in the case of the country-wide open trade
scenario, LCOE gradually increases in the case of the area-wide scenario because of the rise of concurrency for grid
capacity with Japan and South Korea. It can be observed that the fraction of primary RE generation LCOE in all the
scenarios is almost the same. The transmission lines play the role of least cost and high efficient storage even for net
exporting sub-regions. In Figure 15 the profile of North China is presented for the area-wide open trade scenario as
an example of a net exporting sub-region.

preprint to be published in the proceedings of the 6th World Conference of Photovoltaic Energy Conversion (WCPEC-6), November 24 - 27, 2014, Kyoto, Japan
Figure 15: North China’s electricity generation and consumption profile for area-wide open trade scenario.
The second major net exporter, North China, exports electricity and utilizes energy from storage only if there is no
free import capacity available. At the same time we can also see operating CCGT discharging gas storage to cover
electricity export needs.
The impact on the energy system design can be considerable depending on scenario assumptions in inter-regional
energy transmission as documented well for the case of South Korea (Fig. 16).

preprint to be published in the proceedings of the 6th World Conference of Photovoltaic Energy Conversion (WCPEC-6), November 24 - 27, 2014, Kyoto, Japan
Figure 16: South Korea’s electricity generation and consumption profile for region-wide (top) and area-wide (bottom) open trade
scenario.
Grid utilization leads to a significant decrease of installed PV and battery storage capacities (Fig. 16). Furthermore, it
can be observed that battery storage starts charging twice a day: during daytime from PV and during nighttime from
the grid. In Figure 16 (top) an energy flow from gas storage to battery storage can be observed since generation
capacities of battery storage or of gas storage can only cover all demand in case of zero primary energy generation if
both are available for several hours at high discharge capacity utilization, which requires discharge of gas storage and
preprint to be published in the proceedings of the 6th World Conference of Photovoltaic Energy Conversion (WCPEC-6), November 24 - 27, 2014, Kyoto, Japan
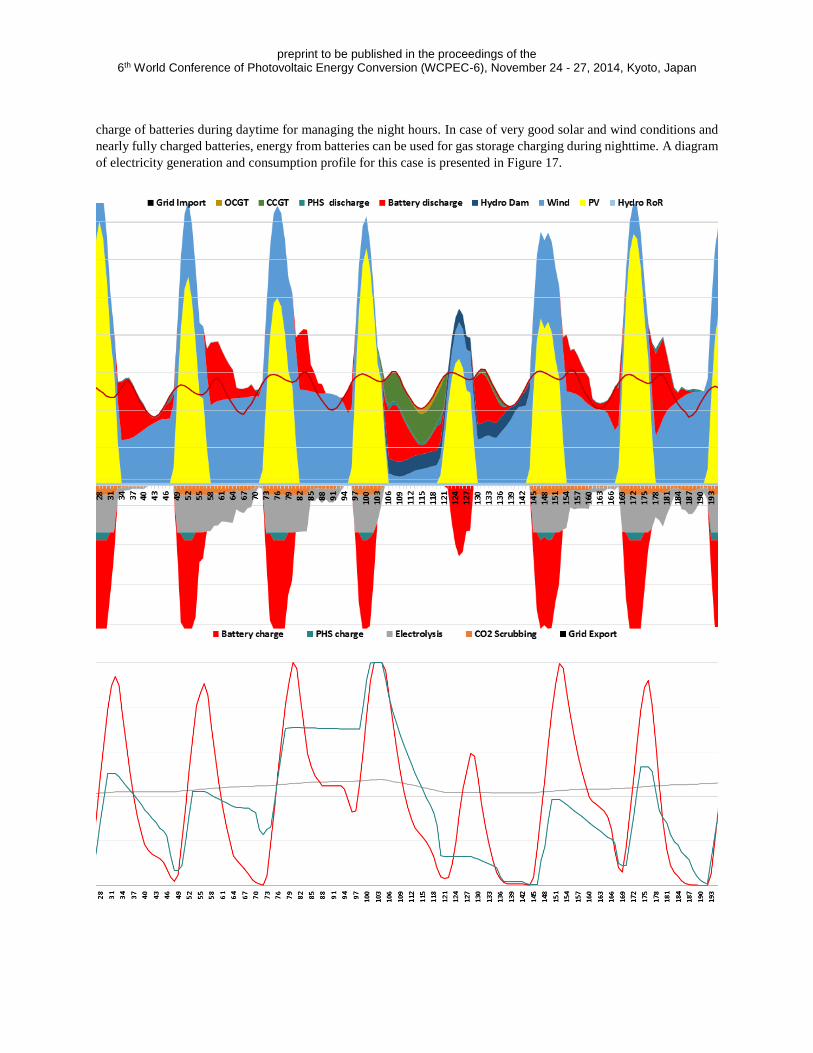
charge of batteries during daytime for managing the night hours. In case of very good solar and wind conditions and
nearly fully charged batteries, energy from batteries can be used for gas storage charging during nighttime. A diagram
of electricity generation and consumption profile for this case is presented in Figure 17.

preprint to be published in the proceedings of the 6th World Conference of Photovoltaic Energy Conversion (WCPEC-6), November 24 - 27, 2014, Kyoto, Japan
Figure 17: West Japan’s electricity generation and consumption profile (top) and storage systems’ state-of-charge (bottom) for
region-wide open trade scenario. The state-of-charge of storage is normalized to values between 0 and 1. Notice the gas storage
charge from batteries in night hours.
The discharge of batteries during night times in the case of to be expected high solar PV generation during the
following day represents the least cost solution for the energy system. If the batteries were still fully charged on the
following day, more generated primary energy would have to be curtailed due to limited total capacities of the batteries
and the electrolyzer units of power-to-gas storage. This optimized total energy system operation mode has never been
reported before, at least to the knowledge of the authors of this article.
It is also shown in Figure 17 (bottom), that as predicted, batteries and PHS work as short-term storage (daily cycles)
and gas storage as a long-term storage (seasonal cycle). PHS annual full cycles are slightly lower than those of batteries
because of identically assumed variable operational expenses and lower efficiency of PHS storage.
5. Outlook
It is planned to broaden the scope of the work, in particular in the covered area, included technologies, prosumer
economics and scenario constraints.
The regions to be integrated in the North-East Asian Super Grid are East Siberia and Far East regions of Russia. In
addition, further technologies should be included, such as concentrated solar thermal electricity generation (CSP),
geothermal energy, waste-to-energy plants and 1-axis tracking PV power plants. Due to excellent PV self-consumption
economics, it is planned to integrate this new prosumer element in the energy system modelling. One simplification
of the used model is zero losses of the transmission lines. This issue will be solved and reliability of results will be
significantly increased. For further increasing the reliability of the results we will also develop two scenarios more:
‘Area-wide limited trade’, in which the maximum possible share of imported electricity will be limited to 50% of sub-
regional demand and ‘High supply security’ scenario, in which all regions will be able to operate independently for
three months.
All these adjustments will be taken into account to gain insights into a more realistic energy system set-up.
6. Conclusions
The 100% renewable energy system in North-East Asia is no wishful thinking; it is a real policy option, in particular
due to rapidly decreasing RE technology LCOE and improving storage economics. The HVDC transmission grid plays
a key role since the established super grid enables a substantial cost decrease of the renewable resources-based energy
system, as the total system LCOE decreases from 0.115 €/kWh to 0.077 €/kWh for the reference year of 2020 and
from 0.081 €/kWh to 0.064 €/kWh for the reference year of 2030 for the region-wide and area-wide open trade
scenarios, respectively. The major LCOE decrease is caused by cut-off of storages utilization and significantly reduced
primary generation capacities. However, the LCOE spread of the scenarios is reduced significantly from 0.038 €/kWh
(2020) to 0.017 €/kWh (2030), which may indicate that a very large scale RE integration could provide a too small
economic benefit for its realization. Such results have already been found for the case of Germany [42,43], but one
has to have in mind that the area of North-East Asia and Germany cannot easily be compared; nevertheless, the
structure of results needs to be investigated in more detail.
In parallel the total capex requirements are reduced substantially from about 6100 bn € to about 4400 bn € for the
reference year 2020 by taking the HVDC transmission grid into account. The total capex requirements for 2030

preprint to be published in the proceedings of the 6th World Conference of Photovoltaic Energy Conversion (WCPEC-6), November 24 - 27, 2014, Kyoto, Japan
assumptions are reduced from about 4600 bn € to about 3800 bn €. The total capex requirements reflect the LCOE
results.
The very good economics of wind energy heavily influences the optimized energy system design. However, some
intended improvements of the model will partly reduce the dominance of wind energy, such as transmission losses of
HVDC power lines, 1-axis tracking PV systems and PV self-consumption of prosumers.
Two quite interesting effects of the storage technology operation modes have been found within this modelling
approach: firstly, discharging batteries during the nights and charging of power-to-gas for maximized storing the
following day; secondly, extra discharging of power-to-gas during daytime and charging of batteries to cover the
demand in night hours without any RE generation for a PV dominated region. Such operational modes for storage are
an important aspect of a better understanding of the role and interaction of different storage technologies in 100%
renewable energy systems.
The trade-off between grids and storage is well known. The found LCOE difference of 0.038 €/kWh (2020) and 0.017
€/kWh (2030) between the area-wide and region-wide open trade scenarios clearly documents the assumed increasing
competitiveness of storage solutions. The attractiveness of a strongly interconnected transmission grid over a large
area is dependent on the spread of the centralized and decentralized system option. The smaller the LCOE difference
of a highly centralized to a highly decentralized energy system becomes the less attractive will be a centralized
approach finally. More decentralized approaches might be also in the long-run the cheaper option since very large
scale energy infrastructure projects are often characterized by cost and time overruns [44] and local support of the
population is typically higher for more regional approaches. However, for some regions a more centralized energy
system in North-East Asia is very relevant due to rather unattractive RE resource availability (e.g. East China) or
limited area for RE utilization (e.g. South Korea).
The findings for the North-East Asian 100% renewable resources-based energy system can be compared to most recent
insights in Europe about non-renewable options, such as nuclear energy, natural gas and coal carbon capture and
storage (CCS) alternatives [45]. These alternatives lead also to a decarbonized energy system, which is of utmost
relevance for a climate change mitigation strategy. The LCOE of the alternatives are as follows: 11.2 €/kWh for new
nuclear (assumed for 2023 in the UK and Czech Republic), 11.2 €/kWh for gas CCS (assumed for 2019 in the UK)
and 12.6 €/kWh for coal CCS (assumed for 2019 in the UK). However, a recent report published by the European
Commission [46] concludes that CCS technology is not likely to be commercially available before the year 2030. The
findings for Europe are assumed to be also valid for North-East Asia in the mid-term. The 100% renewable resources-
based energy system options for North-East Asia presented in this work are considerably lower in cost (about 30-40
%) than the higher risk options, which have still further disadvantages, such as nuclear melt-down risk, nuclear
terrorism risk, unsolved nuclear waste disposal, remaining CO2 emissions of power plants with CCS technology,
diminishing conventional energy resources base and high health cost due to heavy metal emissions of coal fired power
plants.
More research is needed for a better understanding of a fully optimized renewable energy system in North-East Asia,
however, this research work clearly indicates that a 100% renewable resources-based energy system is a real policy
option.
Acknowledgements
The LUT authors gratefully acknowledge the public financing of Tekes, the Finnish Funding Agency for Innovation,
for the ‘Neo-Carbon Energy’ project under the number 40101/14. The authors would like to thank Michael Child for
proofreading.
preprint to be published in the proceedings of the 6th World Conference of Photovoltaic Energy Conversion (WCPEC-6), November 24 - 27, 2014, Kyoto, Japan
References
[1] [IPCC] - Intergovernal Panel on Climate Change, 2014. IPCC 5th Assessment Synthesis Report: Climate Change 2014,
IPCC, Geneva, www.ipcc.ch
[2] Stern N. (ed.), 2006. Stern Review on the economics of climate change, HM Treasury, London
[3] Epstein P.R., Buonocore J.J., Eckerle K., Hendryx M., Stout B.M., Heinberg R., Clapp R.W., May B., Reinhart N.L., Ahern
M.M., Doshi S.K., Glustrom L., 2011. Full cost accounting for the life cycle of coal, Annals of the New York Academy of
Sciences, 1219, 73-98
[4] [WWF] – World Wild Fund for Nature International, 2014. Living Planet Report 2014: Species and spaces people and
places, WWF, Zoological Society of London, Global Footprint Network and Water Footprint Network, Gland
[5] [EWG] - Energy Watch Group, Fossil and Nuclear Fuels – the Supply Outlook, Berlin, 2013
[6] Murray J. and King D., 2012. Oil’s tipping point has passed, Nature, 481, 433-435
[7] Lin B. and Liu J., 2010. Estimating coal production peak and trends of coal imports in China, Energy Policy, 38, 512-519
[8] Pleßmann G., Erdmann M., Hlusiak M., Breyer Ch., 2014. Global Energy Storage Demand for a 100% Renewable
Electricity Supply, Energy Procedia, 46, 22-31
[9] Hoffmann W., 2014. The Economic Competitiveness of Renewable Energy: Pathways to 100% Global Coverage, John
Wiley & Sons
[10] Droege P., 2009. 100 Per Cent Renewable: Energy Autonomy in Action, Routledge
[11] Connolly D. and Mathiesen B.V., 2014. A technical and economic analysis of one potential pathway to a 100% renewable
energy system, Int. J. Sustainable Energy Planning and Management, 1, 7–28
[12] Henning H.-M. and Palzer A., 2014. A comprehensive model for the German electricity and heat sector in a future energy
system with a dominant contribution from renewable energy technologies – Part II: Results, Renewable and Sustainable
Energy Reviews, 30, 1019-1034
[13] Fell H.-J., 2012. Global Cooling: Strategies for climate protection, CRC Press, Boca Raton
[14] [REN21] – Renewable Energy Policy Network for the 21st Century, 2014. Renewables 2014 Global Status Report, Paris,
2014, http://www.ren21.net/ren21acti-vities/globalstatusreport.aspx
[15] Dii, 2012.2050 Desert Power – Perspectives on a Sustainable Power System for EUMENA, Dii, Munich, www.dii-
eumena.com
[16] Grossmann W.D., Grossmann I., Steininger K.W., 2014. Solar electricity generation across large geographic areas, Part II:
A Pan-American energy system based on solar, Renewable and Sustainable Energy Reviews, 32, 983-993
[17] Komoto K., Ito M., Vleuten van der P., Faiman D., Kurokawa K., (eds.), 2009. Energy from the Desert – Very Large Scale
Photovoltaic Systems: Socio-economic, Financial, Technical and Environmental Aspects, Earthscan, London
[18] Mano S., Ovgor B., Samadov Z., Pudlik M., Jülich V., Sokolov D., Yoon J.Y., 2014. Gobitec and Asian Super Grid for
Renewable Energies in Northeast Asia, report prepared by Energy Charter Secretariat, Energy Economics Institute of the
Republic of Korea, Energy Systems Institute of the Russian Federation, Ministry of Energy of Mongolia, Japan Renewable
Energy Foundation,
http://www.encharter.org/fileadmin/user_upload/Publications/Gobitec_and_the_Asian_Supergrid_2014_ENG.pdf
[19] Knies G. (ed.), 2009. Clean Power from Deserts – The Desertec Concept for Energy, Water and Climate Security,
Whitebook 4th Ed., DESERTEC Foundation, Hambur
[20] Breuer W., Retzmann D., Uecker K., 2010. Highly Efficient Solutions for Smart and Bulk Power Transmission of „Green
Energy“, 21st World Energy Congress, Montreal, September 12-16
[21] Callavik M., 2011. HVDC Grids for Offshore and Onshore Transmission, EWEA Offshore Wind Conference, Amsterdam,
November 29 – December 1
[22] Taggart, S., James G., Dong Z.Y., Russell C., 2012. The Future of Renewable Linked by a Transnational Asian Grid,
Proceedings of the IEEE, 100, 348-359
[23] [ZSW] – Zentrum für Sonnenenergie- und Wasserstoff-Forschung, 2014. Stromerzeugung aus Solarer Strahlungsenergie –
Vorbereitung und Begleitung der Erstellung des Erfahrungsberichts 2014 gemäß § 65 EEG,” study conducted by ZSW,
Fraunhofer-IWES, Bosch & Partner, GfK on behalf of Federal Ministry for the Environment Nature Conservation Building
and Nuclear Safety, Berlin, p. 136, 2014, available: www.bmwi.de
[24] Song J., 2012. Cooperation with Neighboring Countries for Super-Grid in Gobi desert (SG-Gobi Project), International
conference on Renewable Energy Cooperation and Grid Integration in North-East Asia, Ulaanbaatar, Mongolia, November
11-12
[25] Song J., 2014. Super Grid in North-east Asia through Renewable Energy, Asia-Pacific Tech Monitor, 31, 24-27
[26] Komoto K., Enebish N., Song J., 2013. Very Large Scale PV Systems for North-East Asia: Preliminary project proposals
for VLS-PV in the Mongolian Gobi desert, 39th PVSC, Tampa, June 16-21
[27] Stackhouse P.W., Whitlock C.H., (eds.), 2008. Surface meteorology and Solar Energy (SSE) release 6.0, NASA SSE 6.0,
Earth Science Enterprise Program, National Aeronautic and Space Administration (NASA), Langley,
http://eosweb.larc.nasa.gov/sse/
preprint to be published in the proceedings of the 6th World Conference of Photovoltaic Energy Conversion (WCPEC-6), November 24 - 27, 2014, Kyoto, Japan
[28] Stackhouse P.W., Whitlock C.H., (eds.), 2009. Surface meteorology and Solar Energy (SSE) release 6.0 Methodology,
NASA SSE 6.0, Earth Science Enterprise Program, National Aeronautic and Space Administration (NASA), Langley,
http://eosweb.larc.nasa.gov/sse/documents/SSE6Methodology.pdf
[29] Gerlach A.-K., Stetter D., Schmid J., Breyer Ch., 2011. PV and Wind Power – Complementary Technologies, 26th EU
PVSEC, Hamburg, September 5-9, DOI: 10.4229/26thEUPVSEC2011-6CV.1.32
[30] Stetter D., 2012. Enhancement of the REMix energy system model: Global renewable energy potentials optimized power
plant siting and scenario validation, Dissertation, Faculty of Energy-, Process and Bio-Engineering, University of Stuttgart
[31] T. Huld, M. Šúri, and E. D. Dunlop, “Geographical variation of the conversion efficiency of crystalline silicon photovoltaic
modules in Europe,” Prog. Photovoltaics Res. Appl., vol. 16, pp. 595–607, Nov. 2008.
[32] Enercon, 2014. Enercon product overview, Enercon GmbH, Aurich, www.enercon.de
[33] State Grid Corporation of China, 2014. http://www.sgcc.com.cn/ywlm/projects/ultrahighvoltage/index.shtml
[34] Agora Energiewende, 2014. Stromspeicher in der Energiewende - Untersuchung zum Bedarf an neuen Stromspeichern in
Deutschland für den Erzeugungsausgleich, Systemdienstleistungen und im Verteilnetz, study prepared by FENES of OTH
Regensburg, IAEW and ISEA of RWTH Aachen and ef.Ruhr, Berlin, September, www.agora-energiewende.de
[35] UBS, Will solar, batteries and electric cars re-shape the electricity system?, Q-Series – Global Utilities, Autos &
Chemicals, August 20
[36] Hoffmann W., 2014. Importance and Evidence for Cost Effective Electricity Storage, 29th EU PVSEC, Amsterdam,
September 22-26
[37] [ISE] – Fraunhofer Institute for Solar Energy Systems, 2014. PV Cost Vision 2050 – Scenarios on the Future Cost
Development of Photovoltaics, study on behalf of Agora Energiewende
[38] Platts, (2012). UDI World Electric Power Plants data base (WEPP). Platts – A Division of The McGraw-Hill, Washington.
[39] Heier S., 2009. Windkraftanlagen – Systemauslegung, Netzintegration und Regelung, 5th edition, Vieweg + Teubner,
Wiesbaden, p. 393-436
[40] Gasch R. and Twele J., (eds.), 2010. Windkraftanlagen – Grundlagen, Entwurf, Planung und Betrieb, 6th ed., Vieweg +
Teubner, Wiesbaden, p. 505-522
[41] Hau E., 2008. Windkraftanlagen – Grundlagen, Technik, Einsatz, Wirtschaftlichkeit, 4th edition, Springer-Verlag, Berlin,
p. 732-748
[42] Agora Energiewende, 2013. Kostenoptimaler Ausbau der Erneuerbaren Energien in Deutschland, study prepared by
Consentec and Fraunhofer IWES, Berlin, May
[43] Breyer Ch., Müller B., Möller C., Gaudchau E., Schneider L., Gajkowski K., Resch M., Pleßmannn G., 2014. Vergleich
und Optimierung von zentral und dezentral orienntierten Ausbaupfaden zu einer Strommversorgung aus Erneuerbaren
Energien in Deutschland, study prepared by Reiner Lemoine Institut on behalf of the 100 prozent erneuerbar stiftung,
Heleakala-Stiftung and Bundesverband mittelständische Wirtschaft (BVMW), Berlin, January
[44] Van de Graaf T. and Sovacool B.K., 2014. Thinking big: Politics, progress and security in the management of Asian and
European energy megaprojects, Energy Policy, 74, 16-27
[45] Agora Energiewende, 2014. Comparing the Cost of Low-Carbon Technologies: What is the Cheapest Option?, study
prepared by Prognos AG on behalf of Agora Energiewende, Berlin, April
[46] [EC] – European Commission, 2014. Integration of Renewable Energy in Europe, study prepared by KEMA Consulting,
DNV GL – Energy, Imperial College and NERA Economic Consulting on behalf of DG Energy, Brussels, June
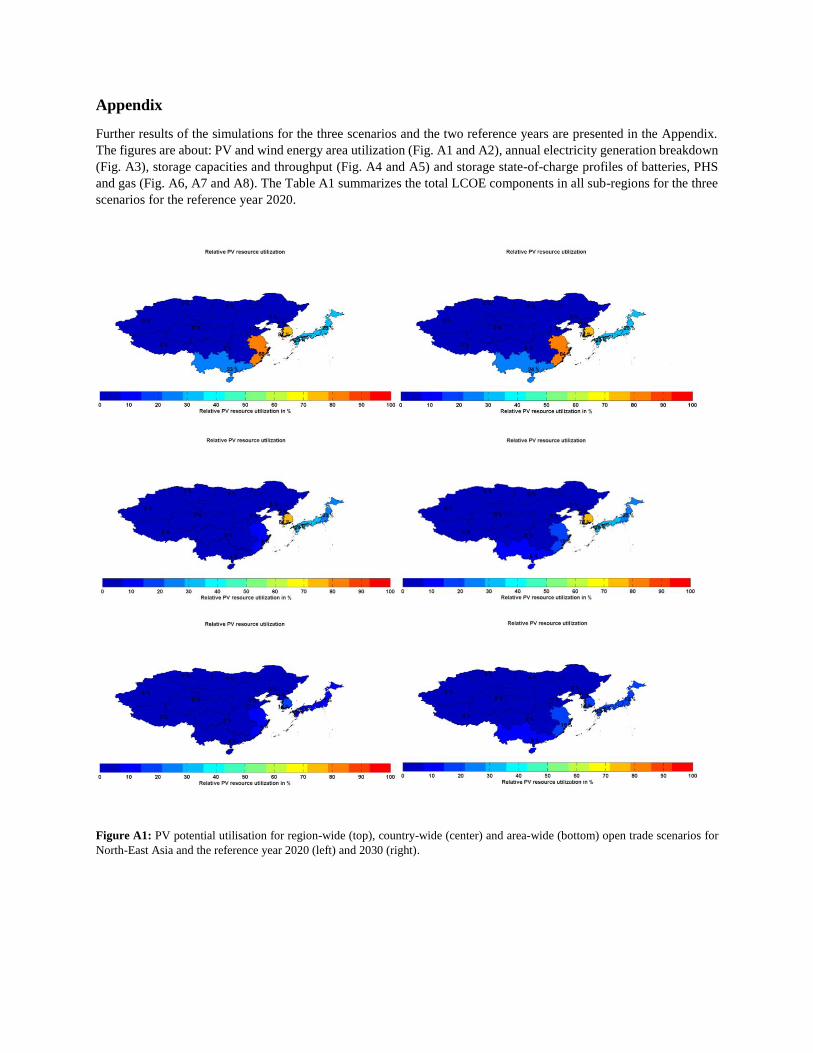
Appendix
Further results of the simulations for the three scenarios and the two reference years are presented in the Appendix.
The figures are about: PV and wind energy area utilization (Fig. A1 and A2), annual electricity generation breakdown
(Fig. A3), storage capacities and throughput (Fig. A4 and A5) and storage state-of-charge profiles of batteries, PHS
and gas (Fig. A6, A7 and A8). The Table A1 summarizes the total LCOE components in all sub-regions for the three
scenarios for the reference year 2020.
Figure A1: PV potential utilisation for region-wide (top), country-wide (center) and area-wide (bottom) open trade scenarios for
North-East Asia and the reference year 2020 (left) and 2030 (right).

Figure A2: Wind potential utilisation for region-wide (top), country-wide (center) and area-wide (bottom) open trade scenarios for
North-East Asia and the reference year 2020 (left) and 2030 (right).

Figure A3: Annual electricity generation for region-wide (top), country-wide (center) and area-wide (bottom) open trade scenarios
for North-East Asia and the reference year 2020 (left) and 2030 (right).
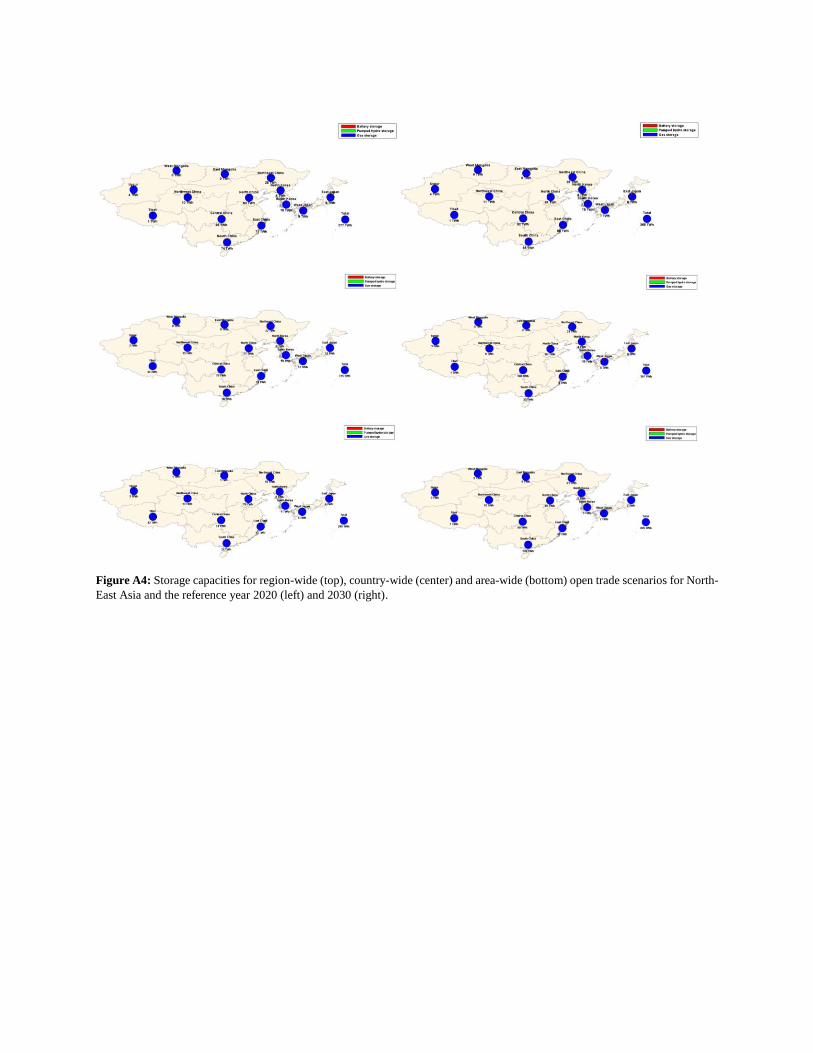
Figure A4: Storage capacities for region-wide (top), country-wide (center) and area-wide (bottom) open trade scenarios for North-
East Asia and the reference year 2020 (left) and 2030 (right).
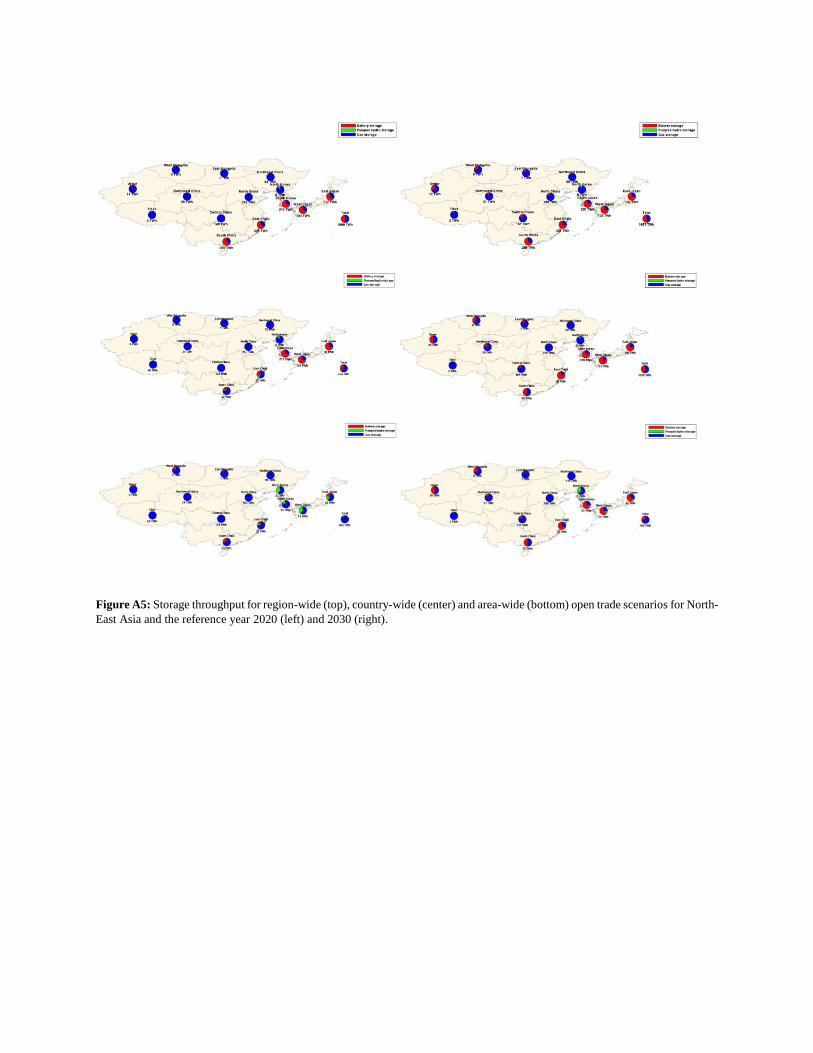
Figure A5: Storage throughput for region-wide (top), country-wide (center) and area-wide (bottom) open trade scenarios for North-
East Asia and the reference year 2020 (left) and 2030 (right).

Figure A6: Battery storage profile for region-wide (top), country-wide (center) and area-wide (bottom) open trade scenarios for
North-East Asia and the reference year 2020 (left) and 2030 (right).
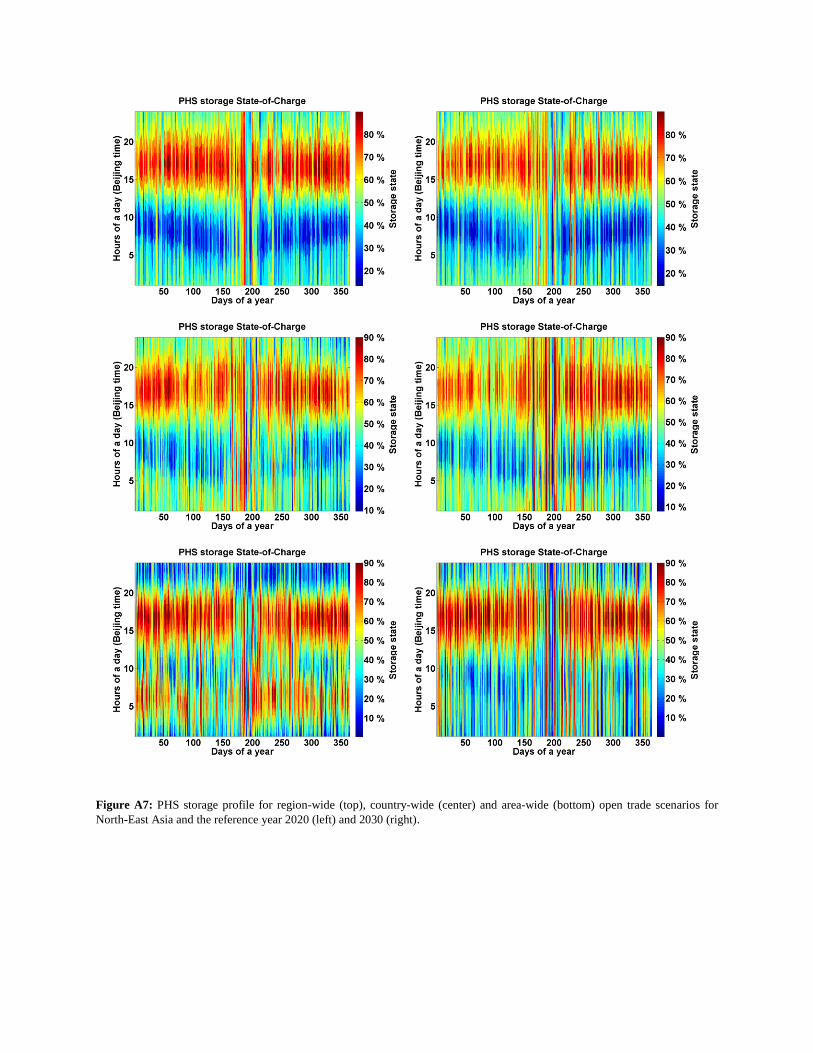
Figure A7: PHS storage profile for region-wide (top), country-wide (center) and area-wide (bottom) open trade scenarios for
North-East Asia and the reference year 2020 (left) and 2030 (right).

Figure A8: Gas storage profile for region-wide (top), country-wide (center) and area-wide (bottom) open trade scenarios for North-
East Asia and the reference year 2020 (left) and 2030 (right).
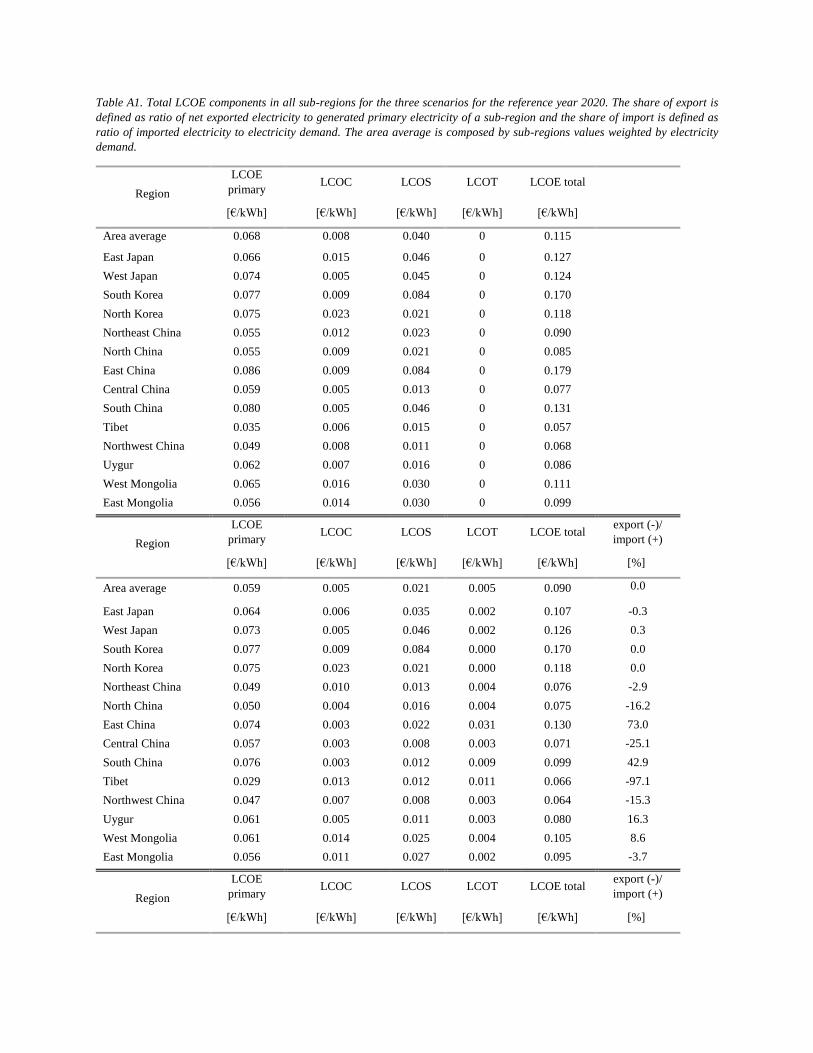
Table A1. Total LCOE components in all sub-regions for the three scenarios for the reference year 2020. The share of export is
defined as ratio of net exported electricity to generated primary electricity of a sub-region and the share of import is defined as
ratio of imported electricity to electricity demand. The area average is composed by sub-regions values weighted by electricity
demand.
Region
LCOE
primary LCOC LCOS LCOT LCOE total
[€/kWh] [€/kWh] [€/kWh] [€/kWh] [€/kWh]
Area average 0.068 0.008 0.040 0 0.115
East Japan 0.066 0.015 0.046 0 0.127
West Japan 0.074 0.005 0.045 0 0.124
South Korea 0.077 0.009 0.084 0 0.170
North Korea 0.075 0.023 0.021 0 0.118
Northeast China 0.055 0.012 0.023 0 0.090
North China 0.055 0.009 0.021 0 0.085
East China 0.086 0.009 0.084 0 0.179
Central China 0.059 0.005 0.013 0 0.077
South China 0.080 0.005 0.046 0 0.131
Tibet 0.035 0.006 0.015 0 0.057
Northwest China 0.049 0.008 0.011 0 0.068
Uygur 0.062 0.007 0.016 0 0.086
West Mongolia 0.065 0.016 0.030 0 0.111
East Mongolia 0.056 0.014 0.030 0 0.099
Region
LCOE
primary LCOC LCOS LCOT LCOE total
export (-)/
import (+)
[€/kWh] [€/kWh] [€/kWh] [€/kWh] [€/kWh] [%]
Area average 0.059 0.005 0.021 0.005 0.090 0.0
East Japan 0.064 0.006 0.035 0.002 0.107 -0.3
West Japan 0.073 0.005 0.046 0.002 0.126 0.3
South Korea 0.077 0.009 0.084 0.000 0.170 0.0
North Korea 0.075 0.023 0.021 0.000 0.118 0.0
Northeast China 0.049 0.010 0.013 0.004 0.076 -2.9
North China 0.050 0.004 0.016 0.004 0.075 -16.2
East China 0.074 0.003 0.022 0.031 0.130 73.0
Central China 0.057 0.003 0.008 0.003 0.071 -25.1
South China 0.076 0.003 0.012 0.009 0.099 42.9
Tibet 0.029 0.013 0.012 0.011 0.066 -97.1
Northwest China 0.047 0.007 0.008 0.003 0.064 -15.3
Uygur 0.061 0.005 0.011 0.003 0.080 16.3
West Mongolia 0.061 0.014 0.025 0.004 0.105 8.6
East Mongolia 0.056 0.011 0.027 0.002 0.095 -3.7
Region
LCOE
primary LCOC LCOS LCOT LCOE total
export (-)/
import (+)
[€/kWh] [€/kWh] [€/kWh] [€/kWh] [€/kWh] [%]

Area average 0.054 0.005 0.011 0.007 0.077 0.0
East Japan 0.053 0.001 0.008 0.005 0.068 22.9
West Japan 0.061 0.002 0.007 0.007 0.077 34.5
South Korea 0.065 0.004 0.010 0.024 0.103 65.8
North Korea 0.061 0.014 0.007 0.010 0.091 -76.9
Northeast China 0.049 0.009 0.018 0.006 0.081 -39.9
North China 0.049 0.004 0.013 0.005 0.071 -30.3
East China 0.073 0.004 0.020 0.043 0.139 77.8
Central China 0.056 0.002 0.007 0.003 0.069 -23.0
South China 0.075 0.003 0.012 0.009 0.099 42.2
Tibet 0.029 0.012 0.012 0.012 0.065 -97.7
Northwest China 0.048 0.006 0.008 0.003 0.066 -18.5
Uygur 0.061 0.005 0.012 0.004 0.081 18.1
West Mongolia 0.066 0.012 0.041 0.006 0.125 9.5
East Mongolia 0.055 0.010 0.031 0.004 0.100 1.2