Chris Thoung James Kempton Harriet Davison · rogress matters in rimary too 1 Progress matters in...
55
Transcript of Chris Thoung James Kempton Harriet Davison · rogress matters in rimary too 1 Progress matters in...

Progress matters in Primary too
1
Progress matters in Primary too: Holding schools to account consistently
Chris Thoung
James Kempton
Harriet Davison
Progress matters in Primary too
2
About the authorsHarriet Davison is a research assistant at CentreForum specialising in education and social policy.
Harriet holds a BA Hons in English Literature and Language from Oxford University. After graduating, she interned at international development charity the Cherie Blair Foundation for Women, then worked in Freetown, Sierra Leone, as a consultant for social enterprise The Collective.
James Kempton is an associate director at CentreForum, leading its work on social policy.
A former council leader, teacher, medical royal college chief executive and management consultant, James has worked extensively on public services reform, with a particular focus on education and social mobility policy. He is the author of several CentreForum reports in-cluding ‘Regional challenges: a collaborative approach to improving education’ (July 2014), and ‘To teach, to learn: more effective continuous professional development for teachers’ (November 2013).
He is chair of Islington Community Theatre, a trustee of Music First, a governor of New North Academy and a governor of the Cripplegate Foundation.
Chris Thoung is a researcher at CentreForum, specialising in education policy.
Earlier this year Chris authored the CentreForum report ‘Reading well by 11: modelling the potential for improvement’ (September 2014). He previously worked for an economics consultancy in Cambridge, providing policy analysis to organisations including the UK gov-ernment and European Commission.
AcknowledgementsThe authors would like to thank the individuals who informed the research for this project: Fiona Aubrey-Smith, Head of Primary, SSAT; Kate Bailey, Director of Business Development, Centre for Evaluation and Monitoring, Durham University; John Camp, Executive Headteacher, The Compass Partnership of Schools; Zoe Carr, Chief Executive Officer, Wise Academies; Professor Rob Coe, Director, Centre for Evaluation and Monitoring, Durham University; John Goodey, Executive Headteacher, St John the Baptist Primary School; Rebecca Hanson, maths education consultant; Russell Hobby, General Secretary, NAHT; Kathryn James, Director of Education, NAHT; Martin Johnson, Headteacher, Chair of SSAT Primary Network, Sacred Heart RC Primary School; Eadaoin Kelly, Assessment Lead, Brindishe Schools; Dame Vicki Patterson, Executive Headteacher, Brindishe Schools; Dame Alison Peacock, Executive Headteacher, The Wroxham Teaching School; Marva Rollins, Headteacher, Raynham Primary School; Chris Spruce, Executive Headteacher, Heathland Whitefriars Federation; Nick Ware, PiXL Primary Leader; Bill Watkin, Operational Director, SSAT.
CentreForum is grateful to Pearson for its support and particularly to Bob Osborne, its former Strategic Development Director and Julie McCulloch, Director of UK Policy & Thought Leadership. The views expressed here and any errors are the authors’ responsibility alone.
Published January 2015 CentreForumISBN: 978-1-909274-24-2This work is licensed under a Creative Commons Attribution-NonCommercial- ShareAlike 4.0 International License. For more information visit creativecommons.org

Progress matters in Primary too
3
: Contents
Executive Summary 4
1. Introduction 6
2. Systems for holding schools to account 12
3. The proposed accountability reforms 17
4. The new accountability measures 21
5. Challenges in implementing the baseline assessment 41
6. Challenges with implementing the new accountability system 49
7. Conclusions and recommendations 53
Progress matters in Primary too
4
: Executive summary
The English education system should be ambitious about the outcomes that can be achieved by the end of primary school. A high autonomy/high accountability model of schooling is the best way to raise standards. Much attention has been paid to increasing school autonomy: academisation, free schools and streamlin-ing the national curriculum being examples. Now government is turning its atten-tion to the critical area of reforming headline primary school accountability mea-sures following on from its recent reforms to secondary school accountability.
Under government’s proposals, from 2016 there will be two alternative headline measures. Either 85% of a school’s pupils must achieve the expected standards in all of reading, writing and mathematics, or pupils must demonstrate satisfactory progress in those subjects, accounting for their starting points at the beginning of primary school.
This report considers these two proposed measures against the government’s own core goals for the education system of securing the best possible out-comes for all children and ‘closing the gap’ between pupils from disadvantaged backgrounds and the rest. It finds that the progress measure is both much bet-ter-aligned with the government’s core goals and also a much fairer measure of school performance for the following reasons:
: A progress measure encourages schools to focus on all pupils, because the performance of all pupils counts equally towards school performance by that measure. The attainment measure has the potential to encourage schools to focus more narrowly on pupils near the expected standard be-cause it is here that schools stand to make the most gains in their measured performance. Consequently pupils far below the expected standard risk being left behind while those far above may not be adequately stretched.
: The progress measure considers pupil performance in light of their individ-ual starting points. In this way it is able to better identify the impact of the school from circumstances outside of its control i.e. the prior attainment of its intake. The attainment measure puts schools with lower prior-attain-ment intakes at an inherent and unfair disadvantage because such intakes are less predisposed to meeting the attainment standards.
Progress matters in Primary too
5
These findings are consistent with CentreForum’s previous research, which iden-tified the very same problems with attainment-based measures in secondary schools: the fairest and most appropriate accountability system is one that, at the level of schools, measures the progress all pupils in the school make, not the number of pupils who achieve a particular attainment threshold.
An aspirational performance target does signal the government’s wish for a step change in school performance. However the likelihood is that, based on current performance, progress will be the measure used for the vast majority of schools, at least in the short to medium term. Even those schools which achieve the attainment floor target will only do so by ensuring at least average progress is made by their pupils. As a result, progress will in practice be the dominant accountability metric.
An effective baseline assessment administered to pupils in their first half-term of Reception is fundamental to creating a progress measure. The concerns raised by stakeholders around the reliability and fairness of a baseline assessment do not present fundamental impediments to implementing the progress measure. Indeed even were such concerns to be justified they would need to considered against the demonstrable benefits of using progress as a headline accountability measure.
Since the majority of schools will be reliant on the progress measure under the new system, school leaders, teachers and parents need to be better informed about the baseline assessment and given appropriate evidence as to its validity, fairness and reliability.
Recommendation 1: Pupil progress is the fairest and most effective accountability measure and should therefore be adopted by government as its principal headline accountability measure for primary schools.
Recommendation 2: To support pupil progress becoming the principal headline accountability measure for primary schools the government should provide clear, defensible evidence that the baseline assessment which underpins it is valid, fair and reliable.

Progress matters in Primary too
6
: 1 Introduction
The coalition government has pursued an extensive programme of education reforms with the intention of raising standards through granting greater auton-omy to schools. Greater autonomy, such as academisation, places more of the responsibility for educational improvement in the hands of schools by giving them greater freedom to allocate resources and make curriculum decisions for the benefit of their pupils. However, greater autonomy, by itself, is not sufficient to ensure a more effective, self-improving education system. It is only by com-bining this greater autonomy with intelligent accountability that outcomes will improve.1
Previous research by CentreForum has highlighted the importance of a well-de-signed accountability framework for secondary schools.2 This paper extends that analysis to incorporate primary school provision.
Good accountability systems are effective in accurately judging the impact a school is making. But what they look at in making that judgement is also import-ant because it comes to define the characteristics that embody a ‘good’ school. In contrast, a poorly-designed system risks driving behaviours in the opposite direc-tion to those ideals. A high autonomy-high accountability education system pro-vides strong signals as to what is valued and greater autonomy affords schools the flexibility to pursue those goals in the most effective way, given their individ-ual resources and circumstances.
The focus of CentreForum’s earlier research was on using examination outcomes for accountability in secondary schools. This report focuses on how to improve accountability measures for primary schools taking the same starting point – the core goals the coalition government has set for the education system, namely:
1. To secure the best outcomes for all, not just some, pupils
2. To ‘close the gap’ between pupils from disadvantaged backgrounds and the rest3
1 OECD (2011), ‘School autonomy and accountability: Are they related to student performance?’, PISA in focus:www.oecd.org/pisa/pisaproducts/pisainfocus/48910490.pdf
2 Paterson, C. (2013), ‘Measuring what matters: Secondary school accountability indicators that benefit all’, CentreForum: www.centreforum.org/index.php/mainpublications/512-measur-ing-what-matters
3 Michael Gove, Education Select Committee oral evidence, 31 January 2012: www.publications.parliament.uk/pa/cm201012/cmselect/cmeduc/uc1786-i/uc178601.htm
Progress matters in Primary too
7
It evaluates the government’s proposed primary school accountability reforms that will come into effect in September 2016 and addresses the efficacy and impact of using threshold and progress measures of pupil performance in Key Stage assessments.4
Through its reforms to the national curriculum and accountability systems for primary schools, the government aims to set high expectations so that all chil-dren can reach their potential and are well prepared for secondary school.5 CentreForum has consistently argued that we should be more ambitious in set-ting high expectations of the outcomes that can be achieved by the end of prima-ry school. Research we recently conducted indicates higher attainment is achiev-able through structured intervention.6 ‘Reading well by 11’ set a realistic target of at least 96% of children reading well by 2025, compared to just three-quarters of children doing so currently and the government’s proposed threshold measure of 85% of pupils performing well at Key Stage 2.7
For individual pupils, Key Stage 2 test results are an important summative assess-ment of what they have learnt at school. Aggregating this data for each school also tells us something about the impact a school has made on its pupils overall.
However, such attainment measures are driven by more than just the impact that a school makes and include some features outside of its control. For example such a measure cannot separate the school’s impact from the prior attainment of its pupils and this advantages some schools over others. Consequently, as is consistent with the research findings that we presented regarding secondary schools, the research analysis documented in this report indicates that the best way of reaching a judgement on school effectiveness for school accountability purposes in primary schools is by looking at the progress pupils make from their starting point when they joined the school in Reception. This is even more crucial if the aim of the education system is, as we would contend, to enable all pupils to reach their full potential.
One of the key roles of government is to set goals and aspirations for the educa-tion system but it also has to set minimum levels of acceptable performance for schools – so-called floor targets. This paper considers the government’s propos-al to set two alternative floor targets for primary schools one a high threshold
4 Department for Education (2014), ‘Reforming assessment and accountability for primary schools: Government response to consultation on primary school assessment and accountability’: www.gov.uk/government/consultations/new-national-curriculum-primary-assessment-and-accountabil-ity
5 Department for Education (2014), ‘Reforming assessment and accountability for primary schools: Government response to consultation on primary school assessment and accountability’, p. 4: www.gov.uk/government/consultations/new-national-curriculum-primary-assessment-and-ac-countability
6 Thoung, C. (2014), ‘Reading well by 11: modelling the potential for improvement’, CentreForum, pp. 4-5: www.centreforum.org/assets/pubs/reading-well-by-11.pdf
7 Department for Education (2014), ‘Reforming assessment and accountability for primary schools: Government response to consultation on primary school assessment and accountability’, p. 4: www.gov.uk/government/consultations/new-national-curriculum-primary-assessment-and-ac-countability
Progress matters in Primary too
8
measure, and the other a progress measure. It concludes that for primary school accountability purposes the progress measure is the more relevant and effective measure.
In this paper we analyse the relative merits of the attainment measure and the progress measure promoted for adoption by primary schools. The attainment threshold does have value, not least because it has been demonstrated that high attainment at age 11 is a strong predictor of success at GCSE.8 But as with any threshold measure, it brings with it the risks of gaming and a narrow focus by teachers and those managing the school on the performance of pupils whose current performance hovers around the threshold mark.
The progress measure is not without its issues either. The most significant is the need to introduce a brand new baseline assessment of pupils in Reception from which to measure their progress at the point they take their Key Stage 2 SATs seven years later. While there have been many concerns expressed about the implications of having such an assessment, this paper concludes that it is possi-ble to effectively address and mitigate these concerns to the extent that they are outweighed by the benefits brought by a progress based accountability measure.
a. Primary school education reform in England
Much of this work has been prompted by the actions of government, which announced a series of wide-ranging reforms to the primary school education system.
The reforms are underpinned by the following key principles, which have also driven recent reforms to the secondary school education system:9 10
: Autonomy : The importance of ongoing, teacher-led assessment and the free-
dom to track pupils’ progress however schools wish
: That schools should have the freedom to make decisions about the curriculum they teach
: Accountability : That fair and transparent external testing, for accountability
purposes, is an important feature of an effective education system
8 Department for Education (2014), ‘Reforming assessment and accountability for primary schools: Government response to consultation on primary school assessment and accountability’, p. 4: www.gov.uk/government/consultations/new-national-curriculum-primary-assessment-and-ac-countability
9 Department for Education (2014), ‘Reforming assessment and accountability for primary schools: Government response to consultation on primary school assessment and accountability’, p. 4: www.gov.uk/government/consultations/new-national-curriculum-primary-assessment-and-ac-countability
10 Department for Education (2014), ‘Reforming qualifications and the curriculum to better prepare pupils for life after school’: www.gov.uk/government/policies/reforming-qualifica-tions-and-the-curriculum-to-better-prepare-pupils-for-life-after-school

Progress matters in Primary too
9
: That school performance must be understood in terms of both at-tainment (how pupils perform in assessments) and progress (how pupils perform in assessments in light of their past performance)
: That parents and the wider public should have access to a wide range of information on school performance, in order to know how well a school is doing
The key reforms include:
: A streamlined, less-prescriptive national curriculum to be taught in main-tained schools, which came into effect in September 2014, in order to provide teachers with greater freedom over their teaching. More detailed performance descriptors have also been proposed, to guide teacher assess-ment at the end of Key Stage 1 and 2, and to help inform curriculum deci-sions.11 12 These performance descriptors will be finalised in time for the 2015/16 academic year.13
: New end-of-Key-Stage assessments to come into effect from the 2015/16 academic year, removing the current system of ‘levels’ to describe bands/grades of performance. In their place, a ‘scaled score’ will be reported, with 100 signifying the expected standard and higher and lower scores denoting over- and under-performance against that standard, respectively.
: Improvements to the moderation system for teacher assessments, to im-prove consistency.
: Recognising the additional challenges faced by pupils from disadvantaged backgrounds, the coalition government introduced the pupil premium in 2011, in both primary and secondary schools. The evidence shows that, on average, these pupils perform less well than their more-advantaged peers.14 The pupil premium thus provides additional funds to schools each year, for each of their pupils that was eligible for free school meals at some point in the previous six years, or has been in care.
Given the way in which educational gaps open at a young age and widen thereafter, the per-pupil premium is higher for primary schools than it is for secondary schools, in order to help narrow the gap at an earlier stage. In line with the over-arching shift toward greater autonomy, schools are free to allocate these additional resources as they see fit. In the interest of
11 Maintained schools are those funded by the central government through local authorities. They are legally required to follow the national curriculum. Academies and free schools are not required to follow the national curriculum but must still provide a programme of education that includes English, mathematics, science and religious education.
12 The draft performance descriptors were put out for consultation in November 2014.13 Department for Education (2014), ‘Performance descriptors: Key Stages 1 and 2’: www.gov.uk/
government/consultations/performance-descriptors-key-stages-1-and-214 Department for Education (2014), ‘Pupil premium: Raising achievement of disadvantaged
pupils’, Research priorities and questions: www.gov.uk/government/collections/research-priori-ties-for-education-and-childrens-services

Progress matters in Primary too
10
higher accountability, the government is placing correspondingly greater emphasis on schools demonstrating that these additional funds are being used effectively. This is achieved through the requirement for individual schools to publish performance tables comparing disadvantaged pupils to their peers, the requirement to publish details of how the pupil premium is being spent, and greater scrutiny by Ofsted in its inspections of the use of these funds.15
It is the intention of the government that these more general reforms are to be underpinned by reform of the primary school accountability system. To achieve this, the government has announced their intention to introduce two alternate performance floor targets. These targets are:
1. Attainment: Raising the standard of achievement expected of pupils at the end of primary school so that at least 85% of a school’s pupils must achieve the new (higher) expected standards in all of reading, writing and mathe-matics.or
2. Progress: Introducing a new (voluntary) progress measure, to account for schools that may fall short by the attainment measure but nevertheless contribute greatly to the development of pupils with low attainment on en-try to primary school. Key to the implementation of the progress measure is the introduction of a formal baseline assessment of pupils in Reception.
As can be seen from these reforms, autonomy and accountability are central to the vision of a modern English education system alongside a core commitment to utilise the education system as a key progressive tool to support greater social mobility. As the next chapter will argue, it is the design of the accountability system that is critical to ensuring that schools put their increasing autonomy to good use, in order to improve outcomes for all pupils.
b. Research approach
In developing its recommendations, this research drew on a range of evidence and research methods.
The first part of the research assessed the extent to which the proposed account-ability reforms signal a more-effective set of incentives for schools with respect to the government’s defined goals of a good primary school education system. This analysis involved a comparison of the current and impending accountability measures, using actual pupil-performance data from 2013. The findings of this analysis mirror those from CentreForum’s earlier research on secondary schools: progress-based measures of school performance provide incentives to schools that are better-aligned to the government’s goals of securing the best possi-ble outcomes for all, not just some, pupils and of closing the ‘attainment gap’ 15 Department for Education (2014), ‘Pupil premium: funding for schools and alternative provision’:
www.gov.uk/pupil-premium-information-for-schools-and-alternative-provision-settings
Progress matters in Primary too
11
between disadvantaged pupils and their better-off peers.
However, any programme of reform as extensive as this carries the risk of other, possibly undesirable consequences occurring. In an effort to account for this pos-sibility, the second element of the research that we engaged in involved desk re-search and a series of interviews with key stakeholders, designed to complement and critically review the statistical analysis contained in the earlier research. Stakeholders interviewed as part of this research included teachers, academics, and other senior educationalists.
These interviews drew on the expertise of those involved directly in the sector in order to identify and gauge the extent of concerns about the impending reforms. These concerns ranged from those regarding the usefulness of the additional baseline assessment (which will be required in order to be able to construct the new progress measure), to those regarding the potential for unintended nega-tive impacts from the application of these reforms that, in themselves, have the capacity to undermine the initial goals associated with the onset of the reform process in the first place.
c. The structure of this report
To meet the challenges identified above, this report contains six further chap-ters. Chapter 2 considers, in more depth, the crucial role of accountability in the English education system and how the design of headline accountability mea-sures (which are the focus of this report) can affect school behaviour. Chapter 3 goes on to describe the impending reforms to the accountability system in more detail in order to provide context for the more targeted analysis contained in Chapters 4, 5 and 6.
Chapter 4 presents an analysis of the two new headline accountability measures and shows that the progress measure delivers a much better reflection of the qualities of a ‘good school’ (a definition very much shaped by the government of the day) than the attainment measure. This analysis is based on actual perfor-mance data on primary school pupils in 2013.
Chapter 5 considers the challenges of implementing the new baseline assess-ment at the beginning of primary school. This new assessment will form the basis of the progress measure and, while there are potential causes for concern, evi-dence suggests that these potential problems can be mitigated.
Chapter 6 evaluates the government’s decision to operate two floor standards and, in conjunction with the earlier analysis, makes the case for progress to be the more prominent headline accountability measure for schools.
The report concludes in Chapter 7 by recommending that pupil progress should be adopted by government as its principal headline accountability measure for primary schools and that the government should provide clear evidence that the baseline assessment which underpins it is valid, fair and reliable.
Progress matters in Primary too
12
: 2 Systems for holding schools to account
The previous chapter set out the background to the government’s proposed re-forms and, in turn, the motivation for this current report. This chapter sets out in more detail the role and importance of an accountability framework to promote and enforce such reforms. It goes on to illustrate the power of accountability systems to drive school behaviour and, in doing so, highlights the importance of a well-designed accountability system.
An area as important as education requires scrutiny. Both the government and the public have an interest in, and the right know about, schools’ performance. Education systems are also complex and must provide a broad programme of both academic and wider-developmental learning to a diverse body of pupils.
In its broadest sense, an accountability framework comprises the institutions and mechanisms that support the government and the public in their understand-ing of school effectiveness. This framework provides both the means to drive improvements in the system but also the necessary safeguards to intervene in underperforming schools.
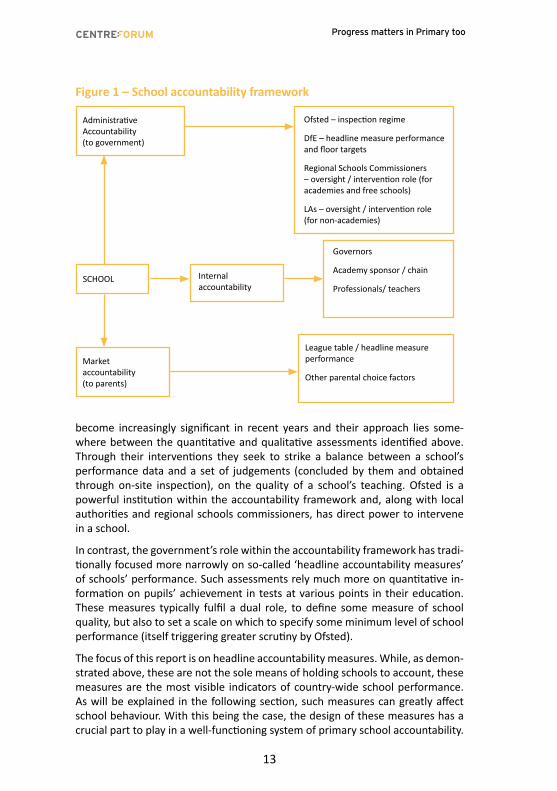
Because of the complexity of the education system, the accountability frame-work must be broad and hold schools to account on a variety of bases, to varying degrees of judgement and measurement. Differences in emphasis reflect both the differing interests of the parties involved but also the different mechanisms with which they are able to hold schools to account (see Figure 1).
No single method of assessing school’s performance can possibly capture every facet of what a school does and any single method risks being reductive and potentially controversial. For example, parents are concerned both with how a particular school performs in the league tables (which relies on quantitative, ‘hard’ measures of performance) and whether children at that school are ‘happy’ and ‘flourishing’ (qualitative judgements related to their wellbeing). Neither of these should be discounted as a valid objective of primary school provision, nor marginalised as an important factor in parents’ preferences for which school they would like their children to attend. A wide range of information is important to facilitate this.
Ofsted, local authorities, and regional school commissioners for academies, all have an important role to play in primary school accountability. Ofsted’s role has
Progress matters in Primary too
13
become increasingly significant in recent years and their approach lies some-where between the quantitative and qualitative assessments identified above. Through their interventions they seek to strike a balance between a school’s performance data and a set of judgements (concluded by them and obtained through on-site inspection), on the quality of a school’s teaching. Ofsted is a powerful institution within the accountability framework and, along with local authorities and regional schools commissioners, has direct power to intervene in a school.
In contrast, the government’s role within the accountability framework has tradi-tionally focused more narrowly on so-called ‘headline accountability measures’ of schools’ performance. Such assessments rely much more on quantitative in-formation on pupils’ achievement in tests at various points in their education. These measures typically fulfil a dual role, to define some measure of school quality, but also to set a scale on which to specify some minimum level of school performance (itself triggering greater scrutiny by Ofsted).
The focus of this report is on headline accountability measures. While, as demon-strated above, these are not the sole means of holding schools to account, these measures are the most visible indicators of country-wide school performance. As will be explained in the following section, such measures can greatly affect school behaviour. With this being the case, the design of these measures has a crucial part to play in a well-functioning system of primary school accountability.
Figure 1 – School accountability framework
Administrative Accountability (to government)
Ofsted – inspection regime
DfE – headline measure performance and floor targets
Regional Schools Commissioners – oversight / intervention role (for academies and free schools)
LAs – oversight / intervention role (for non-academies)
Governors
Academy sponsor / chain
Professionals/ teachers
League table / headline measure performance
Other parental choice factors
Internal accountability
SCHOOL
Market accountability (to parents)
Progress matters in Primary too
14
a. Accountability systems affect schools’ behaviour
As in many areas of public policy, what gets measured is generally what gets done. Performance measures create focal points, drawing attention towards cer-tain characteristics of schools, at the expense of others. The consequence is that governors, teachers and schools will tend to alter their behaviour, in order to fare better by the government’s chosen measure(s).16 17 18
As an illustration of the power of such measures, and their potential to change behaviour, consider the differing incentives faced by infant schools (for chil-dren aged 4-7) and ‘all-through’ primary schools (for children aged 4-11). These schools currently face very different incentives for pupil performance at the end of Key Stage 1 (at age 7). For infant schools, the performance of pupils at this age is a key outcome measure of school performance whereas for all-through prima-ry schools, it is the basis for an input measure.
For infant schools, the incentive is simple, to maximise the outcome Key Stage 1 scores. However, for all-through primary schools there is tension between the scores at Key Stage 1 and at Key Stage 2. This tension arises in all-through primary schools because the Key Stage 1 scores currently form the basis of ‘value-added’ and progress measures of these schools’ performance.
These measures reflect the Key Stage 2 attainment of a school’s pupils in light of their performance at Key Stage 1. Higher-performing pupils at age 7 must demonstrate correspondingly-higher performance at Key Stage 2 in order to be considered to be making ‘adequate’ progress through those school years. For this reason, the incentive to maximise Key Stage 1 scores is weaker for all-through primary schools, because doing so would make it more difficult to raise their pupils’ subsequent Key Stage 2 value-added/progress scores.
The potential conflict in incentives in Key Stage 1 scores would seem to be borne out in practice, with infant schools consistently outperforming all-through schools on these tests.19 Moreover, Ofsted notes that ‘performance at the end of Key Stage 1 often dips when infant and junior schools are amalgamated’, which
16 Hallgarten, J. (2001), ‘School league tables: Have they outlived their usefulness?’ New Economy, 8:4, pp. 189-196: onlinelibrary.wiley.com/doi/10.1111/1468-0041.00216/abstract
17 Smith, P. (1995), ‘On the unintended consequences of publishing performance data in the public sector’, International Journal of Public Administration, 18(2), pp. 277-310: www.tandfonline.com/doi/abs/10.1080/01900699508525011#.VKu4TSusVic
18 Setting targets has been shown to affect behaviour in other public services as well as education. For example, the target to reduce A&E waiting times to under 4 hours resulted in a ‘significant minority’ of clinicians feeling that ‘attempts to meet maximum waiting times targets can clash with their own clinical judgments concerning when to admit patients from waiting lists’.
The King’s Fund (2005), ‘Sustaining Reductions in Waiting Times: Identifying Successful Strategies’, p. 100: www.kingsfund.org.uk/sites/files/kf/field/field_publication_file/sustaining-reduc-tions-waiting-times-identifying-successful-strategies-appleby-boyle-devlin-harley-harrison-lo-cock-thorlby-kings-fund-1-january.pdf
19 Anwyll, S. (2014), ‘Ofquals’ role in national assessment’, Westminster Education Forum: Primary testing, assessment and accountability - baseline assessment, removing levels, and progression to secondary education, 30/01/2014: www.westminsterforumprojects.co.uk/forums/slides/Steve_Anwyll_primarytesting.pdf

Progress matters in Primary too
15
Ofsted believes to reflect unevenness in assessment practices, rather than a de-cline in standards.20
Another example of the way that specific design elements contained within a pupil performance measure can directly impact on school behaviour is the pho-nics screening check administered to pupils in year 1 (at age 6). This test is statu-tory and is a check as to whether these children have reached the expected level of competency in phonic decoding. While not used for the purposes of headline school accountability (no school-level results are published and children who do not meet the standard must simply re-sit the test in the following year), the per-centage of pupils that meet the expected standard is considered by Ofsted during an inspection.
In 2012 and 2013, the first two years in which the test was administered, there was a clear spike in the distribution of results, at the score that denoted the ex-pected standard. In these years, the score that denoted the expected standard was communicated to schools before the test was administered. In contrast, in 2014, the expected-standard score was not communicated to schools until after the tests had been carried out. In that year, the previously observed spike was no longer visible.21 This example serves to illustrate how a performance measure – even a ‘soft’ one, with no current use for high-stakes accountability – can create a focal point for school behaviour.
Whether or not such behaviours are those desired by the government, it is clear that the act of measurement affects school behaviour.
b. The purpose of an accountability system
As demonstrated above, performance measures draw attention to certain char-acteristics of schools over others, whether or not these measures are actually used to distinguish ‘good’ from ‘bad’ schools. In turn, intentionally or other-wise, these measures generate a set of incentives that drive school behaviour. Therefore, in the context of this report, effective consideration of the design of an accountability system is critical, at the very least, to protect against any pos-sible undesirable behaviour that may arise from its subsequent implementation.
The headline accountability measures in particular generate strong incentives to schools as to where they should be focusing their efforts. These serve as key signals of the criteria against which a school is judged to be performing well. This generates an incentive for schools to focus resources in areas of a primary school education that have the greatest potential to raise performance by these criteria.
20 Ofsted (2013), ‘Ofsted annual report 2012/13: Schools’, p. 13: www.ofsted.gov.uk/resources/ofst-ed-annual-report-201213-schools
21 Department for Education (2014), ‘Phonics screening check and Key Stage 1 assessments: England 2014’: www.gov.uk/government/statistics/phonics-screening-check-and-key-stage-1-assessments-england-2014
Progress matters in Primary too
16
Given that what gets measured is generally what gets done, and that headline accountability measures are the most prominent indicators of school perfor-mance, it is vital that the government’s chosen measures of school performance are well-aligned with the government’s definition of what a good primary school education is.

Progress matters in Primary too
17
: 3 The proposed accountability reforms
As explained in the introduction to this report, the government has proposed a range of reforms to the primary school education system. This chapter sets out in more detail the elements of those reforms that relate to the headline account-ability measures. This provides the context for the analysis in the chapters that follow. As the previous chapter has highlighted, the design of these measures is important, because of the power they have to influence school behaviour.
Currently, the headline indicator for primary school performance is an attainment threshold. Specifically, the percentage of a school’s cohort achieving a ‘Level 4’ in English (reading and writing) and mathematics in their Key Stage 2 assessments. Schools can avoid becoming candidates for intervention by having at least 65% of their pupils meeting these minimum standards (known as the ‘floor target’).22 The attainment measure is supplemented by an assessment of pupils’ progress from Key Stage 1 to Key Stage 2, compared to the national median.
In response to concerns that expectations for primary schools were set too low, the Department for Education published its new assessment and accountability arrangements for primary schools.23 24 The new accountability system sets out the following changes from 2016:
: Sets a higher expected standard of attainment for Key Stage 2 assessments. The exact standard has not yet been specified, but it is understood to be equivalent to a Level 4b.
: Increases the percentage threshold of pupils expected to achieve the new standard: 85% compared with 65% at present. Given current performance levels, the Department for Education rightly describes this as a ‘challenging aspiration’ but anticipates more and more schools reaching this standard over time.25
22 Chapter 4 of this report uses NPD data from 2013 when the floor target was 60%.23 Department for Education (2013), ‘Primary assessment and accountability under the new national
curriculum’: www.gov.uk/government/consultations/new-national-curriculum-primary-assess-ment-and-accountability
24 Department for Education (2014), ‘Reforming assessment and accountability for primary schools: Government response to consultation on primary school assessment and accountability’: www.gov.uk/government/consultations/new-national-curriculum-primary-assessment-and-accountabil-ity
25 Department for Education (2014), ‘Reforming assessment and accountability for primary schools: Government response to consultation on primary school assessment and accountability’, p. 5: www.gov.uk/government/consultations/new-national-curriculum-primary-assessment-and-ac-countability

Progress matters in Primary too
18
: For those schools unable to achieve the attainment floor standard, it intro-duces an additional floor standard based on the progress made by pupils from Reception to the end of primary school.26
The new progress measure should provide an ‘intake-adjusted’ measure of school performance, and measures the ‘distance travelled’ by pupils, from their starting point through to the end of primary school. A new ‘baseline assessment’, to be administered in the first half-term of Reception, will capture pupils’ starting points. Pupils’ attainment will be judged relative to the attainment of pupils with similar prior attainment from across the country.
Baseline assessments will be optional for schools but if schools wish to have a progress measure calculated to judge their performance, it must be based on an approved assessment. It is reasonable to think that most schools would choose to adopt a baseline assessment, because those that do not can only subsequent-ly be judged against the attainment floor. Indeed, as the next chapter will show, just 10% of schools in 2013 would have met the new attainment floor. For the vast majority of schools, progress will be their only option for avoiding interven-tion when the reforms come into effect.
The introduction of a dual measure is a significant change for primary account-ability systems.27 The Department for Education has advanced arguments sup-porting both aspects. In terms of attainment, it cites evidence that shows higher education attainment at primary school to be associated with higher subsequent performance at secondary school. But the Department also recognises that prog-ress measure represents ‘the fairest way to assess many schools’.28 By judging the progress of pupils with similar baseline assessment scores, the progress measure is able to strip out the effect of the prior attainment of a school’s intake, shifting the focus to how well a school does in advancing its pupils.
The Department concludes that both a threshold and a progress measure are important for understanding school performance. But raising the existing attain-ment threshold is presented as the most prominent and pressing headline ac-countability measure.
From 2016, in order to be above the floor standard, a school must either:
: Have at least 85% of its pupils meeting the required standards in English and mathematics;
: Or have its pupils make sufficient progress in English and mathematics by achieving at least the national average for pupils of similar prior attainment.
26 While the vast majority of schools are now all-through primaries, different accountability arrange-ments will apply for standalone infant and junior schools.
27 In contrast, from 2016, secondary school accountability will be judged by a single progress-based measure (‘Progress 8’).
28 Department for Education (2014), ‘Reforming assessment and accountability for primary schools: Government response to consultation on primary school assessment and accountability’, p. 10: www.gov.uk/government/consultations/new-national-curriculum-primary-assessment-and-ac-countability
Progress matters in Primary too
19
Baseline assessment
The government is currently in the process of procuring these baseline assess-ments from potential providers. Schools will be able to choose from a range of approved baseline assessments from a number of providers. The different base-line assessments will offer different formats, content and adaptive elements.
Schools will first have access to a baseline assessment from 2015 but it will only be mandatory for any school wishing to be measured on progress from 2016. Consequently, the first year in which the new progress measure will be available is 2022 and it will be employed for the progress floor target from 2023. Until then, the existing progress measure (from Key Stage 1 to Key Stage 2) will remain.
The Department for Education’s Standards and Testing Agency has published guidance to bidders for the contracts to provide baseline assessments (see Box 1). The guidance summarises the challenges of delivering a formal assessment to very young children for the purposes of high stakes accountability.
Box 1: Summary of key points in the Standards and Testing Agency baseline assessment specification29
Content
The assessment must have an age-appropriate content domain that is suit-able for the range of children’s attainment at the start of Reception. The clear majority of the content must be linked to the learning and development re-quirements of the communication and language, literacy and mathematics areas of learning from the EYFS, appropriate for children’s age and experi-ence at the start of Reception and must demonstrate a clear progression towards the Key Stage 1 national curriculum in English and mathematics.
Administration
The assessment must be accessible to at least 99% of children and be avail-able in suitable modified formats for children with SEN and disabilities. For-mal monitoring will be undertaken by the Department for Education, but providers must also undertake external monitoring of schools to quality as-sure the data they provide.
Scoring
Each assessment item must require a single, objective, binary decision to be made by the scorer: this may be based on observation. The assessment must report a score for each child on a single scale. The scores must not be age-standardised.
29 Standards and Testing Agency (2014), ‘Reception baseline: Criteria for potential assessments’: www.gov.uk/government/uploads/system/uploads/attachment_data/file/359832/Baseline_criteria.pdf

Progress matters in Primary too
20
Reliability
The assessment must produce consistent results both across similar ability children and regardless of who is administering and scoring the assessment, demonstrate internal consistency, and ensure the minimisation of confi-dence intervals across the reporting scale.
Minimising bias
The assessment must not unduly discriminate against sub-groups of the population such as gender, ethnicity, disability, and a particular focus should be given to ensuring that the progress measure is not unduly beneficial to schools with high proportions of EAL children.
The Department’s guidance intends to ensure equivalence across all of the ap-proved baseline assessments. To further safeguard the reliability of the progress measure, children taking each approved baseline assessment will be treated as separate cohorts and the progress they have made between starting Reception and age 11 will only be calculated using the results for pupils who took the same baseline test. To enable a useful comparison, a minimum take up has been speci-fied: at least 10% of schools overall, plus a sufficient distribution across the range of different value added performance.
Taken together these reforms represent an ambitious and laudable initiative by the coalition government to clarify the primary school accountability framework and to align it more effectively with its promotion of the social mobility agenda. It also has the potential to drive greater consistency in application and outcome for pupils from the onset of reception in primary school to the completion of GCSE in secondary school.
Given, however, their scope and ambition, it is not surprising that some of the elements contained within the proposed reforms are seen as controversial. Most contested is the development of the baseline measure that will be necessary if an effective progress measure is to be implemented. Adjunct proposals allowing the development of multiple baseline measures delivered by a range of different providers have increased the levels of concern. We return therefore to a detailed analysis of the baseline measure proposals in chapter 5 of this report.
Progress matters in Primary too
21
: 4 The new accountability measures
As set out in the previous chapter, the proposed reforms specify two floor stan-dards. Schools must satisfy at least one of them in order to avoid intervention:
1. Attainment: At least 85% of a school’s pupils must achieve the new (higher) expected standards in all of reading, writing and mathematics
2. Progress: A school’s pupils must make satisfactory progress at Key Stage 2, in light of their starting points at the beginning of primary school
This chapter presents an assessment of the proposed headline accountability measures. Mirroring the approach in CentreForum’s earlier research on account-ability measures in secondary schools, the analysis first assesses the measures against the government’s two core goals:30
: To secure the best outcomes for all, not just some, pupils
: To ‘close the gap’ between pupils from disadvantaged backgrounds and the rest
Using actual data on pupils’ test results to illustrate how the new system might operate in practice, the analysis identifies the potential for the attainment mea-sure to drive school behaviours that are in conflict with the above goals. This is in line with the problems identified in such a measure for secondary schools.
The analysis considers the progress measure to be a much fairer measure of school performance, because it is better able to distinguish the impact of a school from circumstances that are beyond its control. In particular, the progress measure is better able to account for the prior attainment of a school’s intake. The attainment measure, by contrast, does not separate the two, placing schools with lower-attaining intakes at an inherent and unfair disadvantage.
Moreover, the analysis goes on to show that, at least in the short term, the at-tainment floor will be highly challenging for the vast majority of schools such that the progress measure is likely to be the dominant and thus more important of the two standards. As such, while the aspiration embodied in the attainment
30 Paterson, C. (2013), ‘Measuring what matters: Secondary school accountability indicators that benefit all’, CentreForum: www.centreforum.org/index.php/mainpublications/512-measur-ing-what-matters

Progress matters in Primary too
22
measure is certainly admirable, it is the progress measure that should be empha-sised by the government.
a. Approach
Using an extract from the UK National Pupil Database (NPD), the analysis calcu-lated the performance of each school in England by each of the two accountabil-ity measures.31 The NPD extract contained test results for all pupils in state-fund-ed schools in England that were eligible to sit the Key Stage 2 tests in summer 2013.32 In this way, the analysis provides an illustration and assessment of the proposed reforms using real pupil test data i.e. it simulates the proposed ac-countability regime, had it been in effect in 2013.
The progress measure requires some assessment of pupils’ prior attainment. For this purpose, where available, the analysis made use of pupils’ corresponding scores from their EYFSP assessments from their first year of primary school (the 2006/07 academic year).33 These EYFSP assessments formed the basis for the progress measure that was constructed for the analysis, as a proxy for the one that will come into effect in the future (using the new baseline assessment).
For the actual progress measure, the government has opted to commission a new baseline assessment to be administered in pupils’ first half-term of Reception. This is preferred to the EYFSP because the new baseline assessment will enable a measure that captures pupil progress from the beginning to the end of primary school. In contrast, the EYFSP assessment takes place at the end of the first year; a progress measure constructed using this information would fail to capture the impact of the school in that first year. Moreover, the new baseline assessment is designed specifically for use in a high-stakes accountability measure. The EYFSP was not intended to be used in this way and cannot be guaranteed to be so fit for this purpose. In the absence of pupil data by the baseline assessment (because it has not yet been adopted), the analysis uses the EYFSP as the closest comparable existing assessment to the forthcoming baseline assessment.
In summer 2013, some 534,100 pupils, in 15,500 state-funded schools, sat the Key Stage 2 tests that mark the end of primary school in England. Of those pupils, around 98,100 (18%) came from disadvantaged backgrounds, as measured by their eligibility for Free School Meals (FSM).
The attainment measure
Barring the increase in expected standards, the new attainment measure is similar to the old one, comprising a set of performance standards expected of pupils, with schools then judged on the proportion of their pupils that meet
31 Department for Education, ‘National Pupil Database’: www.gov.uk/government/collections/na-tional-pupil-database
32 At the time of writing, this was the most recent year for which final (rather than provisional) NPD data were available.
33 There were just over 41,000 pupils without a corresponding set of EYFSP scores, accounting for less than 8% of the cohort. This should not have any significant bearing on the final results.
Progress matters in Primary too
23
those standards. The new expected standards are expected to be equivalent to a ‘level 4b’ in each of reading, writing and mathematics under the existing national curriculum.34 Because of this correspondence, with the exception of the teacher assessment in writing, it is possible to identify pupils in the dataset that were already performing at the equivalent of the new expected standard in 2013. This forms the basis of the attainment measure used in this analysis.
The dataset does not distinguish a level 4 from a level 4b in writing and the anal-ysis assumes that a level 4 remains the expected standard in writing from 2016 onwards. This does not materially affect the assessment that follows of the rel-ative merits of the attainment and progress measures. It may, however, have some bearing on the application of the attainment measure in any comparison between schools (as well as against the 85% threshold). Where this may matter, it is noted in the presentation of the results that follows.
This detail aside, we are able to construct an attainment measure for schools that closely resembles the one that will be in effect from 2016 onwards.
The progress measure
A progress measure gives some sense of the ‘distance travelled’ by a pupil from a given starting point to a given end point. Under the new measure, the starting point is at pupil’s entry to primary school and the end point is when they leave to go on to secondary school.
The outcome measure is pupil performance in the Key Stage 2 assessments. In line with the method to calculate primary school value added (from Key Stage 1 to 2), this outcome measure is the average ‘fine grade score’ in mathematics and English (which is, in turn, the average of the reading and writing assessments).35 36
As mentioned above, the principal complication in the construction of the new progress measure is the fact that the government’s chosen measure of prior attainment, the baseline assessment, is not yet in operation. For the purpos-es of this analysis, it is necessary to construct an approximation to the baseline assessment.
In its requirements for an appropriate baseline assessment, the Department for Education has stated that the ‘clear majority of the content domain must be clearly linked to the learning and development requirements of the communica-tion and language, literacy and mathematics areas of learning from the EYFS’.37 34 Department for Education (2014), ‘New national curriculum: primary assessment and account-
ability’: www.gov.uk/government/consultations/new-national-curriculum-primary-assess-ment-and-accountability
35 The equivalents to the existing national-curriculum system of levels can be found here: www.education.gov.uk/schools/performance/primary_14/Average_level_per_pupil.docx
36 Department for Education (2013), ‘A guide to value added Key Stage 1 to 2 in 2013 school per-formance tables’: www.education.gov.uk/schools/performance/primary_13/KS1-2_Value_Add-ed_Guide_2013.pdf
37 Standards and Testing Agency (2014), ‘Reception baseline: Criteria for potential assessments’, p. 1: www.gov.uk/government/uploads/system/uploads/attachment_data/file/359832/Baseline_cri-teria.pdf

Progress matters in Primary too
24
On this basis, the prior-attainment measure used in the analysis has been con-structed as the average score of the following EYFSP learning areas:38
: Communication, Language and Literacy
: Problem Solving, Reasoning and Numeracy (covering the mathematics component of the assessment)
The EYFSP assessment is conducted at the end of the Reception year and thus yields a measure of progress from Year 1 to Year 6. The use of the EYFSP assess-ment is suitable in this analysis for the purpose of comparing the two account-ability measures though, as mentioned previously, the government’s preferred progress measure will use the new baseline assessment to gauge the impact of a school over the entirety of the education it provides i.e. from the start to the end of primary school.
Progress measures are predicated on the idea that a pupil’s prior attainment gives some indication of their likely future attainment. With this, it is possible to form some estimate of a pupil’s likely future performance, based on that prior attainment.39 The calculation of these estimates is as follows:
1. Group pupils into bands of similar prior attainment
2. For each group of pupils, calculate the average of their Key Stage 2 scores (as set out above)
The averages calculated by this method are taken as the estimates of each group’s likely future performance. From this, the progress measure is calculated as the difference between each pupil’s actual Key Stage 2 result and the average for their prior-attainment group. Individual pupils’ progress is thus an indicator of how they have performed compared to others with similar starting points. The school-level progress measure is simply the average of the progress of its pupils.
In the analysis that follows, the scores are reported as per the calculation above, plus 100. A school with a progress measure greater than 100 is one in which pupils tend to make more progress than the national average. Conversely, a school with a progress measure less than 100 is one in which pupils tend to make less progress.40 This is consistent with the presentation of existing value-added scores for schools though the government has yet to announce precisely how the
38 Each of these learning areas consists of a set of underlying assessments. These assessments were averaged to give a score for each of the two learning areas. The two learning-area scores were then averaged to give the final prior-attainment measure.
39 Department for Education (2013), ‘A guide to value added Key Stage 1 to 2 in 2013 school per-formance tables’: www.education.gov.uk/schools/performance/primary_13/KS1-2_Value_Add-ed_Guide_2013.pdf
40 Cohorts tend to be smaller in primary schools than in secondary schools, which does raise some operational concerns about interpreting potentially-large fluctuations in school performance from year to year. However, it is not clear that these problems are any greater (or smaller) by a progress measure than by the existing attainment measure.
Progress matters in Primary too
25
new progress scores will be reported.41
b. Criteria for assessing the headline accountability measures
The coalition government’s stated goals of the education system are:
: To secure the best outcomes for all, not just some, pupils
: To ‘close the gap’ between pupils from disadvantaged backgrounds and the rest
CentreForum’s previous analysis of accountability measures in secondary schools found attainment measures to be poorly aligned with these goals, recommend-ing progress measures as the preferred alternative.42 In particular, that earlier analysis found that attainment measures had the potential to encourage an em-phasis on some pupils over others. The pupils that secondary schools were more likely to focus on were those nearest the threshold between a C and a D grade at GCSE (the proposed attainment measure was based on the percentage of pupils achieving A*-C grades in English and mathematics at GCSE). Such a focus would be to the detriment of both high- and low-performing pupils. High-performing pupils are more likely to meet the threshold anyway while low-performing pupils would likely require a great deal of attention to meet the target. This conflicts with the first goal. The secondary school attainment measure also conflicted with the second goal in the sense that the lowest-attaining pupils were also more likely to have come from disadvantaged backgrounds. Less focus on low attainers coincides with less focus on pupils from disadvantaged backgrounds, with the risk that such incentives might perpetuate, if not widen, the gap.
A further finding of that earlier research was that attainment measures put schools with low-attaining intakes at an inherent disadvantage, because pupils in these schools were less likely to meet the attainment threshold. In contrast, schools with high-attaining intakes had greater potential to ‘coast’ because their pupils were predisposed to performing better, whether or not the school did well to maximise their outcomes.43 In the case of secondary schools, holding schools to account on attainment risked holding them to account for circumstances beyond their control.
41 In the existing value-added measures, a further adjustment is made to account for schools with small cohort sizes. For simplicity of exposition, this further step is not carried out in the analysis that follows. Instead, the analysis in the following section only considers schools where there are at least ten pupils with a progress score. This reduces the number of schools in the analysis from 15,459 to 13,324. The exclusion of these schools with small cohorts does not affect the conclu-sions from the analysis.
42 Paterson, C. (2013), ‘Measuring what matters: Secondary school accountability indicators that benefit all’, CentreForum: www.centreforum.org/index.php/mainpublications/512-measur-ing-what-matters
43 Paterson, C. (2013), ‘Measuring what matters: Secondary school accountability indicators that benefit all’, CentreForum: www.centreforum.org/index.php/mainpublications/512-measur-ing-what-matters
Progress matters in Primary too
26
The analysis in the next section assesses the primary school accountability mea-sures in a similar way, to identify whether the measures might suffer the same problems of:
: Encouraging a narrow focus on some pupils over others (and whether this might be to the particular detriment of pupils from disadvantaged backgrounds)
: Holding schools to account at least in part for circumstances beyond their control i.e. whether the measures might be unfair
In order to assess the first of these, the analysis considers whether there might be any incentive in either of the measures for schools to focus narrowly on some pupils over others (conflicting with the first of the government’s goals), and whether this incentive might simultaneously discourage schools from improving the outcomes of pupils from disadvantaged backgrounds (conflicting with the second goal).
The analysis then goes on to consider the fairness of the two measures i.e. whether either of the measures might put some schools at an inherent disadvan-tage because they have intakes of lower-attaining pupils, making it more difficult to meet one or other of the accountability measures.
c. Assessment of the headline accountability measures
Alignment with the government’s core goals
This first part of the analysis assesses the alignment between the headline mea-sures and the government’s stated core goals of the education system (to im-prove outcomes for all and to close the gap). In order to do this, the 2013 cohort of pupils from the NPD has been divided into deciles based on their prior attain-ment, as measured by their EYFSP scores. This was the measure used as a proxy for the forthcoming baseline assessment.
By the progress measure, the incentive to improve pupil outcomes is distributed evenly across the class. There is no particular reason why a school should focus on one pupil over another because the same amount of improvement with each (regardless of their respective starting points) should lead to a similar increase in the school’s progress-based performance.44
Figure 2 shows that the pattern of incentives is not so even by the attainment measure. The chart shows, for each decile of prior attainment, the change in the percentage of pupils that would be at the new expected standards following a given change in their scores in reading, writing and mathematics.45 Figure 2 shows this for both an increase and a decrease in scores.
44 Under the assumption that such an improvement involves a similar amount of effort on the part of the school at each level of pupils’ ability.
45 The size of the difference is equivalent to the difference in points between the current and new expected standards. This same points difference was applied to pupils in all deciles.
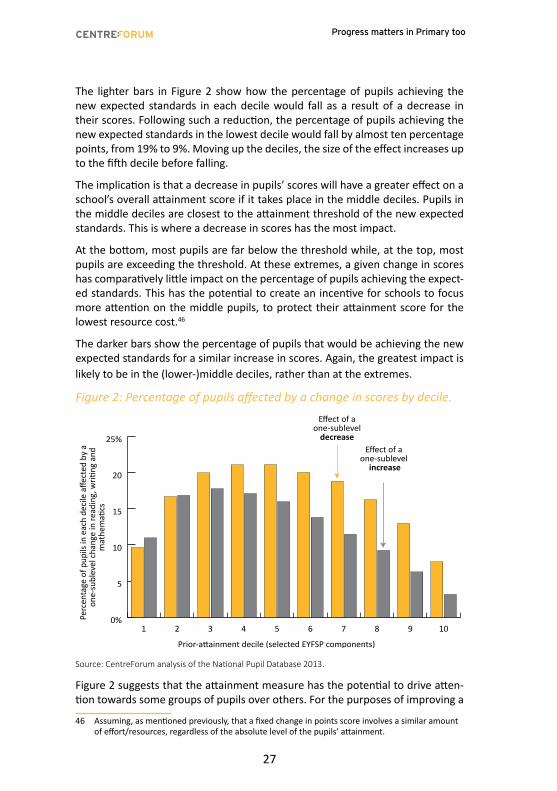
Progress matters in Primary too
27
The lighter bars in Figure 2 show how the percentage of pupils achieving the new expected standards in each decile would fall as a result of a decrease in their scores. Following such a reduction, the percentage of pupils achieving the new expected standards in the lowest decile would fall by almost ten percentage points, from 19% to 9%. Moving up the deciles, the size of the effect increases up to the fifth decile before falling.
The implication is that a decrease in pupils’ scores will have a greater effect on a school’s overall attainment score if it takes place in the middle deciles. Pupils in the middle deciles are closest to the attainment threshold of the new expected standards. This is where a decrease in scores has the most impact.
At the bottom, most pupils are far below the threshold while, at the top, most pupils are exceeding the threshold. At these extremes, a given change in scores has comparatively little impact on the percentage of pupils achieving the expect-ed standards. This has the potential to create an incentive for schools to focus more attention on the middle pupils, to protect their attainment score for the lowest resource cost.46
The darker bars show the percentage of pupils that would be achieving the new expected standards for a similar increase in scores. Again, the greatest impact is likely to be in the (lower-)middle deciles, rather than at the extremes.
Figure 2: Percentage of pupils affected by a change in scores by decile.
Perc
enta
ge o
f pup
ils in
eac
h de
cile
affe
cted
by
a on
e-su
blev
el c
hang
e in
read
ing,
writi
ng a
nd
mat
hem
atics
Prior-attainment decile (selected EYFSP components)
Effect of a one-sublevel
decreaseEffect of a
one-sublevel increase
0%
5
10
15
20
25%Plus
Minus
10987654321
Source: CentreForum analysis of the National Pupil Database 2013.
Figure 2 suggests that the attainment measure has the potential to drive atten-tion towards some groups of pupils over others. For the purposes of improving a
46 Assuming, as mentioned previously, that a fixed change in points score involves a similar amount of effort/resources, regardless of the absolute level of the pupils’ attainment.

Progress matters in Primary too
28
school’s attainment measure, the most effective use of resources is to focus on the middle and lower-middle deciles, to the detriment of those at the extremes: those in the very-lowest decile and those in the upper deciles. This is in conflict with the first goal.
In order to assess the measures against the second core goal, it is necessary to assess the extent to which that distinction between the some and the others coincides with the distinction between advantaged and disadvantaged pupils. If the two distinctions do coincide, then the attainment measure simultaneously serves to perpetuate the attainment gap.
A pupil’s eligibility for Free School Meals is a common measure of disadvantage and it is the measure that we selected to differentiate disadvantage in this re-search. In 2013, 18% of the cohort was eligible for Free School Meals and Figure 3 shows how much that rate varies by decile.
Figure 3 shows that pupils with low prior attainment are much more likely to come from disadvantaged backgrounds. In the very lowest decile, the incidence of disadvantage is twice the national average. In contrast, just 7% of the highest prior attainers come from disadvantaged backgrounds (just over one-third of the national average). Low prior attainment is associated with higher disadvantage.
Figure 3 Percentage of pupils eligible for Free School Meals by prior-at-tainment decile
Perc
enta
ge o
f FSM
pup
ils
Prior-attainment decile (selected EYFSP components)
0%
5
10
15
20%
25
30
35
40%FSM
10987654321
National average (18%)
Source: CentreForum analysis of the National Pupil Database 2013.
Together, Figure 2 and Figure 3 give an indication of whether the potential in-centives by the attainment measure might draw attention away from more-dis-advantaged groups. Figure 2 suggested that if there is an incentive for schools

Progress matters in Primary too
29
to focus more narrowly on some pupils over others, that it was the pupils in the lower and middle deciles that would likely benefit most. Some of these deciles have relatively high levels of disadvantage such that there may in fact be some incentive for schools to focus in a way that may close the gap between at least some disadvantaged pupils and the rest (this contrasts with the progress mea-sure, which places no particular emphasis on one group over another, whether by prior attainment or disadvantage). Of concern, however, is the lack of incen-tive to focus on the bottom decile of prior attainment. Almost 40% of these pupils come from disadvantaged backgrounds and there would seem to be relatively little to be gained from schools attempting to improve outcomes for these pupils.
Fairness of the measures
This part of the analysis considers the fairness of the two measures. In order to judge this, we define a good accountability measure as one that reflects the performance of all pupils in a school, rather than particular groups of pupils over others. The progress measure does this by definition: any pupil that makes rel-atively quicker progress will help to raise a school’s score, while any pupil that makes relatively slower progress has a negative impact on a school’s score.
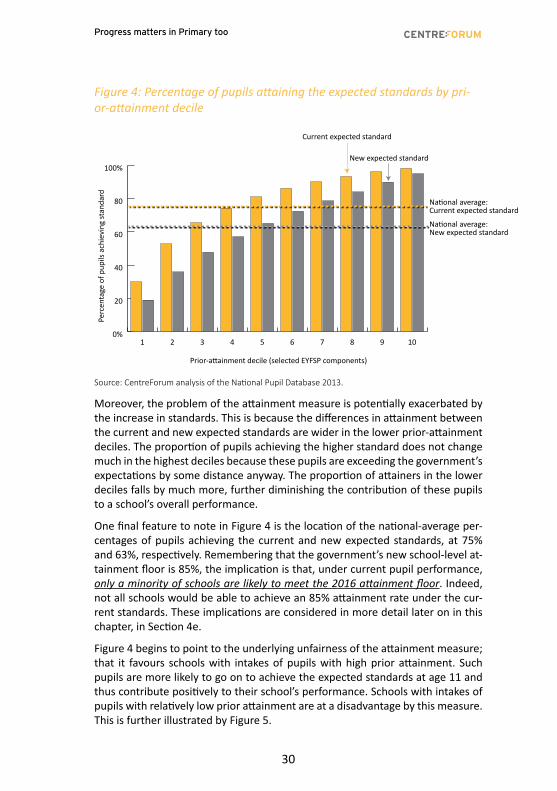
This is not necessarily the case by the attainment measure, as the performance of pupils is judged relative to a single threshold. By such a measure, pupils may or may not contribute to a school’s performance, depending on their level of attainment. Figure 4 shows this to be the case, by presenting the percentage of pupils in each prior-attainment decile in 2013 that achieved the current expected standard and the percentage that would have achieved the new expected stan-dard.47 The lighter bars show, for each decile of prior attainment, the percentage of pupils in that decile that achieved the current expected standards, while the darker bars show the percentage that would have achieved the new expected standards.
Figure 4 shows a clear relationship between pupils’ prior attainment and their subsequent Key Stage 2 performance. Pupils with high prior attainment on entry to primary school are much more likely to contribute to a school’s ranking than those with low prior attainment (higher proportions of them do so). This find-ing is consistent with CentreForum’s earlier research into secondary school ac-countability measures and is the case under both the current and new expected standards.48
47 The percentages of pupils achieving the new expected standard may be somewhat lower with the inclusion of a higher standard in writing, but this is not identifiable in the dataset for the reasons explained earlier in this chapter.
48 Paterson, C. (2013), ‘Measuring what matters: Secondary school accountability indicators that benefit all’, CentreForum: www.centreforum.org/index.php/mainpublications/512-measur-ing-what-matters
Progress matters in Primary too
30
Figure 4: Percentage of pupils attaining the expected standards by pri-or-attainment decile
0%
20
40
60
80
100%L4b
L4
10987654321
Perc
enta
ge o
f pup
ils a
chie
ving
stan
dard
Prior-attainment decile (selected EYFSP components)
Current expected standard
New expected standard
National average:Current expected standard
National average:New expected standard
Source: CentreForum analysis of the National Pupil Database 2013.
Moreover, the problem of the attainment measure is potentially exacerbated by the increase in standards. This is because the differences in attainment between the current and new expected standards are wider in the lower prior-attainment deciles. The proportion of pupils achieving the higher standard does not change much in the highest deciles because these pupils are exceeding the government’s expectations by some distance anyway. The proportion of attainers in the lower deciles falls by much more, further diminishing the contribution of these pupils to a school’s overall performance.
One final feature to note in Figure 4 is the location of the national-average per-centages of pupils achieving the current and new expected standards, at 75% and 63%, respectively. Remembering that the government’s new school-level at-tainment floor is 85%, the implication is that, under current pupil performance, only a minority of schools are likely to meet the 2016 attainment floor. Indeed, not all schools would be able to achieve an 85% attainment rate under the cur-rent standards. These implications are considered in more detail later on in this chapter, in Section 4e.
Figure 4 begins to point to the underlying unfairness of the attainment measure; that it favours schools with intakes of pupils with high prior attainment. Such pupils are more likely to go on to achieve the expected standards at age 11 and thus contribute positively to their school’s performance. Schools with intakes of pupils with relatively low prior attainment are at a disadvantage by this measure. This is further illustrated by Figure 5.
Progress matters in Primary too
31
Figure 5: Relationship between average prior attainment and school performance by the attainment measure
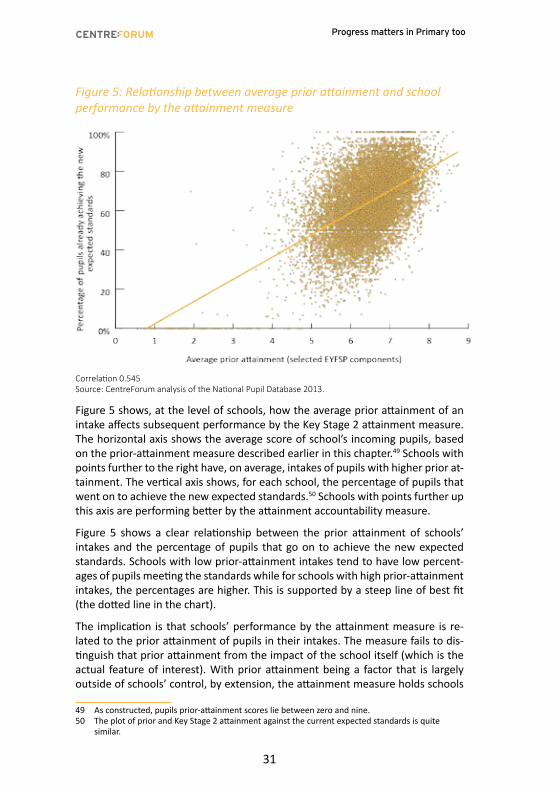
Correlation 0.545Source: CentreForum analysis of the National Pupil Database 2013.
Figure 5 shows, at the level of schools, how the average prior attainment of an intake affects subsequent performance by the Key Stage 2 attainment measure. The horizontal axis shows the average score of school’s incoming pupils, based on the prior-attainment measure described earlier in this chapter.49 Schools with points further to the right have, on average, intakes of pupils with higher prior at-tainment. The vertical axis shows, for each school, the percentage of pupils that went on to achieve the new expected standards.50 Schools with points further up this axis are performing better by the attainment accountability measure.
Figure 5 shows a clear relationship between the prior attainment of schools’ intakes and the percentage of pupils that go on to achieve the new expected standards. Schools with low prior-attainment intakes tend to have low percent-ages of pupils meeting the standards while for schools with high prior-attainment intakes, the percentages are higher. This is supported by a steep line of best fit (the dotted line in the chart).
The implication is that schools’ performance by the attainment measure is re-lated to the prior attainment of pupils in their intakes. The measure fails to dis-tinguish that prior attainment from the impact of the school itself (which is the actual feature of interest). With prior attainment being a factor that is largely outside of schools’ control, by extension, the attainment measure holds schools
49 As constructed, pupils prior-attainment scores lie between zero and nine.50 The plot of prior and Key Stage 2 attainment against the current expected standards is quite
similar.
Progress matters in Primary too
32
to account for at least some circumstances that are beyond their control. A flatter line of best fit is more desirable, as it would show a weaker relationship between prior and subsequent attainment, better isolating schools’ relative performance.
In line with the findings of the pupil-level assessment in Figure 4, schools with low prior-attainment intakes are at a clear and inherent disadvantage by the at-tainment measure. In contrast, schools that ‘inherit’ intakes of higher prior at-tainment are predisposed to performing better, because more of their pupils will contribute to the final performance measure.
A fairer accountability measure is one that does not reflect prior attainment so strongly, so as not to unfairly penalise schools with more struggling pupils. These struggling pupils are much less likely to contribute to a school’s performance by the attainment measure. The progress measure does not suffer from the same problems because all pupils in a school count towards it, and do so equally. In this way, the progress measure is a fairer way of holding schools to account.
By the progress measure, any pupil that makes below-average progress for their prior-attainment group drags down the school’s score, irrespective of that pu-pil’s prior attainment. This is quite different to the attainment measure, by which a pupil can make below-average progress but still contribute to a school’s at-tainment performance if they still perform at a high enough level to be above the threshold. This is at odds with the goal of securing the best outcomes for all pupils and highlights the potential for schools to continue to ‘coast’ under the attainment standard. In such schools, not all pupils would be fulfilling their potential.
Figure 6 shows a similar plot to that of Figure 5, with the average prior-attain-ment score of each school’s intake on the horizontal axis, and each school’s cor-responding performance by the progress measure on the vertical axis. Figure 6 shows the association between prior attainment and the progress measure to be much weaker than for the attainment measure. As the much flatter line of best fit shows, a school with low average prior attainment has a similar chance of performing well as a school with high average prior attainment.
A progress measure therefore better isolates the impact of the school from the prior attainment of its intake and is thus much less biased against schools with low prior-attainment intakes. Schools with low prior-attainment intakes can still perform well, by improving outcomes for their pupils, regardless of those pupils’ starting points. In this way, a progress measure is a much fairer reflection of what a good school does.
Because low prior attainment is closely associated with levels of disadvantage, the differences in the levels of fairness of the two measures can also be seen in an analysis of the relationship between performance and levels of disadvantage, as shown in Figures 7 and 8.
Figure 7 plots, for each school, the percentage of pupils that are eligible for Free School Meals against the percentage of pupils achieving the new expected

Progress matters in Primary too
33
Figure 6 Relationship between average prior attainment and school performance by the progress measure
Correlation 0.074Source: CentreForum analysis of the National Pupil Database 2013.
standard (i.e. school performance by the attainment measure).51 The chart shows a clear inverse relationship between the proportion of pupils from disadvantaged backgrounds and a school’s performance by the attainment measure. Higher levels of disadvantage are associated with lower school performance, reflecting the way in which disadvantaged pupils also tend to be of lower prior attainment. Consequently, the attainment measure penalises schools for two features that are beyond their control but also closely related: low prior attainment and high levels of disadvantage. Such schools are at an inherent disadvantage by the at-tainment measure.
51 As with the previous analysis by prior attainment decile, the results are similar for the current attainment standard.
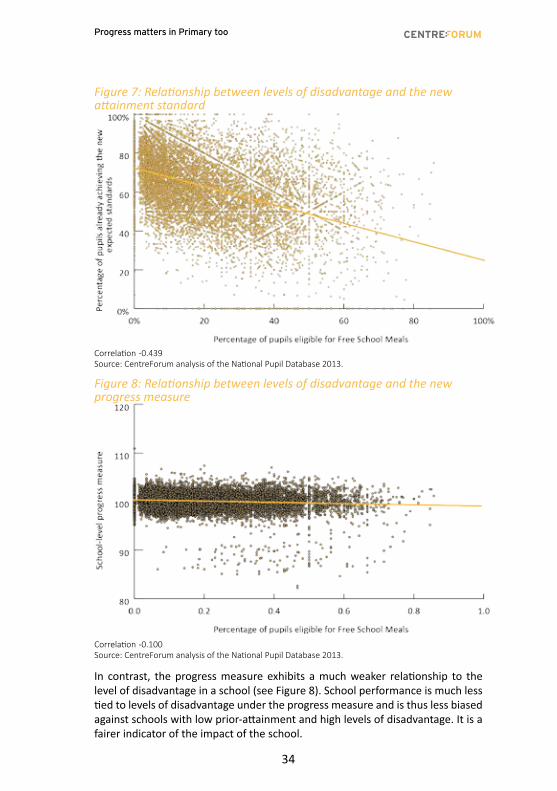
Progress matters in Primary too
34
Figure 7: Relationship between levels of disadvantage and the new attainment standard
Correlation -0.439Source: CentreForum analysis of the National Pupil Database 2013.
Figure 8: Relationship between levels of disadvantage and the new progress measure
Correlation -0.100Source: CentreForum analysis of the National Pupil Database 2013.
In contrast, the progress measure exhibits a much weaker relationship to the level of disadvantage in a school (see Figure 8). School performance is much less tied to levels of disadvantage under the progress measure and is thus less biased against schools with low prior-attainment and high levels of disadvantage. It is a fairer indicator of the impact of the school.
Progress matters in Primary too
35
The progress measure is fairer than the attainment measure
The analysis above demonstrates the failings of the forthcoming primary school attainment measure. These are the same problems inherent to the current at-tainment measure and also mirror those previously identified in the correspond-ing secondary school measure (which is to be dispensed with from 2016).52 CentreForum’s previous research showed attainment to be inappropriate as a headline accountability measure for secondary schools, given the government’s goals, and the research in this report shows similar problems with the proposed attainment measure in primary schools.
The problem with the attainment measure is that it risks encouraging behaviours that lead to a focus on some, rather than all, pupils. The presence of one or more expected standards automatically leads to some pupils being closer to the threshold(s) than others. This means that, for a given amount of resource, a school is better off focusing on the pupils nearest the thresholds, where there is the greatest potential return in terms of improved school performance. The at-tainment measure does not align well with the government’s first goal, to secure the best outcomes for all pupils. The structure of the incentives is such that it discourages a focus on the lowest and highest attainers. While this does not appear to be to the detriment of all pupils from disadvantaged backgrounds, it is possible that the very lowest-attaining pupils (who are most likely to come from disadvantaged backgrounds) would suffer most. There is evidence of potential conflict with the government’s second goal.
In contrast, the progress measure does not suffer from these problems. It places equal weight on all pupils’ outcomes, with no reference to a target standard of attainment. As a consequence, the progress measure reflects the contributions of all pupils to a school’s performance, generating a set of incentives that are evenly distributed across those pupils. To that extent, the progress measure nei-ther discourages nor encourages a focus on disadvantaged pupils, such that it has the potential to be a balanced indicator from the point of view of ‘closing the gap’.
A further problem of the attainment measure is that it fails to distinguish the performance of a school from the performance of its pupils. In failing to do so, the measure holds schools to account based, at least in part, on circumstances beyond their control. In particular, schools with intakes of pupils of low prior attainment and/or from disadvantaged backgrounds are heavily penalised. The attainment measure is less able to recognise improvements in outcomes among low attainers, such that not all pupils’ performance contributes to a school’s scores. For this reason, the attainment measure is a poorer reflection of what a good school does.
52 Paterson, C. (2013), ‘Measuring what matters: Secondary school accountability indicators that benefit all’, CentreForum: www.centreforum.org/index.php/mainpublications/512-measur-ing-what-matters

Progress matters in Primary too
36
d. An example league table
This section presents an example of how the attainment and progress measures affect the rankings in a group of actual schools in England.
Table 1 shows the rankings of the 20 largest primary schools (by Year 6 cohort size) in a local authority in England.53 The LA in question has very similar char-acteristics to England as a whole in terms of the percentage of pupils attaining the current and expected standards, and the percentage eligible for Free School Meals.
Table 1 shows, on the left-hand side, the ranking of schools by the attainment measure, alongside the percentage of pupils in each school achieving what are expected to be the new expected standards (equivalent to a level 4b under the pre-reform curriculum). The right-hand side of the table does the same by the progress measure, alongside the school’s progress score. On both sides, the table also reports the percentile each school lies in, within the national cohort, as well as the percentage of FSM pupils and pupils’ average prior attainment. This pro-vides additional contextual information about each school’s circumstances.
The shortcomings of the attainment measure, highlighted earlier in this chapter, are evident. With few exceptions, high-placed attainment schools tend to have intakes of pupils with high average prior attainment (average scores of seven or more, where nine is the maximum score) and low numbers of FSM pupils (below the national average, at 15% or less). At the bottom of this side of the table, low-performing schools are generally characterised as having lower average prior attainment (of closer to six points) and higher proportions of pupils from disad-vantaged backgrounds (as high as two in five pupils).
The left-hand side of Table 1 exemplifies the problems inherent in the attainment measure. The right-hand side of the table shows the relative merits of the prog-ress measure. By this ranking, the spread of prior-attainment scores is more even reading down the table, indicating the greater fairness of the progress measure with respect to the prior attainment of schools’ intakes. Indeed, the Ivy School, which has the highest prior attainment of the 20 schools, is ranked bottom by progress. This is because, despite its high prior-attainment intake, and relatively low levels of disadvantage, this school is poor at advancing its pupils’ outcomes compared to St. John’s or King’s School, for example, which achieve similar at-tainment percentages, but with lower prior-attainment intakes. Accordingly, these two schools perform better by the progress measure, as they should in an accountability system that reflects the government’s core goals.
The Ivy School is an example of a school that is coasting on its high-attaining intake. At the very least, average progress is always possible (as it is based on the actual average performance of pupils of similar prior attainment). For this school, this would equate to its pupils achieving a score (averaged across English and mathematics) that is just above the threshold for a ‘level 5’ under the existing 53 The average cohort size of these 20 schools is 63.
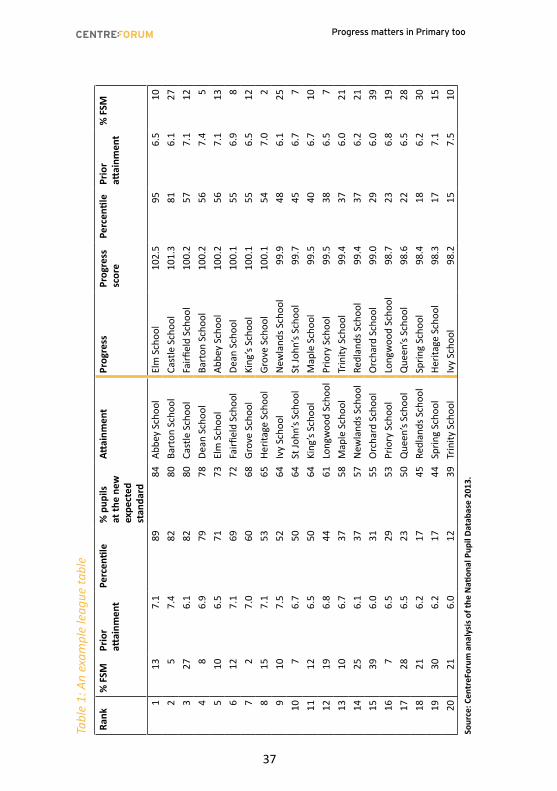
Progress matters in Primary too
37
Tabl
e 1:
An
exam
ple
leag
ue ta
ble
Rank
% F
SMPr
ior
attai
nmen
tPe
rcen
tile
% p
upils
at
the
new
ex
pect
ed
stan
dard
Attai
nmen
tPr
ogre
ssPr
ogre
ss
scor
ePe
rcen
tile
Prio
r att
ainm
ent
% F
SM
113
7.1
8984
Abbe
y Sc
hool
Elm
Sch
ool
102.
595
6.5
102
57.
482
80Ba
rton
Sch
ool
Cast
le S
choo
l10
1.3
816.
127
327
6.1
8280
Cast
le S
choo
lFa
irfiel
d Sc
hool
100.
257
7.1
124
86.
979
78De
an S
choo
lBa
rton
Sch
ool
100.
256
7.4
55
106.
571
73El
m S
choo
lAb
bey
Scho
ol10
0.2
567.
113
612
7.1
6972
Fairfi
eld
Scho
olDe
an S
choo
l10
0.1
556.
98
72
7.0
6068
Grov
e Sc
hool
King
’s Sc
hool
100.
155
6.5
128
157.
153
65He
ritag
e Sc
hool
Grov
e Sc
hool
100.
154
7.0
29
107.
552
64Iv
y Sc
hool
New
land
s Sch
ool
99.9
486.
125
107
6.7
5064
St Jo
hn’s
Scho
olSt
John
’s Sc
hool
99.7
456.
77
1112
6.5
5064
King
’s Sc
hool
Map
le S
choo
l99
.540
6.7
1012
196.
844
61Lo
ngw
ood
Scho
olPr
iory
Sch
ool
99.5
386.
57
1310
6.7
3758
Map
le S
choo
lTr
inity
Sch
ool
99.4
376.
021
1425
6.1
3757
New
land
s Sch
ool
Redl
ands
Sch
ool
99.4
376.
221
1539
6.0
3155
Orc
hard
Sch
ool
Orc
hard
Sch
ool
99.0
296.
039
167
6.5
2953
Prio
ry S
choo
lLo
ngw
ood
Scho
ol98
.723
6.8
1917
286.
523
50Q
ueen
’s Sc
hool
Que
en’s
Scho
ol98
.622
6.5
2818
216.
217
45Re
dlan
ds S
choo
lSp
ring
Scho
ol98
.418
6.2
3019
306.
217
44Sp
ring
Scho
olHe
ritag
e Sc
hool
98.3
177.
115
2021
6.0
1239
Trin
ity S
choo
lIv
y Sc
hool
98.2
157.
510
Sour
ce: C
entr
eFor
um a
naly
sis o
f the
Nati
onal
Pup
il Da
taba
se 2
013.

Progress matters in Primary too
38
system. The implication is that above-average performance is also possible, be-cause scores above this threshold are attainable on the existing tests. For exam-ple, were all pupils at the Ivy School to have achieved a ‘level 5b’, its progress score would place it between Elm School and Castle School i.e. in second place.
Trinity School also fares better by the progress measure than by the attainment measure. This school has the joint-lowest average prior attainment of any school intake in the table and, relatedly, also has the lowest percentage of pupils achiev-ing the new expected standards. Trinity School’s performance by the attain-ment measure places it very close to the bottom 10% of schools in the country. However, accounting for the circumstances of its intake, Trinity School would be ranked higher on progress. This is because this measure is better able to distin-guish the impact of a school from the characteristics of its intake.
In the table, Heritage School could also be considered to be coasting, falling from eighth on attainment to 19th on progress. As with the Ivy School, Heritage School is failing to satisfactorily improve the outcomes of its intake. This intake is of relatively high prior attainment and the percentage of pupils from disadvantaged backgrounds is marginally below the national average.
There is also some evidence that the level of disadvantage is less strongly as-sociated with the ranking, but the results here are somewhat weaker for this particular group of schools.
Table 1 thus shows, in practice, how a set of schools might compare by the two measures and how some schools would prefer to emphasise their performance by attainment over progress, and vice versa. For example, Abbey School, which lies in the 89th percentile, nationally, by attainment, would likely choose to publicise this over their position in the much lower 56th percentile by progress. Heritage School would certainly wish to do this, too: it is in the 65th percentile by attainment but the 17th percentile by progress. Conversely, high-progress schools would prefer to be ranked as such e.g. Elm School is in the top 5% of the country by progress, com-pared to the 73rd percentile by attainment. A system in which schools can be judged by differing performance measures has the potential to generate complications for those with an interest in evaluating and comparing schools (including parents).
e. The ambition of the new attainment floor
This section considers whether one of the two floor standards might be more prevalent as a metric than the other.
It is here that some deeper consideration of the 85% attainment floor is nec-essary. Table 1 showed that even the top-performing attainment school in the example LA only had 84% of its pupils meeting the new expected standards.54 What is striking is that the school in question was in the 89th percentile and still failed to meet the floor standard under current performance. As was alluded to
54 Were the standards modelled also to include a new expected standard in writing, this percentage would likely be lower.
Progress matters in Primary too
39
previously, the government’s attainment floor standard is highly ambitious.
Figure 9 shows just how challenging the new attainment standard will be. In 2013, 85% of schools met the floor standard for that year, of at least 60% of pupils meeting the current expected standards. Under current pupil perfor-mance, however, just 10% of schools could have met the 2016 attainment floor of 85% of pupils performing at the new expected standards.
Figure 9: Comparison of attainment floor standards
Perc
enta
ge o
f sch
ools
mee
ting
the
attai
nmen
t sta
ndar
d
0%
20
40
60
80
100%Attainment
2016: 85%2013: 60%
Current attainment standards85%
Forthcoming attainment standard
10%
Source: CentreForum analysis of the National Pupil Database 2013.
The reality appears to be that while there are certainly schools that would prefer to be judged on attainment over progress (because such a measure masks the relatively poorer progress made by pupils in these schools) the scale of ambition of the reforms is such that few schools could reasonably meet the forthcoming attainment standards. On the basis of their current performance (which predat-ed the government’s announcements regarding the reforms), the majority of schools would likely have to be judged on progress.
Table 2 shows how far away many schools are from the 85% target. Even if the floor standard for schools were lowered to 80%, less than one in five schools would be above the floor, and just over a quarter of schools would be able to meet a 75% floor standard. For the majority of schools, the new 85% standard is highly challenging, at least in the short term, and will thus represent an aspira-tion for the majority of schools.

Progress matters in Primary too
40
Table 2: Percentage of schools meeting the new expected standards at different floor thresholds
% meeting % not meeting
85% 10% 90%
80% 18% 82%
75% 27% 73%
70% 37% 63%
65% 48% 52%
60% 59% 41%
Source: CentreForum analysis of the National Pupil Database 2013.
These results imply that the majority of primary schools would likely be judged on progress. In terms of the government’s core goals, the incentives that drive these schools will be well-aligned with the traits of a good education system. The remaining 10% of schools will constitute something of an ‘elite’ within the prima-ry school system. Of course, at least some of these high-attainment schools are also likely to be low-progress schools although, based on schools’ 2013 results, the vast majority of these ‘elite’ schools will in fact also be high-performing by the progress measure.55 These schools do have, on average, high prior-attain-ment intakes but, with few exceptions, high attainment equates to high progress.
In this sense, the higher attainment standard need not conflict with the idea of sufficient progress, but for most schools it will be an aspiration. Schools’ main concern will be demonstrating good pupil progress and this should be reinforced under the new system, as higher attainment in pursuit of the government’s aspi-ration should follow as a consequence.
One other possibility is that schools devote greater resource to meeting the new attainment standard. Given the problems of the attainment measure, this is likely to further the emphasis on some pupils, rather than all, magnifying the conflict with the government’s goals. This may be attenuated to some degree by the fact that high attainment and high progress go hand in hand, as it will limit cases where high attainment might be pursued to the detriment of good progress. Nevertheless, as insurance against this possible perverse incentive, it would be advisable for the government to reconsider the greater emphasis it places on attainment in its current proposals.
The analysis in this chapter has shown how a progress measure is a much better reflection of the government’s core goals in progressing these ambitious and merited reforms to primary school accountability. In addition, the scale of am-bition represented by the new attainment standards suggests that progress is likely to be the dominant metric of school performance when the reforms come into effect.
55 Of the schools that could have met the new attainment standards back in 2013, 90% of them would have done so with above-average progress.
Progress matters in Primary too
41
: 5 Challenges in implementing the baseline assessment
Chapter 4 of this report established that progress is the more effective measure of school performance for accountability purposes. However, the progress mea-sure is not without issues. The most significant is that it necessitates introducing a new baseline assessment to evaluate children’s capabilities upon entering pri-mary school, from which to measure their progress to Key Stage 2.
This chapter considers the concerns of government, schools and parents that will need to be addressed in order for a baseline assessment to be effective-ly implemented. It concludes that, in principle, there is nothing to prevent a well-designed baseline test being used to create a progress-based accountability measure.
The concept of measuring the progress pupils make in primary schools is not new. Progress achieved between Key Stages 1 and 2 is one of a range of exist-ing (non-headline) performance indicators.56 Progress measures are also used at pupil level. For example, pupil tracking pays close attention to the progress individual children are making against both their own targets and established notions of ‘expected’ pupil progress.
Teachers are accustomed to making formative assessments of children upon entry to Reception to inform their teaching, and tracking them in relation to the 17 early learning goal descriptors in the Early Years Foundation Stage Profile.57 The Centre for Evaluation and Monitoring’s well-established Performance Indicators in Primary Schools (PIPS) baseline assessment is a formative assessment used to evaluate what a child knows and can do when they first start full-time educa-tion. The PIPS test was influential in informing initial government thinking about the efficacy and practicality of introducing the formal baseline assessment, even though it was not devised for this purpose, or used in the context of a high-stakes accountability system.
56 Department for Education (2014), Statistical First Release, ‘National curriculum assessments at key stage 2 in England, 2014’: www.gov.uk/government/uploads/system/uploads/attachment_data/file/347653/SFR30_2014_Text.pdf
57 Standards and Testing Agency (2014), ‘Early Years Foundation Stage Profile Handbook 2014’: www.gov.uk/government/uploads/system/uploads/attachment_data/file/301256/2014_EYFS_handbook.pdf
Progress matters in Primary too
42
Repeated changes to the Key Stage 1 and 2 assessments illustrate how contest-ed the issue of external testing for accountability purposes is within primary education. Given this resistance, a proposal to introduce external testing into Reception as part of a high stakes accountability system was bound to be conten-tious. The concerns raised about the baseline assessment, both in responses to the government’s original consultation and through the research undertaken for this report, are addressed below.58
a. Validity
The progress measure hinges on the assumption that attainment at the start of Reception is valid as a predictor of attainment at age 11. A number of groups have questioned the ability of the baseline assessment to capture the character-istics that predict attainment in later years. The concern is a fundamental ques-tion about the legitimacy of the new system.
In fact there is good evidence to demonstrate that children’s attainment at age 11 can be predicted from their attainment at the start of school. Indeed the social mobility literature makes the point that this is predictable even earlier in a child’s life.59 60
Taking the most direct comparator evidence, the PIPS assessment has consis-tently shown that Reception attainment can predict later attainment. There is a strong correlation (0.7) between a PIPS baseline score and Key Stage 2 attain-ment.61 A baseline assessment cannot be a perfect predictor of future outcomes since child development is not linear. However, the evidence supports the view that an assessment of performance in Reception can be used as a valid baseline measure.
b. Reliability
The second major criticism has been that a child’s attainment cannot be reliably determined in Reception for the purposes of constructing a progress measure. This objection largely concerned the likelihood of substantial variation in perfor-mance depending on when and by whom the test is administered. This would undermine the establishment of an accurate performance baseline and make
58 Department for Education (2014), ‘Reforming assessment and accountability for primary schools: Government response to consultation on primary school assessment and accountability’, pp. 12-20: www.gov.uk/government/consultations/new-national-curriculum-primary-assess-ment-and-accountability
59 Sammons, P., Sylva, K., Melhuish, E., Siraj-Blatchford, I., Taggart, B., and Hunt, S., (2008) ‘Influenc-es on Children’s Attainment and Progress in Key Stage 2: Cognitive Outcomes in Year 6’, Effective Pre-school and Primary Education 3-11 Project (EPPE 3-11), p. iv: www.ioe.ac.uk/Cog_report_Yr6.pdf
60 Feinstein L., (2003), ‘Very Early Cognitive Evidence’, CentrePiece, Summer, p. 25: cep.lse.ac.uk/pubs/download/CP146.pdf
61 Centre for Evaluation and Monitoring (2001), ‘Performance Indicators in Primary Schools Techni-cal Report 2001’, p. 23: www.cem.org/attachments/publications/PIPS%20Technical%20Report%202001.pdf

Progress matters in Primary too
43
any progress measure unreliable. As one interviewee put it, “Children this age do not give consistent responses to tests, so testing them on the same things on different days or in different contexts will elicit different responses.”62
However, evidence from PIPS points to a different conclusion. It has shown that testing young children produces consistent results as evidenced by how it ob-tains similar scores (a 0.98 correlation) for the same children on retesting. This suggests that the government is right to require all baseline assessment provid-ers to demonstrate that their assessment provide a stable, replicable measure.63 Given the reliability of the PIPS baseline assessment to re-produce the same result, this point is unlikely to present a fundamental impediment to the baseline assessment in practice.
The more significant criticism over reliability concerns the impact of test condi-tions on outcomes.
The tender specification requires the assessment be both accessible to 99% of children in Reception and not wholly observational. This means that children will require an adult’s help to undertake the assessment – they can’t be expected to have the ability to read instructions or the writing or motor skills to record an answer themselves.
The early years educators organisation, Training Advancement and Cooperation in Teaching Young Children (TACTYC) point to the evidence that such young chil-dren ‘will not show their true abilities in a test taken out of the context of familiar relationships’.64 TACTYC also contend that children who have experienced a more formal pre-school setting will be at an advantage compared to those who start school with no such previous experience.
The involvement of adults, most likely teaching assistants, leaves a great deal of scope for tester bias, either conscious or inadvertent. Examples of bias provided by our interviewees included: giving non-verbal clues to direct a child to the cor-rect answer, prompting because ‘they know the child knows this’ or thinking they hear a correct answer when the child is only close to getting it right.
Therefore, the Department for Education was right to highlight the issue of re-liability to providers. These concerns should be addressed in the development process. The assessment should be designed in a way that provides a stable mea-sure regardless of who administers and scores it. The Department for Education will need to be satisfied that concerns around reliability have been mitigated before approving any baseline assessment proposals.
62 Stakeholder interview, October 2014. 63 Standards and Testing Agency (2014), ‘Reception baseline: criteria for potential assessments’, p. 3:
www.gov.uk/government/uploads/system/uploads/attachment_data/file/359832/Baseline_crite-ria.pdf
64 Training Advancement and Cooperation in Teaching Young Children (2014), ‘Position Statement: Say ‘no’ to baseline assessment’, p. 1: tactyc.org.uk/wp-content/uploads/2014/10/TACTYC-Base-line-position-paper-1.pdf
Progress matters in Primary too
44
c. Contextualisation
Another concern is around the apparent oversimplification of the baseline as-sessment. The proposal for a scaled numerical score based on the assessment would ignore contextual information which is known to impact a child’s develop-ment. This has led some to argue that the baseline assessment cannot be entirely reliable unless it accounts or compensates for factors, which may affect perfor-mance. Such factors include:
: Gender
: Pupils who speak English as an additional language (EAL)
: Month of birth
: Children in care
: Pupils from low income backgrounds
At the start of school, ‘typical attainment’ among children is very broad, and this will be reflected in the results in the baseline assessment. Contextual factors account for many of those differences. Therefore, a ‘standardised ‘typical level of development’ has to be very carefully constructed.’65
An effective headline accountability measure requires a trade-off between suf-ficient sophistication to account for the complexity of child development and a methodology that is sufficiently transparent to be understood and applied.66 The recent attempt to use Contextual Value Added (CVA) scores as part of the school accountability regime demonstrates the difficulty of gaining acceptance for a complex set of nuanced data.67
While these factors do impact upon children’s development, the danger with altering expectations to account for a child’s individual circumstances is that it risks allowing these circumstances to become indicators for ability. It would be difficult to justify this approach given concern around social mobility and the gov-ernment’s focus on narrowing the attainment gap for pupils from disadvantaged backgrounds.
Regardless of the introduction of the baseline assessment, teachers will continue to need the fullest possible understanding of each pupil. While the baseline as-sessment score may contribute to this understanding, there is no suggestion that it should replace the broad range of assessments and understanding of teachers.
65 Dubiel, J. (2014), ‘Tracking progress at Key Stages 1 and 2: introducing a baseline assessment and removing levels’, Westminster Education Forum: Primary testing, assessment and accountability - baseline assessment, removing levels, and progression to secondary education, 30/01/2014: www.westminsterforumprojects.co.uk/forums/event.php?eid=714
66 Foley, B., Goldstein, H. (2012), ‘Measuring success: league tables in the public sector’, The British Academy, p. 20: www.bristol.ac.uk/media-library/sites/cmm/migrated/documents/measuringsuc-cess.pdf
67 See Leckie, G. and Goldstein, H., (2009) ‘The Limitations of Using School League Tables to Inform School Choice’, The Centre for Market and Public Organisation: www.bristol.ac.uk/media-library/sites/cmpo/migrated/documents/wp208.pdf
Progress matters in Primary too
45
The government has acknowledged contextualisation as an issue that baseline assessment providers need to take into account. However, for the purposes of constructing an effective progress measure, nuanced contextual data is not inte-gral to assessment design.
d. Labelling
Teachers have raised concerns that it would be counterproductive to implement a baseline assessment if it risks ‘labelling’ pupils in the eyes of teachers, parents or the pupils themselves. If children perform poorly in the baseline assessment, there is a danger of them being stigmatised, or labelled as a failure. This concern around labelling and resultant stress is clearly magnified if there are parallel con-cerns about the reliability of the assessment.
Labelling may result in teachers unintentionally setting a ceiling for low-scorers’ development which is not in line with their actual potential. Parental anxiety around their children’s performance is already a concern for schools. TACTYC have expressed concern that parents will be ‘misdirected in terms of the most important markers of their child’s progress and attainment’.68 If children perform poorly in the baseline assessment, there is a danger of this impacting negatively on self-confidence.
Introducing a baseline assessment certainly risks labelling. Equally pupils enter-ing Reception are already subject to various assessments which are themselves susceptible to leading to labelling. The baseline assessment provides an objec-tive basis from which a teacher can form an initial opinion about a child’s devel-opment, so it may actually minimise the risk of inappropriate labelling.
There is potential for labelling to be dealt with in the appropriate communica-tion and presentation of a child’s results. In order to avoid parental anxiety and misdirection, the results of the baseline assessment should not receive undue prominence in a teacher’s communication of their assessment of a child’s de-velopment. The summative assessment should always be contextualised by ‘the teachers’ broader assessments of children’s development’ and communicated to parents only in positive terms.69 For example, ‘he/she can correctly point to a named object’, rather than a numerical result: ‘he/she scored 75’.
68 Training Advancement and Cooperation in Teaching Young Children (2014), ‘Position Statement: Say ‘no’ to baseline assessment’, p. 1: tactyc.org.uk/wp-content/uploads/2014/10/TACTYC-Base-line-position-paper-1.pdf
69 Department for Education (2014), ‘Reforming assessment and accountability for primary schools: Government response to consultation on primary school assessment and accountability’, p. 7: www.gov.uk/government/consultations/new-national-curriculum-primary-assessment-and-ac-countability
Progress matters in Primary too
46
e. Pupil mobility
Under the current attainment threshold, all pupils’ results are included in the Key Stage 2 measurement. This can reflect unfairly on schools with high levels of pupil mobility, who are judged on the results of pupils who have been in their school for a comparatively short time. The construction of the progress measure increases this sense of unfairness in instances where the majority of a pupil’s time was spent in other schools.
The Department for Education is currently reviewing for how long a pupil needs to have attended a school in order to be included in the progress measure and will issue guidance.70 In addition to excluding some very recent joiners from the calculation entirely, it may be effective to track two sets of progress data per school: one set of data for pupils who have attended all through, and one for pupils that entered the school later. Having two sets of data may explain variation in rates of progress, especially for the purposes of Ofsted inspections.
The issue of mobility is compounded by the government’s decision to allow for a range of baseline assessments from alternative providers. Having a market for baseline assessments means that schools with high mobility are likely to be track-ing pupils’ progress using the results from several different baseline assessments. If baseline scores are inconsistent, that risks schools being rewarded/penalised unevenly. Whether or not the government is successful in addressing compara-bility issues between assessments, having a market increases the complexity of introducing the measure for schools.
High rates of mobility impact upon pupil performance, and disproportional-ly affect schools serving disadvantaged areas. If the baseline assessments are not found to be properly comparable, the progress measure could be more of a burden on disadvantaged schools, working against the government’s goal of nar-rowing the gap in performance.71 Therefore, it is not surprising that the majority of respondents to the government consultation did not want to choose from a range of commercially available assessments and preferred instead a single na-tional baseline assessment.72
70 Department for Education (2014), ‘Responses to clarification questions received at the stakehold-er session and prior to the issue of the Invitation to Tender: Reception Baseline’, p. 1.
71 The Department for Education is currently addressing comparability issues in a study which will be completed in January 2015.
72 Department for Education (2014), ‘Reforming assessment and accountability for primary schools: Government response to consultation on primary school assessment and accountability’, p. 16: www.gov.uk/government/consultations/new-national-curriculum-primary-assessment-and-ac-countability
Progress matters in Primary too
47
f. Gaming
Any accountability system comes with risks of gaming behaviours from schools.73 As discussed in Chapter 2, the act of measurement, even if not explicitly for accountability purposes, can affect school behaviour. The danger of gaming is equally applicable to the baseline assessment.
The most obvious strategy for ‘gaming’ the progress measure is to artificially de-press the baseline assessment score to inflate the subsequent progress measure. The lower the baseline score, the easier it would be to demonstrate a good level of progress between Reception and Key Stage 2. There is little incentive for a school to do as well as possible on that baseline assessment.74 As addressed in the section on reliability above, the nature of the assessment leaves it open to manipulation.
While every attempt should be made to minimise the potential for gaming, it is recognised as an inherent feature in high stakes accountability systems.75 For instance, at the upper end of primary schooling there is pressure on schools to maximise results at Key Stage 2. Teachers may ‘teach to the test’ to try to ensure their pupils reach the higher expected standard, or to maximise pupil progress.76
We accept that the nature of a high-stakes baseline assessment means that it is susceptible to gaming behaviour. The most important defence against gaming lies in reliable, accurate and appropriately-moderated assessment at the begin-ning and end of primary school. Providers need to minimise the opportunity for gaming in the design of the test. Formal monitoring of the baseline assessment will be undertaken by the Department for Education.
Since the new progress accountability measure will not be fully operational until 2023 there is time in the intervening period to explore the rigour of gaming pre-vention and to introduce further safeguards where necessary. The first voluntary pilot baseline assessments in autumn 2015 will provide a good opportunity for this.
Conclusion
Progress is the fairest way to measure school performance. It relies on introducing a baseline assessment at the start of Reception so that the school’s impact on pupils can be captured from the earliest possible point.
73 See Smith, P. (1995), ‘On the unintended consequences of publishing performance data in the public sector’, International Journal of Public Administration, 18(2), pp. 277-310: www.tandfon-line.com/doi/abs/10.1080/01900699508525011#.VKu4TSusVic
74 Although the introduction of the baseline assessment may have alternative implications for schools with nurseries. Such schools may face pressure to demonstrate strong performance in the baseline assessment, in order to prove that nursery provision has been effective.
75 Foley, B., Goldstein, H. (2012), ‘Measuring success: league tables in the public sector’, The British Academy, p. 30: www.bristol.ac.uk/media-library/sites/cmm/migrated/documents/measuringsuc-cess.pdf
76 Wilson, D., Croxson, B. and Atkinson, A. (2006), ‘What Gets Measured Gets Done’, Policy Studies, 27(2): www.bris.ac.uk/efm/people/deborah-j-wilson/pub/2009114

Progress matters in Primary too
48
We conclude that the legitimate concerns raised by stakeholders around the reliability and fairness of a baseline assessment do not present fundamental impediments to implementing the progress measure. Overall, a well-designed assessment and appropriate moderation could address these concerns to the extent that a baseline assessment could provide a reasonable basis for constructing a progress measure.
That said, the Department for Education and baseline assessment providers need to address, and, where indicated, mitigate the concerns. However, in principle, there is nothing to prevent a well-designed baseline test being used to create a progress-based accountability measure.
Progress matters in Primary too
49
: 6 Challenges with implementing the new accountability system
The previous two chapters have shown that a progress measure is a much better reflection of the government’s core goals and that concerns about the underpin-ning baseline test are not well founded.
This chapter will argue that retaining an attainment measure alongside the new progress measure in primary schools is problematic, and will make the case for a single progress-based accountability measure.
a. The effect of a dual accountability system
As Chapter 4 established, progress is the fairer measure of a school’s perfor-mance, as it better reflects a school’s contribution to a child’s development. We endorse the goal of raising the attainment of all primary school pupils. However, using an attainment threshold as a way of driving this is problematic.
There are two reasons for this. First, retaining an attainment measure risks pro-ducing perverse incentives for schools and pupils that conflict with the govern-ment’s goals for the education system. Second, few schools are in a position to reach the new attainment threshold and those that do also show good progress. The reasoning is explained more fully below.
Perverse incentives
An attainment measure has the potential to generate perverse incentives, by encouraging a focus on those pupils who would take the school over the thresh-old at the expense of those at the extremes of the distribution: those whose performance should be stretched beyond the threshold standard and those too far from the threshold to be worth attention. As Chapter 4 demonstrated, this conflicts with the government’s stated goal of securing the best outcomes for all pupils. While the attainment measure does not encourage a focus away from all disadvantaged pupils, the analysis suggests that the very lowest attainers (who are also the most likely to come from disadvantaged backgrounds) could suffer. This risks driving a wedge between at least some pupils and the rest and is thus not fully compatible with the government’s second goal about closing the gap. As shown in Chapter 4, the progress measure does not suffer from these problems.

Progress matters in Primary too
50
A further possible problem is that schools which opt to devote much greater resources to meeting the attainment target may actually narrow their curricula to the bare essentials to meet the test standards. This would conflict with the government’s intention to be less prescriptive about curriculum content in order to encourage innovation in primary education.
This raises some concerns about the continued prominence of the attainment measure over the progress measure.
Relevance
The fact that so few schools are in a position to reach the attainment target raises questions over its relevance. This is compounded by the fact that the vast majori-ty of schools that currently reach the target also show good progress.
As Chapter 4 demonstrated, scarcely 1 in 10 schools are currently meeting the 85% threshold target. As a result it would seem that based on current perfor-mance, the vast majority of schools, will have no option but to focus on meeting the progress measure.
Furthermore, of the 10% of schools who are currently reaching the new expected attainment standard, 90% of pupils make above average progress compared to other schools. For the overwhelming majority of high-attainment schools, good attainment and good progress go hand in hand.
Both challenges to the relevance of an attainment measure point to progress being the dominant accountability metric in practice.
b. Relative prominence of the alternate measures
The new system favours the attainment measure because of its greater resem-blance to the current accountability system, of expected pupil progress and target percentages of cohort attainment. Although the attainment threshold has been increased, the format of the attainment measure is familiar to primary school governors, headteachers, teachers and parents.
The interviews undertaken for this report suggest that the way the Department for Education has presented the accountability reforms has affected schools’ in-terpretation of the relative importance of the two measures. The Department’s consultation response document positions the new 85% attainment measure as the foremost objective. The fact that the progress measure will only be used to judge schools that fail to meet the attainment target reduces its prominence as part of the new system.
The sense that the attainment measure will have greater priority is accentuated by the relative timing of the two floor standards. The higher floor standard at Key Stage 2 will come into effect in 2016, making it a pressing concern in the coming years. In contrast, the old, cruder progress measure will continue to apply up to
Progress matters in Primary too
51
2023. Only in 2023 will the new progress measure come into full effect, once the first cohort of pupils who took the baseline assessment have taken their Key Stage 2 tests. With the progress measure pushed so much further into the future, the different timescales of the reforms makes a focus on attainment inevitable.
The attainment measure is a much clearer, more pressing target. Whether or not this was the Department for Education’s intention, the proximity of the attain-ment measure (along with the pressure created by the increase in standard) has contributed to it attracting more attention from schools.
Given the amount of uncertainty schools have faced in recent years, and the length of the implementation timescale, school leaders have expressed some scepticism as to whether the new progress measure will still be in place by 2023, whether in its planned form or even at all.77 A stronger commitment to the prog-ress measure is necessary, to raise the perceived importance of the progress measure relative to the attainment measure. This might, for example, involve an increase in emphasis on the existing, albeit cruder, progress measure.78 Another option might be to construct progress measures more akin to the new one on the basis of existing data e.g. as has been carried out in this analysis, using the EYFSP scores as a baseline, though this would still fail to capture progress made in Reception. These might be used for either indicative (to give schools some sense of their performance prior to 2023) or accountability purposes. A fuller assessment of interim options for tracking school-level progress is outside of the scope of this current research.
c. Consistency across the education system
Following CentreForum’s 2013 report ‘Measuring What Matters’, the govern-ment elected to use a progress measure as the headline accountability measure-ment for secondary schools.79 The arguments for a progress-based measurement in secondary schools also apply to primary schooling. It is inconsistent to replace an attainment-based accountability system for secondary schools, but retain and prioritise an attainment measure in primary schools.
This chapter has both demonstrated the negative consequences of using attain-ment as the headline accountability measure for primary schools, and highlight-ed the benefits of using a progress measure. The benefits of using a progress measure for accountability purposes are equally applicable to the both primary and secondary schools.
We would contend that abandoning the attainment measure, and using progress as the sole measurement of primary school performance would be:
77 Stakeholder interviews, October 2014. 78 Acknowledging the existing measure’s inability to measure or encourage schools’ efforts to nar-
row the gap in the first three years through early interventions.79 Paterson, C. (2013), ‘Measuring what matters: Secondary school accountability indicators that
benefit all’, CentreForum: www.centreforum.org/index.php/mainpublications/512-measur-ing-what-matters

Progress matters in Primary too
52
1. more in line with the government’s goals for a good education system; and
2. consistent with the government’s approach with secondary schools.
Senior teachers support this viewpoint, expressing a preference for all primary schools to be held to account solely on the basis of progress, as is to be the case at secondary level.80
d. Implementation
The progress measure is not just a new way of holding schools to account; it also requires the implementation of a new baseline assessment. As discussed in Chapter 5, the baseline assessment is contentious. Indeed, it remains so unpop-ular with teachers that in April 2014 the National Union of Teachers supported a motion to boycott the assessments altogether.81
Despite this controversy, as argued in Chapter 5, it is possible to create a valid baseline assessment. However, this argument still needs to be won and teachers’ concerns assuaged. We hope this paper contributes to that but it is right to look to government to take a more decisive line in supporting the progress measure underpinned by a well-designed, appropriately moderated baseline assessment.
Since the majority of schools will be reliant on the progress measure under the new system, they need to be better informed about the validity, reliability and purpose of the baseline assessment. To win the support of school leaders and teachers, the Department for Education must release clear, defensible evidence that the baseline assessment is indeed valid, fair and reliable.
Conclusion
This chapter has set out a case against attainment as the most prominent ac-countability measure for primary schools as it risks entrenching perverse incen-tives and appears to be of limited relevance given current school performance. A progress measure is compatible with driving up standards and will bring consis-tency to the headline accountability regime across all phases of schooling.
At the time of writing little has been done to engage with schools and parents around the challenges of implementing a progress measure. The Department for Education should prioritise addressing these challenges.
80 Mackinlay, M. (2014), ‘Primary assessment and accountability reform: Feedback from primary senior leaders’, Schoolzone: www.schoolzone.co.uk/schools/research_papers.asp
81 The Guardian, (2014), ‘Teachers may boycott tests for four-year-olds’, 21 April 2014: www.theguardian.com/education/2014/apr/21/teachers-may-boycott-tests-four-year-olds-nut

Progress matters in Primary too
53
: 7 Conclusions and recommendations
We should be ambitious about the outcomes that can be achieved by the end of primary school. The coalition government has pursued an extensive programme of education reforms with the intention of raising standards through granting greater autonomy to schools. But it is only by combining this greater autonomy with intelligent accountability that outcomes will improve.
The proposed reforms to the accountability system significantly increase the cur-rent attainment threshold measure from 65% to at least 85% of pupils meeting the required standards in English and mathematics. Very few schools are close to achieving this aspirational performance target. A new alternate progress-based floor standard is also being introduced but attainment is presented as the most prominent and pressing headline accountability measure.
This report shows that it is the progress measure to be the one that will drive per-formance while aligning better with the government’s two core goals of securing the best outcomes for all, not just some, pupils and closing the gap between pupils from disadvantaged backgrounds and the rest. This is because it is both fairer and reflects and encourages the good work that schools do for all their pupils.
Conversely, the attainment measure, which has been the traditional way of hold-ing schools to account, risks driving school behaviours that are at odds with the government’s goals. We understand that an aspirational performance target sig-nals the government’s wish for a step change in school performance. However the likelihood is that, based on current performance, progress will be the mea-sure used for the vast majority of schools, at least in the short to medium term. Even those schools which achieve the attainment floor target will only do so by ensuring at least average progress is made by their pupils.
As a result this report concludes that pupil progress is not only the fairest and most effective accountability measure but also the dominant accountability metric. In these circumstances the government should make progress its princi-pal headline accountability measure for primary schools.
While the emphasis on progress would mark a departure from the traditional at-tainment measure applied to schools, this government has already demonstrat-ed its commitment to progress measures elsewhere, in secondary schools. Given
Progress matters in Primary too
54
that the government’s core goals are the same for both primary and secondary schools, there should also be symmetry in its reforms to both.
An effective baseline assessment is fundamental to creating a progress measure. We conclude that the concerns raised by stakeholders around the reliability and fairness of a baseline assessment do not present fundamental impediments to implementing the progress measure. Indeed even were such concerns to be jus-tified they would need to considered against the demonstrable benefits of using progress as a headline accountability measure. Since the majority of schools will be reliant on the progress measure under the new system, school leaders, teach-ers and parents need to be better informed about the baseline assessment and given appropriate evidence as to its validity, fairness and reliability.
Recommendation 1: Pupil progress is the fairest and most effective account-ability measure and should therefore be adopted by government as its princi-pal headline accountability measure for primary schools.
Recommendation 2: To support pupil progress becoming principal headline ac-countability measure for primary schools the government should provide clear, defensible evidence that the baseline assessment which underpins it is valid, fair and reliable.