
Chris Martin - Embedded Technical Specialist, Intel… · Chris Martin - Embedded Technical...
33
Chris Martin - Embedded Technical Specialist, Intel/Altera Embedded Linux Conference, San Diego April 2016 [email protected]
-
Upload
nguyenhuong -
Category
Documents
-
view
229 -
download
3
Transcript of Chris Martin - Embedded Technical Specialist, Intel… · Chris Martin - Embedded Technical...

Chris Martin - Embedded Technical Specialist, Intel/Altera
Embedded Linux Conference, San Diego
April 2016

The Hardware Problem Simple Observation/Querying Tools ◦ Virtual Files in /proc, /sys and debugfs ◦ devmem ◦ strace ◦ And many others…
Advanced Debug, Trace & Throughput Tools ◦ GDB ◦ Eclipse ◦ LTTng ◦ FIO
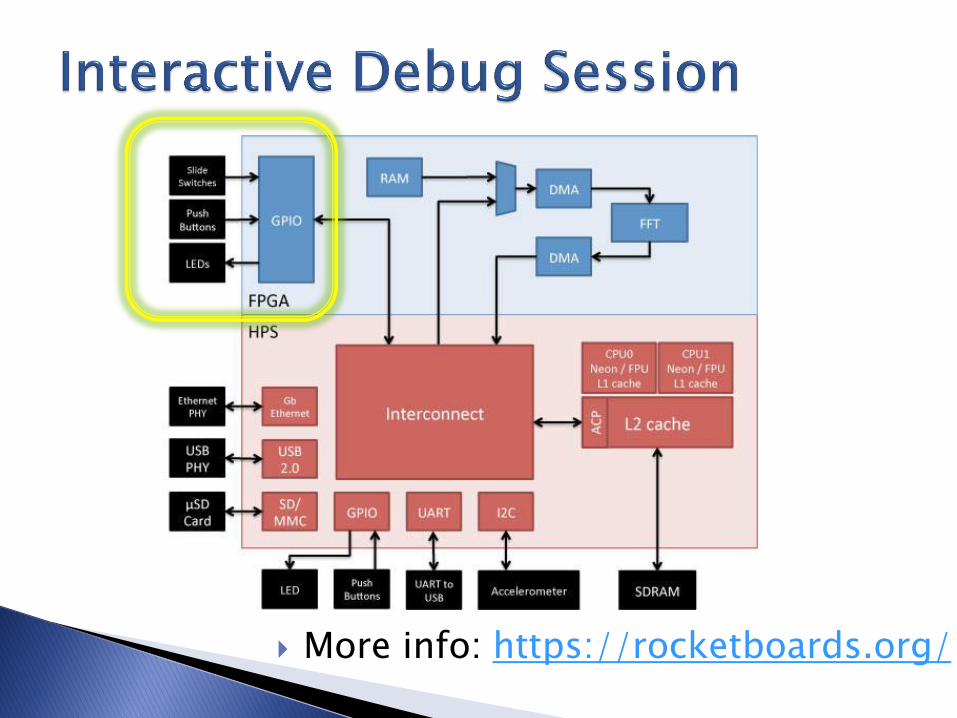
General Tips and Tricks Interactive Debug Session

Kernel & User-Space development built upon foundation of hardware.
Know what could go wrong.
Know what tools exist to help you discover what went wrong.
I/O Interface
System Call Interface

Observe! (cat/tail/more/less) procfs
sysfs
debugfs
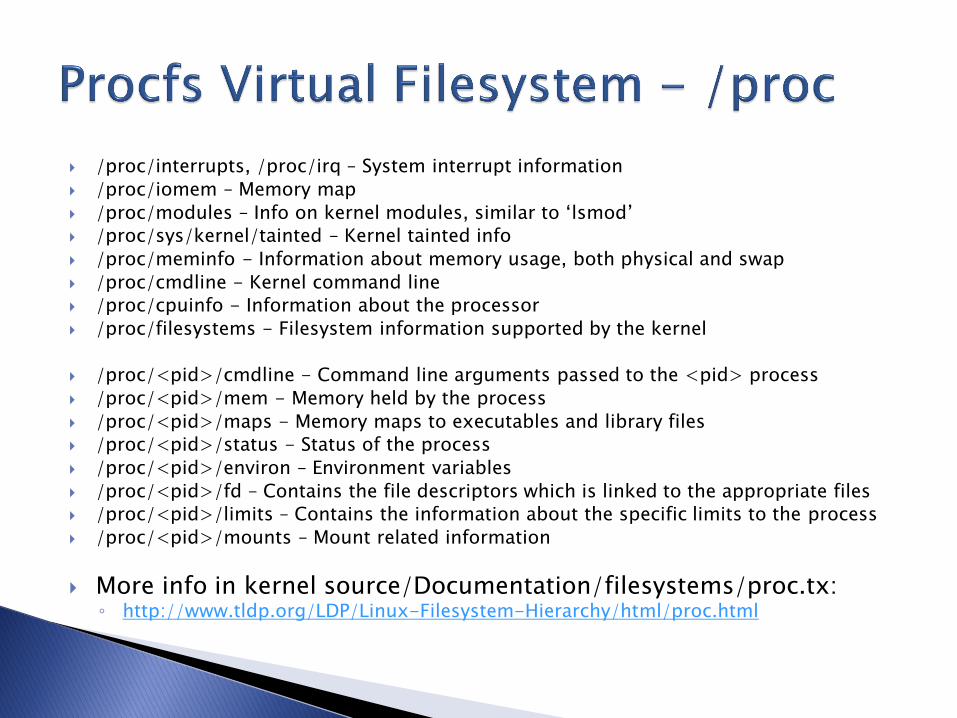
/proc/interrupts, /proc/irq – System interrupt information
/proc/iomem – Memory map
/proc/modules – Info on kernel modules, similar to ‘lsmod’
/proc/sys/kernel/tainted – Kernel tainted info
/proc/meminfo - Information about memory usage, both physical and swap
/proc/cmdline - Kernel command line
/proc/cpuinfo - Information about the processor
/proc/filesystems - Filesystem information supported by the kernel
/proc/<pid>/cmdline - Command line arguments passed to the <pid> process
/proc/<pid>/mem - Memory held by the process
/proc/<pid>/maps - Memory maps to executables and library files
/proc/<pid>/status - Status of the process
/proc/<pid>/environ – Environment variables
/proc/<pid>/fd – Contains the file descriptors which is linked to the appropriate files
/proc/<pid>/limits – Contains the information about the specific limits to the process
/proc/<pid>/mounts – Mount related information
More info in kernel source/Documentation/filesystems/proc.tx: ◦ http://www.tldp.org/LDP/Linux-Filesystem-Hierarchy/html/proc.html

/sys/module
/sys/module/<name>/parameters
/sys/bus/platform/devices
/sys/bus/platform/drivers/<name>/bind
/sys/bus/platform/drivers/<name>/unbind
Useful for hardware debug once kernel module created.
Can create your own virtual files for reading and writing. Observe and also modify.
More Info: https://www.kernel.org/doc/Documentation/filesystems/sysfs.txt
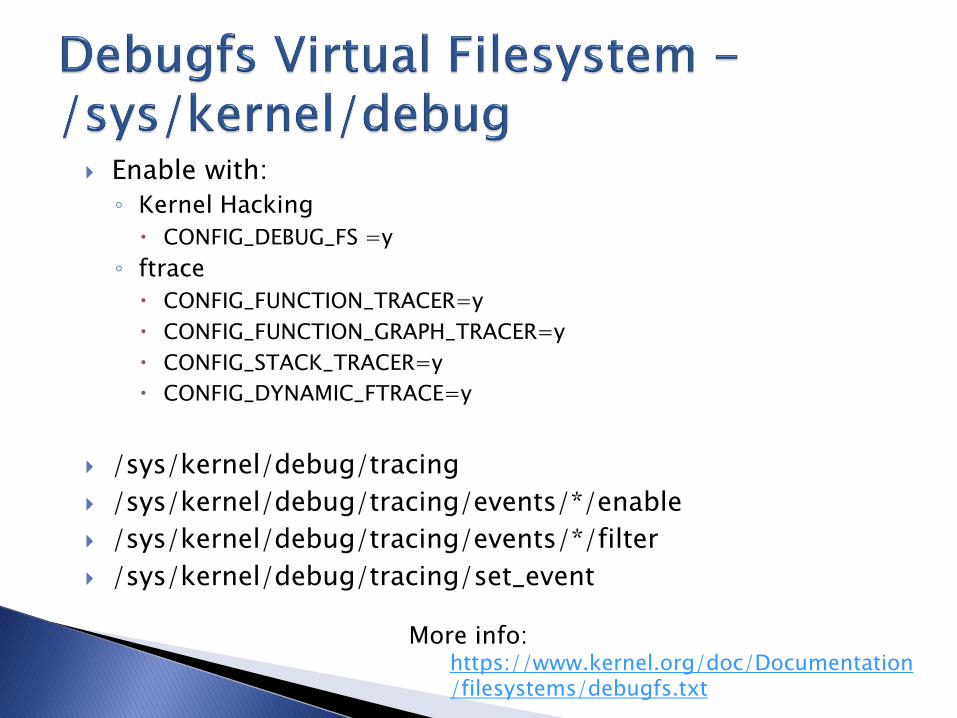
Enable with:
◦ Kernel Hacking
CONFIG_DEBUG_FS =y
◦ ftrace
CONFIG_FUNCTION_TRACER=y
CONFIG_FUNCTION_GRAPH_TRACER=y
CONFIG_STACK_TRACER=y
CONFIG_DYNAMIC_FTRACE=y
/sys/kernel/debug/tracing
/sys/kernel/debug/tracing/events/*/enable
/sys/kernel/debug/tracing/events/*/filter
/sys/kernel/debug/tracing/set_event
More info:
https://www.kernel.org/doc/Documentation/filesystems/debugfs.txt


Simple user space application
Uses mmap() to map physical address of peripheral to virtual address
Allows/Useful for: ◦ Peeks & pokes memory locations
◦ Early debug when HW is available, but driver not available
◦ Debug issues to modify and monitor
Limitations: ◦ Only Read/Write one memory location
$ devmem BusyBox v1.19.4 (2013-10-02 00:06:48 PDT) multi-call binary. Usage: devmem ADDRESS [WIDTH [VALUE]] Read/write from physical address ADDRESS Address to act upon WIDTH Width (8/16/...) VALUE Data to be written

Dump Addresses 0xFFFF_000 to 0xFFFF_00FC
Fill Addresses 0xFFFF_000 to 0xFFFF_00FC
for i in `seq 4294901760 4 4294902015`; do devmem $i 32; done
for i in `seq 4294901760 4 4294902015`; do j=`dd if=/dev/urandom bs=4 count=1 | hexdump -e '"0x%04x"'` devmem $i 32 $j; done

Command line: ◦ dd if=/dev/mem
Allows: ◦ Dump or write blocks of data
Limitations: ◦ After kernel 2.6 /dev/mem access is limited for
security

Crash – installs unrestrited /dev/crash ◦ http://people.redhat.com/anderson/
fmem – installs unrestricted /dev/fmem ◦ http://hysteria.cz/niekt0/fmem
pmem – installs unrestricted /dev/pmem ◦ http://www.rekall-forensic.com/
LiME – Linux Memory Extractor ◦ https://github.com/504ensicslabs/lime
KDB – mdp command (kernel config options below) ◦ CONFIG_FRAME_POINTER=y ◦ CONFIG_KGDB=y ◦ CONFIG_KGDB_SERIAL_CONSOLE=y ◦ CONFIG_KGDB_KDB=y ◦ CONFIG_KDB_KEYBOARD=y ◦ Kdb command to dump physical memory

strace - display system calls used by any executable
readelf - display information about the contents of ELF format files
ldd – prints shared library dependencies
LD_DEBUG environment variable
nm – prints symbol table
dmesg - print or control the kernel ring buffer
lsof – list open files by directory, by pid or by socket
iostat – monitor io devices such as disks
Memory
◦ free – physical and swap memory info
◦ vmstat – virtual memory statistics
◦ pmap - displays process memory map
Processes
◦ top
◦ ps
$ pmap 5732 5732: -bash 00393000 104K r-x-- /lib/ld-2.5.so 003b1000 1272K r-x-- /lib/libc-2.5.so 00520000 8K r-x-- /lib/libdl-2.5.so 0053f000 12K r-x-- /lib/libtermcap.so.2.0.8 0084d000 76K r-x-- /lib/libnsl-2.5.so 00c57000 32K r-x-- /lib/libnss_nis-2.5.so 00c8d000 36K r-x-- /lib/libnss_files-2.5.so b7d6c000 2048K r---- /usr/lib/locale/locale-archive bfd10000 84K rw--- [ stack ] total 4796K
$ lsof /var COMMAND PID USER FD TYPE DEVICE SIZE/OFF NODE NAME syslogd 350 root 5w VREG 222,5 0 440818 /var/adm/messages syslogd 350 root 6w VREG 222,5 339098 6248 /var/log/syslog cron 353 root cwd VDIR 222,5 512 254550 /var -- atjobs

Displays system calls used by any executable ◦ strace –e <syscall> : filter particular system calls
WARNING: Overhead associated with each system call – Slower Performance.
$ strace ls execve("/bin/ls", ["ls"], [/* 21 vars */]) = 0 brk(0) = 0x8c31000 access("/etc/ld.so.nohwcap", F_OK) = -1 ENOENT (No such file or directory) mmap2(NULL, 8192, PROT_READ, MAP_PRIVATE|MAP_ANONYMOUS, -1, 0) = 0xb78c7000 access("/etc/ld.so.preload", R_OK) = -1 ENOENT (No such file or directory) open("/etc/ld.so.cache", O_RDONLY) = 3 fstat64(3, {st_mode=S_IFREG|0644, st_size=65354, ...}) = 0

If hardware to debug is not memory mapped but connected to a different interface:
Ethernet ◦ netstat ◦ tcpdump ◦ iftop ◦ route ◦ ss ◦ vnstat ◦ ntop
PCIe ◦ lspci –vvv –- show/enumerate devices, device cfg with -x ◦ PCI Utilities & IDs: http://mj.ucw.cz/pciutils.html
USB ◦ lsusb –v ◦ usbmon
$ netstat Active Internet connections (w/o servers) Proto Recv-Q Send-Q Local Address Foreign Address State tcp6 0 240 192.168.0.108:ssh 192.168.0.101:54264 ESTABLISHED udp 0 0 atlassockit.local:39480 192.168.0.1:domain ESTABLISHED udp 0 0 atlassockit.local:46190 192.168.0.1:domain ESTABLISHED udp 0 0 atlassockit.local:32982 192.168.0.1:domain ESTABLISHED udp 0 0 atlassockit.local:34101 192.168.0.1:domain ESTABLISHED Active UNIX domain sockets (w/o servers) Proto RefCnt Flags Type State I-Node Path unix 2 [ ] DGRAM 161 /run/systemd/notify unix 2 [ ] DGRAM 172 /run/systemd/journal/syslog
$ tcpdump tcpdump: verbose output suppressed, use -v or -vv for full protocol decode listening on eth0, link-type EN10MB (Ethernet), capture size 262144 bytes 23:01:40.527466 IP atlassockit.local.ssh > 192.168.0.101.54264: Flags [P.], seq 1343918671:1343918799, ack 3022284123, win 294, length 128 23:01:40.559667 IP atlassockit.local.ssh > 192.168.0.101.54264: Flags [P.], seq 128:256, ack 1, win 294, length 128 23:01:40.564330 IP 192.168.0.101.54264 > atlassockit.local.ssh: Flags [.], ack 256, win 253, length 0 23:01:41.497801 IP


Allows you to see what is going on `inside' another program while it executes -- or what another program was doing at the moment it crashed.
Commands ◦ break <location> -- set breakpoint ◦ continue -- continue with program execution ◦ del -- delete breakpoint, tracepoint ◦ bt -- back trace ◦ step # –- single step the program, can step # times ◦ next –- step-over subroutine calls ◦ list –- can list source code by line # or by function name ◦ disas <function> -- show disassembly for function ◦ catch <event> -- GDB stops program when event occurs ◦ watch <expr> -- GDB stops program when expr changes
More Info: https://www.gnu.org/software/gdb/

Debug Features
◦ IDE GUI with Source debug
◦ Program launching
◦ Launches debuggers, including GBD local or remote (other plug-ins available)
◦ Define and control breakpoints
◦ Inspect memory, peripherals, CPU registers
◦ Tracing and Profiling Support
◦ Supports a multitude of languages including C/C++, Java, PHP, etc.
◦ Plug-in Development Environments (Extensible)
Running Eclipse with GDB ◦ Create a project & select (cross-)compiler
◦ Optional: Configure paths to build tools (cross-compiler, assembler, linker, etc.)
◦ Create a Debug Configuration of type C/C++
◦ Specify cross GDB path in Debugger/Main tab (must be configured for host and target systems)
◦ Configure target IP and gdbserver port in Debugger/Connection tab
◦ Run gdbserver on target and launch application to debug
◦ Make sure source code and compiled elf files, kernel modules, shared libraries, etc. are on host/remote system to debug. Useful for symbols.
◦ Click Debug button in Eclipse Debug Configurations window
More Info: https://eclipse.org/


$ lttng create $ lttng enable-event --userspace hello_world:my_first_tracepoint $ lttng start $ lttng stop $ lttng view
Open Source Tracing Framework
Kernel space & User space ◦ Kernel modules, User space Library and tools
Command line tools ◦ lttng
◦ Babeltrace
More Info: http://lttng.org/
[18:10:27.684304496] (+?.?????????) hostname hello_world:my_first_tracepoint: { cpu_id = 0 }, { my_string_field = "hi there!", my_integer_field = 23 }
[18:10:27.684338440] (+0.000033944) hostname hello_world:my_first_tracepoint: { cpu_id = 0 }, { my_string_field = "./hello", my_integer_field = 0 }
[18:10:27.684340692] (+0.000002252) hostname hello_world:my_first_tracepoint: { cpu_id = 0 }, { my_string_field = "world", my_integer_field = 1 }
[18:10:27.684342616] (+0.000001924) hostname hello_world:my_first_tracepoint: { cpu_id = 0 }, { my_string_field = "and", my_integer_field = 2 }
[18:10:27.684343518] (+0.000000902) hostname hello_world:my_first_tracepoint: { cpu_id = 0 }, { my_string_field = "beyond", my_integer_field = 3 }
[18:10:27.684357978] (+0.000014460) hostname hello_world:my_first_tracepoint: { cpu_id = 0 }, { my_string_field = "x^2", my_integer_field = 16 }

ftrace – Linux Kernel internal tracer ◦ https://www.kernel.org/doc/Documentation/trace/ftrac
e.txt ◦ https://www.kernel.org/doc/Documentation/trace/event
s.txt
perf – Linux profiling with performance counters ◦ https://perf.wiki.kernel.org/index.php/Main_Page
SystemTap https://sourceware.org/systemtap/ Ktap – Script-based dynamic tracing ◦ http://www.ktap.org/
Dtrace4linux ◦ http://crtags.blogspot.com/
Sysdig ◦ http://www.sysdig.org/

Used for stress testing hardware
Discover Performance Information ◦ bandwidth limits
◦ latencies
I/O engines used: ◦ Sync
◦ Mmmap
◦ Libaio
◦ Posixaio
◦ & more
Works with block devices and virtual files
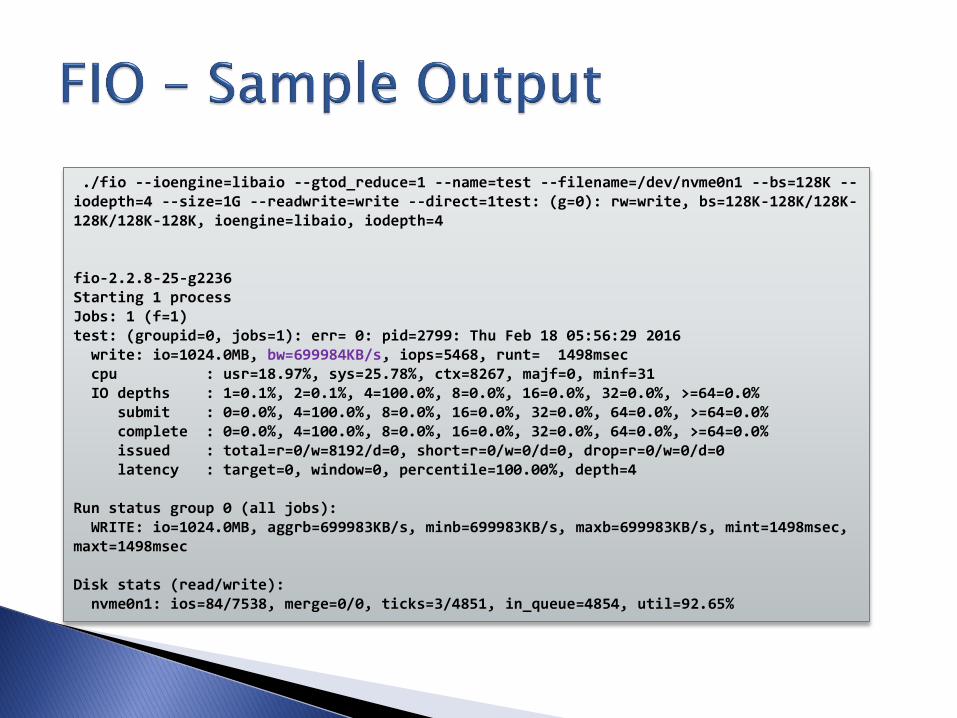
./fio --ioengine=libaio --gtod_reduce=1 --name=test --filename=/dev/nvme0n1 --bs=128K --iodepth=4 --size=1G --readwrite=write --direct=1test: (g=0): rw=write, bs=128K-128K/128K-128K/128K-128K, ioengine=libaio, iodepth=4 fio-2.2.8-25-g2236 Starting 1 process Jobs: 1 (f=1) test: (groupid=0, jobs=1): err= 0: pid=2799: Thu Feb 18 05:56:29 2016 write: io=1024.0MB, bw=699984KB/s, iops=5468, runt= 1498msec cpu : usr=18.97%, sys=25.78%, ctx=8267, majf=0, minf=31 IO depths : 1=0.1%, 2=0.1%, 4=100.0%, 8=0.0%, 16=0.0%, 32=0.0%, >=64=0.0% submit : 0=0.0%, 4=100.0%, 8=0.0%, 16=0.0%, 32=0.0%, 64=0.0%, >=64=0.0% complete : 0=0.0%, 4=100.0%, 8=0.0%, 16=0.0%, 32=0.0%, 64=0.0%, >=64=0.0% issued : total=r=0/w=8192/d=0, short=r=0/w=0/d=0, drop=r=0/w=0/d=0 latency : target=0, window=0, percentile=100.00%, depth=4 Run status group 0 (all jobs): WRITE: io=1024.0MB, aggrb=699983KB/s, minb=699983KB/s, maxb=699983KB/s, mint=1498msec, maxt=1498msec Disk stats (read/write): nvme0n1: ios=84/7538, merge=0/0, ticks=3/4851, in_queue=4854, util=92.65%

On Chip Debugger via JTAG ◦ http://openocd.org/
rr – replay debug sessions ◦ http://rr-project.org/
Valgrind – Mem, Cache, Thread debugging ◦ http://valgrind.org/

Use dd to read/write blocks
Use /dev/urandom to generate random data
Use hexdump to format data
Use tail –f | less (press ‘F’) ◦ To follow log files in real time
Use watch
Automate, Automate, Automate! ◦ Don’t forget shell automation!
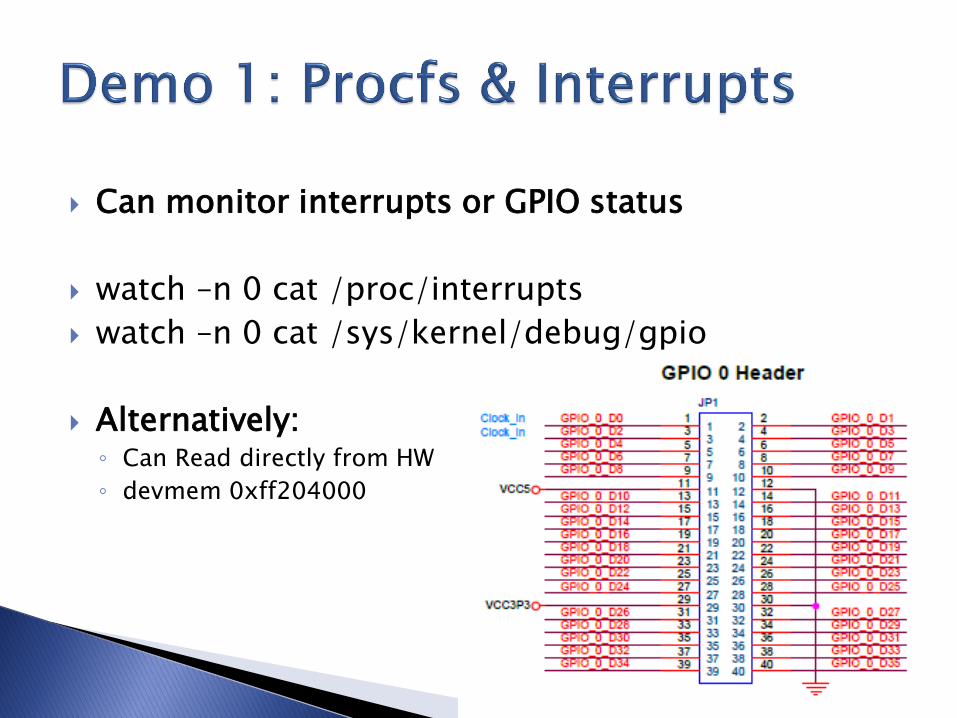
Can monitor interrupts or GPIO status
watch –n 0 cat /proc/interrupts
watch –n 0 cat /sys/kernel/debug/gpio
Alternatively: ◦ Can Read directly from HW
◦ devmem 0xff204000

devmem 0xff200000 32 0 ◦ zero out driving GPIOs ◦ Alternatively, monitor GPIOs:
GPIO 0: devmem 0xff200000
GPIO 1: devmem 0xff200010 = 0xFDFFF7FF
cd ~/gpio
gdb example1 ◦ run GDB on small user space app
(gdb) run
(gdb) p pin
CTRL-C to stop gdb
quit

echo ff205000.gpio > /sys/bus/platform/drivers/altera_gpio/unbind
cd ~/button_led
insmod mod/uio.ko
insmod mod/my_uio_pdrv_genirq.ko
gdb app/example1
(gdb) run
(gdb) p/t count
(gdb) quit
grep irq /sys/kernel/debug/tracing/available_events
echo 'irq:irq_handler_entry' >> /sys/kernel/debug/tracing/set_event
echo 'irq:irq_handler_exit' >> /sys/kernel/debug/tracing/set_event
./app/example1 &
(push buttons on board)
grep “irq=48” /sys/kernel/debug/tracing/trace
(Optional:) echo 1 > events/module/module_(load|free)/enable

Observe virtual file systems ◦ /proc && /sys && /sys/kernel/debug
Monitor log files Utilize devmem to access register and
memory in hardware early in debug Utilize strace and other command line tools! GDB & Eclipse can offer direct debugging with
breakpoints and variable monitoring Utilize available tracer tools, if needed Utilize performance monitoring tools, if
needed

Top 25 Best Linux Performance Monitoring and Debugging Tools
◦ http://www.thegeekstuff.com/2011/12/linux-performance-monitoring-tools/
5 User Space Debugging Tools in Linux
◦ http://linoxide.com/linux-how-to/user-space-debugging-tools-linux/
◦ http://www.thegeekstuff.com/2010/11/50-linux-commands/
/proc
◦ http://www.thegeekstuff.com/2010/11/linux-proc-file-system/
Choosig Linux Tracers – Brendan Gregg
◦ http://www.brendangregg.com/blog/2015-07-08/choosing-a-linux-tracer.html
USB Debuggin Techniques
◦ http://elinux.org/images/1/17/USB_Debugging_and_Profiling_Techniques.pdf
GDB
◦ https://www.gnu.org/software/gdb/
LTTng – Open Source Trace Framework
◦ http://lttng.org/
◦ http://lttng.org/blog/2015/03/18/full-stack-latencies/
openOCD – On-Chip Debugger
◦ http://openocd.org/
Eclipse
◦ https://eclipse.org/

Final slides on:
http://rocketboards.org