
NEXT STEP Choosing a career. ARCHIVIST ??? Think about different aspects for choosing future career.

1
CHOOSING A CAREER IN LANDSCAPE ARCHITECTURE:
DIMENSIONS OF FIT
By
MASON JAY SHAFFER
A thesis submitted in partial fulfillment ofthe requirements for the degree of
MASTER OF SCIENCE IN LANDSCAPE ARCHITECTURE
WASHINGTON STATE UNIVERSITYDepartment of Horticulture & Landscape Architecture
MAY 2010

i

ii
To the Faculty of Washington State University:
The members of the Committee appointed to examine the thesis ofMASON JAY SHAFFER find it satisfactory and recommend that it be accepted.
___________________________________David Wang, Ph.D., Chair
___________________________________Jolie Kaytes
___________________________________Virginia Lohr, Ph.D.

iii
CHOOSING A CAREER IN LANDSCAPE ARCHITECTURE:
DIMENSIONS OF FIT
ABSTRACT
by Mason Jay ShafferWashington State University
May 2010
Chair: David Wang
The market is demanding more Landscape Architecture (LA) graduates. This puts
pressure on stakeholders to fill the demand. Understanding why students choose a major in
LA is essential to developing strategies that will encourage more students to enter the
growing field. This qualitative research tries to enlighten stakeholders about key variables
they need to develop effective strategies by addressing rationale regarding current LA
students: (1) who are they, (2) how did they hear about LA, (3) what do they want, (4) when
do they want it, (5) how do they want it, and (6) why do they want it? Traditional
demographic and psychographic variables are analyzed from the sample of 300+ survey
respondents who are currently majoring in LA at 26 different universities in the United
States. Based on an integrated theoretical framework of intrinsic motivation, psychographic
themes and observations are introduced and defined. This integrated theoretical framework
consists of Personality Theory (Kelly, 1955), Self-Determination Theory (Deci and Ryan,
1985), and the Theory of Multiple Intelligences (Gardner, 1983). Four relevant group
comparisons are performed considering all demographic and psychographic variables. This
iv
data preparation allows thematic findings to be generated. These findings are that LA
students: (1) have abilities that align with design, nature, social interaction, and/or
(surprisingly) music, (2) are passionate about the following topics: the environment,
influencing people, architecture, design, art, music, and/or making the world a better place,
(3) are socially connected, (4) are free spirits, (5) are open-minded about career direction, (6)
are NOT in it for the money, and (7) tend to study at an institution near where they are
already located.

v
TABLE OF CONTENTS
ABSTRACT ........................................................................................................................................iii
LIST OF FIGURES ........................................................................................................................viii
1. INTRODUCTION ........................................................................................................................1
1.1 Archetype Response: Ricky ...................................................................................................................1
1.1.1 LA Industry Strategy: Grow the field...........................................................................................3
1.1.2 Decision-Making as a Process: the AIDA-SC Model ................................................................4
1.1.3 Marketing Strategy 101: Communicate benefits to potential consumers................................6
1.1.4 Foundation for Market Segmentation: Defining psychographic variables .............................6
1.1.5 What this Research Is and What it is NOT.................................................................................8
1.2 Significance: Benefits of this Research ..............................................................................................10
1.2.1 Potential Students..........................................................................................................................10
1.2.2 Landscape Architecture Faculty ..................................................................................................10
1.2.3 American Society of Landscape Architects ...............................................................................11
1.2.4 High School Counselors...............................................................................................................12
1.3 Thesis Organization..............................................................................................................................12
2. THEORETICAL FRAMEWORK............................................................................................13
2.1 How has the question been studied?..................................................................................................13
2.1.1 Generally: Choosing a University................................................................................................13
2.1.2 Generally: Choosing a Major .......................................................................................................15
2.1.3 Specifically: Choosing a Major in Other Disciplines................................................................16
2.1.4 Specifically: Choosing a Major in Landscape Architecture (LA)............................................19

vi
2.1.5 Limitations of Past Research .......................................................................................................21
2.2 Motivational Theory .............................................................................................................................21
2.2.1 Self-Determination Theory (SDT)..............................................................................................22
2.2.2 SDT & Landscape Architecture ..................................................................................................26
2.2.3 Theory of Personal Constructs (PT) ..........................................................................................26
2.2.4 PT & Landscape Architecture .....................................................................................................28
2.2.5 Valued Ability as Multiple Intelligence Theory (MI)................................................................29
2.2.6 MI and Landscape Architecture..................................................................................................32
2.3 Integrated Model: Understanding Intrinsic Motivation Using SDT, PT, & MI..........................32
2.3.1 Benefits of an Integrated Model..................................................................................................34
2.3.2 Theoretical observations based on Integrated Model..............................................................34
3. RESEARCH METHODOLOGY .............................................................................................42
3.1 Research Strategy ..................................................................................................................................42
3.1.1 Focus on how the respondents make sense of their own circumstances .............................42
3.1.2 An emphasis on natural settings..................................................................................................43
3.1.3 The use of multiple tactics ...........................................................................................................43
3.1.4 A focus on interpretation and meaning .....................................................................................43
3.2 Research Tactics and Results ..............................................................................................................44
3.2.1 Survey Instrument .........................................................................................................................45
3.2.2 Statistical Analyses, Results, and Themes ..................................................................................45
4. DISCUSSION ...............................................................................................................................89
4.1 Findings and Implications for LA Stakeholders...............................................................................89
4.2 Limitations & Future Research...........................................................................................................91
4.3 Conclusion .............................................................................................................................................92

vii
REFERENCES.................................................................................................................................93
APPENDIX.......................................................................................................................................96
A. SURVEY INSTRUMENT...................................................................................................96
B. CODER AGREEMENT .................................................................................................. 106
C. GROUP DESCRIPTIVES (GENDER & AWARENESS) ........................................ 115
D. GROUP DESCRIPTIVES (SELECTION & UNIVERSITIES) .............................. 120
E. MULTIPLE INTELLIGENCES GUIDE FOR TRAINING ................................... 125
F. TEN PSYCHOGRAPHIC VARIABLES DEFINED ................................................. 126
viii
LIST OF FIGURES
Figure 1.1: AIDA-SC “Funnel” Model ..............................................................................................5
Figure 1.2: Differences in Research Perspectives ......................................................................................9
Figure 2.1: Summary of Past Research ................................................................................................14
Figure 2.2: Summary of Theoretical Framework..................................................................................22
Figure 2.3: Integrated Model: Motivation, Multiple Intelligence, and Personality (with self and choice) ...33
Figure 3.1: Qualitative Research Diagram...........................................................................................44
Figure 3.2: Descriptive Statistic Summary ...........................................................................................47
Figure 3.3: Boxplot: Age by Gender ...................................................................................................48
Figure 3.4: Schools with Participating Students ...................................................................................51
Figure 3.5: Importance/Performance Graph ........................................................................................52
Figure 3.6: Correlation: Education and Income of Parents ...................................................................55
Figure 3.7: Correlation: Multiple Variables ........................................................................................55
Figure 3.8: Correlation: Factors in Choice of University to Study Landscape Architecture.....................56
Figure 3.9: Correlation: Anticipated Types of Work............................................................................56
Figure 3.10: Variable Meanings for Figures 3.6 – 3.9........................................................................57
Figure 3.11: Clusters: Factors of University Selection ...........................................................................59
Figure 3.12: Clusters: Anticipated Careers of Landscape Architecture Students....................................60
Figure 3.13: Examples: Classifier Avg. Favorite Classes.....................................................................63
Figure 3.14: Clusters: Intrinsic MI (Question-Level: Favorite HS Classes) ..........................................64
Figure 3.15: Clusters: Intrinsic MI (Respondent-Level: Favorite HS Classes) ......................................65
Figure 3.16: Clusters: Extrinsic MI (Question-Level: Other Considered Majors) .................................66

ix
Figure 3.17: Clusters: Extrinsic MI (Respondent-Level: Other Considered Majors) .............................67
Figure 3.18: MI: Favorite High School Classes and Other Considered Majors .....................................68
Figure 3.19: MI: Frequency of Favorite HS Classes and Majors .........................................................69
Figure 3.20: Clusters: AWARE .......................................................................................................70
Figure 3.21: Clusters: CHOICE .......................................................................................................71
Figure 3.22: Clusters: MOTIVATION ...........................................................................................73
Figure 3.23: Clusters: PASSION .....................................................................................................74
Figure 3.24: Clusters: GOALS .........................................................................................................76
Figure 3.25: Clusters: Comparing University Town to Hometown (U-H) ............................................78
Figure 3.26: Social Influence Importance/Performance Graphs (Group Comparisons – F/M &
PSU/WSU).........................................................................................................................................81
Figure 3.27: Social Influence Importance/Performance Graphs (Group Comparisons – Awareness &
Selection)................................................................................................................................................82

1
CHAPTER ONE
INTRODUCTION
1.1 Archetype Response: Ricky1
Ricky is a 24 year old fifth-year student, who is currently finishing his undergraduate
degree in landscape architecture (LA) at a reputable university in the southern United States.
Why and how did he decide to study LA? What factors were influential in his decision? In
understanding this individual story around the decision to study LA, we may better see that
pieces of the story are not only unique to the individual, they have commonality with others
making parallel decisions.
Ricky was born and raised in a town with a population of about 12,000 residents. His
mother never finished high school and works as a bookkeeper while his father attended bud
did not finish college, and works as a used car dealer. His family made a living on a
combined income of around $80,000 per year. During high school, Ricky enjoyed and
excelled in his Calculus, Spanish and English Composition classes. After graduating high
school in 2004, he attended a local junior college to get some of his general education out of
the way. His plan, after two years, was to transfer to the state university (about 15 miles
away) and major in Civil Engineering, Architecture or Psychology. These plans became
altered because of a meeting with his academic advisor at junior college, who introduced
Ricky to LA. Ricky became aware of LA as a consideration for the first time while attending
junior college. After learning more about the use and incorporation of plants in designs, his
1 Ricky is a fictional name used to represent a real story collated from one individual’s responses to the administered survey.
2
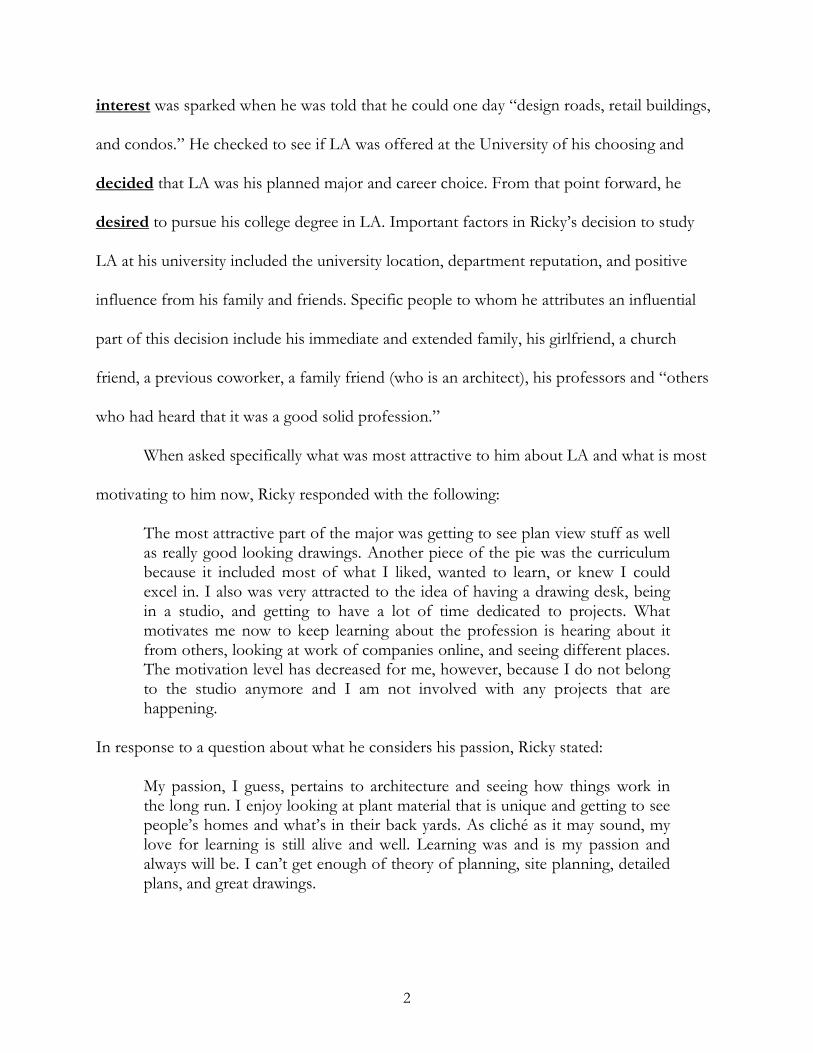
interest was sparked when he was told that he could one day “design roads, retail buildings,
and condos.” He checked to see if LA was offered at the University of his choosing and
decided that LA was his planned major and career choice. From that point forward, he
desired to pursue his college degree in LA. Important factors in Ricky’s decision to study
LA at his university included the university location, department reputation, and positive
influence from his family and friends. Specific people to whom he attributes an influential
part of this decision include his immediate and extended family, his girlfriend, a church
friend, a previous coworker, a family friend (who is an architect), his professors and “others
who had heard that it was a good solid profession.”
When asked specifically what was most attractive to him about LA and what is most
motivating to him now, Ricky responded with the following:
The most attractive part of the major was getting to see plan view stuff as wellas really good looking drawings. Another piece of the pie was the curriculumbecause it included most of what I liked, wanted to learn, or knew I couldexcel in. I also was very attracted to the idea of having a drawing desk, beingin a studio, and getting to have a lot of time dedicated to projects. Whatmotivates me now to keep learning about the profession is hearing about itfrom others, looking at work of companies online, and seeing different places.The motivation level has decreased for me, however, because I do not belongto the studio anymore and I am not involved with any projects that arehappening.
In response to a question about what he considers his passion, Ricky stated:
My passion, I guess, pertains to architecture and seeing how things work inthe long run. I enjoy looking at plant material that is unique and getting to seepeople’s homes and what’s in their back yards. As cliché as it may sound, mylove for learning is still alive and well. Learning was and is my passion andalways will be. I can’t get enough of theory of planning, site planning, detailedplans, and great drawings.

3
Like most young people, Ricky has optimistic anticipations for his future.
Educationally, he “has the feeling to obtain a higher degree of learning in order to have a
bigger job outlook.” He anticipates being involved in the following areas during his career:
design/build, residential design, commercial design, park and recreational design, urban
design, land development, natural resource planning and management, and ecological
restoration and preservation. Ricky foresees being within a managerial role throughout his
career. The extent of his planning and design interests aligns well with the breadth of LA and
sheds some light on additional reasons for his study in the discipline. “Landscape
architecture was something that I could study for very long amounts of time, as well as apply
it in a lot of ways.”
1.1.1 LA Industry Strategy: Grow the field
Ricky serves as an archetype of students in LA programs; however, he is not the only
archetype of student who majors in and anticipates a career in LA. As such, LA programs at
universities, specifically, and through the American Society of Landscape Architects (ASLA),
generally, should recognize that a degree in LA is a product that they offer to a segment of
potential consumers, undergrad college students. As a product offering, a degree in LA is a
“sum total of benefits provided to target” (Kerin and Peterson, 2007). Efforts need to be
made to promote the product, to increase awareness and encourage potential consumers to
become realized customers: LA students. The satisfaction students have during the
undergraduate program determines the long-term commitment and loyalty students will have
toward LA; a strong conviction suggests that these LA students will participate in and
contribute to the LA economy for their entire adult career.

4
According to the Bureau of Labor Statistics, “employment of landscape architects is
expected to increase by 20 percent during the 2008-18 decade, which is much faster than the
average for all occupations” (2010). To meet this demand, LA graduates need to increase by
an average of six percent annually (Caughey, 2006). The ASLA has responded by becoming
highly involved in working with colleges and universities to increase the number of LA
programs offered. The ASLA also has a high school mentoring program in place and is even
working to “target” middle school students.
1.1.2 Decision-Making as a Process: the AIDA-SC Model
As demonstrated by the actions of the ASLA, market demand alone does not fill
seats. Promotional tactics must be implemented to increase awareness among potential
consumers of a LA career. In addition, strategies must be in place to encourage potential
consumers to take action and become customers; that is, LA students. The process of
adopting any product can be modeled using the AIDA-SC model (see Figure 1.1). This basic
concept is to funnel potential consumers closer to adoption and to satisfy those who have
decided to accept the product offering:
Awareness – grabbing the attention of the potential consumers.
Interest – getting the consumers to consider the product offering by communicating
its benefits.
Desire – persuade consumer that the product offering will meet their needs.
Action – convert potential consumers to realized customers.
Satisfaction – satisfy the customers so they don’t defect from the product offering.
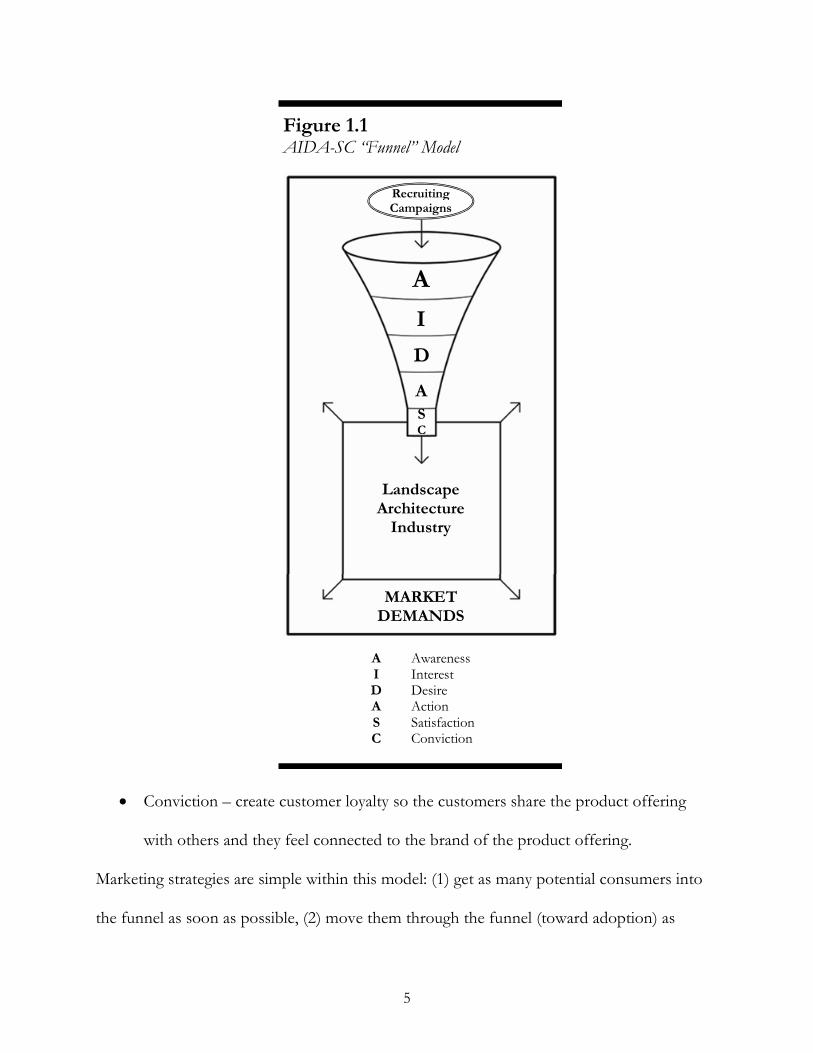
5
Figure 1.1AIDA-SC “Funnel” Model
A AwarenessI InterestD DesireA ActionS SatisfactionC Conviction
A
I
D
LandscapeArchitecture
Industry
MARKETDEMANDS
SC
A
RecruitingCampaigns
Conviction – create customer loyalty so the customers share the product offering
with others and they feel connected to the brand of the product offering.
Marketing strategies are simple within this model: (1) get as many potential consumers into
the funnel as soon as possible, (2) move them through the funnel (toward adoption) as
6
efficiently as possible, and once these potential consumers adopt the product offering and
become realized customers, (3) make them as happy as possible.
1.1.3 Marketing Strategy 101: Communicate benefits to potential consumers
To grow the field of LA, key stakeholders are attempting to promote and sell the idea
of a major and a career in LA. How should such messages be presented to potential
consumers? Simple marketing strategy is as follows: identify the current customers and
understand what benefits they will receive in adopting the product and communicate those
benefits to those considering the product offering. In simple terms, this means one must
identify why the current group loves your product and communicate those reasons to
potential consumers who are aware and interested in order to successfully accelerate their
progress in the funnel.
Such a strategy has two underlying premises: (1) current customers matter and their
perspectives are essential to developing and implementing marketing strategies; and (2)
promotion to potential consumers needs to be based on their needs. Taken together, this is
the basis of the marketing concept: from the beginning, an organization should put the
consumer first, and all of its business activities should align with meeting the needs of the
consumers. Successful organizations implement such market-based strategies. Understanding
the current customer and competing offerings made to potential consumers is the essence of
market orientation.
1.1.4 Foundation for Market Segmentation: Defining psychographic variables
As such, LA recruiters need to do more than recognize the nature of their product
offering; they need to understand potential consumers. Certainly, recruitment should focus
7
on increasing awareness among potential customers before they reach college. In addition,
promotional efforts may change once non-majors reach the university. For those who have
made the choice to major in LA, efforts and programs need to be created to encourage these
students while in their undergraduate programs. Once they complete their degree, students
need to be assisted in beginning their lifelong career within the LA industry.
Although all of these ideas are relevant and of importance, many of them will be
ineffective until an understanding of current customers is fully vetted. It is the intent of this
study to better understand current customers and the benefits of a career in LA, so that
those benefits can be communicated effectively to potential consumers; that is, why does
someone choose to pursue a degree in landscape architecture? To answer such questions, simple
demographics of current students can be gathered, but that is not sufficient to fully
appreciate their motives and rationales for choosing to pursue a degree in LA. For this
reason, psychographic variables need to be defined so the current customers can be
appropriately segmented.
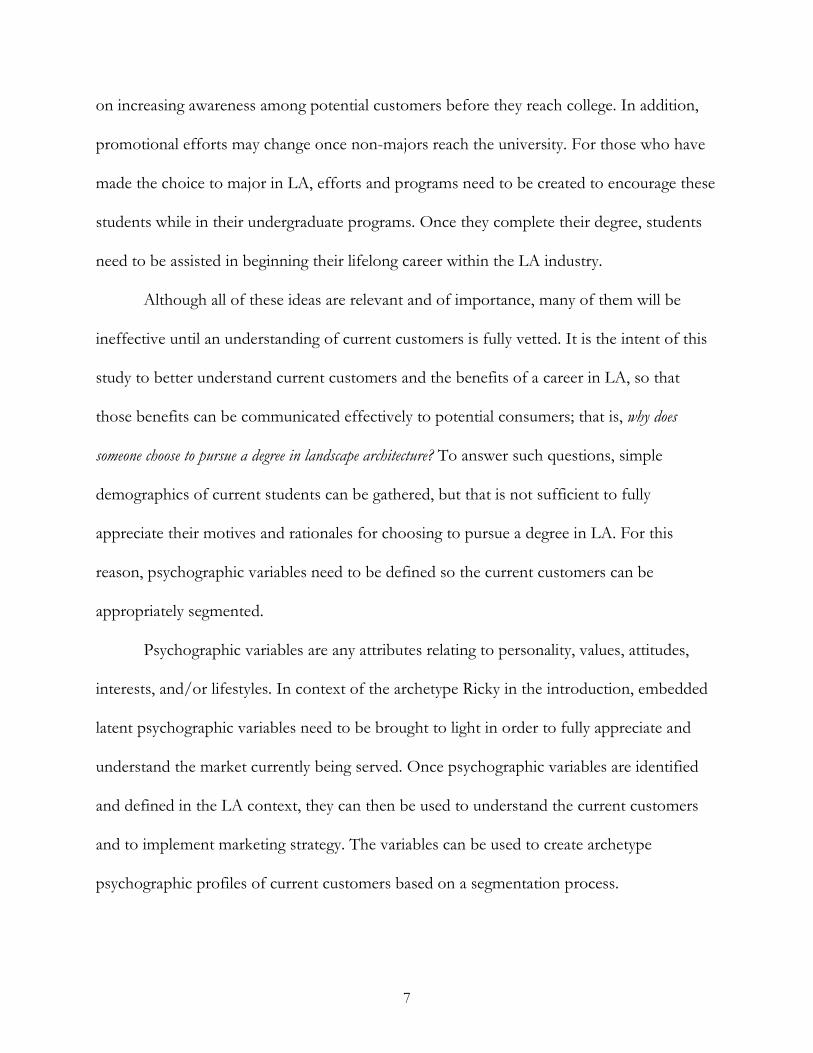
Psychographic variables are any attributes relating to personality, values, attitudes,
interests, and/or lifestyles. In context of the archetype Ricky in the introduction, embedded
latent psychographic variables need to be brought to light in order to fully appreciate and
understand the market currently being served. Once psychographic variables are identified
and defined in the LA context, they can then be used to understand the current customers
and to implement marketing strategy. The variables can be used to create archetype
psychographic profiles of current customers based on a segmentation process.

8
Market segmentation is the process of classifying customers into groups with some
conceptually-meaningful characteristics (Kerin and Peterson, 2007). Such characteristics
generally include demographic and psychographic variables. To appropriately segment a
market, simple questions need to be considered: (1) who is the customer, (2) what do they
want in a product offering, (3) how do they want the product offering, (4) when do they
want the product offering, (5) where do they want the product offering, and (6) why do they
want the product offering. Segmentation has several benefits for developing marketing
strategy. It identifies opportunities for improvement of the current product offering. It also
identifies opportunities for expansion and growth into new markets. Beyond identifying new
opportunities, it is invaluable to manage current marketing programs. Insights from
segmenting the market will improve the allocation of marketing resources and will help in
designing marketing programs that will be most effective in reaching the specific classified
groups (target marketing).
Within this product-consumer concept, it is essential for LA stakeholders to
understand and segment current LA students so better strategies can be developed to
increase awareness, promote the product-offering (degree in LA), increase student interest,
increase student enrollment, and satisfy the student beyond the initial degree so the entire
LA economy can grow and develop.
1.1.5 What this Research Is and What it is NOT
Although this research can provide some initial insights into strategy development, its
purpose is to understand the rationale behind the choice to major in LA, not to develop
myopic short-term strategies. The creation of psychographic variables is a complex process

9
that is intended to broaden and expand the perspectives of the stakeholders and inform
them of the variables that should be considered in understanding the current customers.
Marketing strategies can later be designed and implemented based on some segmentation
process of the psychographic variables introduced and defined in this research.
Figure 1.2Differences in Research Perspectives
Positivist Qualitative
Logic Deduction Induction
Focus Etic Emic
OntologyNaïve Realism "real" reality but
apprehendableRelativism: local and specific
constructed realities
EpistemologyDualist/Objectivist: findings
are trueTransactional/Subjectivist:
Created Findings
Results Verification of Hypotheses Dialectical/Hermeneutical
Findings Data-driven Thematic
In addition, this research represents Qualitative Research. This is many times
misunderstood when a large volume of quantitative data is included in Qualitative Research.
A full description of the methodology will be discussed in Chapter 3; however an overview
of this type of research is summarized in Figure 1.2 which identifies how this research
approach compares to a Positivist Research approach. This research is intended to raise
more questions than it answers and suggest themes in a dialectical format. This research is
not intended to provide simple solutions rather it is intended to expand conceptualization of
and appreciation for the problem.

10
1.2 Significance: Benefits of this Research
This study, which is in the pioneering stages within the discipline, can provide a
significant resource to individuals involved (either directly or indirectly) in LA. Those
involved in recruitment efforts within the discipline (i.e. ASLA, potential students,
professors, department heads, etc.) may use insights from this study to direct their efforts or
create more effective strategies, whereas a high school guidance counselor may use this study
to recognize his/her students’ interests and attributes as they relate to LA students. Below I
describe in more detail benefits of this research, which include identifying potential students,
helping in the recruitment process, and providing guidance to students. These benefits are
not intended to be exhaustive, but do include many of the more apparent influencers.
1.2.1 Potential Students
Students who are thinking of majoring in LA or a closely related field could use the
information from this research to make an informed decision. This study provides data from
current LA students who share the decision-making process they used to select this major. A
potential student could see how his/her motivations, personality, abilities, and even passions
compare with students who study LA to gauge if it is the right field of study for him/her.
1.2.2 Landscape Architecture Faculty
This study is for the LA professor who is interested in the success of his/her students
(both in and out of the classroom) as individuals as well as a collective group. The
understanding of an individual’s motivations, personality, abilities, and passions could
significantly help in the education that each student receives in the classroom or studio.
Professors who serve as advisors can use this information to inform the direction they give

11
to students throughout their college career and even help initiate conversations to
understand a student’s background.
Those involved in recruitment efforts within a LA department can use data from
current students to effectively recruit interested students. For example, if about half of the
students who end up studying LA transfer into the program from either a junior college or
another major at the same university and a large portion of these students transfer from
architecture, the department could focus recruiting efforts on unsatisfied architecture
students at the university or students in courses related to architecture at junior colleges in
order to increase enrollment. It is not a wise use of resources to recruit for recruitment sake,
so this study will provide some direction in these efforts.
1.2.3 American Society of Landscape Architects
The ASLA has taken a large portion of responsibility for increasing enrollment into
LA programs to match the high increase in industry demands. Similar to faculty in an
individual department, but on a broader scale, the ASLA can use this research to increase the
efficiency of their recruitment efforts. A few examples of ways the ASLA could focus their
efforts include: (1) educating youth about LA since about half the population did not learn
about LA as an academic field until after high school, (2) involving youth with professionals
since many students mention the influence of industry individuals on their decision to
pursue a degree in LA, and (3) developing LA programs in states that do not currently offer
a program since about 80% of respondents attended a university in their home state and
about half of respondents chose their university prior to choosing LA as a major. Though
12
some states have multiple LA programs, 14 states (28%) currently are without accredited
undergraduate programs.
1.2.4 High School Counselors
High school guidance counselors can have a significant influence on students’ career
choices. With this study, counselors could evaluate whether students have interests that align
with the students within this research and perhaps suggest LA as a potential field of study in
college. Since the data shows that about half of students are unaware of LA until after high
school, the high school counselor could also educate students about LA. This may require
some education for the counselors from industry representation.
1.3 Thesis Organization
Following this introduction, the thesis is broken into chapters that include
Theoretical Framework, Research Methodology, and Findings and Discussion. The
Theoretical Framework chapter includes a review of the literature surrounding similar
research and introduces the theoretical lens used to get at the central research question. It
also includes the integrated model and observations based on this model. The Research
Methodology chapter introduces the research strategy and tactics used in this research. It
also includes results that were found using the various tactics as well as descriptive statistics.
The Findings and Discussion chapter includes a condensed version of the findings from the
research. It also includes a discussion of the limitations of this study including future
research possibilities prior to concluding the study.

13
CHAPTER TWO
THEORETICAL FRAMEWORK
2.1 How has the question been studied?
Though my specific research question, why does someone choose to pursue a degree in
landscape architecture, and questions like it have not been adequately researched in the
literature, many related studies can inform this research. I will discuss general studies that
deal with students choosing universities and majors. I will then review specific research that
deals with students choosing majors within specific disciplines (including LA). I will focus on
how the past research was performed and what the key findings were. The examples are
intended to show the differing approaches to similar research. See Figure 2.1 for a summary
of this past research.
2.1.1 Generally: Choosing a University
Hemsley-Brown (1999) summarizes the findings of a longitudinal multi-site study
which examined the reasons and motives of 16-year olds choosing among colleges. She
analyzed decision-making processes and strategies, and revealed subjective and objective
approaches in students’ handling of schools’ marketing information. The study concludes
that although students initially base their choices on pre-dispositions and work within social
and cultural frames of reference, young people also rely on the marketing information
provided by colleges to justify their choices and to announce their decisions to others.
Krutii and Fursov (2007) analyzed goals and motives for enrolling in institutions of higher
learning through a survey issued to 590 students in tenth and eleventh grades in the

14
Figure 2.1Summary of Past Research
* SCCT = Social Cognitive Career Theory; TPB = Theory of Planned Behavior; TRA = Theory of Reasoned Action
Author(s) Year Choice TheoryStrategy/Tactics
Key Findings
Hemsley-Brown
1999 University noneQualitative/Longitudinal
• students choose within social/cultural frames,but also rely upon university marketing
information to justify decisionKrutii &Fursov
2007 University noneQualitative/
Survey• main goal of most students is the prospect of
getting a job in the future
Fitzgerald 2003 University noneQualitative/Lit. Review
• persuades students to consider numerous factorsto choose a university based on individual needs
Adragna 2009 Major noneQualitative/
Questionnaire
• higher self-esteem = higher expectations =higher prestige jobs
• children aspire to a higher job prestige than theirparents
Beggs et al 2008 Major noneQuan-Qual/
Survey &Meansend
• important influences:(1) Information Search, (2) Match with Interests,
(3) Job Characteristics, (4) FinancialConsiderations, (5) Psycho/Social Benefits, and
(6) Major AttributesAkbulut et
al2008 IS SCCT*
Quantitative/Survey & PLS
• provided insight into intervention strategies toattract more students to the IS field
Heinze &Hu
2009 ITSCCT* &
TPB*Quantitative/
Survey
• college undergraduates with positive attitudestoward IT careers and high perceived behavioralcontrol regarding IT majors had greater intention
of pursuing IT majors
Kuechler etal
2009 IS noneQualitative/
Survey
• students perceptions shared showed the amountof work needed to get an IS degree along withkeeping up with the training necessary did not
balance with the salary levels
Zhang 2007 IS TRA*Quantitative/
Survey
• important factors influencing intention:(1) Genuine Interest, (2) Job Availability, (3)
Difficulty of Curriculum, and (4) Opinions ofFamily & Professors
McInerneyet al
2006 IT noneQualitative/
Focus Groups
• students were influenced by:(1) positive high school experiences, (2) interest incomputing, (3) an aptitude for math and physics,(4) perceived job prestige, (5) expectation of goodsalary, (6) encouragement of family members, and
(7) influence of key individual (teacher or worksupervisor)
Pollock et al 2002 Accounting noneQualitative/
Survey
• high school guidance counselors’ perceptions ofthe accounting profession are inaccurate and not
very positive
Tan &Laswad
2009 Accounting TPB*Qualitative/
Survey
• higher proportion of accounting students decideon their major prior to university study (as
compared to other business students)
Powers 2000Landscape
Architecturenone
Qual-Quan/Questionnaire
• found factors relating to:(1) student respondents, (2) family, (3) when and
why students chose landscape architecture, and (4)university choice

15
Moscow, Russia area. The results show that the main goal of most students is the prospect
of getting a job in the future. The cumulative rankings of importance of these goals are as
follows: (1) finding work that is good, prestigious, and highly paid, (2) raising the level of
their knowledge, expanding their intellectual horizon, and being well educated, (3) earning
money and having a decent standard of living, (4) acquiring a good education, a profession, a
specialty, and (5) finding a job plus self-realization. Examples of factors that determine a
student’s choice in an institution of higher education are: (1) availability of computers, (2)
availability of sports facilities and equipment, (3) opportunity to combine work and school,
(4) difficulty of the instruction of the institution, (5) difficulty of enrollment in the
institution, (6) popularity/prestige of the institution, (7) proximity of institution to the home,
and (8) sufficient instructors and quality of instruction as a whole. This study ultimately
represents students’ perceptions of their choice of a higher education institution.
To aid in students’ selection of a university, Fitzgerald (2003) outlines a number of
factors that will help students find the best-fit school for their individual needs. Students’
personal factors include interests, level of independence, proximity to family, qualifications,
learning style, expectations, career plans and participation in athletics and activities.
Considerations about the university include size, setting, diversity and climate. In short, this
article is a reference for students and attempts to persuade them to choose their university
based on numerous factors.
2.1.2 Generally: Choosing a Major
Adragna (2009) studied the influences on career choice during adolescence,
specifically career choice and future plans among high school students, to attempt to identify

16
what factors influence students’ career aspirations. Students from two different high schools
participated in a questionnaire that asked students about their academic future, career
aspirations and expectations, and adult influencers. Adragna’s findings show a trend in
children aspiring to a slightly higher level of prestige for their reported real job than that of
their parents. Another finding is that students with high self-esteem have higher expectations
which correlate with higher prestige jobs and vice versa; those with low self-esteem have
lower expectations and lower prestige jobs. In addition, mothers have a significant influence
on their sons’ future aspirations; females have higher career aspirations than males; and
males report higher levels of career indecision than females.
A study by Beggs and colleagues (2008) identified the foundations of the
psychological process by which undergraduate students select their academic majors. They
first used means-end analysis to identify the factors that students consider integral to the
process of selecting a major. They then conducted a large-sample survey of undergraduate
students to better understand how “important” the identified factors are to students as part
of this decision-making process. They finished with feedback from practitioners that helped
in making recommendations for recruiting and advising today’s college students. They found
six categories that influenced students’ choice of major: (1) Information Search, (2) Match
with Interests, (3) Job Characteristics, (4) Financial Considerations, (5) Psycho/Social
Benefits, and (6) Major Attributes.
2.1.3 Specifically: Choosing a Major in Other Disciplines
In recent years, enrollment has declined significantly within majors such as
Information Systems (IS), Information Technology (IT) and Accounting. The research

17
presented here does not give a cause for this decline, but the decline has called for much
research to identify why students choose these fields and how to best attract new students to
them.
Akbulut and colleagues (2008) focused their study on using instrumental assistance to
promote student choice of IS as a primary field of study. They used Social Cognitive Career
Theory (SCCT) (Lent et al, 1994) to frame their research. SCCT outlines three “building
blocks” of career development: self-efficacy, outcome expectations and personal goals. The
study concluded with insight into particular intervention strategies to attract more students
into the IS field. Heinze and Hu (2009) also use SCCT as a framework along with the
Theory of Planned Behavior (TPB) to determine why college undergraduates chose IT.
Kuechler and colleagues (2009) studied why students choose any major in general,
and why students no longer choose to become an IS major in particular. They performed a
detailed survey using 163 responses from students. Their most prominent finding was that
students most affected in their decision to pursue IS already had a “genuine interest” in the
field (“not surprising”). They also identified factors that did not appear to influence this
decision—for example, the promise of good job salaries, job security, the advice of others,
or even the images of those who became IS professionals. Students’ perceptions showed that
it was not fiscally beneficial to go through the amount of work needed to get an IS degree
along with keeping up with the training necessary in the profession with the current salary
levels.
Zhang (2007) also attempted to understand undergraduate students’ intentions to
choose an IS major. He used the Theory of Reasoned Action (TRA) (Ajzen and Fishbein,
18
1980) to categorize factors (presented in previous research) that could influence students’
choices. TRA has three general constructs: behavioral intention, attitude and subjective
norm. Zhang used survey data to test his research model. Results identified “genuine
interest” in IS field, job availability, difficulty of IS curriculum, and opinions from family and
professors as important factors that affect students’ intentions to choose an IS major.
McInerney and colleagues (2006) performed a qualitative study by conducting focus
group interviews with 54 undergraduate university students majoring in computer science,
computer engineering and IT to determine why students choose an IT career. Results
suggest that students were influenced by positive experiences in high school, an interest in
computing, an aptitude for math and physics, the perceived job prestige, the expectation of a
good salary, the encouragement of family members, and the influence of a key individual
such as a teacher or work supervisor.
Enrollment in accounting majors has also declined in recent years. Pollock and
colleagues (2002) explored reasons for this decline specifically by evaluating how high school
guidance counselors (HSGC) perceived the accounting profession. They to surveyed three
hundred randomly selected HSGCs from three different states; of these, 142 usable surveys
were returned. The survey was framed from an extensive existing national dataset. Results
from the survey indicate HSGCs’ perceptions of the accounting profession as inaccurate and
not very positive.
Tan and Laswad (2009) surveyed the same students from their 2006 study in order to
compare results from the beginning and end of the students’ degree program regarding their
major choices, beliefs and attitudes towards majoring in accounting or a non-accounting

19
discipline. They used the theory of planned behavior to compare intentions with behavior in
relation to majoring in accounting and other business disciplines and to examine changes in
attitudes and beliefs between the beginning and end of university study. The results suggest
that a higher proportion of accounting students than other business students decide on their
major prior to university study suggesting that promotion of accounting as a career should
be focused on pre-university study.
2.1.4 Specifically: Choosing a Major in Landscape Architecture (LA)
Not much literature has been directed toward my research topic; there is, however,
one comparable study done by Matthew Powers (2000), an unpublished master’s thesis. His
research began with a research question similar to this study; however, his research methods
differed drastically. His research objectives were “(1) to provide a baseline description of
landscape architecture students regarding their decision to major in landscape architecture
and (2) to explore and describe when and why students made the decision to major in
landscape architecture.” His study was descriptive based on data collected through a
questionnaire that was distributed nationally to undergraduate LA students currently enrolled
in an ASLA-accredited LA program. The total number of respondents was 536 students
from 18 of the 46 nationally accredited schools. His data analysis used simple correlation
methods. His findings were organized into four sections associated with career decision-
making: (1) Questionnaire respondents, (2) Role of family in student choice, (3) Factors
relating to when and why students chose landscape architecture, and (4) Institution choice
and future career choices.
20
2.1.4.1 Questionnaire respondents. Findings indicate that 69% of LA students are male
and 31% are female; 90% of students describe themselves as Caucasian.
2.1.4.2 Role of family in student choice. Findings indicate that 61% of LA students come
from a family with an annual income of $60,000 or more and 70% of landscape architecture
students have at least one parent with a college degree. Parents of 43% of the respondents
influenced their choice of LA as a major and 88% of the respondents considered their
parents as encouraging of this choice.
2.1.4.3 Factors relating to when and why students chose landscape architecture. A
majority (55%) of students transferred into LA from another discipline. Some 30% of
students did not hear of LA until they were enrolled in college. The other 45% of
respondents began college majoring in LA and 24% of respondents heard about LA while in
high school or earlier. Respondents’ decisions influenced by a landscape architect were 19%.
The opportunity to improve the landscape was indicated by 70% of respondents as a reason
for choosing LA as a major. Less than 36% of respondents identified a good salary as
important in choosing LA. As for future employment opportunities, 52% of respondents felt
this was important. Other factors considered important by respondents include (1) a wide
range of opportunity in the profession (36%), (2) the opportunity to pursue art and design
(15%), (3) the enjoyment of the outdoors and nature (8%), and (4) an interest in golf (5%).
2.1.4.4 Institution choice and future career choices. The quality of the institution, as
indicated by 84% of respondents, was an important factor. Other factors included
geographic location, tuition costs, quality of professors, and the reputation of the LA
program.

21
2.1.5 Limitations of Past Research
Past research discussed general university and major choices, but by being general, it
cannot be directly related to specific universities and majors as this study requires. The
research that considered career choice within specific majors outside of LA (i.e. IS, IT, and
Accounting) introduced the need for theory to frame the research. However, these theories
were posed within a single dimension of intrinsic motivation called self-efficacy (which can
be argued to be a form of competence within my framework). Though various theories have
been presented, no individual study has used a multi-theory framework as I use in this study.
To past research, I also contribute the use of multiple statistical lenses to appreciate the
complexity of the problem and identify key themes.
As for the past research most closely aimed at my research topic (i.e. Powers, 2000), I
perceived a study that shared questionnaire data in a written form with little interpretation
beyond the numbers. His study identified numerous factors that could lead someone to the
decision to major in LA, but these factors are without structure, making it difficult to clearly
understand why someone would choose to major in LA. It is difficult to identify any specific
key findings. Also, this research lacks any theoretical framework. I have several open-ended
questions to gauge this choice of major.
2.2 Motivational Theory
To help with a solution to my research question, why does someone choose to pursue a degree
in landscape architecture, I will rely upon motivational theory. Finding answers to a why
question, particularly those that deal with human choice, will require me to search deeper
into the psychology of motivation. To do this, I will first take a broad look at motivational

22
theory then narrow my lens until I have focused on the motivation of an individual. To
better understand the individual, I will also introduce related theories of personality and
intelligence which consistently fit within the chosen motivational meta-theory. See Figure
2.2 for a summary of the theories outlined below.
Figure 2.2Summary of Theoretical Framework
Theory Author(s) Year Brief Description
Self-Determination
Theory
Deci &Ryan
1985
Innate Psychological Needs:• Competence• Autonomy• Relatedness
PersonalityTheory
Kelly 1955
• Fundamental Postulate: A person’s processes arepsychologically channelized by the ways in which heanticipates events.
• Construction Corollary: A person anticipates events byconstruing their replications.
• Individuality Corollary: Persons differ from each other intheir construction of events.
Theory ofMultiple
IntelligencesGardner 1983
Eight Intelligences:• Linguistic: capacity to use language to express self and
understand other people• Musical: capacity to think music (hear, recognize, remember,
and manipulate patterns)• Logical–Mathematical: capacity to understand underlying
principles of a causal system or manipulate numbers• Spatial: ability to represent the spatial world internally in the
mind (a ‘visual person’)• Bodily–Kinesthetic: capacity to use your body to solve a
problem, make something, or put on some kind ofproduction
• Interpersonal: understanding other people• Intrapersonal: understanding of oneself• Naturalist: sensitivity to features of the natural world; ability
to discriminate among living things
2.2.1 Self-Determination Theory (SDT)
Although many theories of motivation exist, I chose to use the theory originated by
Deci and Ryan (1985) called self-determination theory (SDT). Most motivational theories
focus on the energy, but not necessarily the direction of an individual’s motives. SDT
accounts for both energization and direction: “Motivation concerns energy, direction,
23
persistence and equifinality—all aspects of activation and intention” (Ryan and Deci, 2000).
To understand these directional forces of motivation, studies have focused on the two major
types of motivation, intrinsic and extrinsic (internal and external). Simply put, intrinsic
motivation refers to motivation that comes from inside an individual whereas extrinsic
motivation refers to motivation that comes from outside an individual. Intrinsic motivation
is an “inherent tendency to seek out novelty and challenges, to extend and exercise one’s
capacities, to explore, and to learn […] The term extrinsic motivation refers to the
performance of an activity in order to attain some separable outcome and, thus, contrasts
with intrinsic motivation, which refers to doing an activity for the inherent satisfaction of the
activity itself” (Deci and Ryan, 1985). Thus, if intrinsically motivated individuals receive
satisfaction in the activity itself, then it is the extrinsically motivated individuals who receive
satisfaction in the reward or outcome for doing the activity. For example, students are
assigned a math problem; those who are extrinsically motivated complete the problem
because their grade depends on it and those who are intrinsically motivated complete the
problem because it is enjoyable or challenging.
SDT is a “meta-theory of human motivation concerned with the development and
functioning of personality within social contexts. It focuses on the degree to which people
endorse their actions at the highest level of reflection and engage in the actions with a full
sense of choice.” The idea is that a self-determined person experiences life authentically with
a sense of freedom to behave based on personally important information that rejuvenates
and revitalizes the person further encouraging future self-determined behavior. SDT is
concerned with people’s inherent growth tendencies and their innate psychological needs

24
that are exclusive to intrinsic motivation. Specifically, SDT has to do with the motivation
behind choices that are made without extrinsic influence or hindrance. Every person
inherently possesses motivational growth tendencies and the psychological needs that help
encourage these growth tendencies (Deci and Ryan, 1985):
This natural human tendency does not operate automatically, however, butinstead requires ongoing nutriments and supports from the socialenvironment in order to function effectively. That is, the social context caneither support or thwart the natural tendencies toward active engagement andpsychological growth.
Deci and Ryan, within SDT, identify three innate and essential psychological needs:
competence, autonomy and relatedness.
2.2.1.1 Competence. White (1959) pioneered the “concept of competence” within
motivational theory to help fill the gaps left by other theories of the time. He defines
competence as an “organism’s capacity to interact effectively with its environment.” He
argues that competence is the result of gradual learning by organism-environment
interaction. White describes this competence motivation, which he called effectance
motivation, as “directed, selective and persistent, and it is continued… because it satisfies an
intrinsic need to deal with the environment” or, in other words, organisms have an innate
need to experience competence. Additionally, White introduces the idea of play. In times
when competence is suppressed within an organism by the environment, the organism will
adjust and find something in which it has assured competence to pursue. For example, an
individual feeling incompetent within the work environment may go golfing after work to
reestablish psychological competence. White’s concept of competence would provide a
catalyst to theories still to come. The development of competencies—walking, talking or

25
writing—are in part maturational, according to White (1959), but they are in large part
learned, and this learning is motivated. The innate need for competence provides the energy
for this learning. An individual who feels or perceives competence with respect to an activity
places a higher level of importance on this activity because it allows one to attain a goal and
also satisfies a need for engaging in such an activity at which one feels effective. Feelings of
challenge can play a role in competence in that people who are “free of the intrusion of
drives and emotions will seek situations that interest them and require the use of their
creativity and resourcefulness. They seek challenges that are suited to their competencies,
that are neither too easy nor too difficult” (Deci & Ryan, 1985). In short, people need to feel
competent at what they do; only then can they seek further challenges that will ultimately
increase their abilities.
2.2.1.2 Autonomy. Autonomy is simply the governing of self. Autonomy as an innate
psychological need encompasses the idea that individuals need to be free to choose for
themselves, they need to set their own goals and they need to feel in control of their own
lives. This is the experience of choice. The idea of being self-determined is the degree to
which an individual chooses to participate in an action. Causality, not control, is the focus of
external influences on an autonomous, self-determined individual.
2.2.1.3 Relatedness. Individuals desire and, in fact, need to have and develop feelings of
competence and autonomy in the society of others. People have an innate psychological
need to be connected (or have relatedness) with others. It is these relationships that help
encourage intrinsic motivation. Others play a role in the environment in which our personal
needs are encouraged or thwarted. These three basic psychological needs are nutriments for

26
healthy development. They are innate, universal and essential for development in all people,
regardless of gender, race or culture: “to the extent that the needs are ongoingly satisfied,
people will function effectively and develop in a healthy way, but to the extent that they are
thwarted, people will show evidence of ill-being and non-optimal functioning” (Deci &
Ryan, 1985).
2.2.2 SDT & Landscape Architecture
This particular meta-theory of self-determination is a great fit for my research
purposes within LA. This theory draws a clear distinction between inherent (intrinsic)
motivation and learned (extrinsic) motivation. These inherent motivations are revealed as a
discussion of direction and intention is gauged with each LA student. Why did they choose
LA to study, what are their future career goals, what are their passions? Sure some
respondents are interested in learned motivations (like money and recognition), but
ultimately, these questions open understanding into the students inherent motivations (like
personal feelings of success and helping people).
2.2.3 Theory of Personal Constructs (PT)
To help understand the complexity of human motivation as it relates to human
cognition, I include a theory of personality (PT) to ascertain individual differences as they
relate to motivation. As with motivational theories, many different personality theories
abound. Kelly (1955) introduced a theory of personality that is consistent with the chosen
motivational meta-theory. This theory posits that every individual has unique perspectives
(world views) based on anticipations. These anticipations create internal constructions of the
world. Over time, constructions are acted upon, replicated, and refined, which also refines

27
future anticipations. This theoretical structure is consistent with SDT in that it centralizes
emphasis on the internal views of the individual. Constructions can be created that are
consistent with inherent intrinsic motivations; contrarily, they can be created that are
consistent with extrinsic external forces. The former represents alignment with the self-
determined individual to create an authentic self. The latter represents a conflict between
internal motives and external forces which results in an introjected self—a self that is not in
harmony with self-determination.
Kelly’s theory defines personal constructions using phenomenology as the
philosophical lens. Three elements of this theory are fundamental to the research employed
and the methodology implemented to understand LA student motivations.
2.2.2.1 Fundamental Postulate. A person’s processes are psychologically channelized by the ways in
which he anticipates events. The postulate first identifies as its focus the individual person rather
than groups of people or a person’s behavior. Process concerning a person assumes the
person as a form of motion. This person’s processes are “operating in a network of
pathways rather than as fluttering about in a vast emptiness” (Kelly, 1955) or the processes
are channelized. Kelly (1955) describes the last two words of the postulate, anticipates
events, as the place where predictive and motivational features are built into the theory
(Kelly, 1955):
[M]an’s structured network of pathways leads toward the future so that hemay anticipate it. Anticipation is both the push and the pull of the psychologyof personal constructs. Man ultimately seeks to anticipate real events.Anticipation is carried on so that future reality may be better represented. It isthe future which tantalizes man, not the past.

28
2.2.2.2 Construction Corollary. A person anticipates events by construing their replications.
Construing means “placing an interpretation: a person places an interpretation upon what is
construed. Only when man attunes his ear to recurrent themes in the monotonous flow does
his universe begin to make sense to him. Once events have been given their beginnings and
endings, and their similarities and contrasts construed, it becomes feasible to try to predict
them” (Kelly, 1955). Thus, a person attempts to understand a future reality by using patterns
from the past. This is how people view the world—it is their lens.
2.2.2.3 Individuality Corollary. Persons differ from each other in their construction of events. Kelly
(1955) describes this corollary:
People can be seen as differing from each other, not only because there mayhave been differences in the events which they have sought to anticipate, butalso because there are different approaches to the anticipation of the sameevents. No two people can play precisely the same role in the same event, nomatter how closely they are associated. Persons can find common groundthrough construing the experiences of their neighbors along with their own.
Cultural borders are created as individuals cease to seek this common ground with their
neighbor. This is how individual people differ in their views of the world as each sees a
different subjective world.
2.2.4 PT & Landscape Architecture
This theory benefits my research in that it allows me to search for themes among the
respondents, rather than providing simple correlations. The theory states that everyone
anticipates events by the construction of their replications and everyone differs in this
construction process. Yet, there are patterns among the ways in which different people
construct their future. This is also true within the major choice of LA. Clearly, all
participants had constructed a future of majoring in LA, making them all similar but

29
different in the manner in which these constructions took place. Concisely, this theory
justifies patterns found in human behavior while accounting for individuality.
2.2.5 Valued Ability as Multiple Intelligence Theory (MI)
The final key element of my integrated theory is a theory of intelligence. LA students
(like the ones in this research) are labeled “different” but I need a way to capture how
(intellectually) they are different. Therefore, intelligence is another means to understand the
individual’s motivation. Gardner (1983) introduced Frames of Mind: the Theory of Multiple
Intelligences (MI). “Intelligence refers to the human ability to solve problems or to make
something that is valued in one or more cultures” (Gardner, 1997). Intelligence is a function
of the brain and can be expressed through ability. Individuals may possess many or all of the
intelligences, but will continue to rely on one or two as their strengths. “We can all get better
at each of the intelligences, although some people will improve in an intelligence area more
readily than others, either because biology gave them a better brain for that intelligence or
because their culture gave them a better teacher” (Gardner, 1997). Gardner’s original theory
included seven intelligences: linguistic, musical, logical-mathematical, spatial, bodily-kinesthetic,
interpersonal, intrapersonal intelligences. Later, an eighth intelligence was added, naturalist
intelligence (Gardner, 1997), which is meaningful to my research within LA, a career that
directly corresponds with the natural world.
2.2.5.1 Linguistic Intelligence.
Linguistic intelligence is the capacity to use language, your native language,and perhaps other languages, to express what’s on your mind and tounderstand other people. Poets really specialize in linguistic intelligence, butany kind of writer, orator, speaker, lawyer, or a person for whom language isimportant highlights linguistic intelligence (Gardner, 1997).

30
Linguistic intelligence can be a key element for LA professionals and students in their ability
to communicate design textually and verbally.
2.2.5.2 Musical Intelligence.
Musical intelligence is the capacity to think in music, to be able to hearpatterns, recognize them, remember them, and perhaps manipulate them.People who have a strong musical intelligence don’t just remember musiceasily—they can’t get it out of their minds, it’s so omnipresent (Gardner,1997).
This can be a key element for many in LA because of its connections with design. Rhythm
and pattern are essential elements related to both musical and design processes.
2.2.5.3 Logical-Mathematical Intelligence.
People with a highly developed logical-mathematical intelligence understandthe underlying principles of some kind of a causal system, the way a scientistor a logician does; or can manipulate numbers, quantities, and operations, theway a mathematician does (Gardner, 1997).
This can be a key element for landscape architects as it keeps the abstract grounded in
reality. Those involved in the engineering aspects of the discipline rely heavily upon this
ability.
2.2.5.4 Spatial Intelligence.
Spatial intelligence refers to the ability to represent the spatial world internallyin your mind—the way a sailor or airplane pilot navigates the large spatialworld, or the way a chess player or sculptor represents a more circumscribedspatial world. Spatial intelligence can be used in the arts or in the sciences. Ifyou are spatially intelligent and oriented toward the arts, you are more likely tobecome a painter or a sculptor or an architect than, say, a musician or a writer(Gardner, 1997).
This element is really the essence of design; to think spatially to solve problems is a major
part of LA.

31
2.2.5.5 Bodily-Kinesthetic Intelligence.
Bodily kinesthetic intelligence is the capacity to use your whole body or partsof you body—your hand, your fingers, your arms—to solve a problem, makesomething, or put on some kind of a production. The most evident examplesare people in athletics or the performing arts, particularly dance or acting(Gardner, 1997).
This element can be expressed in LA in the spaces that are designed with the human body in
mind.
2.2.5.6 Interpersonal Intelligence.
Interpersonal intelligence is understanding other people. It’s an ability we allneed, but is at a premium if you are a teacher, clinician, salesperson, orpolitician. Anybody who deals with other people has to be skilled in theinterpersonal sphere (Gardner, 1997).
This is a key element in many professions, but it is critical in LA as many designs are for
other people. Clients need to be understood through proper communication in order to
design for someone else’s particular needs.
2.2.5.7 Intrapersonal Intelligence.
Intrapersonal intelligence refers to having an understanding of yourself, ofknowing who you are, what you can do, what you want to do, how you reactto things, which things to avoid, and which things to gravitate toward. We aredrawn to people who have a good understanding of themselves because thosepeople tend not to screw up (Gardner, 1997).
As an element of LA, individual designers understand more about themselves through each
design. Gardens for personal reflection and healing are created for people to better
understand themselves. To understand others, one often times needs to first understand
oneself (one’s fears, joys, emotions, etc.).

32
2.2.5.8 Naturalist Intelligence.
Naturalist intelligence designates the human ability to discriminate amongliving things (plants, animals) as well as sensitivity to other features of thenatural world (clouds, rock configurations). This ability was clearly of value inour evolutionary past as hunters, gatherers, and farmers; it continues to becentral in such roles as botanist or chef. The kind of pattern recognitionvalued in certain of the sciences may also draw upon naturalist intelligence(Gardner, 1997).
This element is the key that sets LA apart from the other design disciplines. The connection
between the built and natural worlds is encompassed within LA. It is this connection that
may, in fact, create the breadth of the discipline.
2.2.6 MI and Landscape Architecture
The theory of multiple intelligences (MI) gives us a unique lens to understand the
distinctive learning paradigms of LA students. Everyone has at least one intelligence (or
ability) that he/she relies upon to continue in his/her preferred learning methods. Using MI
with an application toward LA gives me a way to measure the abilities preferred by LA
students and to what degree the abilities are distributed among the sample.
2.3 Integrated Model: Understanding Intrinsic Motivation Using SDT, PT, & MI
The major rationale for this theoretical framework is not the use of any one theory,
but in how the theories relate to one another (see Figure 2.3). The underlying premise of
this integrated model is that individuals are a sum of their life experiences based on action,
anticipation, construction, and replication and that they are inherently motivated to be self-
determined based on the different abilities (intelligences) that they possess. These abilities
may be valued differently internally than they are valued externally. The juxtaposition of
internal motivations and abilities and external motivations and abilities is the essence of

33
human existence. If unity exists between internal forces and external forces, a synergetic
authentic self will result. If not, the conflict can debilitate the resulting introjected self.
Intrinsic motivation is the key to this integrated model, as it is the basis of Self-
Determination Theory (SDT). It also links to how cognitive anticipations occur (Personality
Theory, PT) and it defines the internal value placed in an individual’s abilities (Theory of
Multiple Intelligences, MI) and how one individually values others (internally based on
meritocracy or externally based on wealth, position, social status).
Figure 2.3Integrated Model: Motivation, Multiple Intelligences, and Personality (with self and choice)
Actual Self
MOTIVATIONDirection
&Intensity
Intrinsic
Extrinsic
InternalForces
ExternalForces
IdealSelf
OughtSelf
Stress / Energy
PERSONALITY
Anticipations
Actions
ConstructionsAutonomy
Competency
Relatedness
Replications
Valued
AbilityIntrojected
Authentic
SDT introduces three dimensions (needs) that ensure intrinsic motivation, whereas
theories used in past research were based in only one dimension (i.e. self-identity). The idea
of direction and energy is a conflict between internal and external motivations. PT is

34
important to understand how individuals view the world around them. It accounts for the
deficiencies of the three needs of SDT. MI helps us understand individuals’ abilities. These
abilities are the limiting factors to one’s world views, or personality. SDT and MI are not
directly related to each other, but each has an important role in PT. Thus, all three of these
theories are critical to understanding intrinsic motivation which ultimately leads to a
student’s choice of major. Additionally, SDT and MI have not been used in this type of
research previously.
2.3.1 Benefits of an Integrated Model
Other reasons for using this integrated model include (1) the underlying internal
drivers are identified without presupposing any extrinsic rationale, (2) the current
anticipations of the LA students are captured based on current world views, (3) the LA
discipline is a field, I would posit, that relies on autonomous, competent persons, (4)
multiple intelligences will help identify certain learning preferences and how they couple with
personality and motivation, and (5) it is conceivable that this model can be used in other
disciplines to study similar research questions.
A survey only captures a snap-shot of the current state of the individual’s
anticipations and constructions; as a result, multiple methods must be used to try to
appreciate the motivations, abilities, and growth of the individual.
2.3.2 Theoretical observations based on Integrated Model
To clarify the integrated model, and to link it to the research at hand, eight
observations will be set forth. With an emphasis on conceptual meaning, anticipated findings
are observed rather than hypothesized. These observations are defined based on the

35
integrated model in context of general understanding of LA. Definition of psychographic
elements will help us clarify and understand these observations. In general, the research
methodology (see Chapter 3) includes fundamental data preparation, which validates each
of these observations according to my integrated model. The discussion following each
observation will also include basis for validation.
2.3.2.1 OBSERVATION #1: Current anticipations are based on historic
constructions and replications. This is the fundamental premise of the integrated model.
This observation suggests integration in the relationship between motivation, ability, external
forces, and personality anticipations. This means that feedback resulting from the
juxtaposition between internal and external factors constantly updates personality
constructions which support or hinder self-determination. The ebb and flow of intrinsic
motivation is an ongoing, dynamic process.
This fundamental principle of endogenous growth appears to be validated.
Thematically, the classifications suggest that history plays an important role in understanding
and identifying the current anticipations of LA students. Students anticipate their future
based on how they constructed the past altered by both internal and external influences. The
proposed model suggests that external influences can be consistent with historic
constructions and anticipations, which in a way refines anticipations but does not alter the
basic construction of the anticipations. On the other hand, certain external influences can
conflict with historic constructions which can cause stress and/or create barriers to
autonomous support. The new concept of self may be altered into an introjected form or the
conflict may generally rob energy. Such conflict may create a change in anticipations in such

36
a way that other alternatives are considered. In context, this suggests that if LA students
defect from the program, it is a result of some event historically that alters anticipations for
the future. If appropriately channeled, this knowledge can be very beneficial to LA
stakeholders.
2.3.2.2 OBSERVATION #2: LA students are intrinsically motivated; that is, intrinsic
factors have greater influence than extrinsic factors. I posit that LA students are
inherently motivated for internal reasons. In general, I believe LA students seek autonomy,
want to feel competent in the activities they perform, and want to relate to the environments
in which they work and to those with whom they collaborate. The idea of intrinsic
motivation is that it is a universal principle; however, this observation suggests that unique
factors drive intrinsic motivation in the LA domain.
The assessment of the data using several different lenses suggests that LA students
are intrinsically motivated. They are inherently interested in aspects of LA that align with
their unique MIs; they demonstrate a desire to feel related to their environment and others
around them; they want autonomous support (to be encouraged in their choices); and it
appears that LA students have self-perceptions of competency as it relates to LA. The ten
newly introduced psychographic variables further validate the idea that students have innate
needs based on their valued abilities (MIs) and that their personalities are a result of the
ongoing process of evaluating and adjusting to the external and internal forces in their lives.
In sum, the integrated model appears to be validated: LA students are intrinsically motivated.
2.3.2.3 OBSERVATION #3: LA students have self-perceived design and nature-
related abilities. The theory of Multiple Intelligences (MI) suggests that individuals value
37
ability differently. I posit that LA students have an inherent intrinsic ability that falls under
the eighth and newest MI, the Naturalist Intelligence. Not only do students have intrinsic
motivation to practice LA and become a landscape architect, they also feel like they have
internal abilities that make them suited for this major and anticipated career. Whether it is a
love for the outdoors, a concern for preserving natural beauty, or a fascination with the
harmonies of living things, all such motivations are linked to the self-perception that a
Naturalist ability exists. In addition, design abilities would suggest that LA students possess
an ability to integrate Spatial Intelligence with this Naturalist Intelligence to logically develop
a design.
Of interest to this observation is the fact that some students were found to have self-
perceived abilities not related directly to design and nature. Certainly the two largest groups
of students have these abilities; a large minority (41% in two smaller groups) have MIs not
directly related to design and nature. The Philosophers are interested in the Verbal-
Linguistic, Interpersonal, and Intrapersonal. They want to discuss, communicate, and reflect
on LA in a fulfillment of their intrinsic motivations to relate to others, feel competent, and
be self-determined. Although not observed initially, retrospection and reflection makes this
finding unsurprising. What is very surprising, however, is that the second minority group can
be identified by its Musical abilities. Although this group has similar Bodily-Kinesthetic
Intelligence as the Designer, the intensity of Musical Intelligence is surprising. Further
research could explore what elements explain this unique and surprising group. Is it the
Pythagorean link of rhythm between music and nature? Does dexterity play a role? What
about the discipline/routine of musical lessons as a child? The applications of this surprising

38
theme are limited only by the imagination: recruiters can target music classes, LA professors
can incorporate music in the teaching/learning process, etc. Such applications again align
with the theoretical concept that follows.
2.3.2.4 OBSERVATION #4: LA students anticipate autonomous support from
mentors. At any given stage of acculturation with LA, students anticipate that those
encouraging them to pursue a career in LA will also encourage and support their
participation in the program. Such support, as defined using the integrated model, would
sustain the unique intrinsic motivation of LA students (see Observation #2).
In Greek Mythology, Mentor was an old friend of Odysseus. Odysseus entrusted his
household to Mentor when he left for war against Troy. The goddess Athena, assuming the
shape of Mentor2, became the guide for Odysseus' son, Telemachus. Being entrusted to give
prudent counsel is the derivation of mentoring and the essence of autonomous support. LA
students want to feel that their counselors, advisors, or mentors are authentically seeking to
support them. Two mentors were identified in the data preparation: high school mentors
and college mentors. In general, all LA students felt college mentors were important, yet felt
the encouragement they received could be improved. High school mentors have meaningful
interpretation in the comparison of two universities that offer degrees in LA. Students from
PSU (which has been considered a top-5 undergraduate program for years) report stronger
importance and encouragement from high school mentors than an average undergraduate
LA program (WSU). As a result, these students declare their major sooner, are younger, and
are more focused in their college experience.
2http://homepage.mac.com/cparada/GML/Mentor4.html
39
2.3.2.5 OBSERVATION #5: University choice constrains LA students’
constructions; major choice liberates LA students’ anticipations. If students first
choose their university and then seek a program in LA, their anticipations and constructions
will be limited by the resources available at the chosen university, constraining the student.
On the other hand, if students choose to seek a degree in LA and then find a university that
fits this criteria, they will have more structural support of their self-determined motives to
study LA and pursue an anticipated career.
Practically, students that choose a university first, then find that it has a LA program
are constrained by the university. What if the university did not offer the LA program? The
students are unlikely to create a construction where they will get a degree in LA because the
anticipation may not even exist. On the other hand, if a LA major is chosen first, students
are liberated to have future anticipations consistent with historic anticipations.
2.3.2.6 OBSERVATION #6: Based on gender, LA students have different
anticipations regarding career. Gender is an important factor with regard to any student
and his/her career path. Specifically within LA, I speculate that LA students will have
different anticipations of their approaching career. This is because they have gender-different
motivations for seeking the major, different MI abilities, and have different constructions.
The gender differences within the program are revealing as they identify specifically
how males and females have different anticipations of their future. Females have more
family support, generally travel further from home to attend a university with LA, and
anticipate naturalistic work more than managerial work. This is intriguing because more
females have design-related abilities than nature related abilities (MI HS classes). Taken

40
together, it would appear that a choice to major in LA and pursue a career is more
conceptual for females. They need more family support and may be pursuing an introjected
career path. Further research would need to be performed to understand some of these
issues, but this research suggests a unique question may exist. ASLA and others recognize
that there is a gender gap, and in promotional efforts to fill the gap.
2.3.2.7 OBSERVATION #7: Students who had exposure to LA before college have
more developed personality constructions, anticipations, and replications. Exposure
to LA prior to college is most likely to be positive. Such exposure would arguably be
encouraging and aligning with intrinsic interests. As a result, anticipations and replications
will have occurred sooner for this individual. The resulting constructions will be more
refined and developed, suggesting the student has a stronger sense of authentic self and is
more self-determined and intrinsically motivated.
The more times anticipations are replicated or realized, the more refined the resulting
construction will be. This implies that the sooner students can become aware of the LA
option, the more time they will have to consider it in their mental processes. These students
have: more conservative views of their career anticipations, more balanced motivations, and
more support from family and landscape influences.
2.3.2.8 OBSERVATION #8: Higher reputation LA programs have students who
have developed more refined constructions. Based on intrinsic motivation and the
integrated model, successful LA programs with a reputation of quality education would
inherently have mechanisms in place to facilitate autonomous support for their students.
41
This would suggest that the LA students would have more opportunities to anticipate
specific future outcomes, refining their constructions.
Students from programs of higher repute generally seem to have a more refined view
of their future careers, are more self-aware about why they chose the LA major, anticipate
more future education in their career development, and appear to have stronger abilities in
specific MIs: Verbal-linguistic, Logical-Mathematical, and Spatial-Visual.
42
CHAPTER THREE
RESEARCH METHODOLOGY
3.1 Research Strategy
To understand why someone chooses to pursue a degree in LA, I used an integrated
research methodology. My intent is to capture qualitative meaning; however, this is achieved
by using both interpretive (coding and analysis) and quantitative tactics based around a
survey instrument. Doing multiple analyses on the same data is an integral part of the chosen
research methodology—a strategy of Qualitative Research, as defined by Groat and Wang
(2002) identifies meaningful themes as they align with a theoretical framework. This strategy
includes four key components that I will discuss in context to my research. These
components of qualitative research are (1) a focus on how the respondents make sense of
their own circumstances, (2) an emphasis on natural settings, (3) the use of multiple tactics,
and (4) a focus on interpretation and meaning.
3.1.1 Focus on how the respondents make sense of their own circumstances
Personal constructions (a corollary from Kelly, 1955) are a basis of my theoretical
lens within my larger meta-framework. This is a phenomenologically-consistent framework
which captures the unique and current world views of the respondents and clusters them to
find similarities or patterns. As the popular vernacular suggests, “You are unique, just like
everyone else.” Individuals construct views of their circumstances in a unique way, but their
pattern of construction will fall in line with others’ personal construction patterns.
43
3.1.2 An emphasis on natural settings
During my data collection, respondents were likely sitting in front of a computer at
the university that they chose to attend, quite possibly within the department with which
they have chosen to pursue their degree in LA and surrounded by fellow students engaged in
similar activities as they explained (through a survey) why they chose this university, why
they chose LA, and other questions of the sort. In short, the students who participated in
this research were in their natural setting.
3.1.3 The use of multiple tactics
The use of multiple tactics strengths in the research as it provides multiple
perspectives of the same data to better grasp the participants and their views. I collected only
one set of data, but it will be analyzed through descriptive, interpretive, and various statistical
lenses. These tactics are a means to triangulate the precise understanding of the validity of
the observations—the more tactics used, the greater the certainty desired conclusions.
3.1.4 A focus on interpretation and meaning
Lee (1991) states that an “interpretive approach maintains that the methods of natural
science are inadequate to the study of social reality. People (and the physical and social
artifacts that they create) create and attach their own meanings to the world around them
and to the behavior that they manifest in that world.” Interpretation is the key player in
grounded theory (Glaser & Strauss, 1998) which I used to focus on meaning. “In grounded
theory, the researcher seeks to enter a setting without preset opinions or notions, lets the
goings-on of the setting determine the data, and then lets a theory emerge from that data.
Once the theory is proposed, other similar settings can be studied to see if the emergent

44
theory has explanatory power” (Groat and Wang, 2002). See Figure 3.1 for my qualitative
research diagram (developed from Wang, 2007) including my research strategy and tactics.
3.2 Research Tactics and Results
As mentioned earlier, the use of multiple tactics is vital to validate my research. I used
a survey instrument to gather data and various data analysis methods to evaluate it. Building
a strong theoretical foundation and using literature from related research was also important
to this study (as outlined in chapter 2). My research tactics are detailed below.
Figure 3.1Qualitative Research Diagram
Qualitative
Literature
Theory
Survey
Coding
Statistics
Descriptive Quantitative Clusters
Interprevist Classifier

45
3.2.1 Survey Instrument
Based on my overall research question, a survey was developed and refined to capture
data consistent with my Qualitative Strategy (see Appendix A). Once the survey was
designed in an online format (using SurveyMonkey), I pilot tested it with a few students,
received feedback, and made improvements. The sample was achieved through the following
technique: All 46 programs offering an ASLA-accredited bachelors degree (within the United
States) were contacted via email after a search of the internet for each university’s LA
department head. Three follow-up emails were sent during the time the survey was active to
encourage and solicit a higher response rate. From my email communications with
department heads, I felt supported in efforts of having a successful survey. Many took an
interest in and even requested the findings of this research. I received responses from 26
universities for a 57% response rate. At the university level, I encouraged the departments to
distribute the survey to all undergraduate students majoring in LA. I was unable to ascertain
exactly how many students received the invite, but I did receive 358 responses, of which 331
were usable. In sum, this convenient, self-selection sample represents more than 300
students who are majoring in LA at 26 universities in 24 states throughout the United States.
3.2.2 Statistical Analyses, Results, and Themes
As stated, several different research approaches and statistical techniques were used
to analyze the data and to help fully appreciate the nuances of the key themes associated
with choosing a major in LA. As such, data analysis is considered an integral tactic of the
qualitative research design and does not stand alone as it does in positivist research. This
section will be outlined as follows: (1) general summary descriptions (of the sample and

46
responses), (2) simple multivariate statistics of factors for a choice of university and
anticipated career, (3) multivariate analysis of multiple intelligence factors (favorite high
school classes and other considered majors), (4) multivariate analysis of interpretive analysis
of key open-ended responses (awareness, goals, choice, motivation, and passion) as well as
descriptives of all open-ended coded responses, (5) and multivariate analysis of geographic
fit based on university and hometown characteristics as defined by the appropriate ZIP
codes which were matched to a secondary dataset provided by the United States Census
Bureau.
3.2.2.1 Summary Description of Data. Contained below is a descriptive and general
summary of my data (see also Figure 3.2). These descriptives are based directly from the
results of the survey instrument and simple correlation analysis (which will come later in the
chapter). This section is outlined as follows: (1) sample characteristics (attributes of the
sample as a whole), (2) home characteristics, (3) parents’ characteristics, (4) school interest
characteristics (other than LA), (5) university characteristics, (6) student intention
characteristics, (7) landscape architecture characteristics, and (8) correlations of descriptive
data.
3.2.2.1.1 Sample Characteristics. The median respondent took 11 minutes to complete the
survey and answered 58 elements. Of those sampled, the average age was calculated to be
approximately 23 years old (M = 23.0, SD = 5.33). I calculated this from the question of
when they graduated from high school (average was between 2004 and 2005) assuming age
18 at graduation. Based on this calculation, more than 60% are estimated to be between the
ages of 20 and 23 with 5 respondents over the age of 40. About 62% were males which

47
Figure 3.2Descriptive Statistic Summary
Statistic TotalAge 23 Years old
Gender62%38%
MaleFemale
Hometown53%32%13%
SuburbanRuralUrban
Parents’ Income $79,000 (mean)
Parents’Education
(4-year degree)
54%50%64%40%
FatherMotherAt least oneBoth
OtherConsidered
Majors
17%9%9%8%
ArchitectureEngineeringBusinessArt/Graphic Ds.
Minor 30% Have a minor
FavoriteHigh School
Classes
14%12%11%10%6%5%5%
ArtMathHistoryEnglishPEDraftingBiology
Univ. Location 80% Same stateHome to Univ. 93 Miles (median)More Education 46% Of respondents
AnticipatedWork
70%63%53%52%51%
Parks/recreationUrban designResidential designDesign/buildEco. restoration
Aware of LA44%44%12%
During high schoolAfter high schoolBefore high school
Declared LAas Major
51%36%
FreshmenSophomores
Transfer into LA 32% From other majorChoice
Univ. vs. LA52%48%
Chose university firstChose LA first
UniversityChoice Factors
74%52%42%41%40%
Univ. locationUniv. reputationLA dept. reputationFinancialFamily/friends
suggests LA programs have more men than women (χ2 (1) = 16.86, p < .01). About 67% of
women and 61% of men fall between the ages of 20 and 23, but there was no significant
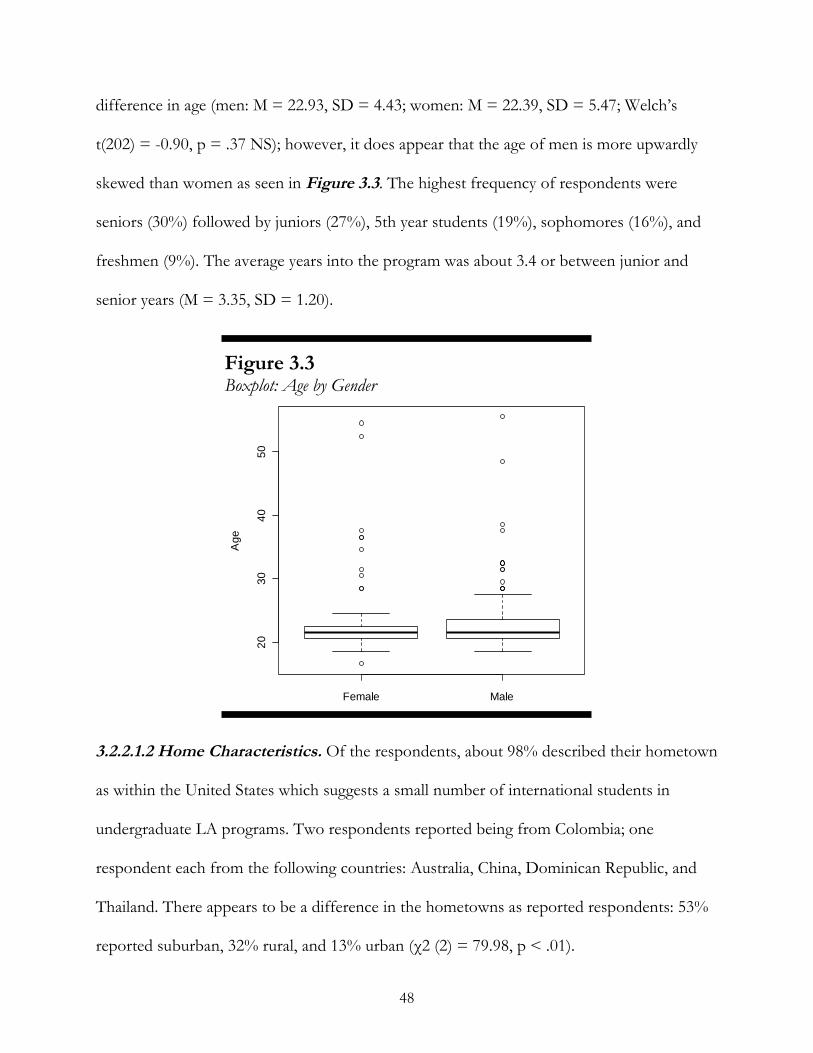
48
difference in age (men: M = 22.93, SD = 4.43; women: M = 22.39, SD = 5.47; Welch’s
t(202) = -0.90, p = .37 NS); however, it does appear that the age of men is more upwardly
skewed than women as seen in Figure 3.3. The highest frequency of respondents were
seniors (30%) followed by juniors (27%), 5th year students (19%), sophomores (16%), and
freshmen (9%). The average years into the program was about 3.4 or between junior and
senior years (M = 3.35, SD = 1.20).
Figure 3.3Boxplot: Age by Gender
Female Male
20
30
40
50
Ag
e
3.2.2.1.2 Home Characteristics. Of the respondents, about 98% described their hometown
as within the United States which suggests a small number of international students in
undergraduate LA programs. Two respondents reported being from Colombia; one
respondent each from the following countries: Australia, China, Dominican Republic, and
Thailand. There appears to be a difference in the hometowns as reported respondents: 53%
reported suburban, 32% rural, and 13% urban (χ2 (2) = 79.98, p < .01).
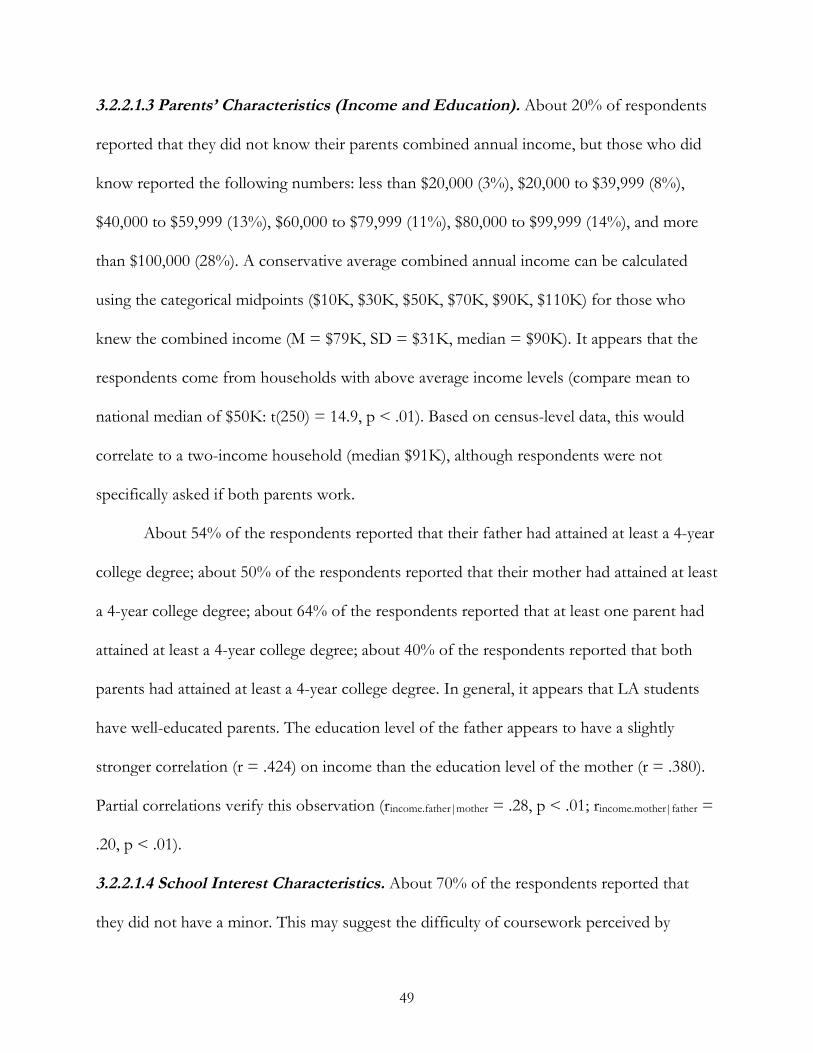
49
3.2.2.1.3 Parents’ Characteristics (Income and Education). About 20% of respondents
reported that they did not know their parents combined annual income, but those who did
know reported the following numbers: less than $20,000 (3%), $20,000 to $39,999 (8%),
$40,000 to $59,999 (13%), $60,000 to $79,999 (11%), $80,000 to $99,999 (14%), and more
than $100,000 (28%). A conservative average combined annual income can be calculated
using the categorical midpoints ($10K, $30K, $50K, $70K, $90K, $110K) for those who
knew the combined income (M = $79K, SD = $31K, median = $90K). It appears that the
respondents come from households with above average income levels (compare mean to
national median of $50K: t(250) = 14.9, p < .01). Based on census-level data, this would
correlate to a two-income household (median $91K), although respondents were not
specifically asked if both parents work.
About 54% of the respondents reported that their father had attained at least a 4-year
college degree; about 50% of the respondents reported that their mother had attained at least
a 4-year college degree; about 64% of the respondents reported that at least one parent had
attained at least a 4-year college degree; about 40% of the respondents reported that both
parents had attained at least a 4-year college degree. In general, it appears that LA students
have well-educated parents. The education level of the father appears to have a slightly
stronger correlation (r = .424) on income than the education level of the mother (r = .380).
Partial correlations verify this observation (rincome.father|mother = .28, p < .01; rincome.mother|father =
.20, p < .01).
3.2.2.1.4 School Interest Characteristics. About 70% of the respondents reported that
they did not have a minor. This may suggest the difficulty of coursework perceived by
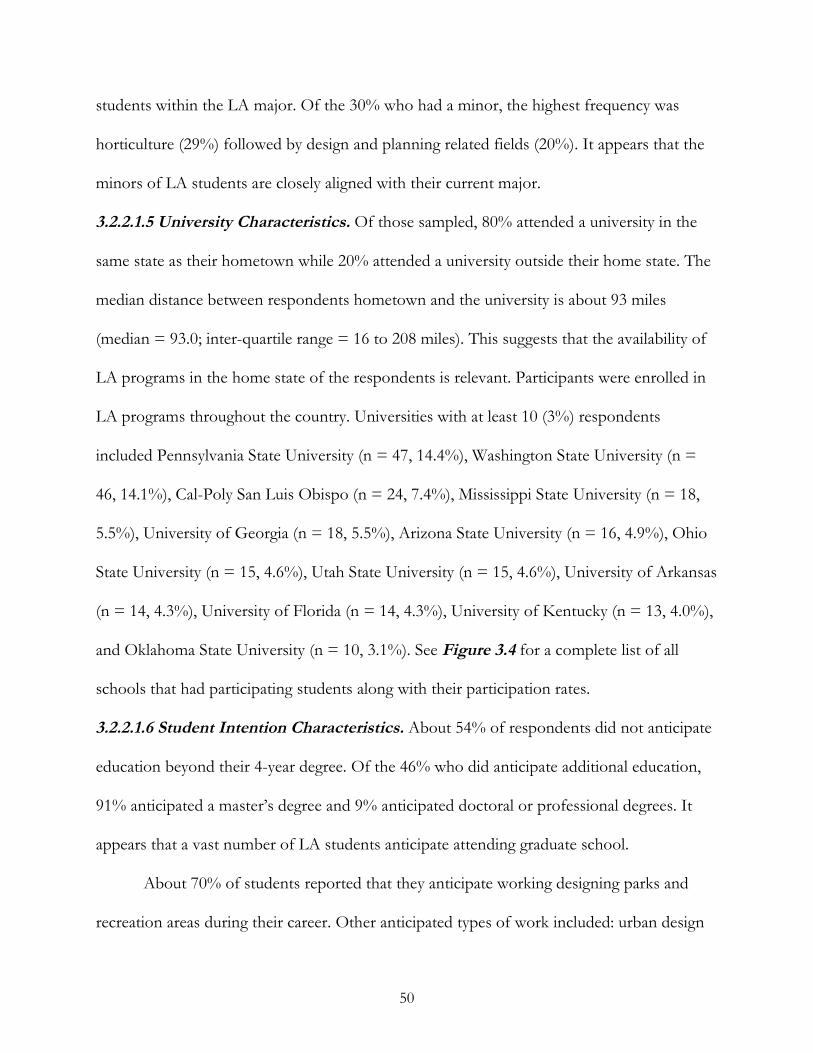
50
students within the LA major. Of the 30% who had a minor, the highest frequency was
horticulture (29%) followed by design and planning related fields (20%). It appears that the
minors of LA students are closely aligned with their current major.
3.2.2.1.5 University Characteristics. Of those sampled, 80% attended a university in the
same state as their hometown while 20% attended a university outside their home state. The
median distance between respondents hometown and the university is about 93 miles
(median = 93.0; inter-quartile range = 16 to 208 miles). This suggests that the availability of
LA programs in the home state of the respondents is relevant. Participants were enrolled in
LA programs throughout the country. Universities with at least 10 (3%) respondents
included Pennsylvania State University (n = 47, 14.4%), Washington State University (n =
46, 14.1%), Cal-Poly San Luis Obispo (n = 24, 7.4%), Mississippi State University (n = 18,
5.5%), University of Georgia (n = 18, 5.5%), Arizona State University (n = 16, 4.9%), Ohio
State University (n = 15, 4.6%), Utah State University (n = 15, 4.6%), University of Arkansas
(n = 14, 4.3%), University of Florida (n = 14, 4.3%), University of Kentucky (n = 13, 4.0%),
and Oklahoma State University (n = 10, 3.1%). See Figure 3.4 for a complete list of all
schools that had participating students along with their participation rates.
3.2.2.1.6 Student Intention Characteristics. About 54% of respondents did not anticipate
education beyond their 4-year degree. Of the 46% who did anticipate additional education,
91% anticipated a master’s degree and 9% anticipated doctoral or professional degrees. It
appears that a vast number of LA students anticipate attending graduate school.
About 70% of students reported that they anticipate working designing parks and
recreation areas during their career. Other anticipated types of work included: urban design

51
Figure 3.4Schools with Participating Students
School n %Pennsylvania State University 47 14.4Washington State University 46 14.1Cal-Poly San Luis Obispo 24 7.4Mississippi State University 18 5.5University of Georgia 18 5.5Arizona State University 16 4.9Ohio State University 15 4.6Utah State University 15 4.6University of Arkansas 14 4.3University of Florida 14 4.3University of Kentucky 13 4.0Oklahoma State University 10 3.1Louisiana State University 9 2.8Iowa State University 8 2.5Michigan State University 7 2.1University of Maryland 7 2.1Virginia Tech University 7 2.1Philadelphia University 6 1.8University of Connecticut 6 1.8University of Nebraska 5 1.5University of Nevada Las Vegas 5 1.5University of Washington 5 1.5North Carolina A&T 4 1.2North Dakota State University 3 0.9Texas Tech University 3 0.9University of Massachusetts 1 0.3
Total 326 100
(63%), residential design (53%), design/build (52%), ecological restoration and preservation
(51%), land development (37%), industrial and commercial design (37%), natural resource
planning and policy (36%), land planning and policy (36%), entrepreneurial (24%), academic
(21%), and managerial (15%) work. About 9% anticipated doing something other than the
listed types of work. This suggests that most LA students anticipate using their degree to
work in many different parts of the field.

52
3.2.2.1.7 Landscape Architecture Characteristics. About 44% of respondents reported
that they first learned of LA as a field they could study at college during high school; about
44% did not know until after high school; the remaining 12% knew before high school. This
suggests a lack of knowledge of LA prior to college enrollment. Of those sampled, about
51% declared their major in LA as a freshman and about 36% as a sophomore. This suggests
that many students initiate their study of LA after beginning college. About 32% of students
transfer into LA from another major. The approximate 20% variation between post-
freshman declared majors and those transferring from other majors may suggest students
transferring from an undeclared major.
Students were asked to describe how their social influencers encouraged their
decision to major in landscape architecture and how important that encouragement was in
Figure 3.5Importance/Performance Graph
Social Influences
1
2
3
4
5
6
7
1 2 3 4 5 6 7
Extended
Family
Immediate
Family
Friends
College
Mentors
High
School
Mentors
Significant
Other
En
cou
rag
emen
t
Importance

53
their major choice. Based on these factors, a simple importance/performance graph can be
created, as seen in Figure 3.5. On the x-axis, the average importance scores are graphed, and
correspondingly, the average encouragement score. The absolute scores suggest that LA
students generally feel encouraged by their social influencers yet find it somewhat
unimportant in the choice they have made. Relative scores within the influencers can be
understood by creating a vertical and horizontal line based on the overall midpoints of
encouragement and importance. Students cited immediate family as the most important in
influence on their decision to major in LA, and felt that this group also encouraged them at
an appropriately high level. The top-right quadrant represents a good fit. Relative importance
is in order: Immediate family (M=3.55), College Mentors (M=3.15), Friends (M=2.54), High
School Mentors (M=2.49), Extended Family (M=2.30), and Significant Other (M=2.14).
Overall, this graph suggests that students may be self-determined, as their social influencers
are all below the scale midpoint (1-7, has a midpoint of 4). They are autonomous. In
addition, the relative measures suggest that of all of the influencers, College Mentors are the
second most important, yet students feel the encouragement they receive from this
influencer is below average. This is a place for improvement.
Students were also asked how they went about choosing their university and major.
Around 52% of respondents reported that they chose their university first, and then chose to
major in LA; 48% chose to major in LA before finding a university that offered it. This
could suggest that over half of potential LA students will study LA only because the school
they chose to attend offers it. About 74% of students reported the location of the university
as a factor that led them to choose their current university to study LA. Other factors
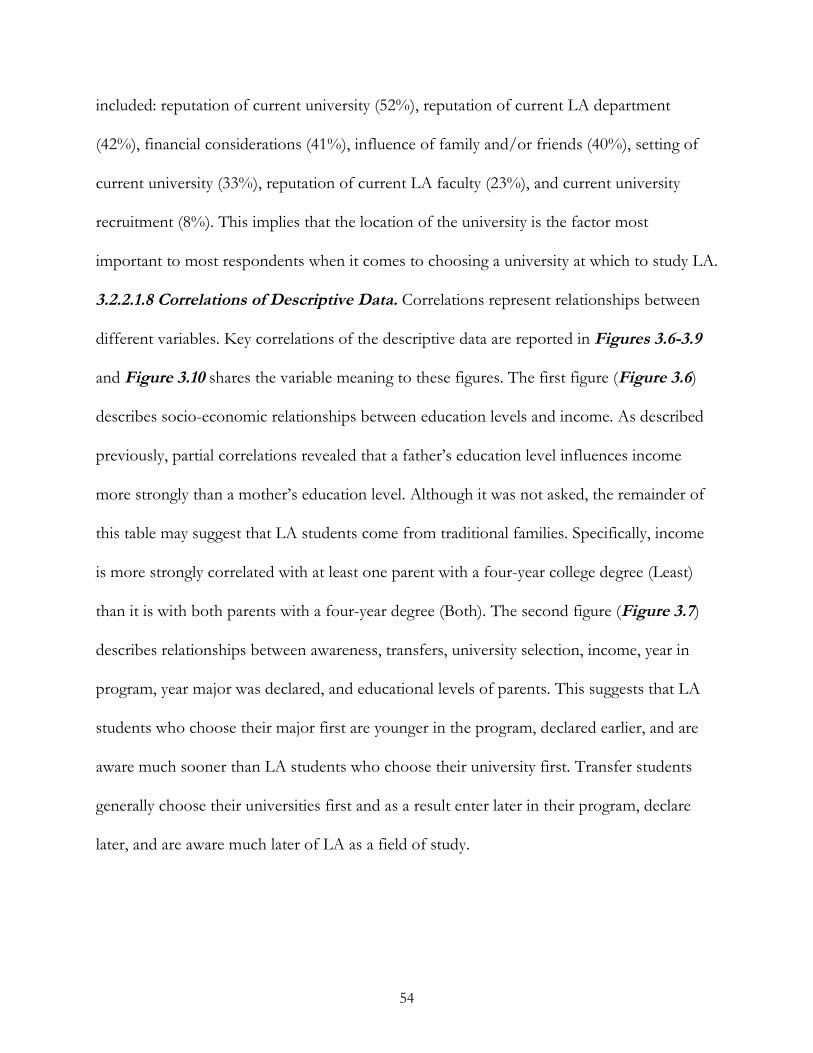
54
included: reputation of current university (52%), reputation of current LA department
(42%), financial considerations (41%), influence of family and/or friends (40%), setting of
current university (33%), reputation of current LA faculty (23%), and current university
recruitment (8%). This implies that the location of the university is the factor most
important to most respondents when it comes to choosing a university at which to study LA.
3.2.2.1.8 Correlations of Descriptive Data. Correlations represent relationships between
different variables. Key correlations of the descriptive data are reported in Figures 3.6-3.9
and Figure 3.10 shares the variable meaning to these figures. The first figure (Figure 3.6)
describes socio-economic relationships between education levels and income. As described
previously, partial correlations revealed that a father’s education level influences income
more strongly than a mother’s education level. Although it was not asked, the remainder of
this table may suggest that LA students come from traditional families. Specifically, income
is more strongly correlated with at least one parent with a four-year college degree (Least)
than it is with both parents with a four-year degree (Both). The second figure (Figure 3.7)
describes relationships between awareness, transfers, university selection, income, year in
program, year major was declared, and educational levels of parents. This suggests that LA
students who choose their major first are younger in the program, declared earlier, and are
aware much sooner than LA students who choose their university first. Transfer students
generally choose their universities first and as a result enter later in their program, declare
later, and are aware much later of LA as a field of study.

55
Figure 3.6Correlation: Education and Income of Parents
*** p < .001; ** p < .01; * p < .05; + p < .10
Father Mother Income BothFather 1Mother 0.53*** 1Income 0.42*** 0.38*** 1Both 0.68*** 0.69*** 0.32*** 1Least 0.72*** 0.69*** 0.36*** 0.60***
Figure 3.7Correlation: Multiple Variables
*** p < .001; ** p < .01; * p < .05; + p < .10
Year Aware Major University Transferred Income FatherYear 1Aware 0.09 1Major 0.06 0.29*** 1University -0.15* -0.33*** -0.24*** 1Transferred 0.17* 0.36*** 0.46*** -0.31*** 1Income -0.08 -0.06 -0.08 -0.02 -0.13* 1Father -0.01 -0.12+ -0.15* -0.07 -0.13+ 0.43*** 1Mother -0.07 0.01 -0.08 -0.20** -0.06 0.38*** 0.52***
Figure 3.8 describes correlations among variables related to university-level factors.
Location and finances are positively correlated whereas finances and LA faculty reputation
are negatively correlated. Taken together, this can partially help identify the interactions of
these different variables. Figure 3.9 describes correlations among variables based on
anticipated careers. Significant relationships in the table are rather consistent across all
variables, so other statistical tactics should be implemented to appreciate how LA students
can be classified based on similar scores.

56
Figure 3.8Correlation: Factors in Choice of University to Study Landscape Architecture
*** p < .001; ** p < .01; * p < .05; + p < .10
Recruited UnivRep Location Setting LA Faculty LA Dept FinancialRecruited 1UnivRep -0.2 1Location 0.09+ 0.15** 1Setting -0.01 0.30*** 0.21*** 1LA Faculty -0.08 0.33*** 0.05 0.06 1LA Dept -0.08 0.33*** 0.08 0.09+ 0.46*** 1Financial 0.09 -0.01 0.19*** 0.06 -0.14* -0.02 1FamFriends 0.05 0.21*** 0.09+ 0.09 0.05 0.08 0.09
Figure 3.9Correlation: Anticipated Types of Work
*** p < .001; ** p < .01; * p < .05; + p < .10
Acad. DesBld Entrep Mngr NatRes Urban LndDev Com Res Ecol LndUse
Academic 1DesBld 0.01 1Entrep 0.06 0.23*** 1Mngr 0.15** 0.18** 0.35*** 1NatRes 0.12 0.08 0.07 0.15** 1Urban 0.17** 0.07 0.05 0.08 0.19*** 1LndDev 0.06 0.18** 0.16** 0.23*** 0.26*** 0.16** 1Com 0.02 0.19*** 0.12* 0.12* 0.12* 0.22*** 0.20*** 1Res -0.02 0.35*** 0.26*** 0.17** 0.10+ 0.16** 0.20*** 0.32*** 1Ecol 0.17** 0.22*** 0.14** 0.16** 0.47*** 0.17** 0.24*** 0.14* 0.09 1LndUse 0.25*** 0.08 0.04 0.12* 0.26*** 0.11* 0.33*** 0.12* -0.05 0.26*** 1PrkRec 0.07 0.21*** 0.14* 0.08 0.23*** 0.32*** 0.23*** 0.21*** 0.29*** 0.31*** 0.13*
3.2.2.2 Simple Multivariate Analysis. As discussed, many different statistical techniques
will be applied to the data to help identify key themes which sets this research apart from
prior studies. Cluster analysis, one form of multivariate analysis, “involves categorization:
dividing a large group of observations into smaller groups so that the observations within
each group are relatively similar (i.e., they possess largely the same characteristics) and the
observations in different groups are relatively dissimilar” (Lattin et al, 2003). In general, it
allows us to take correlated data and find similarities. We can find similarities at the question-
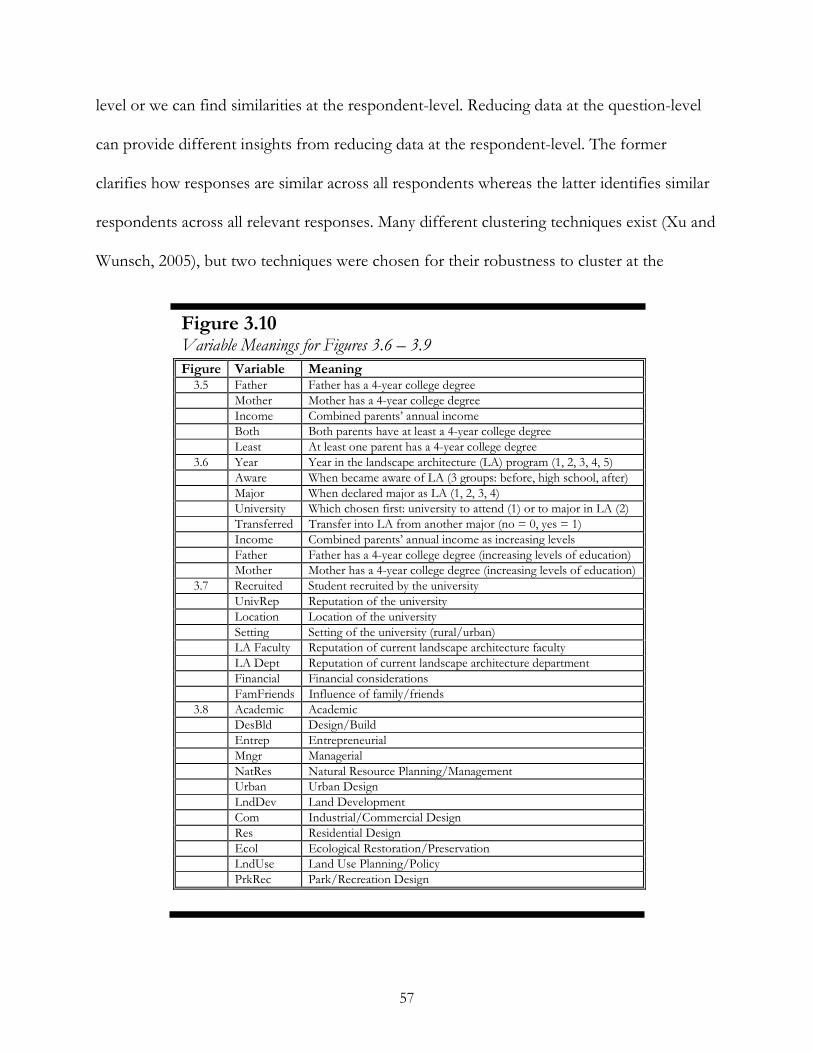
57
level or we can find similarities at the respondent-level. Reducing data at the question-level
can provide different insights from reducing data at the respondent-level. The former
clarifies how responses are similar across all respondents whereas the latter identifies similar
respondents across all relevant responses. Many different clustering techniques exist (Xu and
Wunsch, 2005), but two techniques were chosen for their robustness to cluster at the
Figure 3.10Variable Meanings for Figures 3.6 – 3.9
Figure Variable Meaning3.5 Father Father has a 4-year college degree
Mother Mother has a 4-year college degreeIncome Combined parents’ annual incomeBoth Both parents have at least a 4-year college degreeLeast At least one parent has a 4-year college degree
3.6 Year Year in the landscape architecture (LA) program (1, 2, 3, 4, 5)Aware When became aware of LA (3 groups: before, high school, after)Major When declared major as LA (1, 2, 3, 4)University Which chosen first: university to attend (1) or to major in LA (2)Transferred Transfer into LA from another major (no = 0, yes = 1)Income Combined parents’ annual income as increasing levelsFather Father has a 4-year college degree (increasing levels of education)Mother Mother has a 4-year college degree (increasing levels of education)
3.7 Recruited Student recruited by the universityUnivRep Reputation of the universityLocation Location of the universitySetting Setting of the university (rural/urban)LA Faculty Reputation of current landscape architecture facultyLA Dept Reputation of current landscape architecture departmentFinancial Financial considerationsFamFriends Influence of family/friends
3.8 Academic AcademicDesBld Design/BuildEntrep EntrepreneurialMngr ManagerialNatRes Natural Resource Planning/ManagementUrban Urban DesignLndDev Land DevelopmentCom Industrial/Commercial DesignRes Residential DesignEcol Ecological Restoration/PreservationLndUse Land Use Planning/PolicyPrkRec Park/Recreation Design
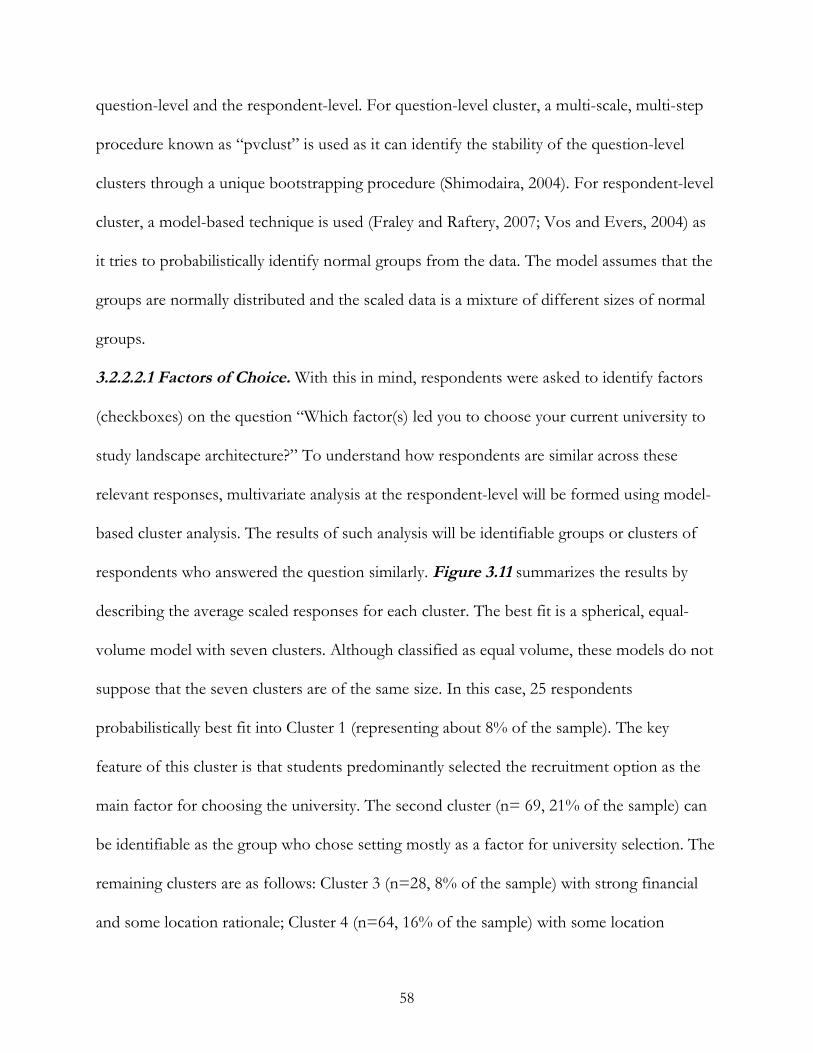
58
question-level and the respondent-level. For question-level cluster, a multi-scale, multi-step
procedure known as “pvclust” is used as it can identify the stability of the question-level
clusters through a unique bootstrapping procedure (Shimodaira, 2004). For respondent-level
cluster, a model-based technique is used (Fraley and Raftery, 2007; Vos and Evers, 2004) as
it tries to probabilistically identify normal groups from the data. The model assumes that the
groups are normally distributed and the scaled data is a mixture of different sizes of normal
groups.
3.2.2.2.1 Factors of Choice. With this in mind, respondents were asked to identify factors
(checkboxes) on the question “Which factor(s) led you to choose your current university to
study landscape architecture?” To understand how respondents are similar across these
relevant responses, multivariate analysis at the respondent-level will be formed using model-
based cluster analysis. The results of such analysis will be identifiable groups or clusters of
respondents who answered the question similarly. Figure 3.11 summarizes the results by
describing the average scaled responses for each cluster. The best fit is a spherical, equal-
volume model with seven clusters. Although classified as equal volume, these models do not
suppose that the seven clusters are of the same size. In this case, 25 respondents
probabilistically best fit into Cluster 1 (representing about 8% of the sample). The key
feature of this cluster is that students predominantly selected the recruitment option as the
main factor for choosing the university. The second cluster (n= 69, 21% of the sample) can
be identifiable as the group who chose setting mostly as a factor for university selection. The
remaining clusters are as follows: Cluster 3 (n=28, 8% of the sample) with strong financial
and some location rationale; Cluster 4 (n=64, 16% of the sample) with some location
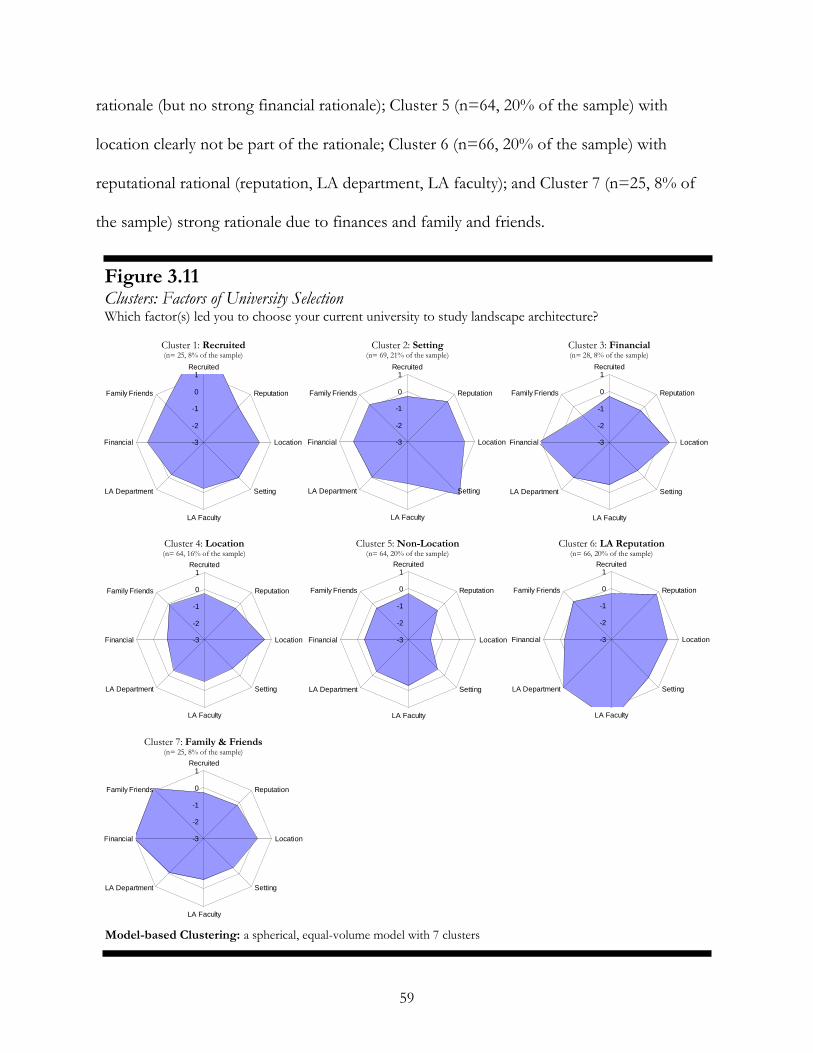
59
rationale (but no strong financial rationale); Cluster 5 (n=64, 20% of the sample) with
location clearly not be part of the rationale; Cluster 6 (n=66, 20% of the sample) with
reputational rational (reputation, LA department, LA faculty); and Cluster 7 (n=25, 8% of
the sample) strong rationale due to finances and family and friends.
Figure 3.11Clusters: Factors of University SelectionWhich factor(s) led you to choose your current university to study landscape architecture?
-3
-2
-1
0
1Recruited
Reputation
Location
Setting
LA Faculty
LA Department
Financial
Family Friends
-3
-2
-1
0
1Recruited
Reputation
Location
Setting
LA Faculty
LA Department
Financial
Family Friends
-3
-2
-1
0
1Recruited
Reputation
Location
Setting
LA Faculty
LA Department
Financial
Family Friends
-3
-2
-1
0
1Recruited
Reputation
Location
Setting
LA Faculty
LA Department
Financial
Family Friends
-3
-2
-1
0
1Recruited
Reputation
Location
Setting
LA Faculty
LA Department
Financial
Family Friends
-3
-2
-1
0
1Recruited
Reputation
Location
Setting
LA Faculty
LA Department
Financial
Family Friends
-3
-2
-1
0
1Recruited
Reputation
Location
Setting
LA Faculty
LA Department
Financial
Family Friends
Model-based Clustering: a spherical, equal-volume model with 7 clusters
Cluster 1: Recruited(n= 25, 8% of the sample)
Cluster 2: Setting(n= 69, 21% of the sample)
Cluster 3: Financial(n= 28, 8% of the sample)
Cluster 4: Location(n= 64, 16% of the sample)
Cluster 5: Non-Location(n= 64, 20% of the sample)
Cluster 6: LA Reputation(n= 66, 20% of the sample)
Cluster 7: Family & Friends(n= 25, 8% of the sample)

60
3.2.2.2.2 Career Anticipations. Similar model-based cluster analysis was prepared for the
question regarding career anticipation: “What type(s) of work do you anticipate doing in
your career?” Similar to the previous clustering, the best fit is also a spherical, equal-volume
model, but this time with 6 clusters as seen in Figure 3.12: Cluster 1 (n=50, 15% of the
sample) represents those anticipating a “Naturalist” career (emphasis on Natural Resources,
Ecological Factors, Parks & Recreation, not Residential/Commercial nor Entrepreneurial);
Cluster 2 (n=48, 15% of the sample) represents the anticipated “Entrepreneurial” career;
Cluster 3 (n=43, 13% of the sample) represents the anticipated “Academic” career; Cluster 4
(n=49, 15% of the sample) represents a group of respondents that did not really fully
Figure 3.12Clusters: Anticipated Careers of Landscape Architecture StudentsWhat type(s) of work do you anticipate doing in your career?
-3
-2
-1
0
1Academic
DesignBuild
Entrepreurial
Managerial
NaturalResource
Urban
LandDevelop
Commercial
Residential
Ecological
LandUse
ParkRecreation
-3
-2
-1
0
1Academic
DesignBuild
Entrepreurial
Managerial
NaturalResource
Urban
LandDevelop
Commercial
Residential
Ecological
LandUse
ParkRecreation
-3
-2
-1
0
1Academic
DesignBuild
Entrepreurial
Managerial
NaturalResource
Urban
LandDevelop
Commercial
Residential
Ecological
LandUse
ParkRecreation
-3
-2
-1
0
1Academic
DesignBuild
Entrepreurial
Managerial
NaturalResource
Urban
LandDevelop
Commercial
Residential
Ecological
LandUse
ParkRecreation
-3
-2
-1
0
1Academic
DesignBuild
Entrepreurial
Managerial
NaturalResource
Urban
LandDevelop
Commercial
Residential
Ecological
LandUse
ParkRecreation
-3
-2
-1
0
1Academic
DesignBuild
Entrepreurial
Managerial
NaturalResource
Urban
LandDevelop
Commercial
Residential
Ecological
LandUse
ParkRecreation
Cluster 1: Naturalist(n=50, 15% of the sample)
Cluster 2: Manager(n=48, 15% of the sample)
Cluster 3: Academic(n=43, 13% of the sample)
Cluster 4: Everyone Else(n=49, 15% of the sample)
Cluster 5: Residential Design/Build(n=89, 27% of the sample)
Cluster 6: Land Developer(n=52, 16% of the sample)
Model-based Clustering: a spherical, equal-volume model with 6 clusters

61
consider the question; Cluster 5 (n=89, 27% of the sample), the largest group, represents
those anticipating a “Residential Design/Build” career; and Cluster 6 (n=52, 16% of the
sample) represents those anticipating a “Land Development Design/Build” career. Taken
together, these clusters give us interesting insights into some anticipations of those pursuing
a degree in landscape architecture and can be mapped to the personality theory of constructs
(differences in anticipations).
3.2.2.3 Multiple Intelligences (clusters). In order to try and capture differences in
Multiple Intelligences (self-reported valued abilities) two groups of questions are considered.
First, students were asked to report their three favorite high school classes. In the second,
students were asked to list other majors they considered (include minors, if they have one).
The former captures some self-perceived strengths based on the assumptions that their
favorite classes were classes students felt competent at (SDT, similar to self-efficacy) and can
be considered an Internal Influence on studying LA. The latter captures other options which
align with External and Extrinsic influences. The process to build Multiple Intelligence
scores was not simple. Six individuals (called classifiers) were found, were trained on the
process of selecting appropriate intelligences for a given response, and selected one or more
intelligence per response. These scores were averaged across classifiers then were averaged
across respondent answers. More detail follows.
Due to the open-ended nature of these questions it was first necessary to combine
responses that were similar. For example, if one respondent put “United States History” as a
favorite high school class and another put “World History” then they were each combined
into “History.” However, the most common reasons for combining responses were
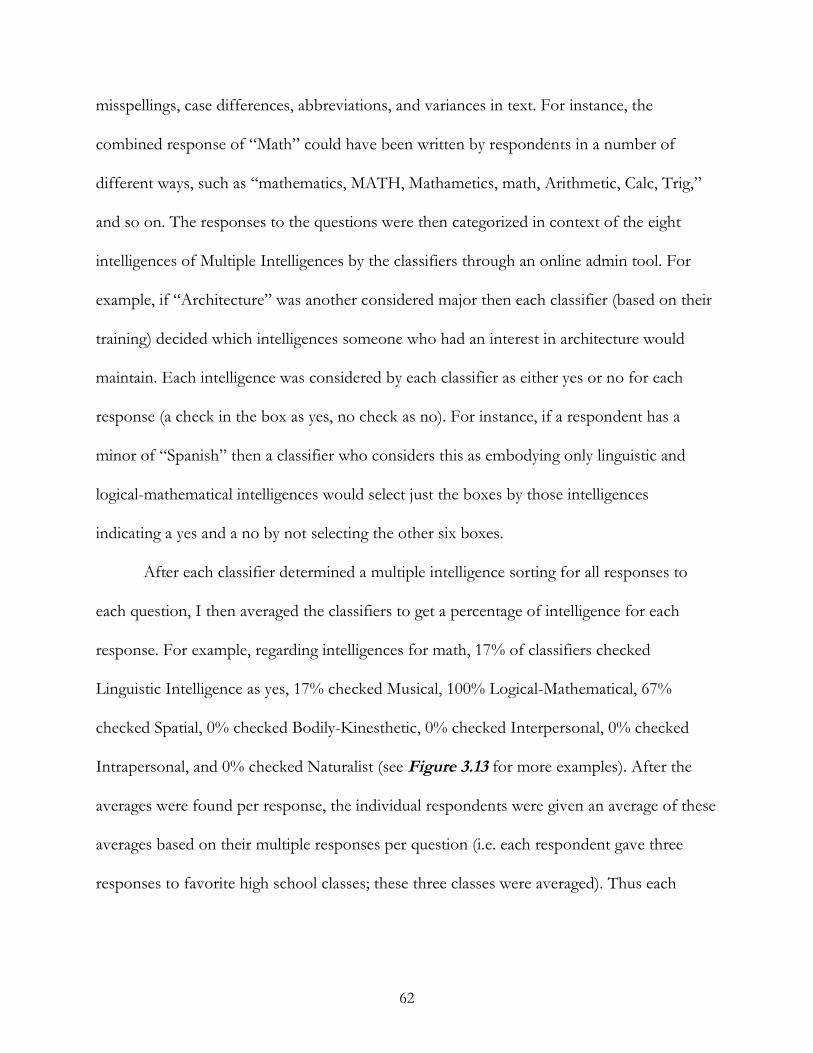
62
misspellings, case differences, abbreviations, and variances in text. For instance, the
combined response of “Math” could have been written by respondents in a number of
different ways, such as “mathematics, MATH, Mathametics, math, Arithmetic, Calc, Trig,”
and so on. The responses to the questions were then categorized in context of the eight
intelligences of Multiple Intelligences by the classifiers through an online admin tool. For
example, if “Architecture” was another considered major then each classifier (based on their
training) decided which intelligences someone who had an interest in architecture would
maintain. Each intelligence was considered by each classifier as either yes or no for each
response (a check in the box as yes, no check as no). For instance, if a respondent has a
minor of “Spanish” then a classifier who considers this as embodying only linguistic and
logical-mathematical intelligences would select just the boxes by those intelligences
indicating a yes and a no by not selecting the other six boxes.
After each classifier determined a multiple intelligence sorting for all responses to
each question, I then averaged the classifiers to get a percentage of intelligence for each
response. For example, regarding intelligences for math, 17% of classifiers checked
Linguistic Intelligence as yes, 17% checked Musical, 100% Logical-Mathematical, 67%
checked Spatial, 0% checked Bodily-Kinesthetic, 0% checked Interpersonal, 0% checked
Intrapersonal, and 0% checked Naturalist (see Figure 3.13 for more examples). After the
averages were found per response, the individual respondents were given an average of these
averages based on their multiple responses per question (i.e. each respondent gave three
responses to favorite high school classes; these three classes were averaged). Thus each
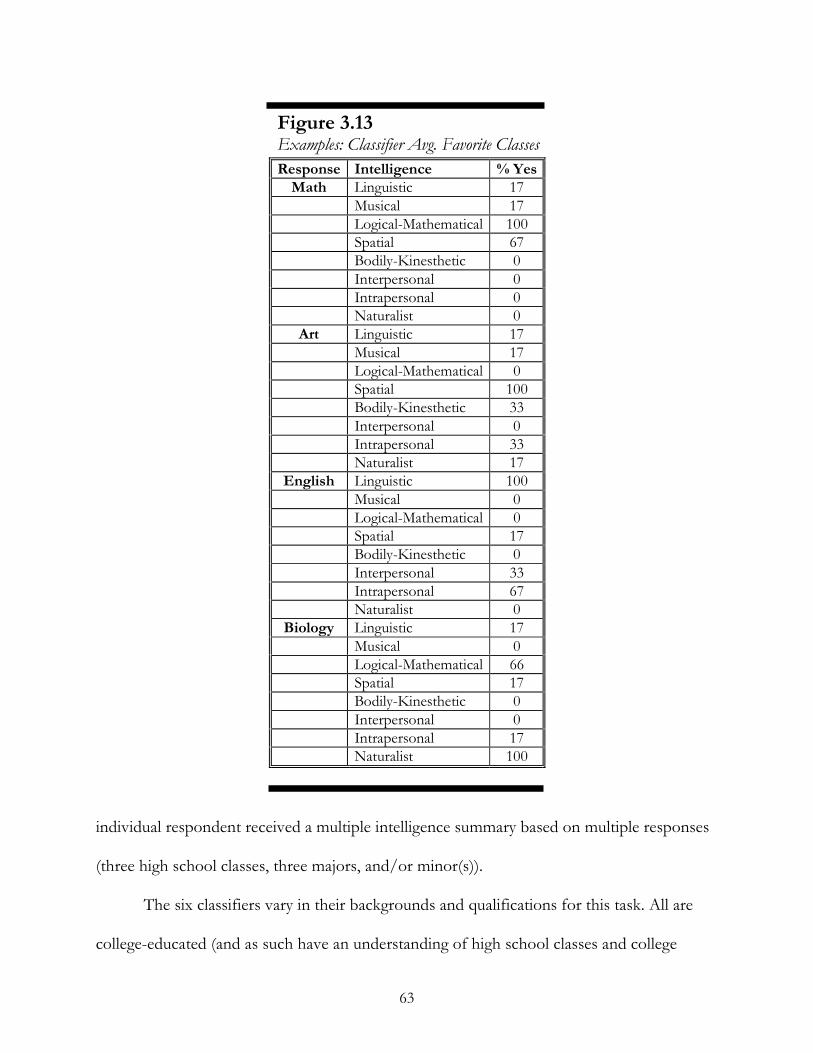
63
Figure 3.13Examples: Classifier Avg. Favorite Classes
Response Intelligence % YesMath Linguistic 17
Musical 17Logical-Mathematical 100Spatial 67Bodily-Kinesthetic 0Interpersonal 0Intrapersonal 0Naturalist 0
Art Linguistic 17Musical 17Logical-Mathematical 0Spatial 100Bodily-Kinesthetic 33Interpersonal 0Intrapersonal 33Naturalist 17
English Linguistic 100Musical 0Logical-Mathematical 0Spatial 17Bodily-Kinesthetic 0Interpersonal 33Intrapersonal 67Naturalist 0
Biology Linguistic 17Musical 0Logical-Mathematical 66Spatial 17Bodily-Kinesthetic 0Interpersonal 0Intrapersonal 17Naturalist 100
individual respondent received a multiple intelligence summary based on multiple responses
(three high school classes, three majors, and/or minor(s)).
The six classifiers vary in their backgrounds and qualifications for this task. All are
college-educated (and as such have an understanding of high school classes and college

64
majors) within the following fields: Business, Chemical Engineering, Elementary Education,
High School Education, Horticulture, and Sociology. Each became fully qualified for
classifying the data after being trained on the Theory of Multiple Intelligences (see
Appendix E).
3.2.2.3.1 Favorite High School Classes. Figure 3.14 shows the question-level clustering of
the classified responses across all respondents. As seen in the dendrogram, certain elements
aggregate: Interpersonal and Verbal with Intrapersonal, followed by Logical-Mathematical
with Naturalist and finally Musical and Bodily Kinesthetic with Spatial-Visual. These three
clusterings could represent three competency perceptions of LA students; however, at the
question-level, further insights are limiting, except maybe to compare this dendrogram with
the “major” dendrogram (which I will do later). To find common themes, a model-based
clustering at the respondent-level will be implemented.
Figure 3.14Clusters: Intrinsic Multiple IntelligencesQuestion-Level: Favorite HS Classes
Intr
ap
ers
on
al
Ve
rbal
Inte
rpers
on
al
Lo
gic
al-
Math
em
atic
al
Natu
ralist
Spa
tia
l-V
isua
l
Mu
sical
Bod
ily-
Kin
est
he
tic
0.2
0.4
0.6
0.8
1.0
1.2
Heig
ht
98
94
89
78
68
63
au
98
93
90
49
38
36
bp
1
2
3
4
5
6
edge #
Bootstrapped Hierarchical Clustering

65
The best fit is an ellipsoidal, equal-shape model with four interpretable clusters as
seen in Figure 3.15. Cluster 1 (n=92, 28% of the sample) has high scores on Spatial-Visual,
Bodily-Kinesthetic, Logical-Mathematical and can be interpreted as the “Designer” LA
students based on favorite high school classes; Cluster 2 (n=98, 30% of the sample) has high
scores on the Naturalist Intelligence and can be interpreted as the “Naturalist” LA students;
Cluster 3 (n=63, 19% of the sample) interestingly contains high scores on Musical and
relatively high scores on Bodily-Kinesthetic and can be interpreted as the “Musician” LA
Figure 3.15Clusters: Intrinsic Multiple IntelligencesRespondent-Level: Favorite HS Classes
-1
0
1Verbal
Musical
Logical-Mathematical
Spatial-Visual
Bodily-Kinesthetic
Interpersonal
Intrapersonal
Naturalist
-1
0
1Verbal
Musical
Logical-Mathematical
Spatial-Visual
Bodily-Kinesthetic
Interpersonal
Intrapersonal
Naturalist
-1
0
1Verbal
Musical
Logical-Mathematical
Spatial-Visual
Bodily-Kinesthetic
Interpersonal
Intrapersonal
Naturalist
-1
0
1Verbal
Musical
Logical-Mathematical
Spatial-Visual
Bodily-Kinesthetic
Interpersonal
Intrapersonal
Naturalist
Cluster 1: Designers(n=92, 28% of the sample)
Cluster 2: Naturalists(n=98, 30% of the sample)
Cluster 3: Musicians(n=63, 19% of the sample)
Cluster 4: Philosophers(n=75, 23% of the sample)
Model-based Clustering: ellipsoidal, equal-shape model with 4 interpretable clusters

66
students; and Cluster 4 (n=75, 23% of the sample) has high scores on the Verbal Intelligence
and relatively high scores on Interpersonal and Intrapersonal and can be interpreted as the
“Philosopher” LA students (those who like to talk, think, reflect).
3.2.2.3.2 Majors and Minors. Figure 3.16 shows the question-level clustering of the
classified responses across all respondents. As seen in the dendrogram, certain elements
aggregate: Interpersonal and Verbal with Intrapersonal, followed by Musical and Bodily
Kinesthetic and finally Logical-Mathematical with Spatial-Visual and Naturalist. These three
clusterings are slightly different from the “favorite high school” dendrogram above as the
Spatial-Visual element aggregates differently. To find common themes, a model-based
clustering at the respondent-level will be implemented.
The best fit is an ellipsoidal, equal-volume and equal-shape model with four
interpretable clusters as seen in Figure 3.17. The interpretation of the clusters can be argued
to be very similar to the results for favorite high school classes. Cluster 1 (n=115, 36% of the
Figure 3.16Clusters: Extrinsic Multiple IntelligencesQuestion-Level: Other Considered Majors
Intr
ap
ers
on
al
Ve
rba
l
Inte
rpe
rso
na
l
Mu
sica
l
Bo
dily-K
ine
sth
etic
Na
tura
list
Lo
gic
al-
Ma
the
ma
tica
l
Sp
atia
l-V
isu
al
0.2
0.4
0.6
0.8
1.0
1.2
He
igh
t
100
9994
82
89
86
au
100
9589
65
72
50
bp
1
23
4
5
6
edge #
Bootstrapped Hierarchical Clustering

67
Figure 3.17Clusters: Extrinsic Multiple IntelligencesRespondent-Level: Other Considered Majors
-1
0
1Verbal
Musical
Logical-Mathematical
Spatial-Visual
Bodily-Kinesthetic
Interpersonal
Intrapersonal
Naturalist
-1
0
1Verbal
Musical
Logical-Mathematical
Spatial-Visual
Bodily-Kinesthetic
Interpersonal
Intrapersonal
Naturalist
-1
0
1Verbal
Musical
Logical-Mathematical
Spatial-Visual
Bodily-Kinesthetic
Interpersonal
Intrapersonal
Naturalist
-1
0
1Verbal
Musical
Logical-Mathematical
Spatial-Visual
Bodily-Kinesthetic
Interpersonal
Intrapersonal
Naturalist
Model-based Clustering: ellipsoidal, equal-volume and equal-shape model with 4 interpretable clusters
Cluster 1: Philosophers(n=115, 36% of the sample)
Cluster 2: Musicians(n=45, 14% of the sample)
Cluster 3: Naturalists(n=71, 22% of the sample)
Cluster 4: Designers(n=75, 23% of the sample)
sample) has relatively high scores on the Verbal , Interpersonal and Intrapersonal and can be
interpreted as the “Philosopher” LA students based on other major considerations and
current applicable minor; Cluster 2 (n=45, 14% of the sample) interestingly also has high
scores on Musical and Intrapersonal and can be interpreted as the “Musician” LA students;
Cluster 3 (n=71, 22% of the sample) has high scores on the Naturalist Intelligence and
relatively high scores on Bodily-Kinesthetic and Musical and can be interpreted as the
“Naturalist” LA students; and Cluster 4 (n=75, 23% of the sample) has high scores on
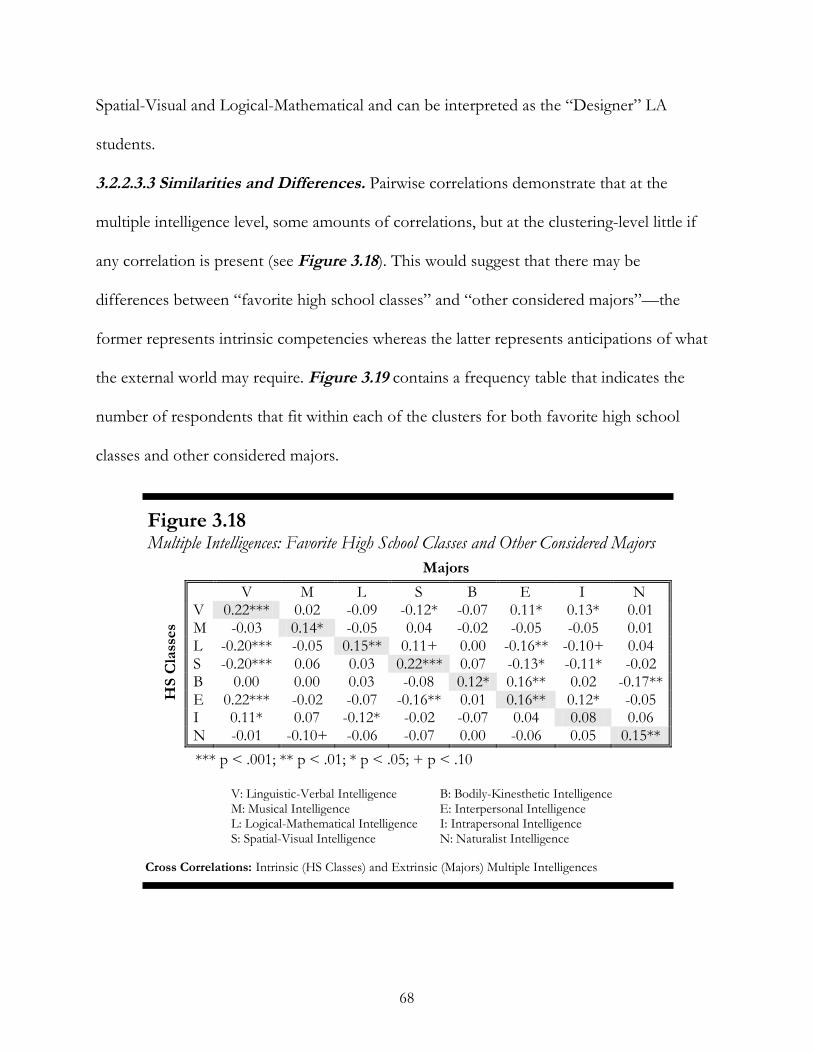
68
Spatial-Visual and Logical-Mathematical and can be interpreted as the “Designer” LA
students.
3.2.2.3.3 Similarities and Differences. Pairwise correlations demonstrate that at the
multiple intelligence level, some amounts of correlations, but at the clustering-level little if
any correlation is present (see Figure 3.18). This would suggest that there may be
differences between “favorite high school classes” and “other considered majors”—the
former represents intrinsic competencies whereas the latter represents anticipations of what
the external world may require. Figure 3.19 contains a frequency table that indicates the
number of respondents that fit within each of the clusters for both favorite high school
classes and other considered majors.
Figure 3.18Multiple Intelligences: Favorite High School Classes and Other Considered Majors
*** p < .001; ** p < .01; * p < .05; + p < .10
V: Linguistic-Verbal Intelligence B: Bodily-Kinesthetic IntelligenceM: Musical Intelligence E: Interpersonal IntelligenceL: Logical-Mathematical Intelligence I: Intrapersonal IntelligenceS: Spatial-Visual Intelligence N: Naturalist Intelligence
V M L S B E I NV 0.22*** 0.02 -0.09 -0.12* -0.07 0.11* 0.13* 0.01M -0.03 0.14* -0.05 0.04 -0.02 -0.05 -0.05 0.01L -0.20*** -0.05 0.15** 0.11+ 0.00 -0.16** -0.10+ 0.04S -0.20*** 0.06 0.03 0.22*** 0.07 -0.13* -0.11* -0.02B 0.00 0.00 0.03 -0.08 0.12* 0.16** 0.02 -0.17**E 0.22*** -0.02 -0.07 -0.16** 0.01 0.16** 0.12* -0.05I 0.11* 0.07 -0.12* -0.02 -0.07 0.04 0.08 0.06N -0.01 -0.10+ -0.06 -0.07 0.00 -0.06 0.05 0.15**
Majors
HS
Cla
sses
Cross Correlations: Intrinsic (HS Classes) and Extrinsic (Majors) Multiple Intelligences

69
Figure 3.19Multiple Intelligences: Frequency of Favorite HS Classes and Majors
Philosophers Musicians Naturalists DesignersPhilosophers 28 10 14 22Musicians 24 7 15 17Naturalists 35 16 16 26Designers 28 12 25 24
MajorsH
SC
lass
es
Contingency Table: Count of students that meet classification criteria
3.2.2.4 Coding (clusters). Several open-ended responses were asked on the survey that can
help identify themes related to choosing LA as a major at the student’s university. The open-
ended question is a challenge to analyze, but it is a beneficial question-type as it does not
impose or presuppose a set of answers, making it possible to carry out interpretive analysis.
This is a grounded-theory approach where no assumptions are made. Based on the data,
responses are categorized into themed elements and two independent coders (qualified by
ability to analyze responses and categorize content) are trained to review a response and
identify the categorized elements. Many times, this is performed with a simple dichotomy
category, but due to the nature of this research, the goal being to identify all possible
relationships, multiple categorizations occurred. An online tool was built to allow the
independent coders to see the open-ended responses and then determine if a response was
relevant to the categories created. Training occurred with sample subjects randomly selected
across the open-ended responses. Across all open-ended responses, an average weighted
agreement of 96% was reported between the independent coders with an overall Cohen’s
kappa statistic of 0.79 which suggests substantial agreement. Appendix B reports the details
of the agreement across questions and categories: nine questions were coded using this

70
Figure 3.20Clusters: AWAREPlease describe HOW you became aware of Landscape Architecture.
-3
-2
-1
0
1Architecture Interest
Architecture Not
Art Interest
Design Interest
Family Influence
Friend Influence
Landscaper Influence
Outdoor Interest
Personal Searching
Plant Interest
Prior Employment
Scholastic Advising
University Program
Other
-3
-2
-1
0
1Architecture Interest
Architecture Not
Art Interest
Design Interest
Family Influence
Friend Influence
Landscaper Influence
Outdoor Interest
Personal Searching
Plant Interest
Prior Employment
Scholastic Advising
University Program
Other
-3
-2
-1
0
1Architecture Interest
Architecture Not
Art Interest
Design Interest
Family Influence
Friend Influence
Landscaper Influence
Outdoor Interest
Personal Searching
Plant Interest
Prior Employment
Scholastic Advising
University Program
Other
Cluster 1: Landscaper Influence(n=55, 17% of the sample)
Cluster 2: Friend Influence(n=46, 14% of the sample)
Cluster 3: Everyone Else(n=230, 70% of the sample)
Model-based Clustering: ellipsoidal, equal-volume and equal-shape model with 3 interpretable clusters
technique meaning over 3000 open-ended responses needed to be considered; 152 categories
were identified across the nine questions and over 4000 categorizations occurred. This
provides a rich amount of data that may be used to discover additional themes that could
further understandings of LA students. Final coding decisions were made by the principal
investigator with the input from the independent coders on why they chose the given
response. Of key interest are five specific open-ended questions.
The first question (AWARE) is “please describe HOW you became aware of
Landscape Architecture.” The best fit is an ellipsoidal, equal-volume and equal-shape model
with three interpretable clusters as seen in Figure 3.20: Cluster 1 (n=55, 17% of the sample)
represents those with high scores on Landscaper Influence and moderate scores on Family
Influence; Cluster 2 (n=46, 14% of the sample) represents those high scores on Friend
Influence, Prior Employment, and Plant Interest; Cluster 3 (n=230, 70%) represents
everyone else (not much to glean from this one).

71
Figure 3.21Clusters: CHOICEWhy did you choose landscape architecture as your major?
-3
-2
-1
0
1Outdoor Interest
Planning Interest
Plant Interest
Art Interest
Architecture Interest
Design Interest
Landscaping Interest
Environmental Reasons
Human InteractionFuture Impact
Mentored
Industry Breadth
Passion
Good Fit
Challenge
Interdisciplinary
Other
-3
-2
-1
0
1Outdoor Interest
Planning Interest
Plant Interest
Art Interest
Architecture Interest
Design Interest
Landscaping Interest
Environmental Reasons
Human InteractionFuture Impact
Mentored
Industry Breadth
Passion
Good Fit
Challenge
Interdisciplinary
Other
-3
-2
-1
0
1Outdoor Interest
Planning Interest
Plant Interest
Art Interest
Architecture Interest
Design Interest
Landscaping Interest
Environmental Reasons
Human InteractionFuture Impact
Mentored
Industry Breadth
Passion
Good Fit
Challenge
Interdisciplinary
Other
-3
-2
-1
0
1Outdoor Interest
Planning Interest
Plant Interest
Art Interest
Architecture Interest
Design Interest
Landscaping Interest
Environmental Reasons
Human InteractionFuture Impact
Mentored
Industry Breadth
Passion
Good Fit
Challenge
Interdisciplinary
Other
-3
-2
-1
0
1Outdoor Interest
Planning Interest
Plant Interest
Art Interest
Architecture Interest
Design Interest
Landscaping Interest
Environmental Reasons
Human InteractionFuture Impact
Mentored
Industry Breadth
Passion
Good Fit
Challenge
Interdisciplinary
Other
-3
-2
-1
0
1Outdoor Interest
Planning Interest
Plant Interest
Art Interest
Architecture Interest
Design Interest
Landscaping Interest
Environmental Reasons
Human InteractionFuture Impact
Mentored
Industry Breadth
Passion
Good Fit
Challenge
Interdisciplinary
Other
-3
-2
-1
0
1Outdoor Interest
Planning Interest
Plant Interest
Art Interest
Architecture Interest
Design Interest
Landscaping Interest
Environmental Reasons
Human InteractionFuture Impact
Mentored
Industry Breadth
Passion
Good Fit
Challenge
Interdisciplinary
Other
-3
-2
-1
0
1Outdoor Interest
Planning Interest
Plant Interest
Art Interest
Architecture Interest
Design Interest
Landscaping Interest
Environmental Reasons
Human InteractionFuture Impact
Mentored
Industry Breadth
Passion
Good Fit
Challenge
Interdisciplinary
Other
-3
-2
-1
0
1Outdoor Interest
Planning Interest
Plant Interest
Art Interest
Architecture Interest
Design Interest
Landscaping Interest
Environmental Reasons
Human InteractionFuture Impact
Mentored
Industry Breadth
Passion
Good Fit
Challenge
Interdisciplinary
Other
Model-based Clustering: ellipsoidal, equal-variance model with 9 interpretable clusters
Cluster 1: Passion(n=63, 19% of the sample)
Cluster 2: Interdisciplinary(n=34, 10% of the sample)
Cluster 3: Environmental(n=28, 8% of the sample)
Cluster 4: Everyone Else(n=59, 18% of the sample)
Cluster 5: Good Fit(n=26, 8% of the sample)
Cluster 6: Other(n=40, 12% of the sample)
Cluster 7: Outdoor Interest(n=47, 14% of the sample)
Cluster 8: Architecture Interest(n=28, 8% of the sample)
Cluster 9: Outdoor Other(n=6, 2% of the sample)
The second question (CHOICE) is “Why did you choose Landscape Architecture as
your major?” The best fit is an ellipsoidal, equal-variance model with nine interpretable
clusters as seen in Figure 3.21: Cluster 1 (n=63, 19% of the sample) represents those with
high scores in Passion, and relatively high scores in Future Impact, Mentored, Planning
Interest, and Challenge; Cluster 2 (n=34, 10% of the sample) represents those with high
72
scores in Interdisciplinary and Plant Interest with relatively high scores in Art interest and
Design Interest; Cluster 3 (n=28, 8% of the sample) represents those with high scores in
Environmental Reasons; Cluster 4 (n=59, 18% of the sample) represent everyone else (those
who do not fit in any other distinguishable cluster); Cluster 5 (n=26, 8% of the sample)
represents those with high scores in Good Fit; Cluster 6 (n=40, 12% of the sample)
represents those with high scores in Other (explained, but did not fit into one of the 16
categories); Cluster 7 (n=47, 14% of the sample) represents those with high scores in
Outdoor Interest; Cluster 8 (n=28, 8% of the sample) represents those with high scores in
Architecture Interest; Cluster 9 (n=6, 2% of the sample) represents those with high scores in
Outdoor Interest and Other with relatively high scores in Human Interaction and Design
Interest.
The third question (MOTIVATION) is “What was most attractive to you about
landscape architecture and what is most motivating to you now?” The best fit is a spherical,
equal-volume model with nine interpretable clusters as seen in Figure 3.22: Cluster 1 (n=42,
13% of the sample) represents those with high scores on Environmental Reasons, Human
Interaction and Future Impact; Cluster 2 (n=22, 7% of the sample) represents those with
extremely high scores on Planning Interest and Plant Interest; Cluster 3 (n=21, 6%)
represents those with extremely high scores in Art Interest and high scores in
Interdisciplinary; Cluster 4 (n=147, 44% of the sample) represent the non-descript everyone
else; Cluster 5 (n=8, 2% of the sample) represent those with extremely high scores in
Industry Breadth and Environmental Reasons; Cluster 6 (n=4, 1% of the sample) represent
those with extremely high scores in Water Interest; Cluster 7 (n=10, 3% of the sample)

73
Figure 3.22Clusters: MOTIVATIONWhat was most attractive to you about landscape architecture and what is most motivating to you now?
-3
-2
-1
0
1Outdoor Interest
Planning Interest
Plant Interest
Art Interest
Architecture Interest
Design Interest
Landscaping Interest
Water Interest
Human Interaction
Environmental Reasons
Future Impact
Mentored
Industry Breadth
Passion
Good Fit
Challenge
Interdisciplinary
Other
Cluster 8
-3
-2
-1
0
1Outdoor Interest
Planning Interest
Plant Interest
Art Interest
Architecture Interest
Design Interest
Landscaping Interest
Water Interest
Human Interaction
Environmental Reasons
Future Impact
Mentored
Industry Breadth
Passion
Good Fit
Challenge
Interdisciplinary
Other
-3
-2
-1
0
1Outdoor Interest
Planning Interest
Plant Interest
Art Interest
Architecture Interest
Design Interest
Landscaping Interest
Water Interest
Human Interaction
Environmental Reasons
Future Impact
Mentored
Industry Breadth
Passion
Good Fit
Challenge
Interdisciplinary
Other
-3
-2
-1
0
1Outdoor Interest
Planning Interest
Plant Interest
Art Interest
Architecture Interest
Design Interest
Landscaping Interest
Water Interest
Human Interaction
Environmental Reasons
Future Impact
Mentored
Industry Breadth
Passion
Good Fit
Challenge
Interdisciplinary
Other
-3
-2
-1
0
1Outdoor Interest
Planning Interest
Plant Interest
Art Interest
Architecture Interest
Design Interest
Landscaping Interest
Water Interest
Human Interaction
Environmental Reasons
Future Impact
Mentored
Industry Breadth
Passion
Good Fit
Challenge
Interdisciplinary
Other
-3
-2
-1
0
1Outdoor Interest
Planning Interest
Plant Interest
Art Interest
Architecture Interest
Design Interest
Landscaping Interest
Water Interest
Human Interaction
Environmental Reasons
Future Impact
Mentored
Industry Breadth
Passion
Good Fit
Challenge
Interdisciplinary
Other
-3
-2
-1
0
1Outdoor Interest
Planning Interest
Plant Interest
Art Interest
Architecture Interest
Design Interest
Landscaping Interest
Water Interest
Human Interaction
Environmental Reasons
Future Impact
Mentored
Industry Breadth
Passion
Good Fit
Challenge
Interdisciplinary
Other
-3
-2
-1
0
1Outdoor Interest
Planning Interest
Plant Interest
Art Interest
Architecture Interest
Design Interest
Landscaping Interest
Water Interest
Human Interaction
Environmental Reasons
Future Impact
Mentored
Industry Breadth
Passion
Good Fit
Challenge
Interdisciplinary
Other
-3
-2
-1
0
1Outdoor Interest
Planning Interest
Plant Interest
Art Interest
Architecture Interest
Design Interest
Landscaping Interest
Water Interest
Human Interaction
Environmental Reasons
Future Impact
Mentored
Industry Breadth
Passion
Good Fit
Challenge
Interdisciplinary
Other
Model-based Clustering: spherical, equal-volume model with 9 interpretable clusters
Cluster 1: Environmental Future(n=42, 13% of the sample)
Cluster 2: Planning/Plants(n=22, 7% of the sample)
Cluster 3: Art(n=21, 6% of the sample)
Cluster 4: Everyone Else(n=147, 44% of the sample)
Cluster 5: Environmental Industry(n=8, 2% of the sample)
Cluster 6: Water Interest(n=4, 1% of the sample)
Cluster 7: Interdisciplinary(n=10, 3% of the sample)
Cluster 8: Industry Breadth(n=40, 12% of the sample)
Cluster 9: Other(n=37, 11% of the sample)
represent those with extremely high Interdisciplinary with moderately high Industry Breath;
Cluster 8 (n=40, 12% of the sample) represent those with extremely high Industry Breadth
and relatively high Challenge; and Cluster 9 (n=37, 11% of the sample) have scores high in
Other (explained, but did not fit into one of the 17 categories).

74
Figure 3.23Clusters: PASSIONWhat do you consider your passion and does it relate to landscape architecture?
Model-based Clustering: spherical, equal-volume model with 9 interpretable clusters
Cluster 1: Golf/Photography(n=20, 6% of the sample)
Cluster 2: Environmental Help(n=29, 9% of the sample)
Cluster 3: Everyone Else(n=132, 40% of the sample)
Cluster 4: Music/Theatre(n=17, 5% of the sample)
Cluster 5: Outdoors(n=32, 10% of the sample)
Cluster 6: Design/Creativity(n=46, 14% of the sample)
Cluster 7: Art(n=35, 11% of the sample)
Cluster 8: Urban Planning(n=8, 2% of the sample)
Cluster 9: Better World(n=12, 4% of the sample)
-3
-2
-1
0
1Architecture
ArtBetter World
Cars
Computers
Design/Creativity
Drafting
Engineering
Environment Help
Family
Golf Course
Green Roofs
History
Influence PeopleLand DevelopmentLandscape ArchitectureLandscapingLearning
Life
Money
Music/Theater
Natural Resources
Outdoors
Problem Solving
Photography
Plants
Spirituality
Sports
TravelUrban Planning
Other
-3
-2
-1
0
1Architecture
ArtBetter World
Cars
Computers
Design/Creativity
Drafting
Engineering
Environment Help
Family
Golf Course
Green Roofs
History
Influence PeopleLand DevelopmentLandscape ArchitectureLandscapingLearning
Life
Money
Music/Theater
Natural Resources
Outdoors
Problem Solving
Photography
Plants
Spirituality
Sports
Travel
Urban PlanningOther
-3
-2
-1
0
1Architecture
ArtBetter World
Cars
Computers
Design/Creativity
Drafting
Engineering
Environment Help
Family
Golf Course
Green Roofs
History
Influence PeopleLand DevelopmentLandscape ArchitectureLandscapingLearning
Life
Money
Music/Theater
Natural Resources
Outdoors
Problem Solving
Photography
Plants
Spirituality
Sports
TravelUrban Planning
Other
-3
-2
-1
0
1Architecture
ArtBetter World
Cars
Computers
Design/Creativity
Drafting
Engineering
Environment Help
Family
Golf Course
Green Roofs
History
Influence PeopleLand DevelopmentLandscape ArchitectureLandscapingLearning
Life
Money
Music/Theater
Natural Resources
Outdoors
Problem Solving
Photography
Plants
Spirituality
Sports
Travel
Urban PlanningOther
-3
-2
-1
0
1Architecture
ArtBetter World
Cars
Computers
Design/Creativity
Drafting
Engineering
Environment Help
Family
Golf Course
Green Roofs
History
Influence PeopleLand DevelopmentLandscape ArchitectureLandscapingLearning
Life
Money
Music/Theater
Natural Resources
Outdoors
Problem Solving
Photography
Plants
Spirituality
Sports
TravelUrban Planning
Other
The fourth question (PASSION) is “What do you consider your passion and does it
relate to landscape architecture?” The best fit is a spherical, equal-volume model with nine
interpretable clusters as seen in Figure 3.23: Cluster 1 (n=20, 6% of the sample) represents
those with extremely high scores in Golf Course and Photography, moderately high scores in
Architecture, and relatively high scores in History and Learning; Cluster 2 (n=29, 9% of the

75
sample) represent those with extremely high scores in Environment Help; Cluster 3 (n=132,
40% of the sample) represent the non-descript everyone else; Cluster 4 (n=17, 5% of the
sample) represent those with extremely high scores in Music/Theatre; Cluster 5 (n=32, 10%
of the sample) represent those with extremely high scores in Outdoors; Cluster 6 (n=46,
14% of the sample) represent those with extremely high scores in Design/Creativity; Cluster
7 (n=35, 11% of the sample) represent those with extremely high scores in Art; Cluster 8
(n=8, 2% of the sample) represent those with extremely high scores in Urban Planning and
relatively high scores in Influence People and Natural Resources; and Cluster 9 (n=12, 4% of
the sample) represent those with extremely high scores in Better World and relatively high
scores in Influence People and Spirituality.
The fifth question (GOALS) is “What are your long-term career goals and how will
the study of landscape architecture help you accomplish these goals?” The best fit is a
spherical, equal-volume model with four interpretable clusters as seen in Figure 3.24:
Cluster 1 (n=42, 13% of the sample) represents those with extremely high scores in Help
Environment and moderately high scores in Help Society; Cluster 2 (n=64, 19% of the
sample) represents those with extremely high scores in Own Company; Cluster 3 (n=175,
53% of the sample) represents the non-descript everyone else; and Cluster 4 (n=50, 15% of
the sample) represents those with high scores in Other (explained, but did not fit into one of
the 10 categories).
3.2.2.5 Hometown versus University Town (clusters). Although location was considered
in the survey, the ZIP codes were collected which allows secondary data analysis to try and
understand the geographical fit of the university choice. The secondary data was harvested

76
Figure 3.24Clusters: GOALSWhat are your long-term career goals and how will the study of landscape architecture help you
accomplish these goals?
-3
-2
-1
0
1Accomplishment
Continue Learning
Golf Course Design
Help Environment
Help Society
Higher EducationMoney
Own Company
Co-Own Company
Work for a Company
Other
Model-based Clustering: spherical, equal-volume model with 4 interpretable clusters
Cluster 1: Help World(n=42, 13% of the sample)
Cluster 2: Own Company(n=64, 19% of the sample)
Cluster 3: Everyone Else(n=175, 53% of the sample)
Cluster 4: Other(n=50, 15% of the sample)
-3
-2
-1
0
1Accomplishment
Continue Learning
Golf Course Design
Help Environment
Help Society
Higher EducationMoney
Own Company
Co-Own Company
Work for a Company
Other
-3
-2
-1
0
1Accomplishment
Continue Learning
Golf Course Design
Help Environment
Help Society
Higher EducationMoney
Own Company
Co-Own Company
Work for a Company
Other
-3
-2
-1
0
1Accomplishment
Continue Learning
Golf Course Design
Help Environment
Help Society
Higher EducationMoney
Own Company
Co-Own Company
Work for a Company
Other
off the internet at http://factfinder.census.gov/, which contains the 2003 U.S. Census data.
Although the measures may be crude, the underlying themes of geographical fit may have
some interesting value. The individual’s home ZIP code was compared to the university’s
ZIP code along several variables. Originally, 18 variables were considered; however, basic
stability identified nine variables of interest: Population, Age, percentage Caucasian,
percentage College Degree, percentage Working, Work Traveling Distance, Per Capita
Family Income, percentage below Poverty Level, and median Value of a Home. Each ZIP

77
code was standardized, and with standardized scores being compared between universities
and home; specifically, home was subtracted from university (U-H). These variables were
then clustered using a model-based technique. The comparison is based on the expression
“university is … compared to the home.” The best fit is an ellipsoidal, equal-variance model
with seven interpretable clusters as seen in Figure 3.25. Cluster 1 (n=84, 27% of the sample)
represents a college-town: the university is younger, has more people without a college
degree, the population is larger, and home values are higher than in the student’s home
town. The majority of students sampled attending the following universities represent this
cluster: Iowa State, Oklahoma State, Texas Tech, Maryland, Massachusetts, Virginia Tech,
Washington, and Washington State. Cluster 2 (n=15, 5% of the sample) represents the inner-
city university: the university location is older, a high percentage of the population lacks
college degrees, the population is larger, home values are lower, and the percentage of
Caucasians is lower. The majority of students sampled attending Philadelphia and Louisiana
State represent this cluster. Cluster 3 (n=98, 32% of the sample) represent a different inner-
city university: the university location is higher valued area. The majority of the students
sampled attending the following universities represent this cluster: Arizona State, Cal-Poly
San Luis Obispo, North Carolina State, North Dakota State, Arkansas, Kentucky, Nebraska,
UNLV and Utah State. Cluster 4 (n=8, 3% of the sample) represents a university in an
extremely high valued area compared to the student’s home (this small sample is the
remainder of Cal-Poly San Luis Obispo students). Cluster 5 (n=58, 19% of the sample)
represents a university location that has the highest percentage of College degrees with the
majority of students sampled represented from: Michigan State, Ohio State, and Penn State.

78
Figure 3.25Clusters: Comparing University Town to Hometown (U-H)
Model-based Clustering: ellipsoidal, equal-variance model with 7 interpretable clusters
Cluster 1: More College Town(n=84, 27% of the sample)
Cluster 2: More Inner-City A(n=15, 5% of the sample)
Cluster 3: More Inner-City B(n=98, 32% of the sample)
Cluster 4: Higher-End(n=8, 3% of the sample)
Cluster 5: More Educated(n=58, 19% of the sample)
Cluster 6: Smaller(n=35, 11% of the sample)
Cluster 7: Younger(n=13, 4% of the sample)
-3
-2
-1
0
1population
age
perc_caucasian
per_college
per_workingworking_travel
income_percapita
poverty
value_home
-3
-2
-1
0
1population
age
perc_caucasian
per_college
per_workingworking_travel
income_percapita
poverty
value_home
-3
-2
-1
0
1population
age
perc_caucasian
per_college
per_workingworking_travel
income_percapita
poverty
value_home
-3
-2
-1
0
1population
age
perc_caucasian
per_college
per_workingworking_travel
income_percapita
poverty
value_home
-3
-2
-1
0
1population
age
perc_caucasian
per_college
per_workingworking_travel
income_percapita
poverty
value_home
-3
-2
-1
0
1population
age
perc_caucasian
per_college
per_workingworking_travel
income_percapita
poverty
value_home
-3
-2
-1
0
1population
age
perc_caucasian
per_college
per_workingworking_travel
income_percapita
poverty
value_home
Cluster 6 (n=35, 11% of the sample) represents a university location that is much smaller
and much poorer than home towns: Connecticut, Mississippi State, and Georgia. Cluster 7
(n=13, 4% of the sample) represents a university location that is much younger with lower
home values than home towns: some of the students from Penn State.

79
3.2.2.6 Summary of Defined Variables to find Qualitative Meaning
These various analyses have broadened our understanding of the survey instrument
and have helped generate psychographic variables to fully appreciate the important issue of
understanding why a student chooses to major in LA. In summary, analysis has gone beyond
simple demographics and descriptive statistics. Further analyses has allowed for the creation
of many new variables, most of which are psychographic. For example, the question “Name
your three favorite High School Classes” has been transformed into a psychographic variable
consistent with the theory of Multiple Intelligences: MI HS classes. The consequent
clustering of these variables now define four normal groups within the sample, presenting
the idea of learning preferences within the LA major: Designers, Naturalists, Philosophers,
and surprisingly Musicians.
Likewise, nine other unique psychographic variables have been defined with a
conceptualization of their groupings: MI major (extracted from other majors considered and
treated similar to the aforementioned psychographic variable), University FACTORS (why
university was selected), CAREER Anticipations, AWARE, GOALS, CHOICE,
MOTIVATION, PASSION (all based on coding of open-ended responses), and
LOCATION (comparison of home ZIP code to university ZIP code classified
appropriately). This research has defined ten psychographic variables to understand the
research at hand. Now that all of the psychographic variables of interest have been created, a
simple application of these variables will be used to demonstrate their importance.

80
3.2.3 Group Comparisons
Now that the all of the psychographic variables of interest have been created and
defined, a simple application of these variables will be used as another tactic to understand
the data, which will allow for thematic conclusions relating to the theory and observations
outlined. This is achieved by dividing the sample into simple groups and comparing
traditional variables and the newly created psychographic variables by group. Group
comparisons can be considered simple segmentations; however, their purpose is to
emphasize the value of this qualitative research process and the insights and themes that can
be extracted from this methodology. Although there are many possible group comparisons,
four group comparisons relevant to the research question and the marketing problem will be
considered: gender comparisons (demographic: male vs. female), awareness comparisons
(psychographic: aware before college, not aware before college), selection comparisons
(psychographic: university choice or LA choice), and specific university comparisons
(demographic: Pennsylvania State University to Washington State University). Key
differences3 will be reported below with the full analysis available in the appropriate
appendix. Also, Figures 3.26 and 3.27 show differences by group of importance of
encouragement in the decision to major in LA (comparing groups based on data presented
earlier in Figure 3.5). Mentors are of the most interest; their roles can be better understood
by group by studying their positions relative to each other on each graph.
3 Directional differences in a group comparison can have qualitative meaning and will be reported even if statistical significance may not
exist based on the sample size.

81
Figure 3.26Social Influence Importance/Performance Graphs (Group Comparisons – F/M & PSU/WSU)
Females
1 2 3 4 5 6 7
12
34
56
7
Immediate Family
Extended Family
Friends
Significant Other
HS Mentors
College Mentors
Importance
En
cour
agem
ent
1 2 3 4 5 6 71
23
45
67
Immediate Family
Extended Family
Friends
Significant Other
HS Mentors
College Mentors
Males
Importance
En
cour
agem
ent
1 2 3 4 5 6 7
12
34
56
7
Immediate Family
Extended FamilyFriends
Significant Other
HS Mentors
College Mentors
En
cour
agem
ent
PSU
Importance1 2 3 4 5 6 7
12
34
56
7
Immediate Family
Extended FamilyFriends
Significant Other
HS Mentors
College Mentors
WSU
En
cour
agem
ent
Importance
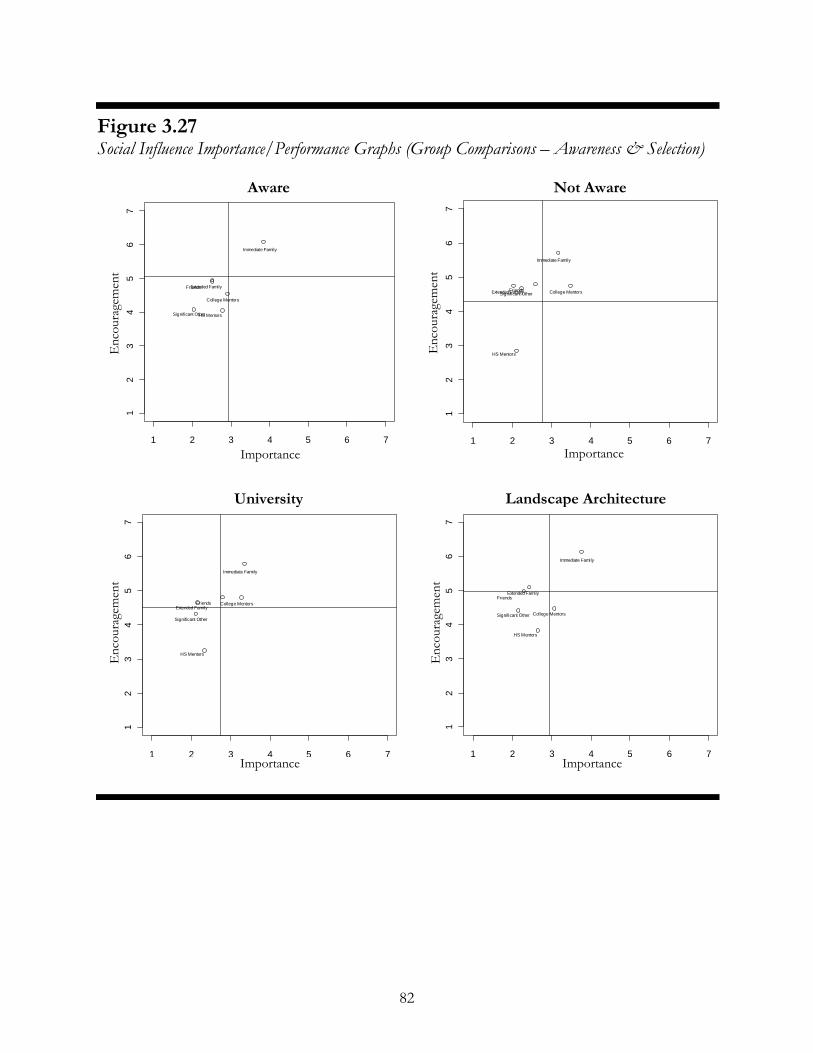
82
Figure 3.27Social Influence Importance/Performance Graphs (Group Comparisons – Awareness & Selection)
Aware
Importance
En
cour
agem
ent
Not Aware
Importance
En
cour
agem
ent
En
cour
agem
ent
University
Importance
Landscape Architecture
En
cour
agem
ent
Importance
1 2 3 4 5 6 7
12
34
56
7
Immediate Family
Extended FamilyFriends
Significant OtherHS Mentors
College Mentors
1 2 3 4 5 6 71
23
45
67
Immediate Family
Extended FamilyFriendsSignificant Other
HS Mentors
College Mentors
1 2 3 4 5 6 7
12
34
56
7
Immediate Family
Extended FamilyFriends
Significant Other
HS Mentors
College Mentors
1 2 3 4 5 6 7
12
34
56
7
Immediate Family
Extended FamilyFriends
Significant Other
HS Mentors
College Mentors

83
3.2.3.1 Gender Comparisons. It is apparent that there are key gender differences in the
data as women (n=114) are compared to men (n=185) by the available variables (see
Appendix C). Differences reported below include 8% difference or greater. Reported first
include those with 10% or greater difference and next are those with 8–9 % difference.
Men preferred history classes in high school more than women (14% male, 4%
female). Women were more passionate (PASSION) about creativity (28% female, 18%
male). In choosing which university to attend, women considered the setting of the
university more than men (39% female, 26% male). Women were more prone to visit
specific university programs (43% women, 25% men). As for career goals, men had a higher
propensity to own a company (24% male, 12% female). Along those lines, men anticipated
more to work as entrepreneurs (30% male, 16% female) and managers (22% male, 7%
female). Overall, women more likely anticipated having a naturalist career (23% female, 10%
male) while men more likely anticipated a manager career (21% male, 6% female).
When considering other majors, women reported art and graphic design more
frequently than men (13% female, 5% male). Women were more passionate (PASSION)
about art (16% female, 8% male). Men were more passionate about sports (11% male, 3%
female). Men attended a university within their home state more frequently than women
(83% male, 75% female). In discussing reasons why they chose LA as a major, women
expressed more interest in the outdoors (25% female, 17% male) and in plants (17% female,
8% male). Women anticipated more work with park and recreation design (76% female, 68%
male) while men anticipated more work in land development (42% male, 30% female).

84
3.2.3.2 Awareness Comparisons. Understanding the variables of this research based on
when students became aware of LA is also inherently meaningful (see Appendix C). The
two groups of interest are defined as aware (n=183) or not aware (n=143) based on
knowledge before college. Students aware knew the field of study existed before they arrived
at college; students not aware did not know the field of study existed before they arrived at
college. Differences reported below include 8% difference or greater. Reported first include
those with 10% or greater difference and next are those with 8–9 % difference.
Those Aware of LA during or before high school were younger (A=22, NA=25) than
those Not Aware until college. More Aware came from rural hometowns (39% A, 24% NA)
while more Not Aware came from urban hometowns (19% NA, 9% A). In choosing which
university to attend, Aware considered the setting of the university (38% A, 28% NA) along
with the reputations of the LA department (56% A, 26 NA), the LA faculty (28%A,
18%NA), and the university (59% A, 45% NA) more than Not Aware. Those Aware
traveled farther from their hometowns to attend college (103.4[41.9-201.9] A, 68.3[6.5-208.1]
NA). Not Aware became more aware of LA due to specific university program influences
(43% NA, 25% A). Aware became more aware due to family influences (19% A, 5% NA)
and through a landscaping professional’s influences (21% A, 10% NA). Those Aware
declared their major as LA more as freshmen (71% A, 21% NA) while those Not Aware
declared more as sophomores (60%NA, 17%A). Those Not Aware transferred more from
architecture (17% NA, 6% A) than those Aware.
Not Aware considered location of the university (21% NA, 13% A) more than
Aware. Not Aware became more aware of LA due to friend influence (21% NA, 13% A). As
85
for career goals, Aware had a higher propensity to own a company (28% A, 19% NA) and to
have a residential design/build career (31% A, 23% NA). Those Not Aware had more desire
to help their society (26% NA, 17% A) than those Aware.
3.2.3.3 Selection Comparisons. Understanding the variables of this research based on
which students chose first, university or landscape architecture is also innately meaningful
(see Appendix D). The two groups of interest are defined as University (n=162) or LA
(n=151) based on order of decisions. Students who first chose their university, then chose to
major in LA is the defined U; students who first chose to major in LA, then chose their
university is the defined LA. Differences reported below include 8% difference or greater.
Reported first include those with 10% or greater difference and next are those with 8–9 %
difference.
Those who chose their university (U) then chose landscape architecture as their major
were slightly younger (U=22, LA=23) than those who chose landscape architecture (LA)
first. U had more males (84% U, 63% LA) than LA. More U had mothers with a 4-year
college degree (55% U, 45% LA). More U fit with the Philosophers cluster (MI other
considered majors) (43% U, 28% LA). More LA fit with the Naturalists cluster (30% LA,
16% U). U was more passionate about design and creativity (27% U, 17% LA). In choosing
which university to attend, LA considered the reputations of the LA department (55% LA,
33% U) and the LA faculty (29% LA, 19% U) more than U. U considered the influence of
family and friends (49% U, 32% LA or 12% U, 4% LA) along with financial factors (47% U,
37% LA) more than LA. LA traveled farther from their hometowns to attend college
(U=65.4[9.2-165.1] miles, LA=116[48.5-240.2]). More U intended on getting a masters

86
degree (36% U, 26% LA). LA tend to become aware of landscape architecture more
frequently during (58% LA, 33% U) high school while U became more aware during college
(59% U, 28% LA). More U became aware of landscape architecture due to specific university
program’s influences (44% U, 23% LA). LA declared landscape architecture more as
freshmen (62% LA, 38% U) and more U declared major as sophomores (46% U, 25% LA).
More U transferred into landscape architecture from another major (44% U, 18% LA) and
more transferred from architecture (17% U, 5% LA). On reasons for choosing to study
landscape architecture, LA referenced design interest (47% LA, 36% U) more than U. As for
career goals, LA had a higher propensity to own a company (30% LA, 19% U) than U.
LA is more passionate about helping the environment (13% LA, 4% U) more than U.
More U remained in the home state to attend college (84% U, 76% LA). More LA were
attracted to landscape architecture due to environmental reasons (31% LA, 22% U).
3.2.3.4 Specific University Comparisons. Understanding the variables of this research
based on which university students attend can also be meaningful (see Appendix D). The
two groups of interest are defined as Pennsylvania State University (PSU) (n=47) and
Washington State University (WSU) (n=46). Differences reported below include 8%
difference or greater. Reported first include those with 10% or greater difference and next
are those with 8–9 % difference.
PSU students were on average younger (PSU=20, WSU=22) than those at WSU.
More mothers of PSU students have a 4-year college degree (52% PSU, 41% WSU). When
considering other majors, PSU reported architecture more frequently than WSU (31% PSU,
11% WSU). WSU students had minors more frequently than PSU (28% WSU, 11% PSU).

87
More WSU students fit within the Designers cluster (favorite high school classes) (33%
WSU, 23% PSU) while more PSU students fit within the Philosophers cluster (23% PSU,
7% WSU). As far as clusters of other considered majors, WSU fit within Philosophers
cluster (46% WSU, 32% PSU) and Musicians cluster (26% WSU, 11% PSU) while PSU fit
within the Designers cluster (32% PSU, 13% WSU) more than WSU. WSU students were
more passionate about the outdoors (17% WSU, 6% PSU). In choosing which university to
attend, PSU considered the reputations of the university (81% PSU, 41% WSU), LA
department (72% PSU, 26% WSU or 38% PSU, 9% WSU), and LA faculty (38% PSU, 15%
WSU) as well as location (72% PSU, 61% WSU), and the influence of family and friends
(53% PSU, 39% WSU) more than WSU. WSU had more financial (41% WSU, 21% PSU)
considerations in choosing their university than PSU. WSU students attended a university
within their home state more frequently than PSU students (91% WSU, 79% PSU); however,
WSU students traveled further to attend college from their hometowns (105[56.8-135.2]
PSU, 240.2[62.4-264.5] WSU). More PSU students intended on getting a masters degree
(45% PSU, 22% WSU or 23% PSU, 13% WSU). PSU students attended a smaller town for
college (15% PSU, 0% WSU) while WSU students attended a more educated (87% WSU,
0% PSU) and younger (13% WSU, 0% PSU) town for college. WSU students tend to
become aware of LA more frequently during college (41% WSU, 15% PSU) while PSU
students tend to become aware of LA more frequently during high school (81% PSU, 48%
WSU). PSU students became more aware of LA more frequently through architecture
interest (32% PSU, 20% WSU). PSU students declared their major as LA more as freshmen
(77% PSU, 50% WSU) while more WSU students declared it as sophomores (39% WSU, 9%

88
PSU). WSU students were more attracted to and motivated by LA by the breadth of the
industry (22% WSU, 9% PSU or 37% WSU, 17% PSU) and design interest (61% WSU, 28%
PSU). In discussing reasons why they chose LA as a major, PSU expressed more reasons
associated with passion (30% PSU, 20% WSU), art interest (21% PSU, 9% WSU), and
because of industry breadth (17% PSU, 7% WSU). WSU students chose LA more due to
design interest (46% WSU, 26% PSU). As for career goals, WSU students had a higher
propensity to own a company (37% WSU, 9% PSU or 39% WSU, 11% PSU). PSU students
have more goals surrounding helping the world (21% PSU, 2% WSU) by helping the
environment (21% PSU, 2% WSU) and society (21% PSU, 11% WSU). Along those lines,
WSU students anticipated more to work as entrepreneurs (26% WSU, 15% PSU), in
commercial design (57% WSU, 32% PSU), and residential design (78% WSU, 51% PSU).
PSU students anticipated more work with land use planning and policy (43% PSU, 26%
WSU).
In choosing which university to attend, PSU considered university setting (38% PSU,
30% WSU) more than WSU. WSU students became aware of LA more frequently through
design interest (17% WSU, 9% PSU). PSU students became aware more frequently, through
dislike or were not accepted to architecture (15% PSU, 7% WSU), and through having
passion that aligns directly with LA (38% PSU, 30% WSU). PSU students anticipated a
career involving urban design (70% PSU, 61% WSU) more than WSU students.

89
CHAPTER FOUR
DISCUSSION
4.1 Findings and Implications for LA Stakeholders
The findings of this qualitative research are presented in seven dialogues as they relate
to my original research question: “Why does someone choose to pursue a degree in
landscape architecture?” Many broad findings have been presented throughout this paper
(see Chapters 1–3 and Appendices C–F); however, at the heart of it all rests seven
thematic elements. They are that LA students:
(1) have abilities that align with design, nature, social interaction, or (surprisingly) music.
(2) are passionate about the following topics: the environment, influencing people,
architecture, design, art, music, and/or making the world a better place.
(3) are socially connected.
(4) are free spirits.
(5) are open-minded about career direction.
(6) are NOT in it for the money.
(7) tend to study at an institution near where they are already located.
(1) LA students have abilities that align with design, nature, social interaction, or
(surprisingly) music. Not surprising to a LA stakeholder might be the abilities that align with
design and nature, but maybe more surprising are the abilities related to social interaction
(good with verbal skills along with people skills) and music. One way a recruiter may benefit
from this by considering recruiting in a high school music or psychology class instead of
typical class considerations like art or biology.
90
(2) LA students are passionate about the following topics: the environment,
influencing people, architecture, design, art, music, and/or making the world a better place.
A recruiter would be benefited to understand the diversity among potential students.
(3) LA students are socially connected. A recruiter may benefit from this by
understanding how students arrive within the discipline and where they end up studying LA.
Students become aware of LA and choose their university through the influence of family,
friends, professionals, and mentors. This knowledge opens a venue to increase awareness for
the future.
(4) LA students are free spirits. A recruiter needs to understand the nature of his/her
students. LA students are more internally motivated and therefore desire autonomous
support. To understand autonomous support, I recommend Deci’s (1995) book entitled Why
We Do What We Do to all LA stakeholders genuinely interested in the success of current and
future LA students.
(5) LA students are open-minded about career direction. Perhaps due to the vastness
of the industry as a whole, LA students do not anticipate any single direction within the
discipline. By being autonomous, LA students desire to feel that they are in charge of their
own futures. The benefit for recruiters may be to share the breadth of LA during the process
of increasing awareness.
(6) LA students are NOT in it for the money. The truth is for the hours and training
required for landscape architects, the pay is rarely in balance. A recruiter should not convey
the industry to potential students as something that will make them wealthy for at least two
reasons. The first is LA students are motivated internally (and not by money). Their passions

91
do not align with wealth, fame or any external motivating factor. The second deals with the
honesty of the industry. Those who are attracted into studying LA should have a real sense
of what to anticipate in their future.
(7) LA students tend to study at an institution near where they are already located.
Except for maybe students at LA programs that are highly ranked, a vast majority of LA
students attend a university relatively close to their hometown (in the same state). LA
department recruiters should therefore direct their efforts toward students within their own
state while ASLA recruitment efforts can focus on increasing the number of states with LA
programs.
4.2 Limitations & Future Research
Although this research offers some key insights into the demographics and
psychographics of why a student chooses a major in LA, it is not without its limitations.
Temporal issues and the sample itself represent two major limitations of this issue. The
integrated model developed is a growth model, meaning anticipations are constantly
changing. A survey is a snapshot of the current anticipations and is limiting in fully
appreciating the dynamics of the constant struggle between internal and external forces.
Secondly, the sample itself is limiting: only undergraduate students in LA at specific U.S.
universities were studied. An additional limitation is that the survey did not directly ask
questions directly related to the theoretical framework as it was developed prior to the
integrated model; as such, certain assumptions were made. For example, linking MI to
favorite high school classes assumes certain ability is present for students who like a
particular class and does not account for other variables that could influence the reasons for
92
liking those classes. Also, age calculations based on high school graduation year could be
limiting.
As stated earlier, this research is a progressive step forward from the previous
contributions (Powers, 2000), which suggests that future research can use the insights
presented to make further contributions. Three key areas of future research are foreseen: (1)
study students across the world in all types of LA university programs; (2) study LA students
over time: from awareness well into their careers; (3) and develop and test marketing
(recruiting) and evaluative programs.
4.3 Conclusion
This study is informative research; it discovers variables important to the LA
student’s decision to pursue a career in LA. These variables can now be used to segment the
market according to individual recruitment desires. It is clear from both the AIDA-SC model
(see Figure 1.1) and the data presented that increasing the awareness of (the product) LA as
a field of study available at college should be ever-present in all recruiting campaigns within
LA or else market demands cannot be met. Adapted from previously mentioned, such a
strategy has two underlying premises: (1) current students matter and their perspective are
essential to developing and implementing recruiting strategies; and (2) promotions to
potential students need to be based on their needs. In short, this study has created the
groundwork on which to build a robust LA industry.
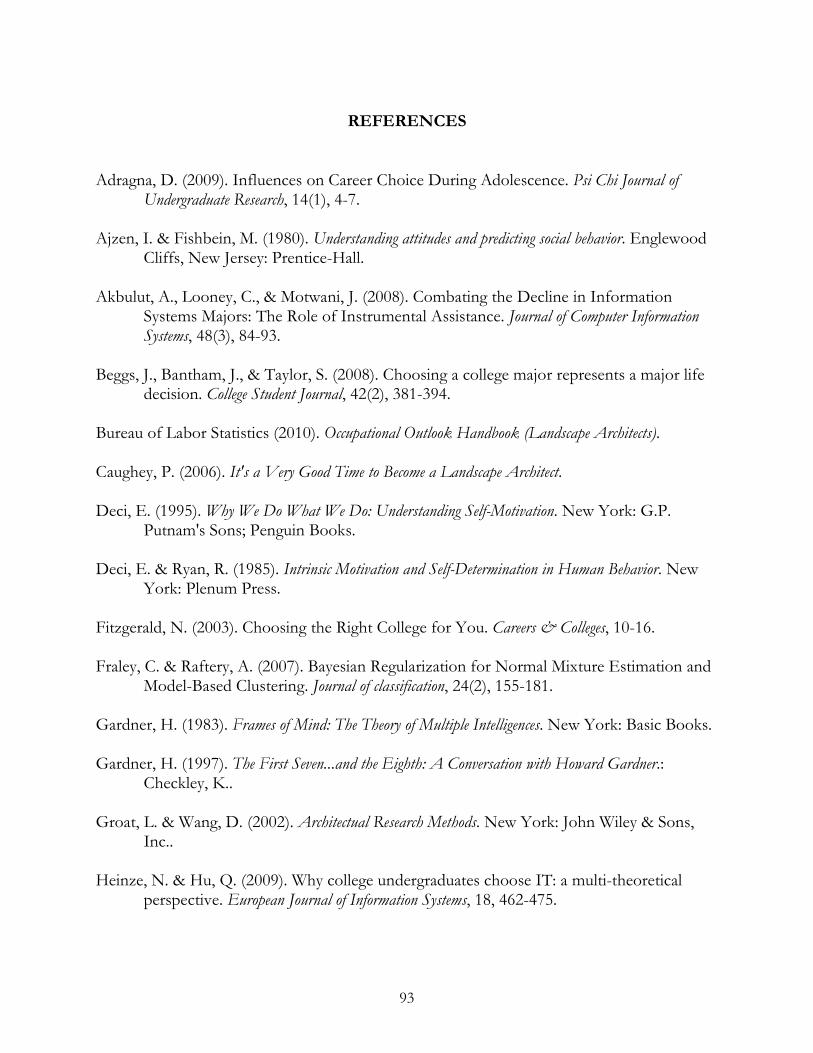
93
REFERENCES
Adragna, D. (2009). Influences on Career Choice During Adolescence. Psi Chi Journal ofUndergraduate Research, 14(1), 4-7.
Ajzen, I. & Fishbein, M. (1980). Understanding attitudes and predicting social behavior. EnglewoodCliffs, New Jersey: Prentice-Hall.
Akbulut, A., Looney, C., & Motwani, J. (2008). Combating the Decline in InformationSystems Majors: The Role of Instrumental Assistance. Journal of Computer InformationSystems, 48(3), 84-93.
Beggs, J., Bantham, J., & Taylor, S. (2008). Choosing a college major represents a major lifedecision. College Student Journal, 42(2), 381-394.
Bureau of Labor Statistics (2010). Occupational Outlook Handbook (Landscape Architects).
Caughey, P. (2006). It's a Very Good Time to Become a Landscape Architect.
Deci, E. (1995). Why We Do What We Do: Understanding Self-Motivation. New York: G.P.Putnam's Sons; Penguin Books.
Deci, E. & Ryan, R. (1985). Intrinsic Motivation and Self-Determination in Human Behavior. NewYork: Plenum Press.
Fitzgerald, N. (2003). Choosing the Right College for You. Careers & Colleges, 10-16.
Fraley, C. & Raftery, A. (2007). Bayesian Regularization for Normal Mixture Estimation andModel-Based Clustering. Journal of classification, 24(2), 155-181.
Gardner, H. (1983). Frames of Mind: The Theory of Multiple Intelligences. New York: Basic Books.
Gardner, H. (1997). The First Seven...and the Eighth: A Conversation with Howard Gardner.:Checkley, K..
Groat, L. & Wang, D. (2002). Architectual Research Methods. New York: John Wiley & Sons,Inc..
Heinze, N. & Hu, Q. (2009). Why college undergraduates choose IT: a multi-theoreticalperspective. European Journal of Information Systems, 18, 462-475.

94
Hemsley-Brown, J. (1999). College Choice. Educational Management & Administration, 27(1),85-98.
Kelly, G. (1955). A Theory of Personality: The Psychology of Personal Constructs. New York: W.W.Norton & Company.
Kerin, R. & Peterson, R. (2007). Strategic Marketing Problems. Upper Saddle River, New Jersey:Pearson Education.
Krutii, I. & Fursov, K. (2007). Goals and Motives for Enrolling in an Institution of HigherLearning. Russian Education and Society, 49(3), 35-46.
Kuechler, W., McLeod, A., & Simkin, M. (2009). Why Don't More Students Major in IS?.Decision Sciences Journal of Innovative Education, 7(2), 463-488.
Lattin, J., Carroll, J., & Green, P. (2003). Analyzing Multivariate Data. United States:Brooks/Cole, Cengage Learning.
Lee, A. (1991). Integrating Positivist and Interpretive Approaches to OrganizationalResearch. Organization Science, 2(4), 342-365.
Lent, R., Brown, S., & Hackett, G. (1994). Toward a Unifying Social Cognitive Theory ofCareer and Academic Interest, Choice, and Performance. Journal of Vocational Behavior,45(1), 79-122.
McInerney, C., DiDonato, N., Giagnacova, R., & O'Donnell, A. (2006). Students' Choice ofInformation Technology Majors and Careers: A Qualitative Study. InformationTechnology, Learning, and Performance Journal, 24(2), 35-53.
Pollock, K., Papiernik, J., & Slaubaugh, M. (2002). High School Guidance Counselors'Perceptions of the Profession. The CPA Journal, 72(5), 73-74.
Powers, M. (2000). Factors in Choosing Landscape Architecture as a Major: A National StudentSurvey. Blacksburg: Virginia Polytechnic Institute & State University.
Ryan, R. & Deci, E. (2000). Self-Determination Theory and the Facilitation of IntrinsicMotivation, Social Development, and Well-Being. American Psychologist, 55(1), 68-78.
Shimodaira, H. (2004). Approximately Unbiased Tests of Regions Using Multistep-Multiscale Bootstrap Resampling. Annals of Statistics, 32(6), 2616-2641.
Strauss, A. & Corbin, J. (1998). Basics of qualitative research: techniques and procedures for developinggrounded theory. Thousand Oaks, California: Sage Publications.

95
Tan, L. & Laswad, F. (2009). Understanding Students' Choice of Academic Majors: ALongitudinal Analysis. Accounting Education: an international journal, 18(3), 233-253.
Vos, J. & Evers, J. (2004). MSc in Bioinformatics: Statistical Data Mining. Oxford, UnitedKingdom: Oxford University.
Wang, D. (2007). Diagramming Design Research. Journal of Interior Design, 33(1), 33-43.
White, R. (1959). Motivation Reconsidered: The Concept of Competence. Psychological Review,66(5), 297-332.
Xu, R. & Wunsch, D. (2005). Pattern Classification and Clustering: Survey of ClusteringAlgorithms. IEEE transactions on neural networks, 16(3), 645-678.
Zhang, W. (2007). Why IS: Understanding Undergraduate Students' Intentions to Choose anInformation Systems Major. Journal of Information Systems Education, 18(4), 447-458.

96
APPENDIX
A. SURVEY INSTRUMENT

97

98

99

100

101
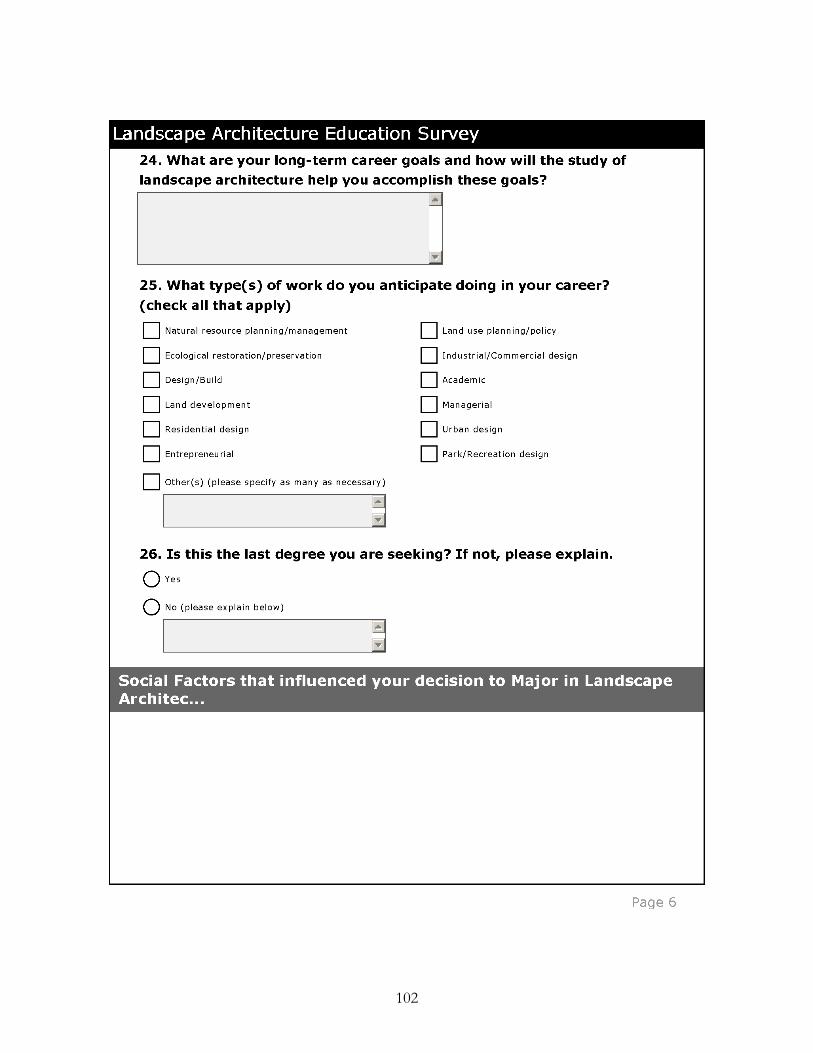
102

103

104

105
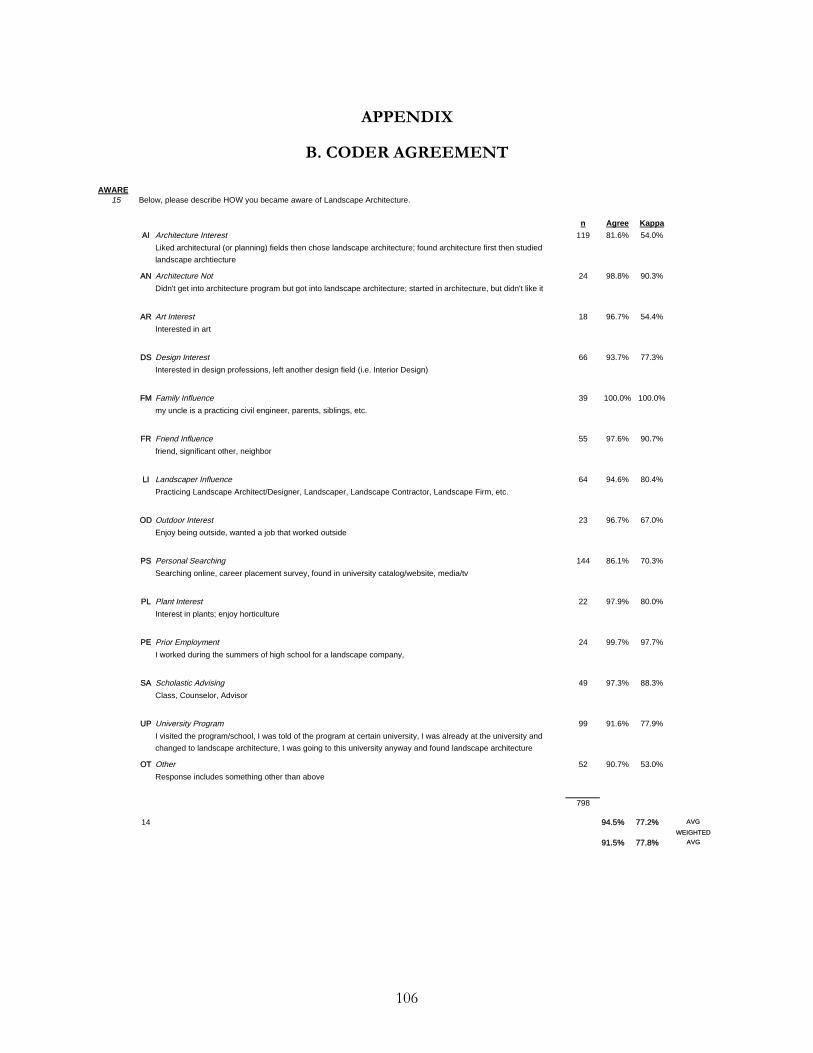
106
APPENDIX
B. CODER AGREEMENT
AWARE
15
n Agree Kappa
AI Architecture Interest 119 81.6% 54.0%
AN Architecture Not 24 98.8% 90.3%
AR Art Interest 18 96.7% 54.4%
DS Design Interest 66 93.7% 77.3%
FM Family Influence 39 100.0% 100.0%
FR Friend Influence 55 97.6% 90.7%
LI Landscaper Influence 64 94.6% 80.4%
OD Outdoor Interest 23 96.7% 67.0%
PS Personal Searching 144 86.1% 70.3%
PL Plant Interest 22 97.9% 80.0%
PE Prior Employment 24 99.7% 97.7%
SA Scholastic Advising 49 97.3% 88.3%
UP University Program 99 91.6% 77.9%
OT Other 52 90.7% 53.0%
798
14 94.5% 77.2% AVG
91.5% 77.8%
WEIGHTED
AVG
Class, Counselor, Advisor
I visited the program/school, I was told of the program at certain university, I was already at the university and
changed to landscape architecture, I was going to this university anyway and found landscape architecture
Response includes something other than above
Enjoy being outside, wanted a job that worked outside
Searching online, career placement survey, found in university catalog/website, media/tv
Interest in plants; enjoy horticulture
I worked during the summers of high school for a landscape company,
Interested in design professions, left another design field (i.e. Interior Design)
my uncle is a practicing civil engineer, parents, siblings, etc.
friend, significant other, neighbor
Practicing Landscape Architect/Designer, Landscaper, Landscape Contractor, Landscape Firm, etc.
Below, please describe HOW you became aware of Landscape Architecture.
Liked architectural (or planning) fields then chose landscape architecture; found architecture first then studied
landscape archtiecture
Didn't get into architecture program but got into landscape architecture; started in architecture, but didn't like it
Interested in art

107
GOALS
24
n Agree Kappa
AC Accomplishment 67 88.6% 54.2%
CL Continue Learning 40 92.2% 48.1%
GC Golf Course Design 8 100.0% 100.0%
EN Help Environment 34 92.2% 35.3%
HS Help Society 68 84.6% 34.4%
HE Higher Education 27 97.3% 78.6%
ID Interdisciplinary 3 99.1%
LD Land Development 2 99.7% 66.5%
MN Money 20 97.6% 73.8%
OC Own Company 84 97.9% 94.3%
CC Co-Own Company 9 99.4% 87.2%
WM Water Management 3 99.4% 49.8%
WC Work for a Company 84 93.7% 81.7%
OT Other 81 86.4% 54.1%
530
14 94.9% 66.0% AVG
91.8% 61.8%
WEIGHTED
AVG
What are your long-term career goals and how will the study of landscape architecture help you accomplish these goals?
I want to feel accomplished in my career; I desire to be an established landscape architect;
Learn as much as I can; Get a higher degree;
Promote designs that make for healthier environments; Sustainability; Environmental friendly; Green design; Green
roofs; Rain Gardens;
Public designs; Public work; Community involvement; Urban design;
I would like to teach at a university;
I want to combine with architecture and interior design; I want to work with other disciplines;
Watershed management; water purification; stormwater management;
Get a job; Work at a firm;
None of the above.
Property development;
I hope to make lots of money;
I plan to have my own landscaping company; I already own my own company and hope to bring landscape
architecture to it;
I hope to be a partner of a landscape architecture firm;

108
INFLUENCE
28b
n Agree Kappa
EP Employer 5 99.7% 88.7%
FM Family 14 99.4% 92.0%
FR Friend 8 99.4% 85.4%
PL Professional LA 7 98.8% 59.5%
SM School Mentor 7 99.7% 92.2%
SF Self 6 99.1% 66.3%
OT Other 11 97.9% 52.5%
58
7 99.1% 76.6% AVG
99.1% 79.7%
WEIGHTED
AVG
Were there other people in your life that influenced this decision? If so, please explain.
My boss during high school;
Children; siblings; parents; uncle; etc.
Friend
A Landscape Architect influenced my career path; A garden designer;
High school advisor, teacher, coach; Advisor
My own decision
None of the above

109
CHOICE17
n Agree Kappa
OI Outdoor Interest 86 96.4% 90.1%
PI Planning Interest 14 97.6% 58.8%
PL Plant Interest 41 98.8% 94.2%
AR Art Interest 53 93.1% 71.2%
AI Architecture Interest 52 92.2% 62.4%
DI Design Interest 114 91.3% 79.2%
LI Landscaping Interest 74 88.6% 59.5%
WI Water Interest 1 100.0% 100.0%
ER Environmental Reasons 58 97.0% 88.8%
HI Human Interaction 26 94.9% 49.2%
FI Future Impact 33 93.7% 49.9%
MT Mentored 8 99.1% 76.5%
IB Industry Breadth 29 94.6% 52.1%
IR Industry Reputation 3 99.1% -0.4%
PS Passion 48 94.0% 70.5%
GF Good Fit 37 96.4% 78.7%
CG Challenge 6 99.4% 79.7%
ID Interdisciplinary 41 91.6% 44.0%
OT Other 73 85.8% 44.4%
797
19 95.4% 66.5% AVG
93.8% 66.6%
WEIGHTED
AVG
Why did you choose Landscape Architecture as your major?
I enjoy the outdoors;
I enjoy planning;
Interest in plants; Enjoy horticulture;
Interested in art;
I liked building growing up; Didn't get into architecture;
I enjoy designing/creating beautiful spaces; design process; problem solving;
It was interesting; I enjoy landscaping; I had experience in the field;
Stormwater, streams/watersheds
Environmental Reasons
Human/Nature interation; make a difference in the lives of people;
Positive impact on the future; To make the world a better place;
I was mentored/advised/influenced into the major;
Combination of sciences and arts; Ability to work with other fields on the same project;
Response includes something other than above;
I chose it because it was challenging;
My passion aligns with landscape architecture;
It was a good fit for my interests;
It has so many different career paths/opportunities; Broadness of the field; Job availability/placement;
I like the reputation of the field;

110
TRANSFER
19b
n Agree Kappa
AN Anthropology 2 100.0% 100.0%
AE Architectural Engineering 2 100.0% 100.0%
AT Architecture 36 99.7% 98.4%
AR Art 10 99.4% 88.6%
BI Biology 1 100.0% 100.0%
BS Business 7 100.0% 100.0%
CU Changed University 7 98.5% 43.9%
CH Chemistry 1 100.0% 100.0%
CE Civil Engineering 3 100.0% 100.0%
CM Communications 0 100.0%
ES Environmental Science 3 100.0% 100.0%
FM Film 1 100.0% 100.0%
GD Graphic Design 4 99.7% 85.6%
HT Horticulture 2 100.0% 100.0%
ID Interior Design 1 100.0% 100.0%
JN Journalism 2 100.0% 100.0%
KS Kinesiology 1 100.0% 100.0%
MF Medical Fields 4 99.7% 85.6%
JM No Jobs/Money 2 99.4% 0.0%
OE Other Engineering 10 100.0% 100.0%
PB Post Baccalaureate 4 98.8% 0.0%
PS Psychology 3 100.0% 100.0%
SO Sociology 1 100.0% 100.0%
UD Undeclared 11 99.4% 89.7%
OT Other 9 99.1% 79.5%
127
25 99.8% 93.6% AVG
99.6% 86.9%
WEIGHTED
AVG
I finished another major then started landscape architecture;
I transferred from psychology
I transferred from sociology
I chose landscape architecture after being undeclared; university studies;
Did you transfer into landscape architecture from another major? If so, please explain.
I transferred from anthropology
I transferred from architectural engineering;
I transferred from architecture;
I transferred from an art major
I transferred from biology
I transferred from a business major; accounting; economics; marketing; etc.
I changed universities to study landscape architect
I transferred from chemistry;
I transferred from civil engineering;
I transferred from communications
I transferred from environmental science; ecology;
I transferred from film
None of the above
I transferred from interior design;
I transferred from journalism
I transferred from graphic design;
I transferred from horticulture or plant sciences
I transferred from kinesiology; fitness; physical education; etc.
Nursing; Pre-med;
I transferred out of a major that had no job or money potential;
I transferred from engineering; (none of the other engineering majors like Mechanical, Aerospace, Industrial,
Biomedical, Electrical;)

111
MOTIVATION22
n Agree Kappa
OI Outdoor Interest 74 93.1% 77.5%
PI Planning Interest 19 97.9% 76.3%
PL Plant Interest 15 97.9% 68.5%
AR Art Interest 22 97.9% 80.0%
AI Architecture Interest 17 97.6% 68.0%
DI Design Interest 129 90.7% 79.3%
LI Landscaping Interest 41 94.3% 66.9%
WI Water Interest 6 99.7% 90.8%
HI Human Interaction 69 93.7% 78.2%
ER Environmental Reasons 81 91.6% 73.9%
FI Future Impact 63 86.1% 35.4%
MT Mentoring 8 100.0% 100.0%
IB Industry Breadth 55 91.9% 63.0%
IR Industry Reputation 0 100.0%
PS Passion 22 98.2% 83.3%
GF Good Fit 6 99.7% 90.8%
CG Challenge 15 97.9% 68.5%
ID Interdisciplinary 9 98.5% 60.8%
OT Other 84 83.1% 41.8%
735
19 95.2% 73.7% AVG
92.4% 68.6%
WEIGHTED
AVG
What was most attractive to you about landscape architecture and what is most motivating to you now?
I enjoy the outdoors; outdoor spaces
I enjoy planning;
Interest in plants; Enjoy horticulture;
Interested in art;
I liked building growing up; Didn't get into architecture;
I enjoy designing/creating beautiful spaces; design process; problem solving;
It was interesting; I enjoy landscaping; I had experience in the field;
Stormwater, streams/watersheds, rain gardens
Human/Nature interation; make a difference in the lives of people;
I am an environmentalist; Interest in nature/natural resources; sustainability; Green movement; Creating wildlife
habitat; ecology;
Positive impact on the future; To make the world a better place;
I was mentored/advised/influenced into the major;
Response includes something other than above;
My passion aligns with landscape architecture;
It was a good fit for my interests;
Industry Breadth
I like the reputation of the field;
I chose it because it was challenging;
Combination of sciences and arts; Ability to work with other fields on the same project;

112
PASSION23
n Agree Kappa
AC Architecture 8 99.4% 85.4%
AR Art 41 99.1% 95.7%
BW Better World 27 97.9% 85.7%
CR Cars 5 100.0% 100.0%
CP Computers 8 100.0% 100.0%
DC Design/Creativity 105 96.1% 90.7%
DR Drafting 4 99.7% 85.6%
EG Engineering 2 100.0% 100.0%
EH Environment Help 41 98.5% 92.7%
FM Family 8 99.7% 93.2%
GC Golf Course 7 100.0% 100.0%
GR Green Roofs 4 99.7% 85.6%
HS History 2 100.0% 100.0%
IP Influence People 44 95.8% 78.8%
LD Land Development 2 100.0% 100.0%
LA Landscape Architecture 138 91.3% 81.4%
LN Landscaping 5 99.7% 88.7%
LR Learning 2 99.7% 79.9%
LF Life 8 99.4% 85.4%
MN Money 1 100.0% 100.0%
MT Music/Theater 17 99.7% 96.8%
NR Natural Resources 8 100.0% 100.0%
OD Outdoors 52 99.1% 96.6%
PS Problem Solving 10 99.7% 88.7%
PG Photography 6 100.0% 100.0%
PT Plants 22 99.4% 95.1%
ST Spirtuality 2 100.0% 100.0%
SP Sports 26 98.5% 89.0%
TV Travel 5 100.0% 100.0%
UP Urban Planning 14 97.0% 42.9%
OT Other 76 81.9% 32.5%
700
31 99.0% 92.4% AVG
97.5% 92.4%
WEIGHTED
AVG
None of the above
Positive impact on peoples lives; Client satisfaction; Community involvement; Social justice; Social interactions
Urban planning; New urbanism;
Helping the environment; going green; being sustainable; environmental activism; Conservation; Restoration
Cars; Auto racing;
What do you consider your passion and does it relate to landscape architecture?
Art; Drawing;
Making the world a better place;
Plants; Horticulture;
Religion;
Golf; Soccer; Hockey; Baseball; Basketball; Etc.
Watersheds; Water management; Wildlife;
Being outdoors; Connecting with nature; Hiking; Biking; Climbing; Etc.
Solving problems; Making things work without flaw;

113
EDUCATION
26b
n Agree Kappa
AC Architecture 23 100.0% 100.0%
AR Art 3 100.0% 100.0%
AD Associate Degree 2 100.0% 100.0%
BS Business 10 99.4% 88.6%
CE Civil Engineering 1 100.0% 100.0%
ED Education 6 99.1% 66.3%
EV Environmental Design 2 100.0% 100.0%
ES Environmental Science 7 99.7% 92.2%
HT Horticulture 6 100.0% 100.0%
ID Interior Design 3 100.0% 100.0%
LA Landscape Architecture 26 99.4% 95.7%
MD Masters Degree 103 94.6% 86.7%
PD Ph.D. Degree 7 100.0% 100.0%
PN Planning 21 99.4% 94.7%
SS Social Sciences 3 99.7% 79.9%
OT Other 65 91.3% 66.1%
288
16 99.4% 94.6% AVG
97.3% 94.6%
WEIGHTED
AVG
Is this the last degree you are seeking? If not, please explain.
Additional degree in architecture; M Arch; MS Arch
Additional degree in art related fields
Associate degree (in general);
Additional degree in a business field
Additional degree in civil engineering;
Additional degree in education
Additional degree in environmental design
Additional degree in environmental science; ecology; forestry;
Additional degree in horticulture; Turfgrass management;
Additional degree in interior design
Additional degree in landscape architecture; MLA; MSLA;
Masters degree (in general);
None of the above
Psychology; Sociology; etc.
Ph.D. (in general);
Additional degree in planning

114
ENCOURAGEMENT
30b
n Agree Kappa
EP Employer My boss during high school; 5 100.0% 100.0%
FM Family Children; siblings; parents; uncle; etc. 8 99.7% 93.2%
FR Friend Friend; Family friend; 2 100.0% 100.0%
PL Professional LA A Landscape Architect influenced my career path; A garden designer; 5 99.7% 88.7%
SM School Mentor High school advisor, teacher, coach; Advisor 1 99.7%
OT Other None of the above 7 99.7% 92.2%
28
6 99.0% 92.4% AVG
97.5% 92.4%
WEIGHTED
AVG
Were there other people in your life that encouraged this decision? If so, please explain.

115
APPENDIX
C. GROUP DESCRIPTIVES (GENDER & AWARENESS)
StatisticTotal
(n = 331)Description
Male(n = 185)
Female(n = 114)
Aware(n = 183)
Not Awr(n = 143)
Age 23 Years old 22.93 22.39 21.64 24.46
Gender62%38%
MaleFemale
N/A N/A6436
5941
Hometown32%53%13%
RuralSuburban
Urban
345412
285318
39519
245519
Parents’Income
$79,000$30,700
(mean)(sd)
79,90031,900
75,00029,100
80,80030,100
76,10031,600
Parents’ Education(4-year degree)
54%50%64%40%
FatherMother
At least oneBoth
56516542
48536338
56516542
52506339
OtherConsidered
Majors
17%9%9%8%
ArchitectureEngineering
BusinessArt/Graphic Ds.
1610115
196413
19887
159109
Minor 30% Have a minor 30 34 27 37
FavoriteHigh School
Classes
14%12%11%10%6%5%5%
ArtMath
HistoryEnglish
PEDraftingBiology
1111149675
181279436
1412128564
14101111657
Univ. Location 80% Same state 83 75 79 81
Home to Univ.92.7
[16.0-208.4]Miles (median)
(interquartile range)87.5
[9.3-200.6]94.7
[35.3-229.2]103.4
[41.9-201.9]68.3
[6.5-208.1]More Education 46% Of respondents 46 46 48 44
AnticipatedWork
21%52%24%15%36%63%37%34%53%51%36%70%
AcademicDesign/Build
EntrepreneurialManagerial
Natural ResourceUrban Design
Land DevelopmentCommercial DesignResidential DesignEcol. Restoration
Land Use Plan/PolicyPark/Recreation
235430223665423856523568
21491673563303049513376
195124183664373557503371
255525133864393450524171
Aware of LA12%44%44%
Before high schoolDuring high schoolAfter high school
124543
64648
21790
00
100Declared LA
as Major51%36%
FreshmanSophomore
5037
4738
7117
2160
Transfer into LA 32% From another major 29 34 15 52Choice
Univ. vs. LA52%48%
Chose university firstChose LA first
4749
5446
3660
6930
UniversityChoice Factors
8%52%74%33%23%42%41%40%
RecruitedUniv. reputationUniv. locationUniv. setting
LA faculty reputationLA dept. reputation
FinancialFamily/friends
954763122434337
453723925434247
959753828564345
645742818264035
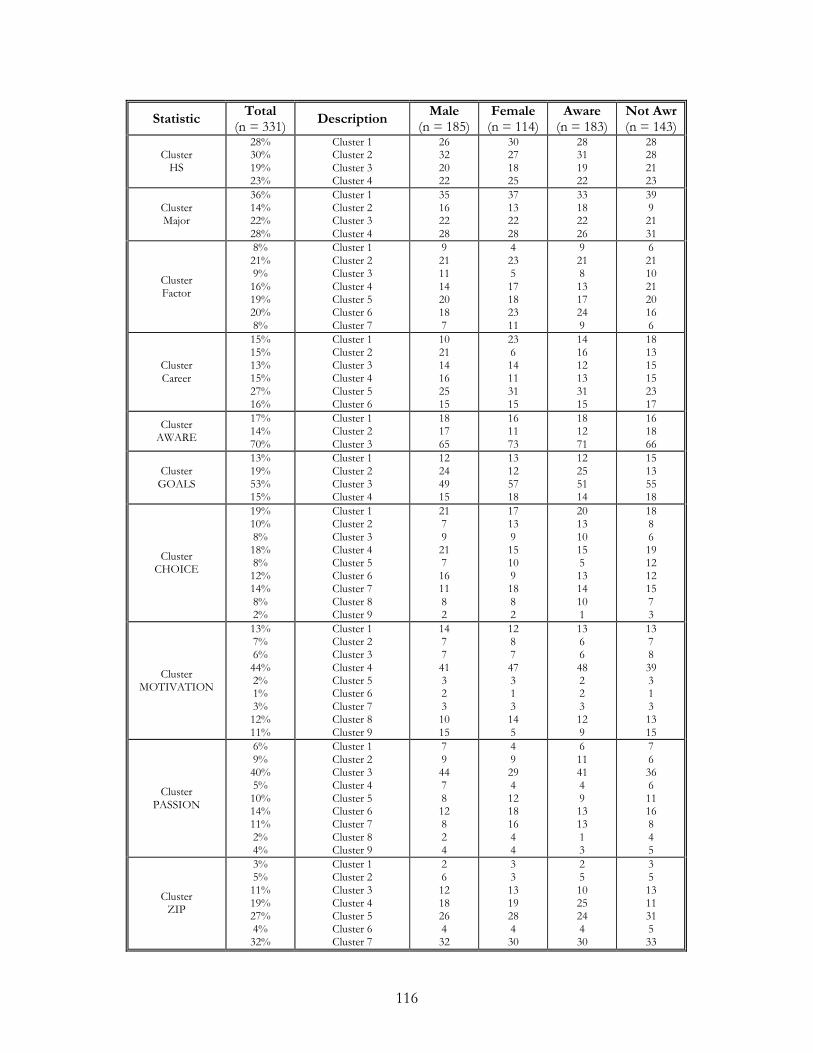
116
StatisticTotal
(n = 331)Description
Male(n = 185)
Female(n = 114)
Aware(n = 183)
Not Awr(n = 143)
ClusterHS
28%30%19%23%
Cluster 1Cluster 2Cluster 3Cluster 4
26322022
30271825
28311922
28282123
ClusterMajor
36%14%22%28%
Cluster 1Cluster 2Cluster 3Cluster 4
35162228
37132228
33182226
3992131
ClusterFactor
8%21%9%16%19%20%8%
Cluster 1Cluster 2Cluster 3Cluster 4Cluster 5Cluster 6Cluster 7
921111420187
423517182311
92181317249
621102120166
ClusterCareer
15%15%13%15%27%16%
Cluster 1Cluster 2Cluster 3Cluster 4Cluster 5Cluster 6
102114162515
23614113115
141612133115
181315152317
ClusterAWARE
17%14%70%
Cluster 1Cluster 2Cluster 3
181765
161173
181271
161866
ClusterGOALS
13%19%53%15%
Cluster 1Cluster 2Cluster 3Cluster 4
12244915
13125718
12255114
15135518
ClusterCHOICE
19%10%8%18%8%12%14%8%2%
Cluster 1Cluster 2Cluster 3Cluster 4Cluster 5Cluster 6Cluster 7Cluster 8Cluster 9
2179217161182
17139151091882
2013101551314101
18861912121573
ClusterMOTIVATION
13%7%6%44%2%1%3%12%11%
Cluster 1Cluster 2Cluster 3Cluster 4Cluster 5Cluster 6Cluster 7Cluster 8Cluster 9
1477413231015
128747313145
136648223129
1378393131315
ClusterPASSION
6%9%40%5%10%14%11%2%4%
Cluster 1Cluster 2Cluster 3Cluster 4Cluster 5Cluster 6Cluster 7Cluster 8Cluster 9
79447812824
4929412181644
6114149131313
763661116845
ClusterZIP
3%5%11%19%27%4%32%
Cluster 1Cluster 2Cluster 3Cluster 4Cluster 5Cluster 6Cluster 7
26121826432
33131928430
25102524430
35131131533

117
StatisticTotal
(n = 331)Description
Male(n = 185)
Female(n = 114)
Aware(n = 183)
Not Awr(n = 143)
OpenAWARE
"21 % AI""5 % AN""2 % AR""16 % DS""12 % FM""16 % FR""16 % LI""8 % OD""34 % PS""5 % PL""6 % PE""26 % SA""32 % UP""11 % OT"
2.11.04
Architecture InterestArchitecture Not
Art InterestDesign Interest
Family InfluenceFriend Influence
Landscaper InfluenceOutdoor Interest
Personal SearchingPlant Interest
Prior EmploymentScholastic AdvisingUniversity Program
Other(mean)
(sd)
"19 % AI""5 % AN""2 % AR""18 % DS""10 % FM""17 % FR""17 % LI""9 % OD""31 % PS""7 % PL""8 % PE""25 % SA""25 % UP""10 % OT"
2.0431.08
"26 % AI""4 % AN""3 % AR""14 % DS""12 % FM""13 % FR""11 % LI""6 % OD""33 % PS""3 % PL""4 % PE""31 % SA""43 % UP""11 % OT"
2.1580.98
"19 % AI""3 % AN""3 % AR""17 % DS""19 % FM""13 % FR""21 % LI""7 % OD""37 % PS""7 % PL""5 % PE""25 % SA""25 % UP""13 % OT"
2.1311.01
"24 % AI""7 % AN""2 % AR""15 % DS""5 % FM""21 % FR""10 % LI""9 % OD""31 % PS""3 % PL""8 % PE""27 % SA""43 % UP""8 % OT"
2.1331.02
OpenGOALS
"12 % AC""10 % CL""2 % GC""13 % EN""21 % HS""5 % HE""6 % MN""24 % OC""2 % CC"
"24 % WC""15 % OT"
1.3471.02
AccomplishmentContinue Learning
Golf Course DesignHelp Environment
Help SocietyHigher Education
MoneyOwn Company
Co-Own CompanyWork for a Company
Other(mean)
(sd)
"15 % AC""9 % CL""4 % GC""12 % EN""18 % HS""8 % HE""8 % MN""28 % OC""3 % CC"
"25 % WC""15 % OT"
1.4491.02
"10 % AC""13 % CL""1 % GC""13 % EN""26 % HS""3 % HE""4 % MN""18 % OC""1 % CC"
"23 % WC""18 % OT"
1.2811
"13 % AC""12 % CL""2 % GC""11 % EN""17 % HS""6 % HE""5 % MN""28 % OC""3 % CC"
"25 % WC""14 % OT"
1.3771.01
"11 % AC""8 % CL""3 % GC""15 % EN""26 % HS""4 % HE""7 % MN""19 % OC""1 % CC"
"24 % WC""17 % OT"
1.351.03
OpenENCOURAGE
MENT
"2 % EP""2 % FM""1 % FR""2 % PL""2 % OT"
0.0850.35
EmployerFamilyFriend
Professional LAOther(mean)
(sd)
"3 % EP""3 % FM""1 % FR""2 % PL""2 % OT"
0.1030.38
"1 % EP""2 % FM""1 % FR""1 % PL""4 % OT"
0.0790.33
"3 % EP""2 % FM""N % FR""2 % PL""2 % OT"
0.0820.35
"1 % EP""3 % FM""1 % FR""1 % PL""3 % OT"
0.0910.35
OpenEDUCATION
"8 % AC""1 % AR""1 % AD""4 % BS""0 % CE""1 % ED""1 % EV""4 % ES""2 % HT""1 % ID""7 % LA"
"30 % MD""2 % PD""7 % PN""1 % SS"
"11 % OT"0.8071.11
ArchitectureArt
Associate DegreeBusiness
Civil EngineeringEducation
Environment DesignEnvironment Science
HorticultureInterior Design
LAMasters DegreePh.D. Degree
PlanningSocial Sciences
Other(mean)
(sd)
"6 % AC""2 % AR""1 % AD""4 % BS""1 % CE""1 % ED""1 % EV""4 % ES""3 % HT""1 % ID""8 % LA"
"29 % MD""2 % PD""7 % PN"
"NA % SS""14 % OT"
0.8221.1
"9 % AC""1 % AR""N % AD""4 % BS"
"N % CE""1 % ED""1 % EV""4 % ES""1 % HT""3 % ID""7 % LA"
"34 % MD""3 % PD""9 % PN""2 % SS""9 % OT"
0.8511.15
"8 % AC""2 % AR""1 % AD""4 % BS""N % CE""1 % ED""2 % EV""4 % ES""2 % HT""1 % ID""9 % LA"
"29 % MD""3 % PD""7 % PN""1 % SS""9 % OT"
0.7981.16
"8 % AC""1 % AR""N % AD""4 % BS""1 % CE""1 % ED""N % EV""4 % ES""2 % HT""2 % ID""6 % LA"
"33 % MD""1 % PD""8 % PN""1 % SS"
"13 % OT"0.8461.07

118
StatisticTotal
(n = 331)Description
Male(n = 185)
Female(n = 114)
Aware(n = 183)
Not Awr(n = 143)
OpenPASSION
"1 % AC""13 % AR""4 % BW""2 % CR""2 % CP"
"22 % DC""0 % DR""0 % EG""10 % EH""3 % FM""2 % GC""0 % GR""1 % HS""19 % IP""1 % LD""4 % LA""2 % LN""1 % LR""4 % LF""0 % MN""5 % MT""4 % NR"
"16 % OD""2 % PS""2 % PG""7 % PT""1 % ST""7 % SP""2 % TV""2 % UP""8 % OT"
1.9671.31
ArchitectureArt
Better WorldCars
ComputersDesign/Creativity
DraftingEngineering
Environment HelpFamily
Golf CourseGreen Roofs
HistoryInfluence People
Land DevelopmentLA
LandscapingLearning
LifeMoney
Music/TheatreNatural Resources
OutdoorsPhilosophy
PhotographyPlants
SpiritualitySportsTravel
Urban PlanningOther(mean)
(sd)
"1 % AC""11 % AR""4 % BW""2 % CR""3 % CP"
"18 % DC""N % DR""N % EG""10 % EH""3 % FM""3 % GC""1 % GR""N % HS""14 % IP""1 % LD""6 % LA""3 % LN""1 % LR""5 % LF""1 % MN""6 % MT""5 % NR"
"16 % OD""2 % PS""2 % PG""5 % PT""2 % ST""11 % SP""1 % TV""2 % UP"
"10 % OT"2
1.34
"1 % AC""18 % AR""4 % BW""N % CR""1 % CP"
"28 % DC""1 % DR""1 % EG""11 % EH""1 % FM""1 % GC""N % GR""1 % HS""29 % IP""1 % LD""2 % LA""N % LN""N % LR""3 % LF"
"N % MN""4 % MT""2 % NR"
"17 % OD""1 % PS""2 % PG""9 % PT""1 % ST""3 % SP""3 % TV""4 % UP""6 % OT"
2.0611.23
"2 % AC""14 % AR""3 % BW""1 % CR""1 % CP"
"19 % DC""1 % DR""1 % EG""12 % EH""2 % FM""2 % GC""1 % GR""1 % HS""20 % IP""1 % LD""4 % LA""3 % LN""N % LR""5 % LF""1 % MN""4 % MT""4 % NR"
"16 % OD""1 % PS""1 % PS""7 % PT""1 % ST""7 % SP""1 % TV""1 % UP""7 % OT"
1.941.24
"1 % AC""11 % AR""5 % BW""2 % CR""4 % CP"
"26 % DC""N % DR""N % EG""8 % EH""3 % FM""2 % GC""N % GR""N % HS""18 % IP""1 % LD""3 % LA""1 % LN""1 % LR""3 % LF"
"N % MN""6 % MT""3 % NR"
"17 % OD""2 % PS""3 % PG""6 % PT""1 % ST""8 % SP""2 % TV""4 % UP""9 % OT"
2.0561.38
OpenMOTIVATION
"12 % OI""3 % PI""5 % PL""7 % AR""3 % AI"
"45 % DI""5 % LI""1 % WI""29 % HI""25 % ER""11 % FI""3 % MT""21 % IB""6 % PS""2 % GF""9 % CG""5 % ID"
"13 % OT"2.0571.46
Outdoor InterestPlanning Interest
Plant InterestArt Interest
Architecture InterestDesign Interest
Landscaping InterestWater Interest
Human InteractionEnvironment Reasons
Future ImpactMentoring
Industry BreadthPassion
Good FitChallenge
InterdisciplinaryOther(mean)
(sd)
"11 % OI""3 % PI""5 % PL""6 % AR""5 % AI"
"49 % DI""6 % LI""2 % WI""29 % HI""28 % ER""13 % FI""2 % MT""19 % IB""6 % PS""2 % GF""8 % CG""5 % ID"
"16 % OT"2.131.43
"14 % OI""4 % PI""6 % PL""8 % AR""2 % AI"
"44 % DI""4 % LI""1 % WI""34 % HI""22 % ER""11 % FI""4 % MT""25 % IB""6 % PS""2 % GF"
"13 % CG""4 % ID""8 % OT"
2.1231.49
"13 % OI""3 % PI""4 % PL""6 % AR""3 % AI"
"46 % DI""5 % LI""2 % WI""30 % HI""26 % ER""10 % FI""3 % MT""22 % IB""8 % PS""2 % GF""9 % CG""4 % ID"
"10 % OT"2.0661.47
"10 % OI""3 % PI""6 % PL""8 % AR""3 % AI"
"45 % DI""6 % LI""1 % WI""29 % HI""24 % ER""13 % FI""3 % MT""20 % IB""4 % PS""1 % GF"
"10 % CG""6 % ID"
"17 % OT"2.0911.43

119
StatisticTotal
(n = 331)Description
Male(n = 185)
Female(n = 114)
Aware(n = 183)
Not Awr(n = 143)
Open TRANSFER
"1 % AN""1 % AE""11 % AT""3 % AR""0 % BI""3 % BS""3 % CU""0 % CH""1 % CE""1 % ES""0 % FM""1 % GD""1 % HT""0 % ID""1 % JN""0 % KS""1 % MF""2 % JM""3 % OE""1 % PB""1 % PS""0 % SO""2 % UD""2 % OT"
0.3930.67
AnthropologyArch. Engineering
ArchitectureArt
BiologyBusiness
Changed UniversityChemistry
Civil EngineeringEnvironment Science
FilmGraphic Design
HorticultureInterior Design
JournalismKinesiology
Medical FieldsNo Jobs/Money
Other EngineeringPost Baccalaureate
PsychologySociology
UndeclaredOther(mean)
(sd)
"1 % AN""N % AE""9 % AT""2 % AR""N % BI""3 % BS""2 % CU""1 % CH""N % CE""1 % ES"
"N % FM""1 % GD""1 % HT""N % ID""1 % JN""N % KS""2 % MF""3 % JM""4 % OE""2 % PB""N % PS""1 % SO""1 % UD""3 % OT"
0.3510.63
"N % AN""2 % AE""13 % AT""5 % AR""1 % BI""1 % BS""5 % CU""N % CH""N % CE""2 % ES""1 % FM""2 % GD""N % HT""1 % ID""1 % JN""1 % KS""1 % MF""1 % JM""2 % OE""1 % PB""3 % PS"
"N % SO""4 % UD""2 % OT"
0.4650.74
"N % AN""1 % AE""6 % AT""1 % AR""N % BI""3 % BS""2 % CU""N % CH""1 % CE""2 % ES"
"N % FM""N % GD""1 % HT""N % ID""N % JN""N % KS""N % MF""N % JM""2 % OE""1 % PB""N % PS""1 % SO""1 % UD"1 % OT"
0.2020.53
"1 % AN""N % AE""17 % AT""6 % AR""1 % BI""3 % BS""5 % CU""1 % CH""1 % CE""1 % ES""1 % FM""2 % GD""1 % HT""1 % ID""1 % JN""1 % KS""3 % MF""4 % JM""5 % OE""1 % PB""2 % PS"
"N % SO""4 % UD""4 % OT"
0.650.75
Open INFLUENCE
"2 % EP""4 % FM""2 % FR""0 % LS""3 % PL""2 % SM""2 % SF""2 % OT"
0.1780.54
EmployerFamilyFriend
LA StudentProfessional LASchool Mentor
SelfOther(mean)
(sd)
"3 % EP""4 % FM""3 % FR""1 % LS""4 % PL""3 % SM""2 % SF""3 % OT"
0.2220.61
"N % EP""4 % FM""1 % FR""N % LS""1 % PL""2 % SM""3 % SF""1 % OT"
0.1050.36
"2 % EP""4 % FM""3 % FR""N % LS""3 % PL""3 % SM""2 % SF""2 % OT"
0.1750.55
"1 % EP""5 % FM""2 % FR""1 % LS""3 % PL""2 % SM""3 % SF""2 % OT"
0.1890.54
OpenCHOICE
"20 % OI""2 % PI"
"11 % PL""17 % AR""15 % AI""40 % DI""17 % LI""20 % HI""11 % ER""4 % FI"
"4 % MT""11 % IB""8 % PS"
"10 % GF""2 % CG""11 % ID""16 % OT"
2.1781.24
Outdoor InterestPlanning Interest
Plant InterestArt Interest
Architecture InterestDesign Interest
Landscaping InterestHuman Interaction
Environment ReasonsFuture Impact
MentoredIndustry Breadth
PassionGood FitChallenge
InterdisciplinaryOther(mean)
(sd)
"17 % OI""3 % PI""8 % PL"
"15 % AR""13 % AI""39 % DI""15 % LI""21 % HI""12 % ER""5 % FI"
"3 % MT""12 % IB""8 % PS""8 % GF""3 % CG""9 % ID"
"21 % OT"2.1081.27
"25 % OI""2 % PI"
"17 % PL""18 % AR""16 % AI""44 % DI""18 % LI""22 % HI""11 % ER""3 % FI"
"4 % MT""9 % IB""8 % PS"
"12 % GF""2 % CG""13 % ID""11 % OT"
2.3331.26
"21 % OI""2 % PI"
"12 % PL""19 % AR""18 % AI""39 % DI""20 % LI""22 % HI""13 % ER""3 % FI"
"4 % MT""9 % IB""8 % PS""6 % GF""6 % GF""12 % ID""16 % OT"
2.2571.24
"20 % OI""3 % PI"
"10 % PL""15 % AR""11 % AI""43 % DI""15 % LI""19 % HI""8 % ER""5 % FI"
"3 % MT""13 % IB""8 % PS"
"15 % GF""1 % CG""10 % ID""16 % OT"
2.1541.19
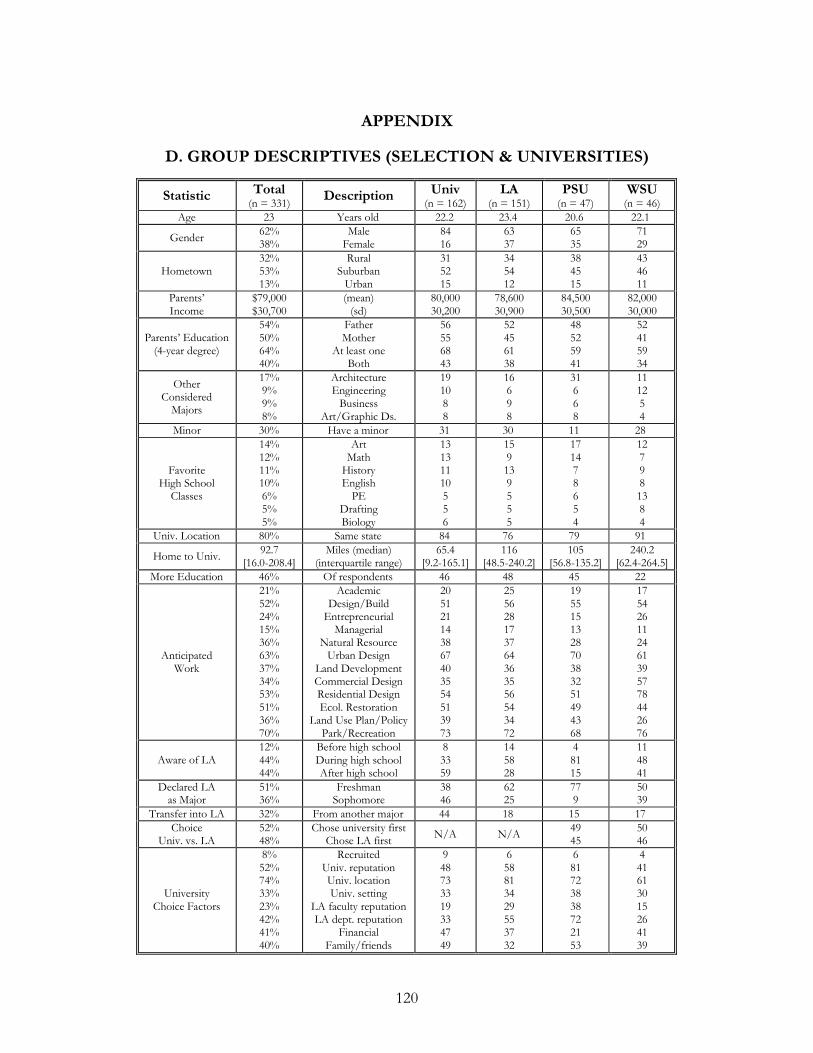
120
APPENDIX
D. GROUP DESCRIPTIVES (SELECTION & UNIVERSITIES)
Statistic Total(n = 331)
Description Univ(n = 162)
LA(n = 151)
PSU(n = 47)
WSU(n = 46)
Age 23 Years old 22.2 23.4 20.6 22.1
Gender62%38%
MaleFemale
8416
6337
6535
7129
Hometown32%53%13%
RuralSuburban
Urban
315215
345412
384515
434611
Parents’Income
$79,000$30,700
(mean)(sd)
80,00030,200
78,60030,900
84,50030,500
82,00030,000
Parents’ Education(4-year degree)
54%50%64%40%
FatherMother
At least oneBoth
56556843
52456138
48525941
52415934
OtherConsidered
Majors
17%9%9%8%
ArchitectureEngineering
BusinessArt/Graphic Ds.
191088
16698
31668
111254
Minor 30% Have a minor 31 30 11 28
FavoriteHigh School
Classes
14%12%11%10%6%5%5%
ArtMath
HistoryEnglish
PEDraftingBiology
13131110556
159139555
171478654
127981384
Univ. Location 80% Same state 84 76 79 91
Home to Univ.92.7
[16.0-208.4]Miles (median)
(interquartile range)65.4
[9.2-165.1]116
[48.5-240.2]105
[56.8-135.2]240.2
[62.4-264.5]More Education 46% Of respondents 46 48 45 22
AnticipatedWork
21%52%24%15%36%63%37%34%53%51%36%70%
AcademicDesign/Build
EntrepreneurialManagerial
Natural ResourceUrban Design
Land DevelopmentCommercial DesignResidential DesignEcol. Restoration
Land Use Plan/PolicyPark/Recreation
205121143867403554513973
255628173764363556543472
195515132870383251494368
175426112461395778442676
Aware of LA12%44%44%
Before high schoolDuring high schoolAfter high school
83359
145828
48115
114841
Declared LAas Major
51%36%
FreshmanSophomore
3846
6225
779
5039
Transfer into LA 32% From another major 44 18 15 17Choice
Univ. vs. LA52%48%
Chose university firstChose LA first
N/A N/A4945
5046
UniversityChoice Factors
8%52%74%33%23%42%41%40%
RecruitedUniv. reputationUniv. locationUniv. setting
LA faculty reputationLA dept. reputation
FinancialFamily/friends
948733319334749
658813429553732
681723838722153
441613015264139

121
Statistic Total(n = 331)
Description Univ(n = 162)
LA(n = 151)
PSU(n = 47)
WSU(n = 46)
ClusterHS
28%30%19%23%
Cluster 1Cluster 2Cluster 3Cluster 4
27301924
31262023
23361723
3337247
ClusterMajor
36%14%22%28%
Cluster 1Cluster 2Cluster 3Cluster 4
43121630
28163025
32112632
46261513
ClusterFactor
8%21%9%16%19%20%8%
Cluster 1Cluster 2Cluster 3Cluster 4Cluster 5Cluster 6Cluster 7
10221014181612
62282115254
61921119384
4229203097
ClusterCareer
15%15%13%15%27%16%
Cluster 1Cluster 2Cluster 3Cluster 4Cluster 5Cluster 6
191214102817
131714102715
111115153020
11111144815
ClusterAWARE
17%14%70%
Cluster 1Cluster 2Cluster 3
171569
181468
111575
172657
ClusterGOALS
13%19%53%15%
Cluster 1Cluster 2Cluster 3Cluster 4
14165318
13235213
2195119
2374615
ClusterCHOICE
19%10%8%18%8%12%14%8%2%
Cluster 1Cluster 2Cluster 3Cluster 4Cluster 5Cluster 6Cluster 7Cluster 8Cluster 9
179719101114113
221310116141671
30116152159112
20130207241142
ClusterMOTIVATION
13%7%6%44%2%1%3%12%11%
Cluster 1Cluster 2Cluster 3Cluster 4Cluster 5Cluster 6Cluster 7Cluster 8Cluster 9
1277383241512
1366473131111
15664942296
979352002217
ClusterPASSION
6%9%40%5%10%14%11%2%4%
Cluster 1Cluster 2Cluster 3Cluster 4Cluster 5Cluster 6Cluster 7Cluster 8Cluster 9
6438510181234
71338510111024
99436613924
74351113151302
ClusterZIP
3%5%11%19%27%4%32%
Cluster 1Cluster 2Cluster 3Cluster 4Cluster 5Cluster 6Cluster 7
14131831529
56102025333
000850150
000087013

122
Statistic Total(n = 331)
Description Univ(n = 162)
LA(n = 151)
PSU(n = 47)
WSU(n = 46)
OpenAWARE
"21 % AI""5 % AN""2 % AR""16 % DS""12 % FM""16 % FR""16 % LI""8 % OD""34 % PS""5 % PL""6 % PE""26 % SA""32 % UP""11 % OT"
2.11.04
Architecture InterestArchitecture Not
Art InterestDesign Interest
Family InfluenceFriend Influence
Landscaper InfluenceOutdoor Interest
Personal SearchingPlant Interest
Prior EmploymentScholastic AdvisingUniversity Program
Other(mean)
(sd)
"24 % AI""7 % AN""2 % AR""18 % DS""10 % FM""20 % FR""15 % LI""8 % OD""32 % PS""3 % PL""3 % PE""25 % SA""44 % UP""8 % OT"
2.211.03
"19 % AI""3 % AN""3 % AR""14 % DS""15 % FM""13 % FR""17 % LI""9 % OD""38 % PS""7 % PL""9 % PE""26 % SA""23 % UP""13 % OT"
2.0990.99
"32 % AI""15 % AN""2 % AR""9 % DS"
"13 % FM""9 % FR""13 % LI""N % OD""38 % PS""N % PL""N % PE""23 % SA""32 % UP""6 % OT"
1.9150.95
"20 % AI""7 % AN""4 % AR""17 % DS""13 % FM""24 % FR""11 % LI""7 % OD""30 % PS""9 % PL"
"11 % PE""30 % SA""30 % UP""9 % OT"
2.2170.94
OpenGOALS
"12 % AC""10 % CL""2 % GC""13 % EN""21 % HS""5 % HE""6 % MN""24 % OC""2 % CC"
"24 % WC""15 % OT"
1.3471.02
AccomplishmentContinue Learning
Golf Course DesignHelp Environment
Help SocietyHigher Education
MoneyOwn Company
Co-Own CompanyWork for a Company
Other(mean)
(sd)
"11 % AC""10 % CL""2 % GC""14 % EN""24 % HS""6 % HE""7 % MN""19 % OC""1 % CC"
"27 % WC""18 % OT"
1.3950.96
"14 % AC""11 % CL""3 % GC""13 % EN""19 % HS""5 % HE""5 % MN""30 % OC""3 % CC"
"25 % WC""13 % OT"
1.3971.07
"17 % AC""6 % CL""2 % GC""21 % EN""21 % HS""N % HE""9 % MN""11 % OC""2 % CC"
"21 % WC""19 % OT"
1.2980.95
"22 % AC""13 % CL""4 % GC""2 % EN""11 % HS""7 % HE""7 % MN""39 % OC""2 % CC"
"35 % WC""15 % OT"
1.5650.78
OpenENCOURAGE
MENT
"2 % EP""2 % FM""1 % FR""2 % PL""2 % OT"
0.0850.35
EmployerFamilyFriend
Professional LAOther(mean)
(sd)
"1 % EP""2 % FM""1 % FR""N % PL""3 % OT"
0.0680.3
"3 % EP""1 % FM""1 % FR""3 % PL""1 % OT"
0.0990.4
"N % EP""2 % FM""2 % FR""2 % PL""2 % OT"
0.0850.35
"N % EP""N % FM""N % FR""N % PL""N % OT"
00
OpenEDUCATION
"8 % AC""1 % AR""1 % AD""4 % BS""0 % CE""1 % ED""1 % EV""4 % ES""2 % HT""1 % ID""7 % LA"
"30 % MD""2 % PD""7 % PN""1 % SS"
"11 % OT"0.8071.11
ArchitectureArt
Associate DegreeBusiness
Civil EngineeringEducation
Environment DesignEnvironment Science
HorticultureInterior Design
LAMasters DegreePh.D. Degree
PlanningSocial Sciences
Other(mean)
(sd)
"9 % AC""1 % AR""N % AD""4 % BS""1 % CE""1 % ED""1 % EV""3 % ES""1 % HT""2 % ID""7 % LA"
"36 % MD""2 % PD""10 % PN""1 % SS"
"10 % OT"0.9011.14
"7 % AC""2 % AR""1 % AD""5 % BS"
"N % CE""1 % ED""1 % EV""5 % ES""3 % HT""1 % ID""8 % LA"
"26 % MD""2 % PD""5 % PN""1 % SS"
"12 % OT"0.7811.12
"4 % AC""2 % AR""2 % AD""2 % BS""N % CE""2 % ED""N % EV""N % ES""N % HT""N % ID""4 % LA"
"23 % MD""N % PD""4 % PN""N % SS""6 % OT"
0.5110.86
"N % AC""2 % AR""N % AD""2 % BS""N % CE""N % ED""N % EV""2 % ES""7 % HT""N % ID""N % LA""13 % MD""2 % PD""N % PN""N % SS""4 % OT"
0.3260.7

123
Statistic Total(n = 331)
Description Univ(n = 162)
LA(n = 151)
PSU(n = 47)
WSU(n = 46)
OpenPASSION
"1 % AC""13 % AR""4 % BW""2 % CR""2 % CP"
"22 % DC""0 % DR""0 % EG""10 % EH""3 % FM""2 % GC""0 % GR""1 % HS""19 % IP""1 % LD""4 % LA""2 % LN""1 % LR""4 % LF""0 % MN""5 % MT""4 % NR"
"16 % OD""2 % PS""2 % PG""7 % PT""1 % ST""7 % SP""2 % TV""2 % UP""8 % OT"
1.9671.31
ArchitectureArt
Better WorldCars
ComputersDesign/Creativity
DraftingEngineering
Environment HelpFamily
Golf CourseGreen Roofs
HistoryInfluence People
Land DevelopmentLA
LandscapingLearning
LifeMoney
Music/TheatreNatural Resources
OutdoorsPhilosophy
PhotographyPlants
SpiritualitySportsTravel
Urban PlanningOther(mean)
(sd)
"1 % AC""14 % AR""4 % BW""2 % CR""3 % CP"
"27 % DC""1 % DR""N % EG""6 % EH""4 % FM""1 % GC""N % GR""1 % HS""20 % IP""1 % LD""3 % LA""2 % LN""1 % LR""4 % LF"
"N % MN""5 % MT""4 % NR"
"15 % OD""2 % PS""2 % PG""6 % PT""N % ST""7 % SP""2 % TV""3 % UP"
"10 % OT"2.0491.18
"1 % AC""13 % AR""4 % BW""1 % CR""1 % CP"
"17 % DC""N % DR""1 % EG""15 % EH""1 % FM""3 % GC""1 % GR""1 % HS""19 % IP""1 % LD""5 % LA""2 % LN""N % LR""5 % LF""1 % MN""5 % MT""4 % NR"
"19 % OD""1 % PS""2 % PG""9 % PT""3 % ST""7 % SP""1 % TV""2 % UP""7 % OT"
2.0071.42
"N % AC""13 % AR""4 % BW""4 % CR""2 % CP"
"17 % DC""2 % DR""N % EG""11 % EH""N % FM""4 % GC""N % GR""2 % HS""11 % IP""N % LD""2 % LA""N % LN""N % LR""2 % LF""2 % MN""6 % MT""2 % NR""6 % OD""2 % PS""2 % PG""2 % PT""2 % ST""6 % SP""4 % TV""2 % UP""2 % OT"
1.7451.17
"2 % AC""15 % AR""2 % BW""2 % CR""2 % CP"
"30 % DC""N % DR""N % EG""4 % EH""4 % FM""2 % GC""N % GR""N % HS""15 % IP""2 % LD""N % LA""7 % LN""N % LR""11 % LF""N % MN""11 % MT""7 % NR"
"17 % OD""N % PS""2 % PG""4 % PT""2 % ST""13 % SP""N % TV""N % UP""9 % OT"
2.3480.97
OpenMOTIVATION
"12 % OI""3 % PI""5 % PL""7 % AR""3 % AI"
"45 % DI""5 % LI""1 % WI""29 % HI""25 % ER""11 % FI""3 % MT""21 % IB""6 % PS""2 % GF""9 % CG""5 % ID"
"13 % OT"2.0571.46
Outdoor InterestPlanning Interest
Plant InterestArt Interest
Architecture InterestDesign Interest
Landscaping InterestWater Interest
Human InteractionEnvironment Reasons
Future ImpactMentoring
Industry BreadthPassion
Good FitChallenge
InterdisciplinaryOther(mean)
(sd)
"10 % OI""3 % PI""4 % PL""8 % AR""4 % AI"
"48 % DI""6 % LI""2 % WI""28 % HI""22 % ER""9 % FI"
"4 % MT""25 % IB""4 % PS""1 % GF"
"10 % CG""6 % ID"
"14 % OT"2.0861.31
"12 % OI""3 % PI""6 % PL""6 % AR""3 % AI"
"43 % DI""5 % LI""1 % WI""32 % HI""31 % ER""12 % FI""2 % MT""20 % IB""9 % PS""3 % GF""9 % CG""3 % ID"
"13 % OT"2.1461.59
"21 % OI""4 % PI""6 % PL""9 % AR""2 % AI"
"28 % DI""4 % LI""2 % WI""21 % HI""26 % ER""6 % FI"
"2 % MT""17 % IB""4 % PS"
"N % GF""9 % CG""4 % ID""6 % OT"
1.7231.3
"15 % OI""N % PI""9 % PL""9 % AR""4 % AI"
"61 % DI""9 % LI"
"N % WI""26 % HI""24 % ER""7 % FI"
"2 % MT""37 % IB""11 % PS""N % GF""9 % CG""N % ID""22 % OT"
2.4351.39

124
Statistic Total(n = 331)
Description Univ(n = 162)
LA(n = 151)
PSU(n = 47)
WSU(n = 46)
OpenTRANSFER
"1 % AN""1 % AE""11 % AT""3 % AR""0 % BI""3 % BS""3 % CU""0 % CH""1 % CE""1 % ES""0 % FM""1 % GD""1 % HT""0 % ID""1 % JN""0 % KS""1 % MF""2 % JM""3 % OE""1 % PB""1 % PS""0 % SO""2 % UD""2 % OT"
0.3930.67
AnthropologyArch. Engineering
ArchitectureArt
BiologyBusiness
Changed UniversityChemistry
Civil EngineeringEnvironment Science
FilmGraphic Design
HorticultureInterior Design
JournalismKinesiology
Medical FieldsNo Jobs/Money
Other EngineeringPost Baccalaureate
PsychologySociology
UndeclaredOther(mean)
(sd)
"1 % AN""1 % AE""17 % AT""4 % AR""1 % BI""4 % BS""2 % CU""1 % CH""1 % CE""1 % ES""1 % FM""1 % GD""1 % HT""1 % ID""1 % JN""1 % KS""2 % MF""2 % JM""4 % OE""1 % PB""1 % PS"
"N % SO""3 % UD""4 % OT"
0.5370.7
"1 % AN""N % AE""5 % AT""3 % AR""N % BI""2 % BS""5 % CU""N % CH""1 % CE""1 % ES"
"N % FM""1 % GD""N % HT""N % ID""N % JN""N % KS""1 % MF""2 % JM""2 % OE""2 % PB""1 % PS""1 % SO""1 % UD""1 % OT"
0.2720.64
"N % AN""N % AE""6 % AT""N % AR""N % BI""N % BS""2 % CU""2 % CH""N % CE""N % ES""N % FM""N % GD""N % HT""N % ID""N % JN""N % KS""N % MF""N % JM""N % OE""2 % PB""N % PS""N % SO""4 % UD""N % OT"
0.170.43
"N % AN""N % AE""4 % AT""2 % AR""N % BI""2 % BS"
"N % CU""N % CH""N % CE""N % ES""N % FM""N % GD""N % HT""N % ID""N % JN""N % KS""4 % MF""2 % JM""2 % OE""N % PB""N % PS""N % SO""N % UD""2 % OT"
0.1960.45
OpenINFLUENCE
"2 % EP""4 % FM""2 % FR""0 % LS""3 % PL""2 % SM""2 % SF""2 % OT"
0.1780.54
EmployerFamilyFriend
LA StudentProfessional LASchool Mentor
SelfOther(mean)
(sd)
"1 % EP""6 % FM""2 % FR""1 % LS""N % PL""2 % SM""2 % SF""1 % OT"
0.1540.52
"3 % EP""3 % FM""3 % FR""N % LS""5 % PL""3 % SM""2 % SF""3 % OT"
0.2050.58
"N % EP""2 % FM""2 % FR""N % LS""4 % PL""4 % SM""2 % SF"
"N % OT"0.1490.55
"4 % EP""2 % FM""2 % FR""N % LS""2 % PL""N % SM""N % SF""N % OT"
0.1090.38
OpenCHOICE
"20 % OI""2 % PI"
"11 % PL""17 % AR""15 % AI""40 % DI""17 % LI""20 % HI""11 % ER""4 % FI"
"4 % MT""11 % IB""8 % PS"
"10 % GF""2 % CG""11 % ID""16 % OT"
2.1781.24
Outdoor InterestPlanning Interest
Plant InterestArt Interest
Architecture InterestDesign Interest
Landscaping InterestHuman Interaction
Environment ReasonsFuture Impact
MentoredIndustry Breadth
PassionGood FitChallenge
InterdisciplinaryOther(mean)
(sd)
"19 % OI""2 % PI""8 % PL"
"17 % AR""17 % AI""36 % DI""19 % LI""17 % HI""9 % ER""4 % FI"
"4 % MT""10 % IB""7 % PS"
"12 % GF""1 % CG""10 % ID""16 % OT"
2.0861.05
"23 % OI""3 % PI"
"15 % PL""19 % AR""14 % AI""47 % DI""17 % LI""25 % HI""12 % ER""5 % FI"
"3 % MT""11 % IB""9 % PS""7 % GF""4 % CG""13 % ID""17 % OT"
2.4241.31
"13 % OI""2 % PI""4 % PL"
"17 % AR""21 % AI""26 % DI""23 % LI""19 % HI""9 % ER""4 % FI"
"4 % MT""17 % IB""13 % PS""4 % GF""6 % CG""17 % ID""21 % OT"
2.2131.2
"17 % OI""N % PI""20 % PL""20 % AR""9 % AI"
"46 % DI""20 % LI""7 % HI""7 % ER""N % FI"
"11 % MT""7 % IB""9 % PS""7 % GF""N % CG""4 % ID"
"26 % OT"2.0651.06
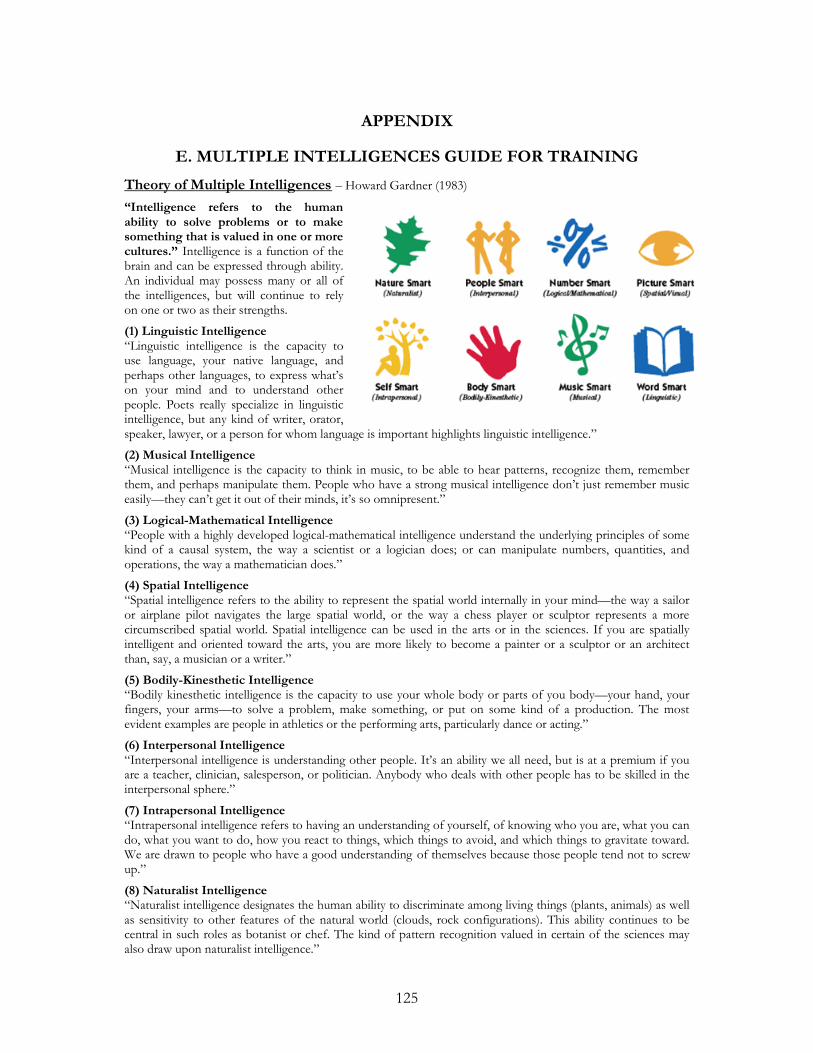
125
APPENDIX
E. MULTIPLE INTELLIGENCES GUIDE FOR TRAINING
Theory of Multiple Intelligences – Howard Gardner (1983)
“Intelligence refers to the humanability to solve problems or to makesomething that is valued in one or morecultures.” Intelligence is a function of thebrain and can be expressed through ability.An individual may possess many or all ofthe intelligences, but will continue to relyon one or two as their strengths.
(1) Linguistic Intelligence“Linguistic intelligence is the capacity touse language, your native language, andperhaps other languages, to express what’son your mind and to understand otherpeople. Poets really specialize in linguisticintelligence, but any kind of writer, orator,speaker, lawyer, or a person for whom language is important highlights linguistic intelligence.”
(2) Musical Intelligence“Musical intelligence is the capacity to think in music, to be able to hear patterns, recognize them, rememberthem, and perhaps manipulate them. People who have a strong musical intelligence don’t just remember musiceasily—they can’t get it out of their minds, it’s so omnipresent.”
(3) Logical-Mathematical Intelligence“People with a highly developed logical-mathematical intelligence understand the underlying principles of somekind of a causal system, the way a scientist or a logician does; or can manipulate numbers, quantities, andoperations, the way a mathematician does.”
(4) Spatial Intelligence“Spatial intelligence refers to the ability to represent the spatial world internally in your mind—the way a sailoror airplane pilot navigates the large spatial world, or the way a chess player or sculptor represents a morecircumscribed spatial world. Spatial intelligence can be used in the arts or in the sciences. If you are spatiallyintelligent and oriented toward the arts, you are more likely to become a painter or a sculptor or an architectthan, say, a musician or a writer.”
(5) Bodily-Kinesthetic Intelligence“Bodily kinesthetic intelligence is the capacity to use your whole body or parts of you body—your hand, yourfingers, your arms—to solve a problem, make something, or put on some kind of a production. The mostevident examples are people in athletics or the performing arts, particularly dance or acting.”
(6) Interpersonal Intelligence“Interpersonal intelligence is understanding other people. It’s an ability we all need, but is at a premium if youare a teacher, clinician, salesperson, or politician. Anybody who deals with other people has to be skilled in theinterpersonal sphere.”
(7) Intrapersonal Intelligence“Intrapersonal intelligence refers to having an understanding of yourself, of knowing who you are, what you cando, what you want to do, how you react to things, which things to avoid, and which things to gravitate toward.We are drawn to people who have a good understanding of themselves because those people tend not to screwup.”
(8) Naturalist Intelligence“Naturalist intelligence designates the human ability to discriminate among living things (plants, animals) as wellas sensitivity to other features of the natural world (clouds, rock configurations). This ability continues to becentral in such roles as botanist or chef. The kind of pattern recognition valued in certain of the sciences mayalso draw upon naturalist intelligence.”

126
APPENDIX
F. TEN PSYCHOGRAPHIC VARIABLES DEFINED
Ten psychographic variables add insights into the problem.
The ten psychographic variables defined in this research substantially contribute to
the understanding of why students choose a career path in LA. Most importantly, these
variables give interested parties a foundation for having a consistent dialogue regarding the
attributes of the LA students. However, the themes that can be extracted from these
variables are more relevant and important to this research.
1. MI HS classes: Intrinsic Measure of SDT’s authentic self
The first variable to consider, MI HS classes, is a classification of LA students based
on what they reported as their three favorite high school classes. Why were these classes
their favorite? Was it the content (valued ability/self-perceived competency)? Or was it the
instructor (relatedness/autonomous support)? Regardless of the exact response, the types of
responses align with intrinsic motivation and the integrated theoretical model. These
classifications, therefore, provide an understanding of what intrinsically motivates an LA
student based on past scholastic history. The four classifications (see Figure 3.15 for details)
represent normal distinct groups of LA students: Naturalists, Designers, Philosophers, and
surprisingly, Musicians.
2. MI majors: Extrinsic considerations of SDT’s introjected self
The second variable to consider, MI majors, is a classification of LA students based
on what they reported as other considered majors. These majors represent what the LA
students considered based on both internal and external influences. The four classifications

127
are similar to the first variable considered (see Figure 3.17 for details): Naturalists,
Designers, Philosophers, and Musicians. Pair-wise correlations at the MI level (see Figure
3.18) also demonstrate a relationship to the first variable. However, at the classification level,
there appears to be very little relationship between the two variables (see Figure 3.19). Why
are the variables correlated at the MI level but not at the classification level? I posit that the
other considered majors represent what LA students felt the world (external forces) expected
of them, so their considered majors aligned with their MI, but that were not necessarily
aligned with their intrinsic motivation. Such conflict represents the introjected self according
to SDT.
3. University FACTORS: Innate needs of autonomy and relatedness
The third variable to consider, FACTORS, is a classification of LA students based on
what they reported as being key factors for choosing their university (see Figure 3.11 for
details). The seven classifications are: Recruited, Setting, Financial, Location, Non-Location,
LA Reputation, and Family & Friends. Although two of the classifications partially emphasize
monetary rewards, these classifications represent a very small percentage (approximately
16%) of LA students. The classification process does not identify a group that is purely
motivated extrinsically (money)4. The classifications do relate to innate needs of SDT:
students want to have autonomy over their circumstances so choose a location/setting they
feel will supports their autonomy; students also want to feel related to the location/setting as
well as related to others: those who recruited them, members of the LA faculty, family and
4The Reputation classification could be argued as an extrinsic motivation. Although I cannot empirically test the argument, I would argue that in the
LA context, the Reputation classification is motivated by relatedness: the reputation of the university because I want to relate to my parents, siblingswho also attended; the department and faculty because I want to relate with them as I feel my interests align with their interests, etc.

128
friends. These motivational factors coupled with their anticipations represent key factors that
led to the decision to choose their university.
4. CAREER anticipations: Realistic, Unrealistic, or Clueless?
The fourth variable to consider, CAREER, is a classification of LA students based on
the type of work they anticipate during their career (see Figure 3.12 for details). The six
classifications are: Naturalist, Manager, Academic, Everyone Else, Residential Design/Build,
and Land Developer. Although these anticipations may be naïve, they represent the
perceptions of LA students prior to beginning a career in LA.
5. AWARE: introduction to LA based on autonomy or relatedness
The fifth variable to consider, AWARE, is a classification of LA students based on
how they became aware (not to be confused with the group comparisons of when they
became aware) of LA generally (see Figure 3.20 for details). The three classifications are:
Landscaper Influence, Friend Influence, and Everyone Else. The largest group can be
identifiable as an autonomous group: personal search was the key motivator. These students
sought out information from others. The other two groups represent relatedness in two
different ways: the first from a relationship with someone active in the LA community and
the second from someone considered a friend (with not mention of LA ties).
6. GOALS: long-term intrinsic anticipations
The sixth variable to consider, GOALS, is a classification of LA students based on
long-term career goals (see Figure 3.24 for details). The four classifications are: Help World,
Own Company, Everyone Else, and Other. Although these anticipations may again be naïve,
they represent the perceptions of LA students prior to beginning a career in LA. The largest

129
classification may consist of LA students who have yet to construct long-term anticipations.
Those who want to own their company may be classified as extrinsically motivated, but I
posit that the independence and autonomy of running things yourself is a more plausible,
and intrinsically motivated explanation (see monetary discussion in FACTOR above).
Altruistic goals of helping the environment and society align consistently with relatedness.
Other goals suggest long-term anticipations may not relate with LA related issues.
7. CHOICE: relevance of Interests as self-perceived competencies
The seventh variable to consider, CHOICE, is a classification of LA students based
on choosing to major in LA (see Figure 3.21 for details). The nine classifications are:
Passion, Interdisciplinary, Environmental, Everyone Else, Good Fit, Other, Outdoor
Interest, Architecture Interest, and Outdoor Other. Having so many classifications may be
difficult to keep track of, but the theory-anchored interpretation provides insights into this
key decision in the funnel process. The largest group only represents about 20% of students,
and the focus is on Passion. The key attributes of this classification suggest these individuals
are appropriately being provided appropriate autonomous support: their natural abilities are
motivating based on their planning interests, the support of mentors, and an intrinsic drive
to make the world a better place. A careful analysis of the other clusters reveals similar
findings: LA students want to feel competent about their interests and they want to relate to
their world and others.
8. MOTIVATION: potential introjected group among LA students
The eighth variable to consider, MOTIVATION, is a classification of LA students
based on general attractiveness and motivation of LA (see Figure 3.22 for details). The nine

130
classifications are: Environmental Future, Planning/Plants, Art, Everyone Else,
Environmental Industry, Water Interest, Interdisciplinary, Industry Breadth, and Other. This
high volume of classifications may be difficult to keep track of, but the theory-anchored
interpretation provides insights that overlap with previous variables introduced. Specifically,
only a small group (less than 18%) speaks of extrinsic factors as their motivation. Taken
holistically, there appears to be a group of about 15% of current LA students who have
some levels of extrinsic motivation. My proposed theory warrants that this group should be
further investigated to determine the degree of introjection such motivations represent. Do
they represent LA students who feel stuck in the program because it is too late to defect?
9. PASSION: perceptions based on MI ability and innate needs of SDT
The ninth variable to consider, PASSION, is a classification of LA students based on
their self-reported passion in life and its relationship to LA (see Figure 3.23 for details). The
nine classifications are: Golf/Photography, Environmental Help, Everyone Else,
Music/Theatre, Outdoors, Design/Creativity, Art, Urban Planning, and Better World. This
high volume of classifications may be difficult to keep track of, but it expands our
understanding of current LA students, especially considering that Passion is a classification
of CHOICE. Generally, 47% students reported that passion relates to their interest in LA
and 5% reported that it did not5 relate to LA. Although the largest classification, Everyone
Else, represents non-responsiveness or lack of specific passion, the remaining data (60% of
the sample) provides insights into LA students’ passions. Again, all of these remaining
5The remainder of students (approximately 52% did not address this facet of the question in their open-ended response).
131
classifications are tied to MI perceptions of ability and innate needs of competency,
relatedness, and autonomy.
10. LOCATION: varying comfort levels of LA students
The tenth and final variable to consider, LOCATION, is a classification of LA
students based on the differences between their hometown and the university town (see
Figure 3.25 for details). The seven classifications are: More College Town, More Inner-City
A, More Inner-City B, Higher-End, More Educated, Smaller, and Younger. This variable
identifies types of geographic discrepancies which may or may not support the LA student in
his/her studies at a university.