Eddy Current Probes · Eddy Current Probes The Largest Supplier of Steam Generator Probes Worldwide
Choice of Fluorescent ProbesSam Wells, September 18, 2003
???

Wells, 9/18/03
Initial questions
1. I think my investigation may benefit from fluorescence measurements, but I don’t know where to start.
2. I’m aware of published methods relevant to my investigation, but I need help to identify the “best” materials and methods.
Methods and techniques discussed elsewhere.

Wells, 9/18/03
A huge number of fluorescent probes are available for visualizing cellular structures, measuring ion concentrations, enzyme activity and for labeling nucleic acids and proteins in cell free and intact cell systems.
Key word “fluorescence” on PubMed yields >140,000 publications.
Use organized, comprehensive web resourcesAbundant applications information is available from
major fluorescent probe suppliers [www.probes.com]and from on-line educational sites [micro.magnet.fsu.edu/primer/techniques/fluorescence/fluorhome.html].

Wells, 9/18/03
Why is fluorescence the contrast mechanism of choice?
• Sensitivity • Live-cell compatible• Real-time detection• Specialized readout
techniques (FRET, FRAP, FLIM, TIRF etc)
• Multiplex labeling (blue nuclei, red mitochondria and so on)
• Environmental sensitivity
• Excitation light (photobleaching, phototoxicity)
• Wavelength-limited spatial resolution
• Extrinsic labeling usually required
• Environmental sensitivity
There are some (not insurmountable) disadvantages…..

Wells, 9/18/03
Topics
DYES/FluorophoresFluoresceinsRhodaminesCoumarinsAlexa FluorCyanine (Cy)BODIPYGFPQuantum dots
PROBESDye-antibody conjugatesNucleic Acid StainsTracersOrganelle markersPotential sensitive dyesLipid probes Enzyme substratesViability/toxicity/apoptosisEtc…..

Wells, 9/18/03
Dye Properties to Consider
Spectral (in the application environment)Excitation, Emission peaks, bandwidthsAbsorbance (εmax ), QFCompatibility with available optics
Physical and Chemicalenvironment sensitivity, e.g., pH, ions, solvent polarityphotostability (QB)permeabilitycharge, solubility (lipophilic, hydrophilic)
Many of these properties can be determined (approximately) by looking at the molecular structure.

Wells, 9/18/03
Cascade Blue (399/421)Aminomethylcoumarin (345/445)
Dansyl (335/515)
Lucifer Yellow (428/544)
BODIPY FL (503/512) DiIC (550/565)18
Fluorescein (490/520)Tetramethylrhodamine (555/580) Sulforhodamine 101 (595/615)
Iain Johnson / Molecular Probes

Wells, 9/18/03
“Classic” DyesFluorescein (FITC)
• Peak Ex/Em ~490/520 nm• εmax ~80,000 M-1cm-1
• pH sensitive• QY high in solution (pH>6) but typically quenched on proteins• Rapid photobleaching
Coumarin (AMCA)• Peak Ex/Em ~345/445 nm• εmax <20,000 M-1cm-1
• Wide emission bandwidth
Tetramethylrhodamine (TRITC)• Peak Ex/Em ~555/580 nm• εmax ~90,000 M-1cm-1
• Not pH sensitive• Aggregation and self-quenching in water • More photostable than fluorescein
Iain Johnson / Molecular Probes

Wells, 9/18/03
BODIPY Dyes
O
O
OCH2CNH(CH2)5CON
NB
N
FF
SO O
CH2CH2CNH(CH2)5CON
O
O
O O
CH3
CH3
CH3O
F F
NB
N
CH2CH2CON
O
O
H3C
H3C
F F
NB
N O
BODIPY FL(Ex/Em = 505/513 nm)
BODIPY TMR(Ex/Em = 542/574 nm)
BODIPY TR(Ex/Em = 589/617 nm)
Characteristics• No ionic charge • Many spectral colors• pH insensitive• Unstable in base or strong acid• Quenched protein conjugates
Applications• Lipid probes• Nucleotides• Peptides• Receptor ligands• Internal staining of microspheres
Iain Johnson / Molecular Probes
Wells, 9/18/03
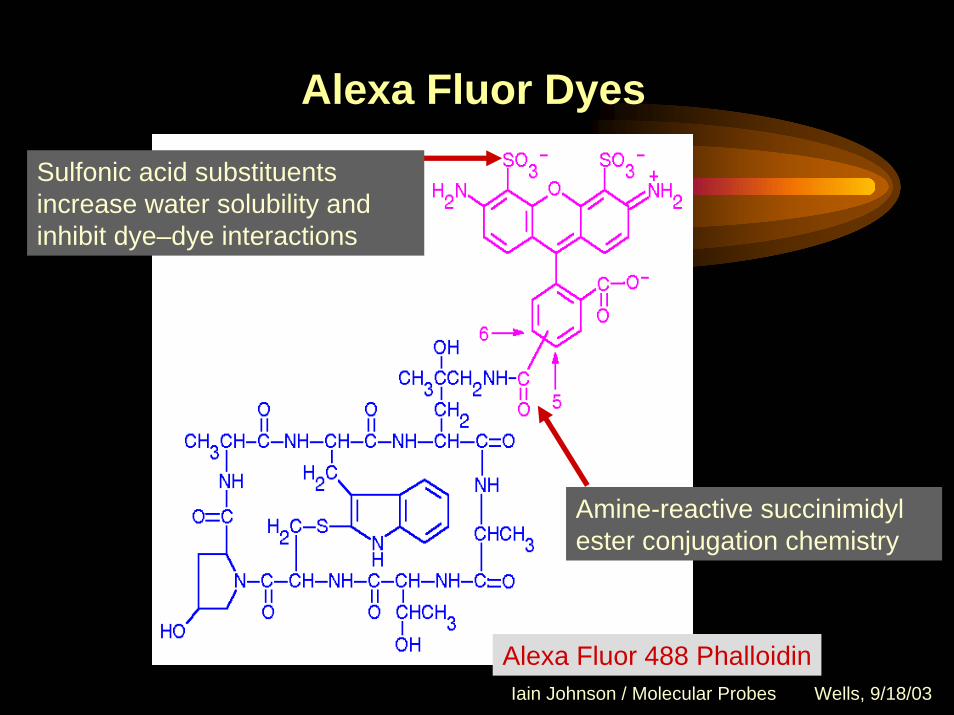
Alexa Fluor Dyes
Sulfonic acid substituentsincrease water solubility and inhibit dye–dye interactions
Amine-reactive succinimidylester conjugation chemistry
Alexa Fluor 488 PhalloidinIain Johnson / Molecular Probes

Wells, 9/18/03
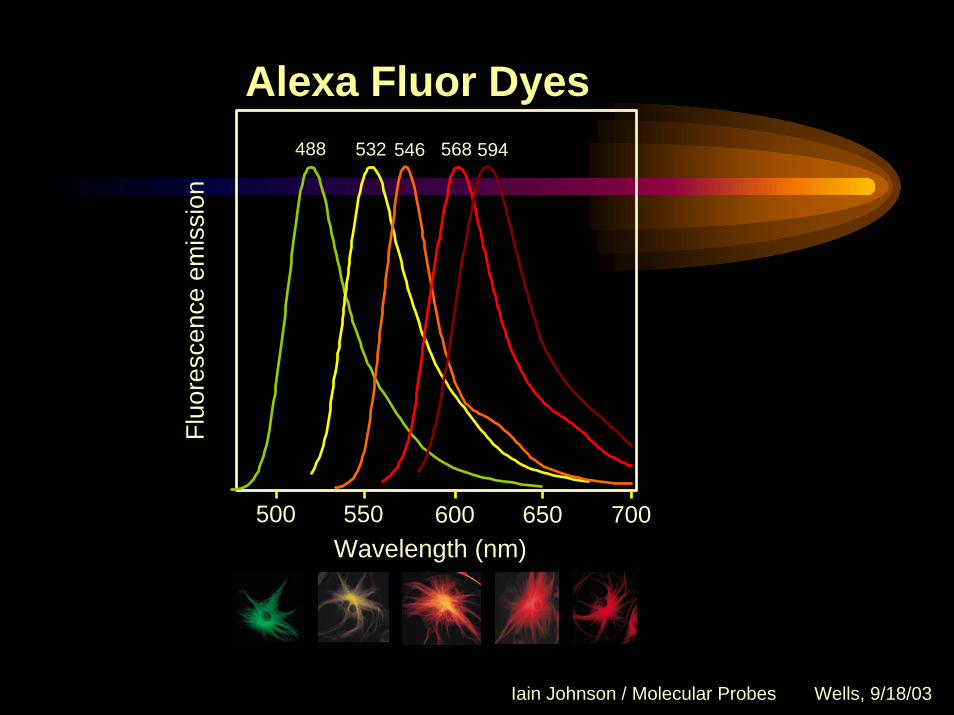
Alexa Fluor Dyes
• Designed for optimum performance in immunofluorescent labeling
BrightnessPhotostabilityAbsence of pH sensitivity
• Range of 18 structurally homologous(interchangeable) dyes matched to principal excitation lines from 350 nm to 750 nm
Iain Johnson / Molecular Probes
Wells, 9/18/03
Alexa Fluor Dyes
500Wavelength (nm)550 600 650 700
488 532 546 568 594
Fluo
resc
ence
em
issi
on
Iain Johnson / Molecular Probes

Wells, 9/18/03
Cy Dyes
+
NO
OC
N
OO
CH CH CH CH CH
CH3H3CSO3
−CH3H3C−
O3S
O O
N
C OONN
OOC
NCH CH CH
N
OO
−O3S SO3
−H3CH3C CH3CH3
+
Cy3.29Ex/Em = 550/570 nm
Cy5.18Ex/Em = 650/670 nm

Wells, 9/18/03
Cy Dye Fluorescence Emission Spectra
Cy3 Cy5

Sources of Autofluorescence (Natural Fluorophores) Analytical Biochemistry, 291, 175 (2001)
Source Organism/Tissue Ex (nm) Em (nm)Flavins CHO cells 380, 460 520
Rat hepatocytes 468 525Neural cells (rat, bovine) 488 540-560Goldfish inner ear 450 540Periplaneta americana <350 530
NAD(P)H Rat cardiomyocytes 395 509S. cerevisiae 366 440-470CHO cells 360 440-450
Lipofuscins Medulla (rat, human, rhesus monkey) 460-490 520Rat heart 450-490 550Muscle, myocardium, hepatocytes 360 540-560Human brain 435 481-673Rat liver 345 430Rat retina 390-490 >510
Collagen and elastin Aorta, coronary artery (human) 476 >515Skin (human) 442 470-520
Autofluorescence(ex/em= 488/530) of a typical 3T3 cell is equivalent to about 34,000 fluoresceinmolecules
No Ex > 500 nmNo Em >600 nm

Autofluorescence: Riboflavin
H3C
H3C N
N
NH
N
O
O
CH2
CHCHCHCH2OHHO
OH
OH
0
2000
4000
6000
8000
10000
12000
300 350 400 450 500 550 600 650 700 750 800Wavelength (nm)
Ext
inct
ion
coef
ficie
nt (M
-1cm
-1)
Fluo
resc
ence
em
issi
on
Fluorescence quantum yield = 0.3 (in ethanol)
Iain Johnson / Molecular Probes

Wells, 9/18/03
In nature, GFP fluorescence is excited by chemiluminescence.
In the lab, “engineered” GFP excitation requires an external light source.
Pictures courtesy Forbes on-line magazine
wtGFP

Wells, 9/18/03
Osamu Shimomura, then a scientist at Princeton, discovered GFP 40 years ago.
50,000 jellyfish, about two and a half tons yield a few hundred milligrams of GFP.
In the early 1990s, Douglas Prasher published his description of the GFP gene; Prasher sent Martin Chalfie a copy of the sequenced gene. Chalfie put it in bacteria and shined a blue light on them and they glowed. Chalfie's 1994 paper on the gene popularized it as a genetic marker. Chalfie's girlfriend, Tulle Hazelriggmade her own large contribution to GFP research as one of the first to attach GFP to other proteins, allowing scientists to watch where individual proteins go within a cell.
Pictures courtesy Forbes on-line magazine

Wells, 9/18/03
There are many variations of GFP
Roger Tsien, University of California, San Diego, systematically mutated the GFP gene to produce various colors and increased the brightness (extinction coefficient).
The intellectual property rights surrounding all GFP work are muddy, but Tsien's patents were strong enough to serve as one of the foundations for a biotech called Aurora Biosciences. Aurora was recently bought by Vertex Pharmaceuticals for nearly $600 million in stock.
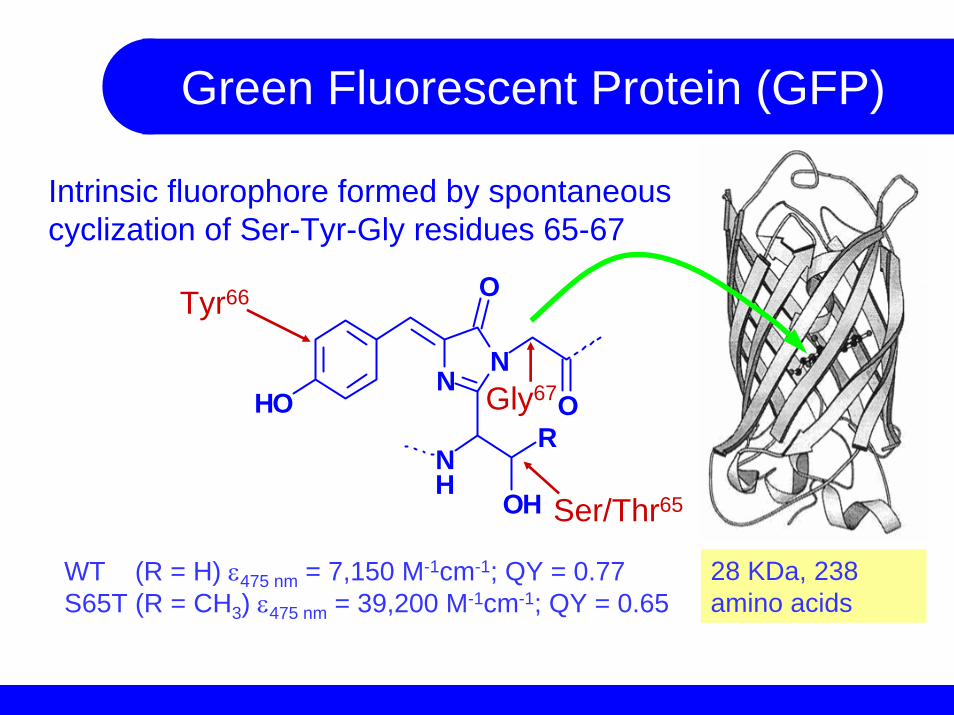
Green Fluorescent Protein (GFP)
Intrinsic fluorophore formed by spontaneous cyclization of Ser-Tyr-Gly residues 65-67
HON
N
O
O
NR
OHH
Tyr66
Gly67
Ser/Thr65
28 KDa, 238 amino acids
WT (R = H) ε475 nm = 7,150 M-1cm-1; QY = 0.77S65T (R = CH3) ε475 nm = 39,200 M-1cm-1; QY = 0.65

Wells, 9/18/03
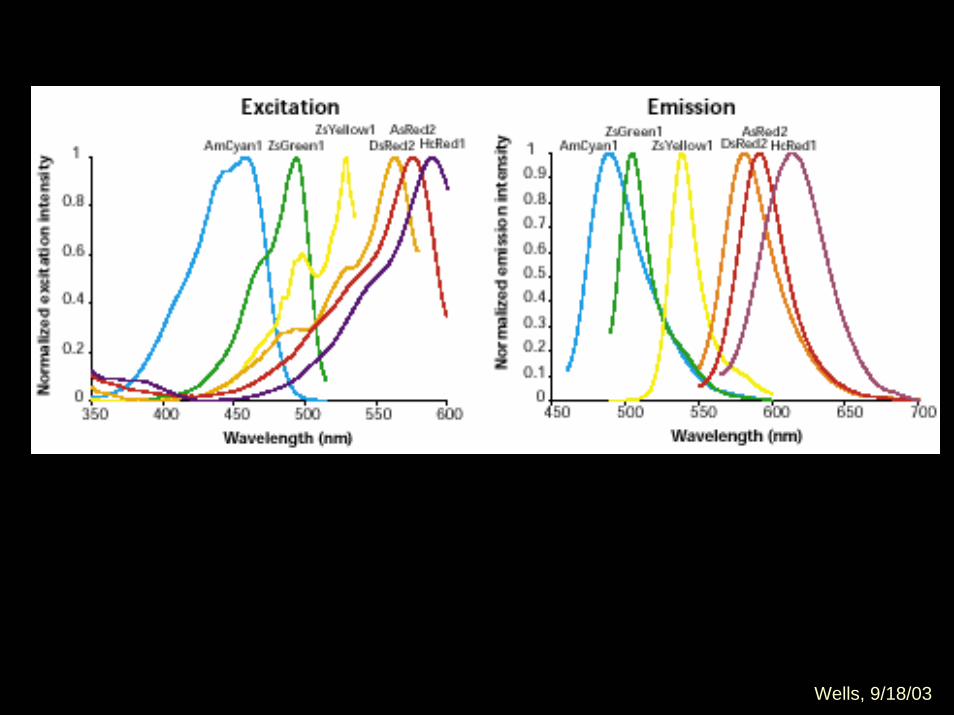
Clontech Reef Coral Fluorescent Proteins (RCFP)
Clonetech
Wells, 9/18/03

Wells, 9/18/03

Wells, 9/18/03
Dye and probe delivery is one of the main challenges of biological fluorescent probe design and application.
The use of GFP variants as genetically targeted and expressed (endogenous) probes is an extremely powerful advance in optical probe technology.
Combined with the utility of non-linear fluorescence excitation, whole, intact tissues and live animals can now be investigated by sensitive, selective, high resolution imaging.

Wells, 9/18/03
Cameleon
Cameleon YC 2.1, senses calcium ion concentrations in cells by fluorescence resonant energy transfer (FRET). If Ca2+ ions are bound, calmodulin (CaM) wraps around calmodulin-binding peptide (M13), and the construct forms a more compact shape, leading to a higher efficiency of excitation transfer from the donor CFP to the acceptor YFP. The degree of FRET in cameleon is therefore a sensitive ratiometric reporter of the concentration of Ca2+.
Developed by Roger Tsien

Wells, 9/18/03
Quantum Dots
Qdot corp
Quantum Dots are made from cadmium selenide and encased in a “shell” of zinc sulphite. QDots have relatively narrow fluorescence emission, the wavelength changes with the diameter of the nanocrystals. A 3 nm particle radiates green light at 520 nm, while a slightly larger 5.5 nm particle of the same material radiates red light at 630 nm.

Wells, 9/18/03
Biological labeling with QDots is challenging
The surface chemistry of Qdotshas been the major limitation for biological applications. Streptavidin conjugates have received mixed results.
The current state of Qdotcoupling chemistry is not yet competitive with synthetic organic dyes.
Qdots can NOT be used as environmental sensors. Nucleus: 2 nm CdSe nanocrystals
F-actin: 4 nm CdSe nanocrystalsScience 81: 2013 (1998)
Wells, 9/18/03
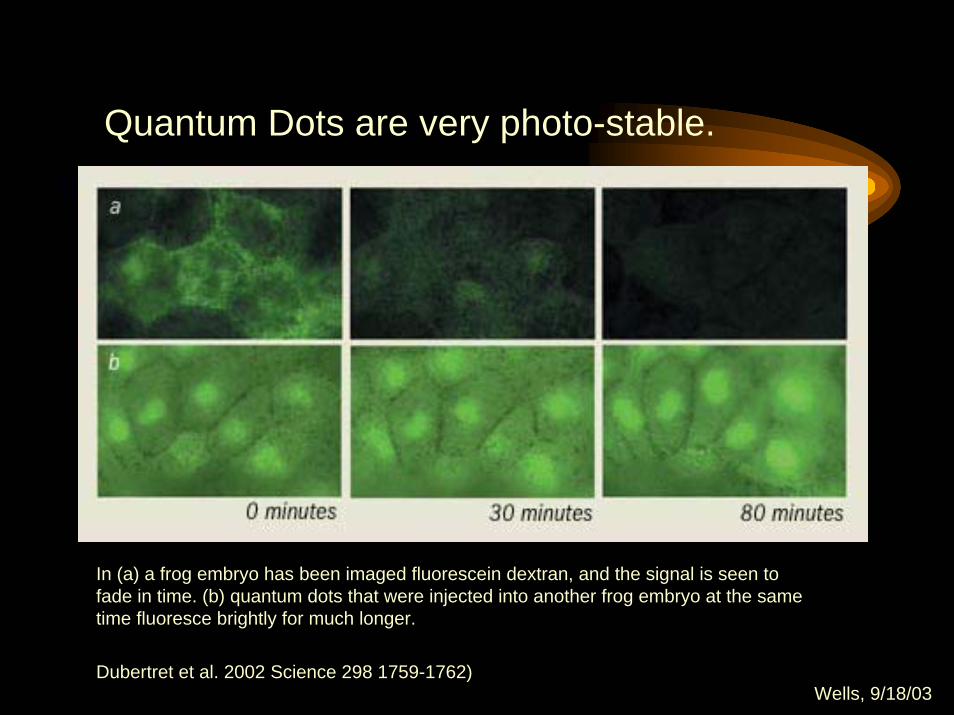
Quantum Dots are very photo-stable.
In (a) a frog embryo has been imaged fluorescein dextran, and the signal is seen to fade in time. (b) quantum dots that were injected into another frog embryo at the same time fluoresce brightly for much longer.
Dubertret et al. 2002 Science 298 1759-1762)

Wells, 9/18/03
Webb, et. al have used water-soluble quantum dots for multiphoton fluorescence imaging to visualize quantum dots dynamically through the skin of living mice, in capillaries hundreds of micrometers deep. Science. 2003 May 30;300(5624):1434-6.
Although the imaging results were not qualitatively superior to those acquired with organic dye tracers, the fluorescent Qdots were reported to have two-photon action cross sections as high as 47,000 Goeppert-Mayer units, 2-4 orders of magnitude higher than the 2-photon cross sections for organic dyes. This result suggests a unique advantage for Qdots in non-linear exited fluorescence – once the surface chemistry is sufficiently versatile for biological applications.

Wells, 9/18/03
Biochemical Selection Criteria for Probes• Targeting Specific, high-affinity probe – target
interactions needed for detection. Indirect detection schemes (e.g. propidium iodide for membrane integrity) can extend the range of possible applications
• Biocompatibility Probe should have minimal impact on the physiological and structural integrity and viability of the specimen
• Delivery Probe must be delivered to region of interest and remain there during the time required to collect data

Wells, 9/18/03
Fluorescent Probes - Tags and Chemical Sensors
Fluorescent tags generate contrast between an analyte and background, e.g., to identify receptors, or decorate cellular anatomy.
Fluorescent sensors or indicators change spectral properties in response to dynamic equilibria of chemical reactions, intracellular ions e.g., Ca2+, H+, and membrane potential.
Wells, 9/18/03
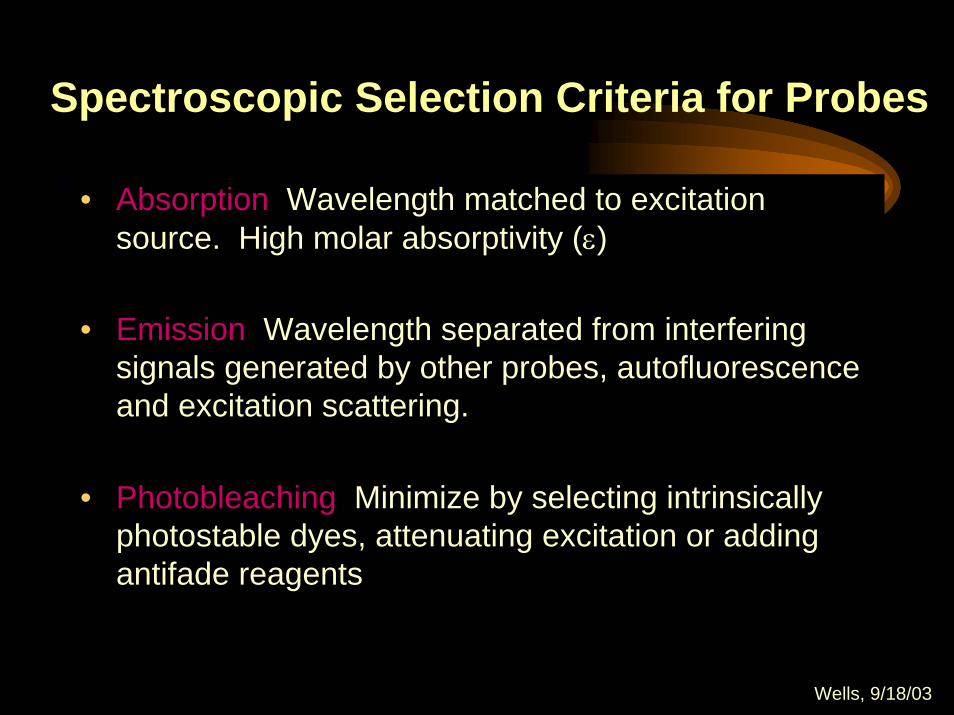
Spectroscopic Selection Criteria for Probes
• Absorption Wavelength matched to excitation source. High molar absorptivity (ε)
• Emission Wavelength separated from interfering signals generated by other probes, autofluorescence and excitation scattering.
• Photobleaching Minimize by selecting intrinsically photostable dyes, attenuating excitation or adding antifade reagents

Multiple Fluorophore Labeling: Quenching - too much of a good thing
Iain Johnson / Molecular Probes

Wells, 9/18/03
3-color confocal image: Spectral “compatibility”
Rat cerebellum labeled for GFAP (red, Cy5), IP3 (green, fluorescein) and nuclei (blue, propidium iodide). Extended focus image of 100 optical sections through 100 µm thick tissue.

Wells, 9/18/03
RNA Probes + Immuno-labeling + Signal Amplification
Four-color fluorescence in situ hybridization on a Drosophila embryo. A late blastoderm stage (nuclear cycle 14) embryo was probed with four different RNA probes. Blue: sog labeled with DNP, followed by a rabbit anti–dinitrophenyl-KLH IgG detected with an Alexa Fluor 647 chicken anti–rabbit. Green: ind labeled with biotin, followed by streptavidin HRP and Alexa Fluor 350 tyramide. Red: msh labeled with digoxigenin followed by sheep anti-digoxigenin antibody detected with an Alexa Fluor 488 donkey anti–sheep. Yellow: sna labeled with fluorescein followed by mouse anti-fluorescein antibody detected with an Alexa Fluor 555 goat anti–mouse. Dave Kosman and Ethan Bier, University of California, San Diego.

Wells, 9/18/03
Fluorescent Stains: high affinity and QfStains are fluorochromes that have natural affinity for specific molecular targets.
Target Stain• DNA, RNA propidium iodide, acridine orange, thiazole orange, yoyo
• Lipid Membranes diI, diO, alkyl-rhodamine cations
• Aqueous Tracers lucifer yellow, fluorescein, calcein, rhodamine dextran
Contrast is proportional to specific binding affinity, and enhancementof fluorescence on binding (Qbound/Qfree). For example,
ethidium bromide acridine orange YOYO-1 TOTO-1λmax
EX (nm) 481 493 457 480εmax (M-1cm-1) 5,448 53,000 109,000 101,000λmax
Em (nm) 616 535 - -
λmaxEX (nm) 526 502 491 514
εmax (M-1cm-1) 3,200 53,000 99,000 117,000λmax
Em (nm) 604 526 509 533Qbound 0.15 0.43 0.52 0.34
bound dye
unbound dye
Qbound /Qfree 21 2 460 1,400Ka 1.5 x 10⁵ 3.1 x 10⁴ 3.6 X 10⁸ 1.4 x 10⁹
Caution: Non-specific binding will degrade contrast

Wells, 9/18/03
Single T2 genomic DNA macromolecule stained with YOYO-1 (10 nM loading in very low concentration DNA in agarose). Wide-field image using a 1.4NA objective and CCD camera.
Unfortunately, YOYO-1 bleaches very fast.
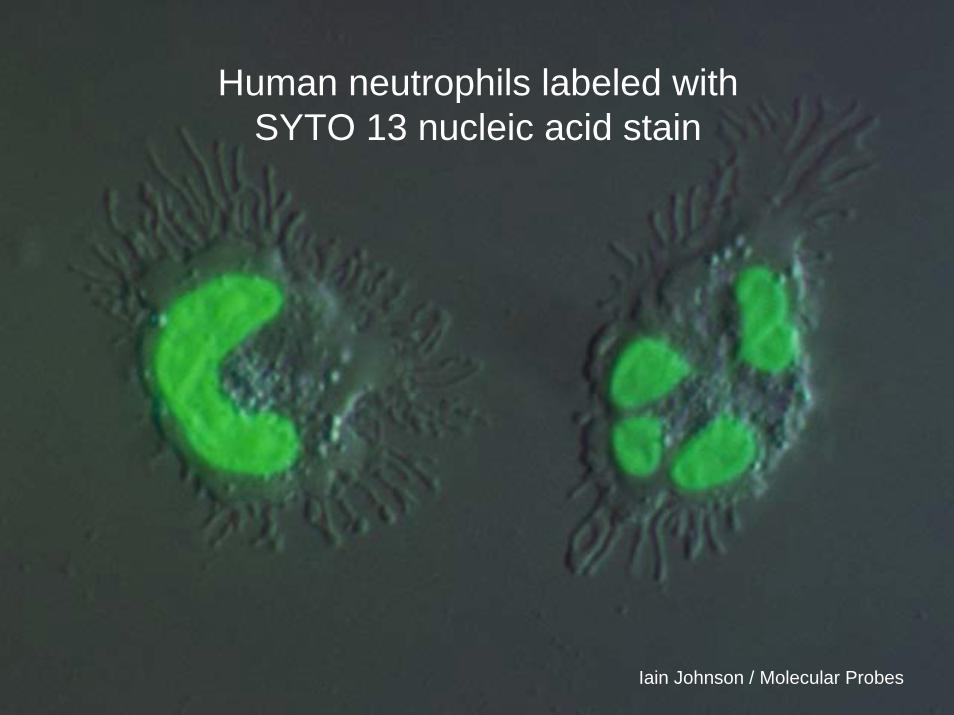
Human neutrophils labeled withSYTO 13 nucleic acid stain
Iain Johnson / Molecular Probes

Wells, 9/18/03
Molecular Probes
“Tracker” dyes
Three populations of mouse myeloma (P3X) cells stained with CellTracker Orange (CMTMR), Green (CMFDA) and Blue (CMAC). Each of three cell populations was stained with a different tracer and then the populations were mixed, to demonstrate that these tracers allow simultaneous long-term monitoring of different groups of cells in transplantation and other assays.

MitoTracker Red CMXRos
Peptide
O
CH2Cl
H
NN
SH
+N
CH2S
ON+N
CH2Cl
ON
PeptideOxidation
CM-H2XRosNonfluorescent
CMXRosFluorescent
CMXRosConjugate Fixable
Iain Johnson / Molecular Probes
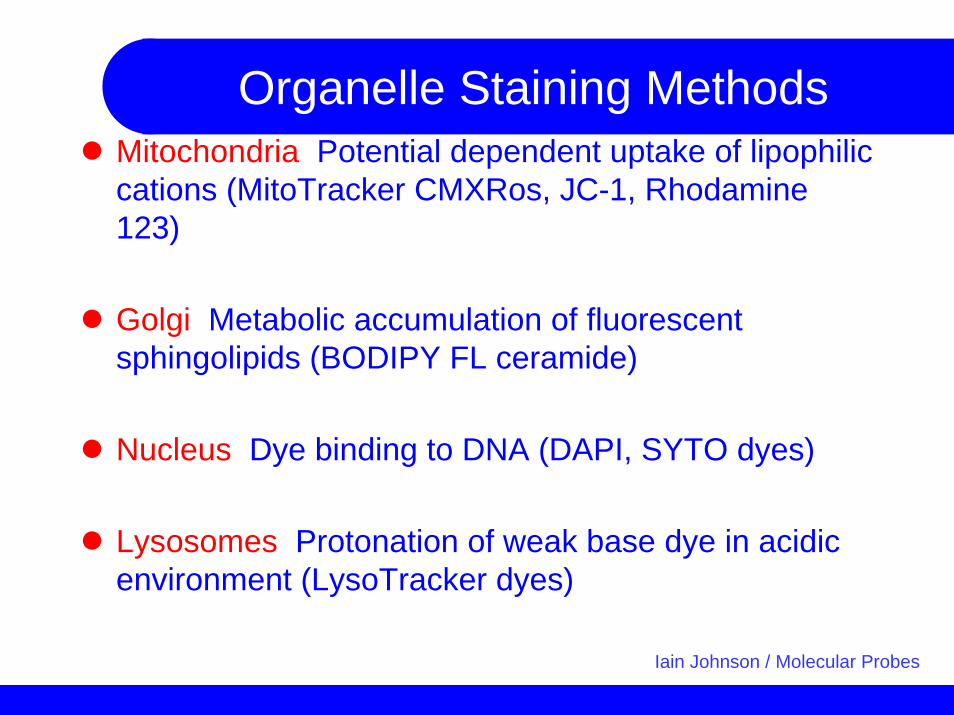
Organelle Staining MethodsMitochondria Potential dependent uptake of lipophilic cations (MitoTracker CMXRos, JC-1, Rhodamine123)
Golgi Metabolic accumulation of fluorescent sphingolipids (BODIPY FL ceramide)
Nucleus Dye binding to DNA (DAPI, SYTO dyes)
Lysosomes Protonation of weak base dye in acidic environment (LysoTracker dyes)
Iain Johnson / Molecular Probes

JC-1 Mitochondrial Potential Sensor
Human pre-adipocytes, Polarized
Depolarized, 50 nM FCCP
Iain Johnson / Molecular Probes

JC-1 Spectral Characteristics
J-aggregate
monomer
monomer
Abs
orpt
ion
Fluo
resc
ence
em
issi
on
400 450 500 550 600 650
Wavelength (nm) Iain Johnson / Molecular Probes

LysoTracker Red
N NB
F F CH2CH2 C
ONHCH2CH2N(CH3)2
NH
Iain Johnson / Molecular Probes
Potential-Sensitive Dyes
NN
−O3S
+
O N(CH3)2(CH3)2N
C OCH2CH3O
+
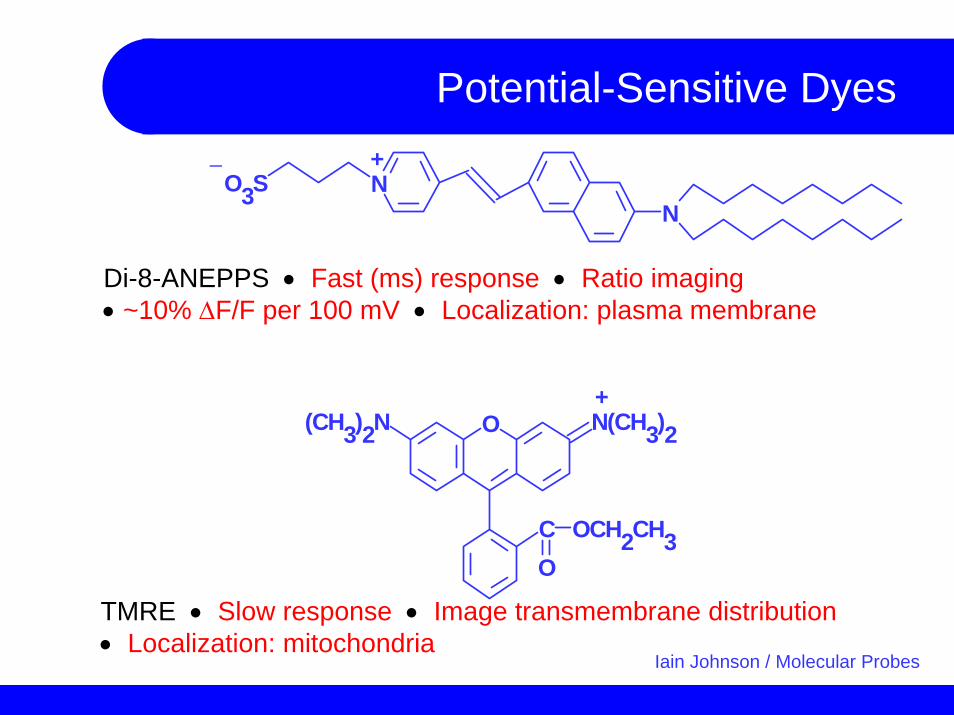
Di-8-ANEPPS • Fast (ms) response • Ratio imaging • ~10% ∆F/F per 100 mV • Localization: plasma membrane
TMRE • Slow response • Image transmembrane distribution • Localization: mitochondria
Iain Johnson / Molecular Probes

Fluorescent Lipid Probes
NCHCHCH
N+
H3C CH3 H3C CH3
(CH3CH2)3N(CH2)3N CH CH N++
CH2OH
CHOH
NHCHCO
FFH3C
H3C
BN N
NO2
NO
N
NH
O−
OOCH2CH2N(CH3)3
O
OC OCH2
OCH
CH2O P
C+
C6-NBD-PC
BODIPY FL C5-ceramide
DiIC18(3) ("DiI")
FM 1-43Iain Johnson / Molecular Probes

Ciliated sensory neurons lining the rear fin of a squid embryo stained with the lipophilic tracer DiIMolecular Probes Photo Gallery

Detection of Oxidative Activity
C
OO O CCH3
OCH3C
O
OHO
ClCl H Esterase
H2DCF
NonfluorescentH2DCFDA
Nonfluorescent
DCF
Fluorescent
C
OHO
OOH
O
H ClCl
H2O2
C
O
OOH
O
Cl Cl
HO
Iain Johnson / Molecular Probes
Viability/Cytotoxicity Analysis
Fluorescence-based cell viability assessment methods use various criteria including membrane integrity, membrane potential detection and enzyme activity (esterase, dehydrogenase) to determine whether a cell is alive or dead
To control for method dependence, two assays with different assessment criteria can be run in parallel using wavelength-multiplexed detection
Bacteria, yeast and mammalian cells require different detection methods

LIVE/DEAD Viability/Cytotoxicity Assay
calcein AMnonpolarnonfluorescent
calceinpolargreen fluorescent
ethidium homodimer-1membrane impermeantred fluorescence enhanced on DNA binding
CH2
(-OCCH2)2NH
C
O
O
CH2
NH(CH2CO-)2
O
O-
O
O-O
+ +
N
H2N NH2
+(CH2)3NH2CH2CH2NH2(CH2)3
NH2H2N
N + ++
esterase
CH2
(CH3COCH2OCCH2)2N
CH3CO O OCCH3
O
O O
CH2
N(CH2COCH2OCCH3)2O O
O O
O
Iain Johnson / Molecular Probes

Wells, 9/15/03
Viability2 dyes, 1excitation, 2 emissions, 1 LP filter setcalcien AM (green, live cells), ethidium homodimer (red, dead cells)

Functional Indicators of Apoptosis
ProbeDye-labeled annexin VJC-1, CMXRosDihydroethidium, DHR123, H2DCFDASNARF-1Hoechst 33342Incorporation of fluorescent dUTPZ-DEVD-Rhodamine 110YO-PRO-1 nucleic acid stain
FunctionPhosphatidylserine exposureMitochondrial depolarizationIncreased O2
- productionIntracellular acidificationDNA condensationDNA fragmentationCaspase activationMembrane permeability

SummaryDesign and selection of fluorescent probes is based on biochemical and spectroscopic criteria
Biochemical criteria relate to the nature of the application and the specimen
Spectroscopic criteria relate to instrumentation, and simultaneous detection of other fluorophores
Fluorescence imaging of living cells and tissues allows dynamic processes such as signaling, excitability, transport, apoptosis and development to be investigated in more biologically realistic contexts than the disassembled model systems employed in traditional biochemical analysis.

Wells, 9/18/03
Microspheres for Calibration
Latex microspheres labeled internally with 3 different dyes - each spot contains the same three dyes.
2 channel out of alignment
2 channel in alignment
Latex microspheres labeled in the core with a green organic dye and near the surface with a red organic dye. Useful for aligning and registering two channel detection.
Triple exposure – between exposures, the detection channel was changed and the sample stage was shifted slightly.WHATS WRONG WITH THIS PICTURE?