
CHM 3411 - Physical Chemistry II
12
CHM 3411 - Fundamentals of Physical Chemistry Chapter 7 - Supplementary Material _______________________________________________________________________________________ h = 6.626 x 10 34 Js 1 cm -1 = 1.986 x 10 23 J c = 2.998 x 10 8 m/s 1 eV = 1.602 x 10 19 J m e = 9.109 x 10 31 kg 1 amu = 1.661 x 10 27 kg R = 109737. cm 1 R H = 109678. cm 1 _______________________________________________________________________________________ 1. Energy units The MKS unit for energy is the Joule (J). By definition 1 J = 1 kgm 2 /s 2 (7.1.1) However, in atomic and molecular systems several non-MKS units are often used. It is important to be familiar with these units, and their relationship with Joules. The energy of a photon (particle) of light is given by the Planck equation E = h (7.1.2) Because the speed of a wave (c) is related to its frequency () and wavelength () by the expression c = (7.1.3) we may also write the energy of a photon as E = hc (7.1.4) It follows from this that energy is proportional to 1/ , and so 1/ can be used as an energy unit. If the wavelength of a photon is given in units of cm, the corresponding energy of the photon, in wavenumbers (cm -1 ), is E(cm -1 ) = Ẽ = 1/ (7.1.5) We will use the symbol "~" above the symbol for energy to indicate units of cm -1 ; thus Ẽ is energy in units of cm -1 . The relationship between energy in Joules and energy in cm -1 is E(J) = hc Ẽ(cm -1 ) (7.1.6) where E(J) is energy in Joules and Ẽ(cm -1 ) is energy in wavenumbers. The conversion factor between the two is 1 cm -1 = 1.986 x 10 -23 J (7.1.7) Because energies for atoms and molecules, when expressed in units of J, are usually small numbers (~ 10 -18 - 10 -22 J) we often choose to express energies in units of cm -1 . Typical values for atomic and molecular energies in wavenumbers are 1 – 50000 cm -1 . Wavenumbers as an energy unit is particularly useful in discussions of spectroscopy (the interaction of systems with light).
Transcript of CHM 3411 - Physical Chemistry II

CHM 3411 - Fundamentals of Physical Chemistry
Chapter 7 - Supplementary Material
_______________________________________________________________________________________
h = 6.626 x 1034 Js 1 cm-1 = 1.986 x 10²³ J
c = 2.998 x 10⁸ m/s 1 eV = 1.602 x 10¹⁹ J
me = 9.109 x 1031 kg 1 amu = 1.661 x 1027 kg
R = 109737. cm1
RH = 109678. cm1
_______________________________________________________________________________________
1. Energy units
The MKS unit for energy is the Joule (J). By definition
1 J = 1 kgm2/s2 (7.1.1)
However, in atomic and molecular systems several non-MKS units are often used. It is important to be familiar with
these units, and their relationship with Joules.
The energy of a photon (particle) of light is given by the Planck equation
E = h (7.1.2)
Because the speed of a wave (c) is related to its frequency () and wavelength () by the expression
c = (7.1.3)
we may also write the energy of a photon as
E = hc (7.1.4)
It follows from this that energy is proportional to 1/, and so 1/ can be used as an energy unit. If the wavelength of
a photon is given in units of cm, the corresponding energy of the photon, in wavenumbers (cm-1), is
E(cm-1) = Ẽ = 1/ (7.1.5)
We will use the symbol "~" above the symbol for energy to indicate units of cm-1; thus Ẽ is energy in units of cm-1.
The relationship between energy in Joules and energy in cm-1 is
E(J) = hc Ẽ(cm-1) (7.1.6)
where E(J) is energy in Joules and Ẽ(cm-1) is energy in wavenumbers. The conversion factor between the two is
1 cm-1 = 1.986 x 10⁻²³ J (7.1.7)
Because energies for atoms and molecules, when expressed in units of J, are usually small numbers (~ 10-18 -
10-22 J) we often choose to express energies in units of cm-1. Typical values for atomic and molecular energies in
wavenumbers are 1 – 50000 cm-1. Wavenumbers as an energy unit is particularly useful in discussions of
spectroscopy (the interaction of systems with light).

One additional energy unit occasionally used is electron volts (eV). One electron volt is equal to the kinetic
energy imparted to an electron when accelerated through a potential difference of 1. v. The relationship between
electron volts and Joules is
1 eV = 1.602 x 10⁻¹⁹ J (7.1.8)
Electron volts are commonly used in discussions of the photoelectric effect, and occasionally in giving energies for
atomic systems.
2. Pre-quantum mechanics
By the end of the 19th century, most scientists believed they had identified the fundamental laws of physics.
These included Newton’s laws of motion, the Maxwell equations for electrodynamics, the laws of thermodynamics,
and so forth. This did not mean that all scientific questions of interest in physics (much less chemistry and biology)
had been answered, but it did indicate a belief that the basic laws of science had been found.
However, several experimental results and observations could not be explained by the fundamental laws of
physics then known. The explanation of these systems led to a new physical theory, called quantum mechanics.
Some of the more important systems whose understanding led to quantum mechanics are given below.
Photoelectric effect
When light strikes a metal surface electrons can be ejected from the metal, a process called the photoelectric
effect. A diagram indicating the apparatus used to study the photoelectric effect is given in Figure 1. Since light is an
oscillating electromagnetic field, and since electrons are charged particles, the expectation was that when light strikes
a metal surface its oscillating electromagnetic field would cause electrons to oscillate and so gain energy. When an
electron gains a sufficient amount of kinetic energy it would then escape the metal, be collected by the positive plate
above the metal surface, and detected by the current meter.
Figure 1. Left - Apparatus for study of the photoelectric effect. Right - Plot of EK,max vs for the photoelectric
effect. The slope of the line in the plot is found to be equal to h, the Planck constant.
For some wavelengths of light the experiment behaved as predicted. However, it was found that each metal
has a characteristic wavelength 0, (and corresponding characteristic frequency, 0 = c/0). At wavelengths longer
than 0 (or frequencies higher than 0) no electrons are ejected from the metal no matter how intense the light that is
used. This was a surprising result.

In 1905, Albert Einstein proposed an explanation for the photoelectric effect based on the the existance of
particles (photons) of light. Borrowing an idea used by Max Planck to explain blackbody radiation, Einstein assumed
that the energy of a light photon was given by the expression
Ephoton = h = hc/ (7.2.1)
where is the frequency and is the wavelength of the light used, and c = . If we define , the work function, as
the minimum energy required to remove an electron from a metal, then by conservation of energy it follows that
Ephoton = h = + EK,max (7.2.2)
or
EK,max = h (7.2.3)
where EK,max is the maximum kinetic energy of an ejected electron. Since EK, the kinetic energy of the ejected
electron, must be positive or zero, Einstein's explanation predicts that existance of a characteristic wavelength for a
metal, with
0 = hc/ (7.2.4)
Further, if eq 7.2.3 is correct, a plot of EK,max vs will have a slope equal to h, the Planck constant. Experiments by
Philip Lenard and others confirmed this prediction (Figure 1).
While Einstein’s approach accounted for the experimental observations found for the photoelectric effect, it
introduced new problems. Because light can exhibit processes such as diffraction and constructive and destructive
interference, there is strong evidence that light is a wave phenomenon. The explanation of the photoelectric effect by
Einstein suggests that in some experiments light behaves as if it is a particle, and not a wave.
Atomic spectroscopy
When atoms in the gas phase are excited by an electrical discharge or other method, they emit light at
specific wavelengths (Figure 2). These wavelengths are characteristic of the particular element of the atom, and can
be used to identify the presence of a particular element in a sample (flame testing). The wavelengths where an atom
emits light when excited correspond to the wavelengths where atoms absorb light. This is the basis of the analytical
techniques of atomic emission spectroscopy (AES) and atomic absorption spectroscopy (AAS), two methods for
finding the concentration of a particular element in a sample.
Figure 2. Left – Visible emission spectra for several elements. Right – Energy levels for the hydrogen atom. The
various families of transitions (Lyman, Balmer, Paschen, Brackett) are shown in emission.

The emission or absorption of light by an atomic gas can be explained if one assumes there are only
particular values of energy, called energy levels, that the atom possess. When an atom emits light it moves to a lower
energy level, while when an atom absorbs light it moves to a higher energy level. In both cases, conservation of
energy requires that the energy of the emitted or absorbed photon is equal to the difference in energy between two
energy levels.
For the hydrogen atom the location of the energy levels observed in emission and absorption are given by a
simple equation, called the Rydberg formula
Ẽ = RH n = 1, 2, 3, … RH = 109678. cm-1 (7.2.5)
n2
In this formula RH, the Rydberg constant, is found from experiment. The energy levels for a hydrogen atom
correspond to n = 1, 2, 3, …,…, as shown in Figure 2. A hydrogen atom can emit or absorb light at any energy equal
to the difference in energy between two energy levels. For light emission, the different series of transitions are labeled
by the value for n for the final (lower energy) state. So we have n = 1 transitions (Lyman, in the UV region), n = 2
transitions (Balmer, in the visible region), n = 3 (Paschen, in the IR region), and so forth.
The emission or absorption of light for atoms larger than hydrogen can also be explained by use of energy
levels. However, unlike hydrogen, there is no simple formula for the energy levels of a multielectron atom.
While the concept of energy levels can successfully explain the emission and absorption of light by atoms,
classical physics has no explanation why atoms can only have certain values for energy. This represents another
failure of classical physics.
de Broglie wavelength
In 1923, based on earlier work by Planck and Einstein, the French physicist (then a graduate student!) Louis
de Broglie suggested that since light can exhibit both wave and particle behavior, matter might also do the same. De
Broglie began with the Einstein mass-energy equation
E = mc2 (7.2.6)
and the Planck equation for the energy of a photon of light
E = h = hc (7.2.7)
If these two expressions for energy are set equal to each other, and the corresponding relationship is solved for
wavelength, the result is
= h (7.2.8)
mc
Since particles with mass cannot travel at the speed of light, de Broglie suggested that c in eq 7.2.8 be replaced with
v, the speed of the particle. If this is done the result is an equation for the de Broglie wavelength (dB) of the particle
dB = h (7.2.9)
mv
While the significance of the de Broglie wavelength was initially unclear, it was soon identified as the length scale at
which material particles such as electrons exhibit wavelength properties. This was confirmed by Clinton Davisson
and Lester Germer in 1927, when they showed that illumination of a nickel crystal by a monoenergetic beam of

electrons (which, by eq 7.2.9, have the same de Broglie wavelength) results in a diffraction pattern similar to that
observed when a crystal is illuminated with a monochromatic beam of X-rays. This experiment demonstrates that
matter, like light, can behave either as a particle or a wave, depending on the particular experiment involved. In fact,
particle diffraction techniques such as electron diffraction and neutron diffraction are now commonly used to gain
information about the structure of solids.
Several other experiments and observations suggested additional limitations to classical physics, and the
need for a new physical theory. These experiments include blackbody radiation, the heat capacity of metals at low
temperature, molecular spectroscopy, and the Compton effect for scattering of particles by light.
The important results from the these and other experiments are as follows:
1) Light can show either wave-like behavior or particle-like behavior depending on the observation being
made
2) Matter, like light, can also show wave-like or particle-like behavior depending on the observation being
made
3) Systems at an atomic or molecular level often possess energy levels (that is, energy is quantized), and can
only have energies equal to one of the energy levels for the system
3. The Schrodinger equation and quantum mechanics
In 1925 Werner Heisenberg (with help from Max Born and Pascual Jordan), developed a new theory, called
matrix mechanics, to analyze atomic and molecular systems. This theory is one form of a more general theory called
quantum mechanics. The next year, Erwin Schrodinger developed a second approach to quantum mechanics in terms
of an equation now called the Schrodinger equation. Shortly thereafter the English physicist Paul Dirac showed that
matrix mechanics and the Schrodinger equation are two equivalent theories. Physicists tend to make a great deal of
use of the matrix mechanics approach, while chemists tend to focus on the use of the Schrodinger equation.
However, both methods continue to be used to analyze systems.
While this course will not be concerned with solving the Schrodinger equation for systems, the general
method for doing so can be given. For simple systems it consists of the following steps:
1) Write down an expression for the total energy of a system. Since the total energy will be the sum of the
kinetic and potential energy, this can be represented as
T + V = E (7.3.1)
where T is kinetic energy, V is potential energy, and E is total enegy.
For example, for an object on a frictionless plane attached to a wall by a spring, and assuming the motion of
the object is harmonic (Figure 3), the total energy of the system will be
mv2 + kx2 = E (7.3.2)
2 2
where m is the mass of the object, v is the speed of the object, k is the force constant for the spring, and x is the
displacement of the object from its equilibrium position.

2) Transform the equation obtained from step 1 into its corresponding Schrodinger equation. For the
example above, the corresponding Schrodinger equation is
{ 2 d2 + kx2 } (x) = E (x) (7.3.3)
2m dx2 2
where = h/2.
3) Find the values of the energy E and the functions (x) that are solutions to eq 7.3.3.
Eq 7.3.3 is a differential equation. While there are standard methods for solving differential equations (and
you found solutions for the differential equations for concentration vs time for first and second order homogeneous
irreversible chemical reactions), our concern will be in using the solutions found from solving the Schrodinger
equation. In particular, the values of E that are solutions to a Schrodinger equation correspond to the energy levels,
or allowed values for energy for the system. The functions (x) that are solutions to a Schrodinger equation, called
wavefunctions, contain the maximum amount of information that can be known about the system. In particular, there
is a relationship between the square of the wavefunction and P(x), the probability of finding a particle in the system at
a particular location in space
P(x) dx ~ | (x) |2 dx (7.3.4)
Our main focus for many systems will the energy levels for the system, found by solving the Schrodinger
equation. However, in discussing atoms and molecules we will also be concerned with the wavefunctions, since they
will allow us to understand how chemical bonds between atoms are formed.
Figure 3. Left – An object of mass m attached to a wall by a spring. x represents the displacement of the object from
its equilibrium position. Right – Potential energy vs x for the mass and spring system.
4. The Heisenberg uncertainty principle
One difference between classical mechanics and quantum mechanics has to do with the uncertainty with
which we can measure the position and speed of an object. Instead of speed, we generally use the related property
momentum (p), defined as p = mv, where m is the mass and v is the speed of the object.

Classically, a perfect measurement of the position and momentum of an object could be done with no
uncertainty in their values. Therefore, for a real measurement, the requirement for the uncertainties of a measurement
are
(x) (p) 0 (7.4.1)
where x is the uncertainty in the position and p is the uncertainty in the momentum of the object. What this means
is that in principle the position and momentum of an object can be measured exactly.
What Heisenberg realized was that in quantum mechanics there is uncertainty present even when perfect
measurements are made. This is described by the Heisenberg uncertainty relationship
(x) (p) /2 (7.4.2)
What this relationship means is that there will be uncertainty even when a perfect measurement is carried out on a
system. Note that there is no limit to how small the uncertainty in either the position or momentum of an object can
be made in a perfect measurement (or a real measurement), but if one uncertainty is reduced the other uncertainty
must get larger, so that eq 7.4.2 is satisfied.
5. Rotational spectroscopy
Diatomic molecules
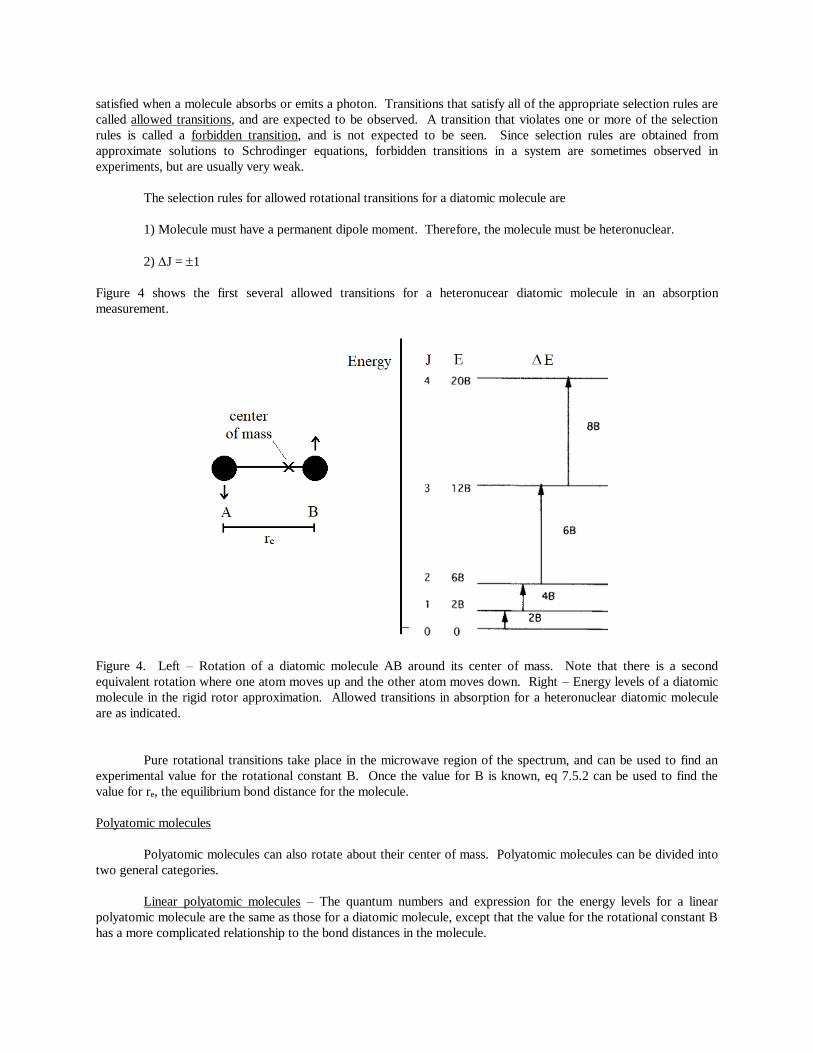
A molecule can rotate around its center of mass. For a diatomic molecule there are two equivalent
rotations, one of which is shown in Figure 4.
In the rigid rotor (RR) approximation the rotational energy of a diatomic molecule is given by the expression
Ẽ = J(J+1) B J = 0, 1, 2, ... MJ = 0, 1, 2, ... J (7.5.1)
where B, the rotational constant, is
B(cm-1) = h = mAmB/(mA+mB) (7.5.2)
82cre2
In eq 7.5 2 is the reduced mass of the molecule (usually expressed in units of kg), c is the speed of light, and re is
the equilibrium bond distance for the molecule. Note that this expression for B is different than the one in the text, as
the one given here is in units of cm-1. In calculating the value for reduced mass it is often convenient to first
calculated in amu (atomic mass units) and then convert to kg using the relationship
1 amu = 1.661 x 1027 kg ` (7.5.3)
Because the energy of rotation depends on J(J+1), the spacing between adjacent rotational energy levels increases as
J increases, as seen in Figure 4. Typical values for B, the rotational constant, are between 0.1 cm-1 and 10 cm-1.
There are two quantum number for rotation in a diatomic molecule, J and MJ. Note that the energy of
rotation depends only on the value of the quantum number J. That means that for a particular value of J there are a
total of 2J + 1 states which all have the same energy, corresponding to the different possible values for MJ. We call
different states of a system with the same value of energy degenerate states, and use the symbol g to indicate the
degeneracy of a particular energy level. For rotational energy levels, g = 2J + 1. As an example, if J = 2, then MJ =
2, 1, 0, -1, and -2, for a total of five states with the same energy. Therefore, when J = 2, g = 5.
Transitions between energy levels must satisfy conservation of energy. This means that the energy of the
photon that is absorbed or emitted must be equal to the difference in energy between two energy levels. In addition
to energy conservation, transitions must also satisfy various selection rules. Selection rules are rules that must be
satisfied when a molecule absorbs or emits a photon. Transitions that satisfy all of the appropriate selection rules are
called allowed transitions, and are expected to be observed. A transition that violates one or more of the selection
rules is called a forbidden transition, and is not expected to be seen. Since selection rules are obtained from
approximate solutions to Schrodinger equations, forbidden transitions in a system are sometimes observed in
experiments, but are usually very weak.
The selection rules for allowed rotational transitions for a diatomic molecule are
1) Molecule must have a permanent dipole moment. Therefore, the molecule must be heteronuclear.
2) J = 1
Figure 4 shows the first several allowed transitions for a heteronucear diatomic molecule in an absorption
measurement.
Figure 4. Left – Rotation of a diatomic molecule AB around its center of mass. Note that there is a second
equivalent rotation where one atom moves up and the other atom moves down. Right – Energy levels of a diatomic
molecule in the rigid rotor approximation. Allowed transitions in absorption for a heteronuclear diatomic molecule
are as indicated.
Pure rotational transitions take place in the microwave region of the spectrum, and can be used to find an
experimental value for the rotational constant B. Once the value for B is known, eq 7.5.2 can be used to find the
value for re, the equilibrium bond distance for the molecule.
Polyatomic molecules
Polyatomic molecules can also rotate about their center of mass. Polyatomic molecules can be divided into
two general categories.
Linear polyatomic molecules – The quantum numbers and expression for the energy levels for a linear
polyatomic molecule are the same as those for a diatomic molecule, except that the value for the rotational constant B
has a more complicated relationship to the bond distances in the molecule.
Non-linear polyatomic molecules – For non-linear polyatomic molecules there are three unique rotations,
and three quantum numbers that describe these rotations. However, except for molecules with a high degree of
symmetry, the expression for the rotational energy levels of a non-linear polyatomic molecule is complicated, and can
only be found using approximation methods.
The only simple and general statement that can be made about polyatomic molecules is that they can absorb
or emit light only if they have a permanent dipole moment. This means that molecules such as methane (CH4) or
acetylene (C2H2) do not absorb microwave radiation, but molecules such as formaldehyde (CH2O) and chlorobenzene
(C6H5Cl) do absorb microwave radiation.
6. Vibrational spectroscopy
Diatomic molecules
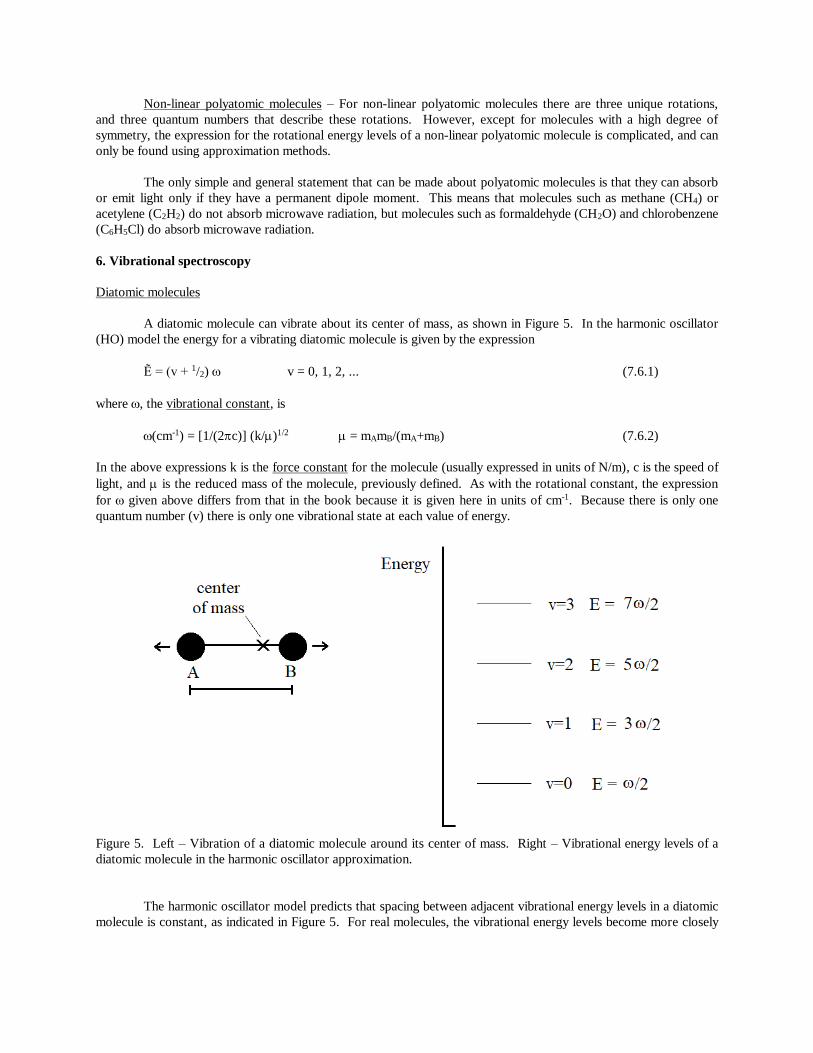
A diatomic molecule can vibrate about its center of mass, as shown in Figure 5. In the harmonic oscillator
(HO) model the energy for a vibrating diatomic molecule is given by the expression
Ẽ = (v + 1/2) v = 0, 1, 2, ... (7.6.1)
where , the vibrational constant, is
(cm-1) = [1/(2c)] (k/)1/2 = mAmB/(mA+mB) (7.6.2)
In the above expressions k is the force constant for the molecule (usually expressed in units of N/m), c is the speed of
light, and is the reduced mass of the molecule, previously defined. As with the rotational constant, the expression
for given above differs from that in the book because it is given here in units of cm-1. Because there is only one
quantum number (v) there is only one vibrational state at each value of energy.
Figure 5. Left – Vibration of a diatomic molecule around its center of mass. Right – Vibrational energy levels of a
diatomic molecule in the harmonic oscillator approximation.
The harmonic oscillator model predicts that spacing between adjacent vibrational energy levels in a diatomic
molecule is constant, as indicated in Figure 5. For real molecules, the vibrational energy levels become more closely

spaced as v increases. This is because the potential energy for a real molecule differs from that of a harmonic
oscillator, with the differences becoming larger as energy increases.
For diatomic molecules the values for are typically in the range 100. cm-1 to 4000. cm-1.
The selection rule for allowed vibrational transitions in a diatomic molecule are
1) The dipole moment of the molecule must change as the molecule vibrates. For a diatomic molecule, this
means the molecule must be heteronuclear.
2) v = 1
Using eq 7.6.2 and the experimental value for , the value for the force constant of a diatomic molecule can be found.
The force constant for the bond in a diatomic molecule is a measure of the strength of the chemical bond.
Vibrational transitions are observed in the infrared region of the spectrum. Because infrared light is higher in
energy than microwave radiation, when a molecule absorbs infrared light both the vibrational and a rotational
quantum numbers will change. Vibrational transitions therefore show rotational structure, which can be used to find
an experimental value for B, the rotational constant, although this will not be done here.
The gas phase vibrational absorption spectrum of HCl is given in Figure 6. The two families of peaks are
due to rotational structure in the spectrum, and correspond to transitions where J = -1 (P-branch transitions) and J
= +1 (R-branch transitions). The differences in the intensity of the peaks is related to the degeneracy of the rotational
energy levels and the temperature at which the spectrum was obtained. The value for , the vibrational constant, is
the value of energy halfway between the closest P and R branch peaks, which for HCl is = 2890. cm-1. Since at
room temperature over 99% of diatomic molecules are found in the v = 0 state, the only vibrational transition
typically observed in absorption is the v = 0 v = 1 transition.
Figure 6 – Gas phase vibrational spectrum of HCl, showing rotational structure. Note that each peak in the spectrum
is actually two closely spaced peaks, corresponding to 1H35Cl and 1H37Cl molecules.

Polyatomic molecules
For a polyatomic molecule there will be several different fundamental, or normal mode, vibrations. The total
number of normal mode vibrations is related to the size of the molecule
# normal mode vibrations = 3N - 5 linear molecule
# normal mode vibrations = 3N - 6 nonlinear molecule
where N is the number of atoms per molecule. For small polyatomic molecules it is possible to write down the
normal mode vibrations by inspection, as shown in Figure 7 for CO2 and H2O. For larger polyatomic molecules there
are more normal mode vibrations, and it is more difficult to show them.
Figure 7. Normal mode vibrations for CO2 (top) and H2O (bottom). Note that there are two bending motions
corresponding to v2 in CO2, and they are degenerate (occur at the same energy).
For an allowed vibrational transition the dipole moment of the molecule must change as the molecule
vibrates. This means that not all vibrations will be seen in the infrared spectrum of a molecule. For example, for CO2
only v2 and v3 are observed in the infrared spectrum, as there is no change in dipole moment for the vibration labeled
v1. For H2O all three vibrations exhibit a change in dipole moment with vibration, and so all three are observed in the
infrared spectrum. Since there is at least one vibration in a polyatomic molecule where the dipole moment of the
molecule changes as the molecule vibrates, all polyatomic molecules absorb light in the infrared region of the
spectrum. The rotational structure of the absorption of polyatomic molecules is more complicated than in diatomic
molecules, and so will not be discussed.
For larger polyatomic molecules the number of vibrations becomes larger, and the infrared spectrum
becomes more complicated. However, there are two general uses of the infrared spectrum of a polyatomic molecule.
Fingerprinting – Every polyatomic molecule has its own characteristic infrared spectrum. The infrared
spectrum of a polyatomic molecule is therefore similar to a fingerprint, and can be used to identify a particular
molecule. If two pure chemical substances have the same infrared spectrum then it is likely that they are the same
compound.

Presence of a functional group – Particular functional groups are expected to gives peaks in the infrared
spectrum at similar energies and intensities. For example, consider the C = O (carbonyl) functional group. Since the
strength of a C = O bond is approximately the same in different molecules, and since the change in dipole moment is
large for a C = O vibration, molecules containing a C = O functional group, such as aldehydes and ketones, are
expected to have a strong peak in their infrared spectrum at approximately the same value of energy. The presence or
absence of a peak in the infrared spectrum of a molecule at a particular energy and strength is evidence for the
presence or absence of the corresponding functional group in the molecule.
Figure 8 shows the condensed phase spectrum of acetone (CH3COCH3) and 2-butanone (CH3COCH2CH3).
These spectra are examples of fingerprinting and the characteristic location and intensity of peaks for particular
functional groups. The spectra of these two molecules are different, and these differences could be used to
distinguish between a pure sample of actone and 2-butanone. Note, however, that there are some similarities between
the two spectra. In particular, the intense peak at ~ 1720. cm-1 is characteristic of the presence of the C = O
functional group in the two molecules.
Figure 8. Infrared spectra of acetone (top) and 2-butanone (bottom). Energy (in cm-1) is given along the x-axis, and
intensity (as transmittance) is given along the y-axis. The intense peak at ~ 1720. cm-1 is characteristic of the C = O
functional group in ketones.
While the development of new instrumental techniques, such as mass spectroscopy and the various types of
nmr spectroscopies, have led to new ways to find out information about molecules, infrared spectroscopy still plays a
role in the identification and characterization of molecules. This is particularly important in organic chemistry, but
has applications in other areas of chemistry as well.