Chlorophyll a fluorescence induction: Can just a one ... · Kautsky effect (after Hans Kautsky; see...
19
DOI: 10.1007/s11099-018-0770-3 PHOTOSYNTHETICA 56 (1): 86-104, 2018 86 REVIEW Chlorophyll a fluorescence induction: Can just a one-second measurement be used to quantify abiotic stress responses? # A. STIRBET *,+ , D. LAZÁR **,+ , J. KROMDIJK *** , and GOVINDJEE **** 204 Anne Burras Lane, Newport News, Virginia 23606, USA * Department of Biophysics, Center of the Region Haná for Biotechnological and Agricultural Research, Faculty of Science, Palacký University, Šlechtitelů 11, 783 71 Olomouc, Czech Republic ** Carl R. Woese Institute for Genomic Biology, University of Illinois at Urbana-Champaign, Urbana, IL 61801, USA *** Department of Biochemistry, Department of Plant Biology, and Center of Biophysics and Quantitative Biology, University of Illinois at Urbana-Champaign, Urbana, IL 61801, USA **** Abstract Chlorophyll (Chl) a fluorescence induction (transient), measured by exposing dark-adapted samples to high light, shows a polyphasic rise, which has been the subject of extensive research over several decades. Several Chl fluorescence parameters based on this transient have been defined, the most widely used being the F V [= (F M – F 0 )]/F M ratio as a proxy for the maximum quantum yield of PSII photochemistry. However, considerable additional information may be derived from analysis of the shape of the fluorescence transient. In fact, several performance indices (PIs) have been defined, which are suggested to provide information on the structure and function of PSII, as well as on the efficiencies of specific electron transport reactions in the thylakoid membrane. Further, these PIs have been proposed to quantify plant tolerance to stress, such as by high light, drought, high (or low) temperature, or N-deficiency. This is an interesting idea, since the speed of the Chl a fluorescence transient measurement (<1 s) is very suitable for high-throughput phenotyping. In this review, we describe how PIs have been used in the assessment of photosynthetic tolerance to various abiotic stress factors. We synthesize these findings and draw conclusions on the suitability of several PIs in assessing stress responses. Finally, we highlight an alternative method to extract information from fluorescence transients, the Integrated Biomarker Response. This method has been developed to define multi-parametric indices in other scientific fields (e.g., ecology), and may be used to combine Chl a fluorescence data with other proxies characterizing CO 2 assimilation, or even growth or grain yield, allowing a more holistic assessment of plant performance. Additional key words: JIP-test; Kautsky effect; performance index; tolerance to stress. ——— Received 13 July 2017, accepted 24 October 2017, published as online-first 10 January 2018. + Corresponding authors; e-mails: [email protected]; [email protected] Abbreviations: ABS – photon flux absorbed by the antenna of PSII units; Area – area above the OJIP transient; CFI – chill factor index; Chl – chlorophyll; CS – cross section; Cyt – cytochrome; DF – driving force; DFI – drought factor index; DI – flux of energy dissipation (through processes other than trapping) in the antenna of PSII units; ET – rate of electron transport from the reduced QA to the intersystem electron acceptors; F0 – minimum Chl a fluorescence; Fd – ferredoxin; FI – fluorescence induction; FM – maximum Chl a fluorescence; FT – terminal steady state of Chl a fluorescence; HSI – heat sensitivity index; I step – Chl a fluorescence at ~ 30 ms; IBR – integrated biomarker response; J step – Chl a fluorescence at ~ 2 ms; K step – Chl a fluorescence at ~ 0.3 ms; M0 – initial slope (first 0.3 ms) of the O-J fluorescence rise; NPQ – nonphotochemical quenching of the excited states of Chl; OEC – oxygen-evolving complex; P680 – reaction center Chls of PSII; PC – plastocyanin; Phe – pheophytin; PSi – photochemical stress index; PI – performance index; PILR – performance index leaf ratio; PQ – plastoquinone; RE – rate of electron transport from the reduced QA to the final electron acceptors of PSI; Rfd – ratio of fluorescence decrease to steady state fluorescence; ROS – reactive oxygen species; RWC – relative water content; SFI – structure-function index; Sm – normalized area above the OJIP transient; TR – flux of exciton trapping by active PSII reaction centers leading to QA reduction; ΔVIP – relative amplitude of the I–P phase of Chl a fluorescence. Acknowledgement: D.L. was supported by a grant # LO1204 (Sustainable Development of Research in the Centre of the Region Haná) from the National Program of Sustainability I, Ministry of Education, Youth and Sports, Czech Republic. J.K. was supported by the Bill and Melinda Gates Foundation (grant OPP1060461). Govindjee was supported by the Department of Plant Biology (James Dalling, Head), and the Department of Biochemistry (Susan Martinis, Head) of the University of Illinois at Urbana-Champaign, IL, USA. # Three of the authors (Alexandrina Stirbet, Dušan Lazár and Johannes Kromdijk) pay tribute to their coauthor (Govindjee) for his lifetime work, at his 85 th birthday (on October 24, 2017). They write: “Besides his many achievements, Govindjee is well
Transcript of Chlorophyll a fluorescence induction: Can just a one ... · Kautsky effect (after Hans Kautsky; see...

DOI: 10.1007/s11099-018-0770-3 PHOTOSYNTHETICA 56 (1): 86-104, 2018
86
REVIEW
Chlorophyll a fluorescence induction: Can just a one-second measurement be used to quantify abiotic stress responses?#
A. STIRBET*,+, D. LAZÁR**,+, J. KROMDIJK***, and GOVINDJEE****
204 Anne Burras Lane, Newport News, Virginia 23606, USA* Department of Biophysics, Center of the Region Haná for Biotechnological and Agricultural Research, Faculty of Science, Palacký University, Šlechtitelů 11, 783 71 Olomouc, Czech Republic** Carl R. Woese Institute for Genomic Biology, University of Illinois at Urbana-Champaign, Urbana, IL 61801, USA***
Department of Biochemistry, Department of Plant Biology, and Center of Biophysics and Quantitative Biology, University of Illinois at Urbana-Champaign, Urbana, IL 61801, USA****
Abstract Chlorophyll (Chl) a fluorescence induction (transient), measured by exposing dark-adapted samples to high light, shows a polyphasic rise, which has been the subject of extensive research over several decades. Several Chl fluorescence parameters based on this transient have been defined, the most widely used being the FV [= (FM – F0)]/FM ratio as a proxy for the maximum quantum yield of PSII photochemistry. However, considerable additional information may be derived from analysis of the shape of the fluorescence transient. In fact, several performance indices (PIs) have been defined, which are suggested to provide information on the structure and function of PSII, as well as on the efficiencies of specific electron transport reactions in the thylakoid membrane. Further, these PIs have been proposed to quantify plant tolerance to stress, such as by high light, drought, high (or low) temperature, or N-deficiency. This is an interesting idea, since the speed of the Chl a fluorescence transient measurement (<1 s) is very suitable for high-throughput phenotyping. In this review, we describe how PIs have been used in the assessment of photosynthetic tolerance to various abiotic stress factors. We synthesize these findings and draw conclusions on the suitability of several PIs in assessing stress responses. Finally, we highlight an alternative method to extract information from fluorescence transients, the Integrated Biomarker Response. This method has been developed to define multi-parametric indices in other scientific fields (e.g., ecology), and may be used to combine Chl a fluorescence data with other proxies characterizing CO2 assimilation, or even growth or grain yield, allowing a more holistic assessment of plant performance. Additional key words: JIP-test; Kautsky effect; performance index; tolerance to stress. ———
Received 13 July 2017, accepted 24 October 2017, published as online-first 10 January 2018. +Corresponding authors; e-mails: [email protected]; [email protected] Abbreviations: ABS – photon flux absorbed by the antenna of PSII units; Area – area above the OJIP transient; CFI – chill factor index; Chl – chlorophyll; CS – cross section; Cyt – cytochrome; DF – driving force; DFI – drought factor index; DI – flux of energy dissipation (through processes other than trapping) in the antenna of PSII units; ET – rate of electron transport from the reduced QA to the intersystem electron acceptors; F0 – minimum Chl a fluorescence; Fd – ferredoxin; FI – fluorescence induction; FM – maximum Chl a fluorescence; FT – terminal steady state of Chl a fluorescence; HSI – heat sensitivity index; I step – Chl a fluorescence at ~ 30 ms; IBR – integrated biomarker response; J step – Chl a fluorescence at ~ 2 ms; K step – Chl a fluorescence at ~ 0.3 ms; M0 – initial slope (first 0.3 ms) of the O-J fluorescence rise; NPQ – nonphotochemical quenching of the excited states of Chl; OEC – oxygen-evolving complex; P680 – reaction center Chls of PSII; PC – plastocyanin; Phe – pheophytin; PSi – photochemical stress index; PI – performance index; PILR – performance index leaf ratio; PQ – plastoquinone; RE – rate of electron transport from the reduced QA to the final electron acceptors of PSI; Rfd – ratio of fluorescence decrease to steady state fluorescence; ROS – reactive oxygen species; RWC – relative water content; SFI – structure-function index; Sm – normalized area above the OJIP transient; TR – flux of exciton trapping by active PSII reaction centers leading to QA reduction; ΔVIP – relative amplitude of the I–P phase of Chl a fluorescence. Acknowledgement: D.L. was supported by a grant # LO1204 (Sustainable Development of Research in the Centre of the Region Haná) from the National Program of Sustainability I, Ministry of Education, Youth and Sports, Czech Republic. J.K. was supported by the Bill and Melinda Gates Foundation (grant OPP1060461). Govindjee was supported by the Department of Plant Biology (James Dalling, Head), and the Department of Biochemistry (Susan Martinis, Head) of the University of Illinois at Urbana-Champaign, IL, USA. # Three of the authors (Alexandrina Stirbet, Dušan Lazár and Johannes Kromdijk) pay tribute to their coauthor (Govindjee) for his lifetime work, at his 85th birthday (on October 24, 2017). They write: “Besides his many achievements, Govindjee is well

CHL a FLUORESCENCE INDUCTION FOR STRESS DETECTION
87
known in the photosynthesis research community for his passion and excitement in relating chlorophyll (Chl) a fluorescence to photosynthesis; this started with his discovery, in 1960, of the two-light effect on Chl a fluorescence, and it continues till today.” Stirbet wrote: “I met Govindjee in 1995 in Geneva, Switzerland, when he was visiting Reto Strasser’s lab, and we wrote a paper on modeling the Chl a fluorescence transient, the OJIP phase (Stirbet et al. 1998). In 2010, we restarted our collaboration, and published several reviews, as well as experimental and theoretical papers, still on Chl fluorescence, and I am looking forward to continue our work together”. Lazár added: “My first contact with Govindjee dates back to the final stages of my Ph.D. studies, when I submitted a review paper to Biochimica et Biophysica Acta on Chl fluorescence induction (Lazár 1999), and Govindjee was one of its reviewers; he had declared his identity. From that time, I know Govindjee as a bright, accurate and enthusiastic scientist, who also supports (and encourages) alternate views [see e.g., my theoretical paper (Lazár 2013) on variable Chl fluorescence originating in PSI, which he had also reviewed].” Kromdijk added: “Doing photosynthesis-related research on the Urbana-Champaign Campus of the University of Illinois (USA), it is impossible not to cross paths with Govindjee. I met Govindjee a few years ago after relocating to Urbana-Champaign for my postdoctoral research. Since then, we regularly meet up to drink coffee and talk about life and anything related to photosynthesis. Govindjee has an incredible lifetime of photosynthetic research and experiences to share, and combines this with the passion and enthusiasm of someone who just discovered the topic yesterday.” Introduction Oxygenic photosynthesis involves the conversion of light energy into chemical energy, using two photosystems and carbon fixation enzymes to oxidize water to molecular oxygen and to reduce carbon-dioxide to carbohydrate (see e.g., Blankenship 2014, Govindjee et al. 2017). Further, the light energy, absorbed by photosynthetic pigments, has two other fates: loss by internal conversion (as heat) or as light emission (mostly fluorescence). In this review, we explore the use of the latter (see Govindjee et al. 1986, Papageorgiou and Govindjee 2004, for a background) to understand abiotic stress on plants. Chlorophyll (Chl) a fluorescence is widely used in photosynthesis research, plant physiology, plant phenotyping, remote sensing of plants, and other fields of research that are related to photosynthesis (for reviews, see e.g., Moya and Cerovic 2004, Baker 2008, Meroni et al. 2009, Murchie and Lawson 2013, Guanter et al. 2014, Kalaji et al. 2014a, 2016, 2017a,b; Humplík et al. 2015, Mishra et al. 2016a).
Chl a fluorescence has been used as a highly useful and sensitive signature of photosynthesis (Govindjee 1995, 2004; see also Govindjee et al. 1986); it has provided valuable information on the structure and function of the photosynthetic apparatus (Papageorgiou and Govindjee 2004). Measurements of emission and excitation spectra of Chl a fluorescence have provided valuable information on various components of the antenna complexes, and on the excitation energy transfer among them (Govindjee et al. 1986). Further, fast dynamic changes in Chl a fluorescence occur when dark-adapted samples are exposed to light. This induction of Chl a fluorescence is also named the Kautsky effect (after Hans Kautsky; see Govindjee 1995, Lazár 1999, Papageorgiou et al. 2007, Stirbet and Govindjee 2014) and can be used to extract information about the efficiency of electron transport through PSII (for reviews, see Krause and Weis 1991, Strasser et al. 2004, Stirbet and Govindjee 2011, 2012).
Fig. 1. Chlorophyll a fluorescence transients measured in leaves of 10-d-old barley (Hordeum vulgare L.) under untreated condition (curve 1, control), and after 5 min at 35°C (curve 2), at 44°C (curve 3), and at 47°C (curve 4). These curves are shown on a logarithmic time scale (A), and on a linear time scale (B); a.u. stands for arbitrary units. The O, K, J, I, P, S, M, and T steps are marked in the figure, where: O is for origin (the minimum fluorescence FO); K, for the fluorescence at 0.3 ms (FK), which has been correlated with the OEC inactivation at high temperatures (Guissé et al. 1995); J and I are for the intermediary fluorescence levels at 2 ms and 30 ms (FJ and FI); and P is for the peak (FP); S stands for a semi-steady state level; M is for a maximum; and T is for the terminal steady state. In (B) we also show the so-called “vitality index”, Rfd = (FP – FT)/FT (Lichtenthaler et al. 1986) calculated for each sample. Measurements were made under continuous red (650 nm) light of 2,500 μmol(photons) m–2 s–1 with a PEA (Plant Efficiency Analyser, Hansatech, UK) instrument.
A. STIRBET et al.
88
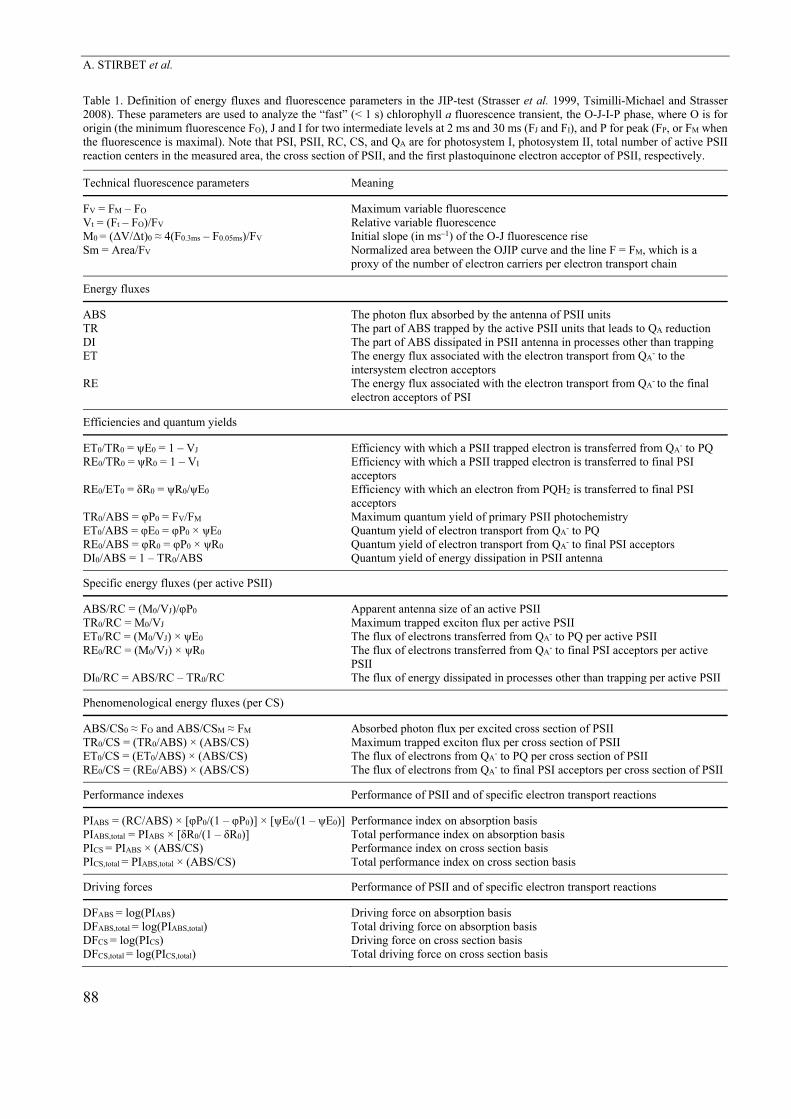
Table 1. Definition of energy fluxes and fluorescence parameters in the JIP-test (Strasser et al. 1999, Tsimilli-Michael and Strasser 2008). These parameters are used to analyze the “fast” (< 1 s) chlorophyll a fluorescence transient, the O-J-I-P phase, where O is for origin (the minimum fluorescence FO), J and I for two intermediate levels at 2 ms and 30 ms (FJ and FI), and P for peak (FP, or FM when the fluorescence is maximal). Note that PSI, PSII, RC, CS, and QA are for photosystem I, photosystem II, total number of active PSII reaction centers in the measured area, the cross section of PSII, and the first plastoquinone electron acceptor of PSII, respectively.
Technical fluorescence parameters Meaning
FV = FM – FO Maximum variable fluorescence Vt = (Ft – FO)/FV Relative variable fluorescence M0 = (ΔV/Δt)0 ≈ 4(F0.3ms – F0.05ms)/FV Initial slope (in ms–1) of the O-J fluorescence rise Sm = Area/FV Normalized area between the OJIP curve and the line F = FM, which is a
proxy of the number of electron carriers per electron transport chain
Energy fluxes
ABS The photon flux absorbed by the antenna of PSII units TR The part of ABS trapped by the active PSII units that leads to QA reduction DI The part of ABS dissipated in PSII antenna in processes other than trapping ET The energy flux associated with the electron transport from QA
- to the intersystem electron acceptors
RE The energy flux associated with the electron transport from QA- to the final
electron acceptors of PSI
Efficiencies and quantum yields
ET0/TR0 = ψE0 = 1 – VJ Efficiency with which a PSII trapped electron is transferred from QA- to PQ
RE0/TR0 = ψR0 = 1 – VI Efficiency with which a PSII trapped electron is transferred to final PSI acceptors
RE0/ET0 = δR0 = ψR0/ψE0 Efficiency with which an electron from PQH2 is transferred to final PSI acceptors
TR0/ABS = φP0 = FV/FM Maximum quantum yield of primary PSII photochemistry ET0/ABS = φE0 = φP0 × ψE0 Quantum yield of electron transport from QA
- to PQ RE0/ABS = φR0 = φP0 × ψR0 Quantum yield of electron transport from QA
- to final PSI acceptors DI0/ABS = 1 – TR0/ABS Quantum yield of energy dissipation in PSII antenna
Specific energy fluxes (per active PSII)
ABS/RC = (M0/VJ)/φP0 Apparent antenna size of an active PSII TR0/RC = M0/VJ Maximum trapped exciton flux per active PSII ET0/RC = (M0/VJ) × ψE0 The flux of electrons transferred from QA
- to PQ per active PSII RE0/RC = (M0/VJ) × ψR0 The flux of electrons transferred from QA
- to final PSI acceptors per active PSII
DI0/RC = ABS/RC – TR0/RC The flux of energy dissipated in processes other than trapping per active PSII
Phenomenological energy fluxes (per CS)
ABS/CS0 ≈ FO and ABS/CSM ≈ FM Absorbed photon flux per excited cross section of PSII TR0/CS = (TR0/ABS) × (ABS/CS) Maximum trapped exciton flux per cross section of PSII ET0/CS = (ET0/ABS) × (ABS/CS) The flux of electrons from QA
- to PQ per cross section of PSII RE0/CS = (RE0/ABS) × (ABS/CS) The flux of electrons from QA
- to final PSI acceptors per cross section of PSII
Performance indexes Performance of PSII and of specific electron transport reactions
PIABS = (RC/ABS) × [φP0/(1 – φP0)] × [ψE0/(1 – ψE0)] Performance index on absorption basis PIABS,total = PIABS × [δR0/(1 – δR0)] Total performance index on absorption basis PICS = PIABS × (ABS/CS) Performance index on cross section basis PICS,total = PIABS,total × (ABS/CS) Total performance index on cross section basis
Driving forces Performance of PSII and of specific electron transport reactions
DFABS = log(PIABS) Driving force on absorption basis DFABS,total = log(PIABS,total) Total driving force on absorption basis DFCS = log(PICS) Driving force on cross section basis DFCS,total = log(PICS,total) Total driving force on cross section basis
CHL a FLUORESCENCE INDUCTION FOR STRESS DETECTION
89
The rise of Chl a fluorescence upon exposure to light is polyphasic (Strasser et al. 1995). Plotting a measured fluorescence transient as a function of logarithmic time (Fig. 1A) helps in identifying several key fluorescence levels, sequentially labelled as O-J-I-P-S-M-T [see curves 1 and 2 in Fig. 1, and Govindjee (1995) for the history of this notation]. Here, O is for origin (the dark-adapted minimum fluorescence FO), J and I for two inflections at 2 ms and 30 ms (FJ and FI), P for peak (FP, or FM when the fluorescence is maximal, which is usually in the ~ 500-ms range), S for a semi-steady state, M for a local maximum (which is sometimes missing), and T for the terminal steady-state level (see reviews e.g., by Govindjee and Papageorgiou 1971, Lazár 1999, Papageorgiou et al. 2007, Lazár and Schansker 2009, Papageorgiou and Govindjee 2011, Stirbet and Govindjee 2012, Stirbet et al. 2014). In addition to these fluorescence levels, sometimes a K level can be observed at 0.3 ms in plants exposed to high temperature (Fig. 1, curves 3 and 4) (Guissé et al. 1995).
Many photosynthetic processes influence the kinetics of the fast Chl a fluorescence rise from O (FO) to P (FP or FM) (reviewed by Lazár 2006, Lazár and Schansker 2009, Schansker et al. 2011, 2014; Stirbet and Govindjee 2011, 2012). Considering the case for saturating light, Chl a fluorescence intensity increases as the quencher QA becomes more reduced, with all QA reduced at the P level (see Munday and Govindjee 1969a,b). Besides experi-mental studies, the fast Chl a fluorescence rise has been also theoretically simulated (e.g., Stirbet et al. 1998, Lazár 2003, 2009, Zhu et al. 2005, Hamdani et al. 2015).
This O-J-I-P rise measured at saturating light has been widely used to calculate (FM – FO)/FM = FV/FM, a fluores-cence parameter that serves as a proxy for the maximum quantum yield of PSII photochemistry (Butler and Kitajima 1975, Govindjee 1995, 2004) and in higher plants, it usually ranges from 0.78 to 0.84 (Björkman and Demmig 1987). However, several other parameters, based on the O-J-I-P transient, have been proposed, especially by Strasser and Strasser (1995) (see also Strasser et al. 1999, 2000, 2004, Tsimilli-Michael and Strasser 2008). These proposed parameters (Table 1) are derived by using not only FO and FM, but also fluorescence levels at J, I, and K.
In this review, we focus on so-called "performance indices" (PIs) proposed by Strasser et al. (1999) and Tsimilli-Michael and Strasser (2008). These PIs are proposed to combine information on the performance of PSII and efficiencies of specific electron transport reactions in the thylakoid membrane during the O-J-I-P rise to provide a sensitive tool, e.g., for photosynthetic stress tolerance. This is an interesting idea, since the speed of the measurement (<1 s) is very suitable for high-throughput phenotyping and the obligatory dark-adaptation of the sample reduces the intensity (i.e., power) required to fully saturate photochemical quenching, compared to measurements on light-adapted samples. Both attributes make incorporation of this measurement into high-throughput phenotyping platforms (see e.g. Fahlgren et al. 2015, Humplík et al. 2015) relatively straight forward; however, some issues might arise. For example, the high-time resolution needed for the evaluation of PIs requires high computational demands. This issue does not seem to be insurmountable, since results of PIs measured using Chl fluorescence imaging cameras, which are necessary for the PI-based high-throughput phenotyping, have already been reported (Jedmowski and Brüggeman 2015). Also, the time necessary for dark-adaptation might be different for different plant species and, in any case, it represents a delay that contradicts the requirement for high-throughput. Except for plant stress caused by light treatment, this problem can be overcome by measurements at the end of a period of darkness in the dark/light cycle used during the plant growth. A possible methodology to avoid the dark-adaption in the high-throughput phenotyping using Chl fluorescence has been suggested, e.g., by Mishra et al. (2016b).
We now briefly summarize the derivation of PIs from Chl a fluorescence measurements. Subsequently, we will describe how PIs have been used in the assessment of photosynthetic tolerance to various abiotic stress factors. Finally, we synthesize these findings, draw conclusions on the suitability of PIs in assessing stress responses, and discuss alternative ways to derive information from Chl a fluorescence transients.
Performance indices We summarize below the derivation of PIs from Chl a fluorescence O-J-I-P transients measured under saturating light, which had been proposed by Strasser et al. (1999) and Tsimilli-Michael and Strasser (2008). These PIs are calculated with mathematical formulae that capture (and integrate) information contained in 3–4 fluorescence parameters in one number, which is then used to rank different samples according to their PSII and electron transport performance. Less mathematically inclined readers may simply consider the PIs as indices computed based on the aforementioned fluorescence levels and
continue reading at the section Application of performance indices to estimate photosynthetic stress tolerance, where we review the use of PIs to quantify abiotic stress tolerance. (Also see Table 2 for a list of “indexes” based on the PIs and the JIP-test.)
The JIP test: The parameters to calculate PIs have been defined in the so-called JIP-test (Strasser and Strasser 1995), which is based on a proposed theory of “energy fluxes” in photosynthetic biomembranes (Strasser 1978, Strasser et al. 2000).

A. STIRBET et al.
90
Table 2. List of indices defined, based on the performance index (PIABS) and other parameters of the JIP-test (see Table 1; Strasser et al. 1999, Tsimilli-Michael and Strasser 2008), and used to evaluate the deleterious effects of particular stress conditions on the performance of PSII activity in plants, which reduce their tolerance to these stressors. Note: PIABS is for the performance index on absorption basis, and equals (RC/ABS) × [φP0/(1 – φP0)] × [ψE0/(1 – ψE0)], where RC/ABS is for the density of PSII reaction centers, φP0 is for the maximum quantum yield of PSII photochemistry, and ψE0 is for the efficiency with which a PSII trapped electron is transferred from QA
- to PQ; QA is for the primary plastoquinone electron acceptor; PQ is for plastoquinone in the PQ pool; φE0 is for the quantum yield of the electron transport from QA
- to PQ, FM is for the maximum Chl a fluorescence, and FO is for the minimum Chl a fluorescence. Based on the above definition of PIABS, PSII activity is decreased when PIABS has smaller values.
Index Definition Description Reference
“m”, an index that evaluates the tolerance of plants to high salt
Absolute value (i.e., positive) of the slope of the straight line that fits the plot of log(PIABS(salt
treated) / PIABS(control)) vs. log(φE0(salt treated) / φE0(control))
A smaller slope “m” indicates a lower decrease in PSII activity due to high salinity (i.e., a higher tolerance)
Misra et al. (2001)
CFI, chill factor index logA + 2 logB + 4 logC, where A, B, C are average PIABS(chilled)
/ PIABS(control) during the 1st and 2nd, the 3rd, 4th, and 5th and the 6th and 7th night of chilling
A smaller CFI indicates a higher decrease in PSII activity due to chilling during night (i.e., a lower tolerance)
Strauss et al. (2006)
DFI, drought factor index logA + 2 logB, where A and B are average PIABS(unwatered) / PIABS(control) during the 1st and the 2nd week of drought stress
A smaller DFI indicates a higher decrease in PSII activity due to drought (i.e., a lower tolerance)
Oukarroum et al. (2007),
Boureima et al. (2012)
PILR, performance index leaf ratio
PIABS(leaf 3) /PIABS(leaf 1) A smaller PILR indicates a higher decrease in PSII activity due to nitrogen deficiency (i.e., a lower tolerance)
Živčák et al. (2014)
HRI, heat resistance index log(PIHS/PIC) + 2log(PIR/PIC), where PI is the PIABS, while C, HS, and R indicate control, high temperature, and recovery after 24 h
A smaller HRI indicates a higher decrease in PSII activity due to high temperature (i.e., a lower tolerance)
Jedmovski and Brüggeman (2015)
HSI, heat sensitivity index The absolute value of the slope of the straight line that fits the plot of log(PIABS) vs. VK = (F0.3ms – FO)/(FM – FO)
A smaller HSI indicates a lower decrease in PSII activity due to high temperature (i.e., a higher tolerance)
Chen et al. (2016), Oukarroum et al. (2016)
PSi, photochemical stress index This is calculated based on the algorithm for the Integrated Biomarker Response (IBR; see Appendix) by using 15 fluorescence parameters defined in the JIP-test
A smaller PSi indicates a lower decrease in PSII activity and ET in the thylakoid membrane due to environmental stress (i.e., a higher tolerance)
Duarte et al. (2017)
In the JIP test, the following five energy fluxes are
considered (Fig. 2): (a) ABS (the absorption flux) – The photon flux
absorbed by the antenna of PSII reaction centers; (b) TR (the trapping flux) – The excitation energy flux
trapped by open PSII reaction centers, leading to the reduction of QA (essentially, PSII photochemistry);
(c) DI (the dissipation flux) – The excitation energy flux dissipated in the antenna of PSII units through processes other than trapping (i.e., heat, fluorescence, and excitation energy transfer to PSI);
(d) ET – The energy flux associated with electron transport from QA
- to the intersystem electron acceptors;
(e) RE – The energy flux associated with the electron transport from QA
- to the final electron acceptors of PSI, which then become reduced.
We note that many studies label these fluxes with the letter “J” (i.e., JABS for ABS, JTR for TR, JDI for DI, JET for ET, and JRE for RE) (e.g., Hendrickson et al. 2005, Stauffer 2006, Stirbet and Govindjee 2011). Further, ABS should not be confused with the optical light absorbance or absorptance, which is widely used to describe light attenuation through a sample. However, to keep things simple, we will use the notations that have been used earlier in the photosynthesis literature and in the available software.
CHL a FLUORESCENCE INDUCTION FOR STRESS DETECTION
91
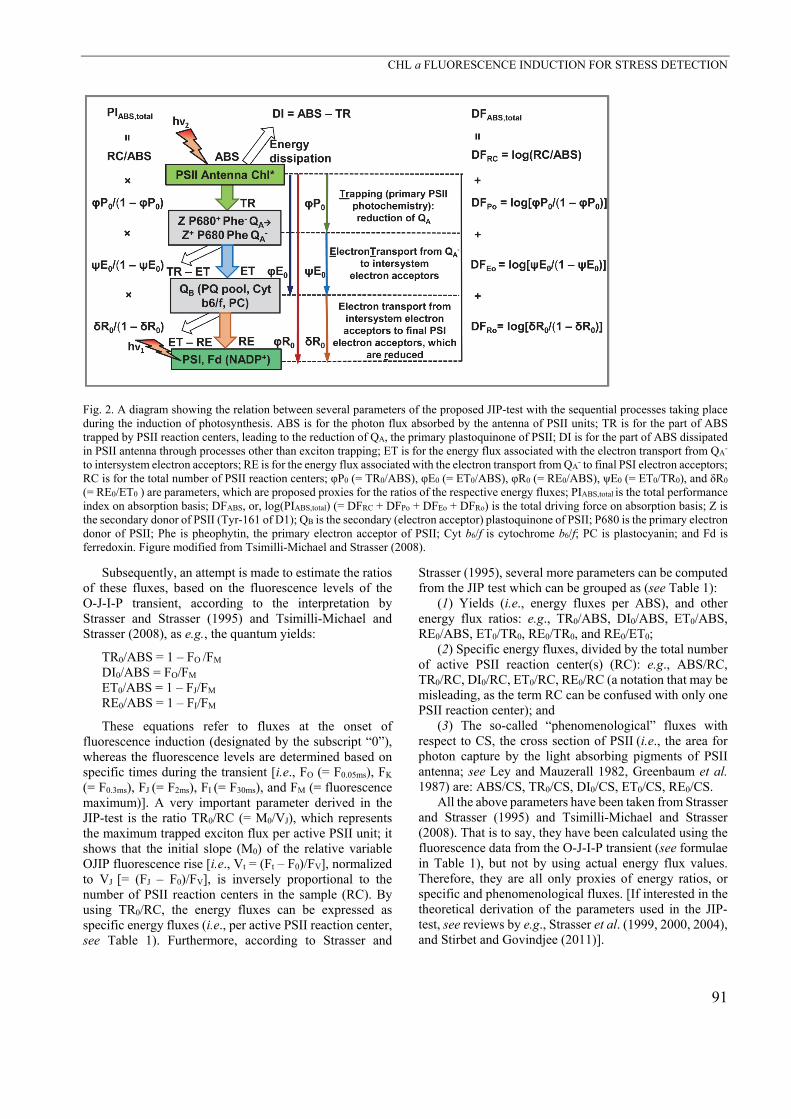
Fig. 2. A diagram showing the relation between several parameters of the proposed JIP-test with the sequential processes taking place during the induction of photosynthesis. ABS is for the photon flux absorbed by the antenna of PSII units; TR is for the part of ABS trapped by PSII reaction centers, leading to the reduction of QA, the primary plastoquinone of PSII; DI is for the part of ABS dissipated in PSII antenna through processes other than exciton trapping; ET is for the energy flux associated with the electron transport from QA
- to intersystem electron acceptors; RE is for the energy flux associated with the electron transport from QA
- to final PSI electron acceptors; RC is for the total number of PSII reaction centers; φP0 (= TR0/ABS), φE0 (= ET0/ABS), φR0 (= RE0/ABS), ψE0 (= ET0/TR0), and δR0 (= RE0/ET0 ) are parameters, which are proposed proxies for the ratios of the respective energy fluxes; PIABS,total is the total performance index on absorption basis; DFABS, or, log(PIABS,total) (= DFRC + DFPo + DFEo + DFRo) is the total driving force on absorption basis; Z is the secondary donor of PSII (Tyr-161 of D1); QB is the secondary (electron acceptor) plastoquinone of PSII; P680 is the primary electron donor of PSII; Phe is pheophytin, the primary electron acceptor of PSII; Cyt b6/f is cytochrome b6/f; PC is plastocyanin; and Fd is ferredoxin. Figure modified from Tsimilli-Michael and Strasser (2008).
Subsequently, an attempt is made to estimate the ratios of these fluxes, based on the fluorescence levels of the O-J-I-P transient, according to the interpretation by Strasser and Strasser (1995) and Tsimilli-Michael and Strasser (2008), as e.g., the quantum yields:
TR0/ABS = 1 – FO /FM
DI0/ABS = FO/FM ET0/ABS = 1 – FJ/FM
RE0/ABS = 1 – FI/FM
These equations refer to fluxes at the onset of fluorescence induction (designated by the subscript “0”), whereas the fluorescence levels are determined based on specific times during the transient [i.e., FO (= F0.05ms), FK
(= F0.3ms), FJ (= F2ms), FI (= F30ms), and FM (= fluorescence maximum)]. A very important parameter derived in the JIP-test is the ratio TR0/RC (= M0/VJ), which represents the maximum trapped exciton flux per active PSII unit; it shows that the initial slope (M0) of the relative variable OJIP fluorescence rise [i.e., Vt = (Ft – F0)/FV], normalized to VJ [= (FJ – F0)/FV], is inversely proportional to the number of PSII reaction centers in the sample (RC). By using TR0/RC, the energy fluxes can be expressed as specific energy fluxes (i.e., per active PSII reaction center, see Table 1). Furthermore, according to Strasser and
Strasser (1995), several more parameters can be computed from the JIP test which can be grouped as (see Table 1):
(1) Yields (i.e., energy fluxes per ABS), and other energy flux ratios: e.g., TR0/ABS, DI0/ABS, ET0/ABS, RE0/ABS, ET0/TR0, RE0/TR0, and RE0/ET0;
(2) Specific energy fluxes, divided by the total number of active PSII reaction center(s) (RC): e.g., ABS/RC, TR0/RC, DI0/RC, ET0/RC, RE0/RC (a notation that may be misleading, as the term RC can be confused with only one PSII reaction center); and
(3) The so-called “phenomenological” fluxes with respect to CS, the cross section of PSII (i.e., the area for photon capture by the light absorbing pigments of PSII antenna; see Ley and Mauzerall 1982, Greenbaum et al. 1987) are: ABS/CS, TR0/CS, DI0/CS, ET0/CS, RE0/CS.
All the above parameters have been taken from Strasser and Strasser (1995) and Tsimilli-Michael and Strasser (2008). That is to say, they have been calculated using the fluorescence data from the O-J-I-P transient (see formulae in Table 1), but not by using actual energy flux values. Therefore, they are all only proxies of energy ratios, or specific and phenomenological fluxes. [If interested in the theoretical derivation of the parameters used in the JIP-test, see reviews by e.g., Strasser et al. (1999, 2000, 2004), and Stirbet and Govindjee (2011)].
A. STIRBET et al.
92
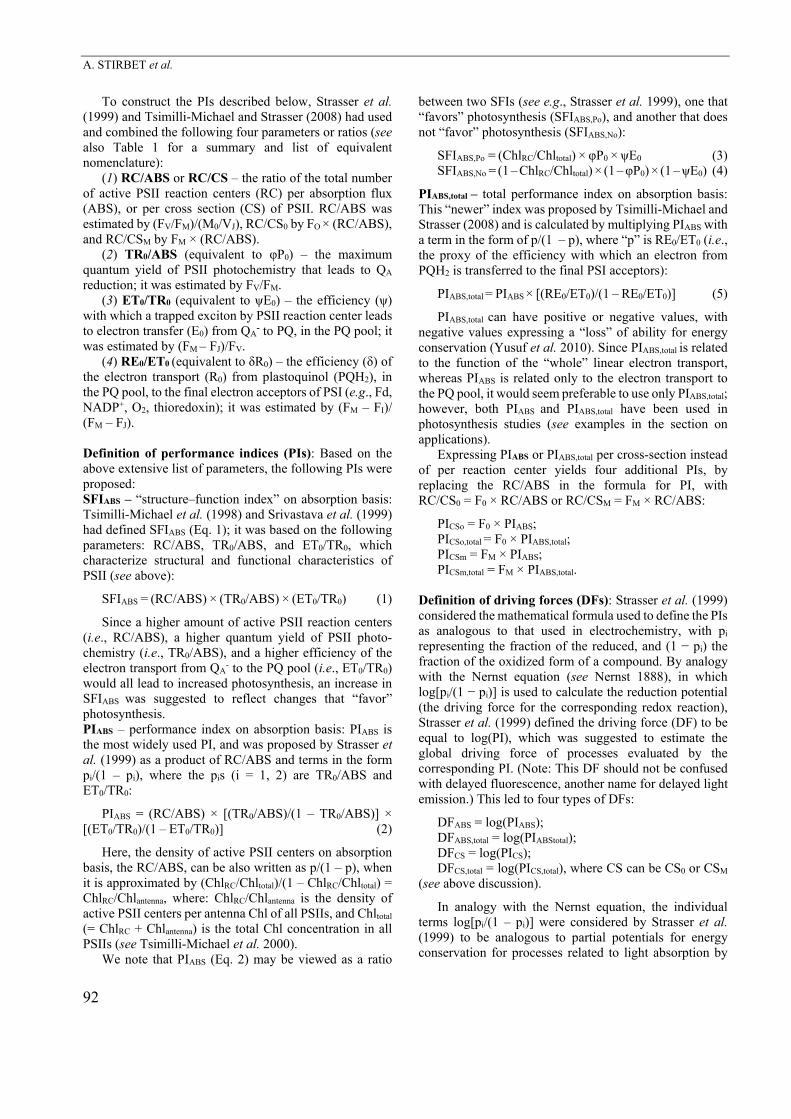
To construct the PIs described below, Strasser et al. (1999) and Tsimilli-Michael and Strasser (2008) had used
and combined the following four parameters or ratios (see
also Table 1 for a summary and list of equivalent
nomenclature): (1) RC/ABS or RC/CS – the ratio of the total number
of active PSII reaction centers (RC) per absorption flux (ABS), or per cross section (CS) of PSII. RC/ABS was estimated by (FV/FM)/(M0/VJ), RC/CS0 by FO × (RC/ABS), and RC/CSM by FM × (RC/ABS).
(2) TR0/ABS (equivalent to φP0) – the maximum quantum yield of PSII photochemistry that leads to QA reduction; it was estimated by FV/FM.
(3) ET0/TR0 (equivalent to ψE0) – the efficiency (ψ) with which a trapped exciton by PSII reaction center leads to electron transfer (E0) from QA
- to PQ, in the PQ pool; it was estimated by (FM – FJ)/FV.
(4) RE0/ET0 (equivalent to δR0) – the efficiency (δ) of the electron transport (R0) from plastoquinol (PQH2), in the PQ pool, to the final electron acceptors of PSI (e.g., Fd, NADP+, O2, thioredoxin); it was estimated by (FM – FI)/ (FM – FJ).
Definition of performance indices (PIs): Based on the above extensive list of parameters, the following PIs were proposed: SFIABS – “structure–function index” on absorption basis: Tsimilli-Michael et al. (1998) and Srivastava et al. (1999) had defined SFIABS (Eq. 1); it was based on the following parameters: RC/ABS, TR0/ABS, and ET0/TR0, which characterize structural and functional characteristics of PSII (see above):
SFIABS = (RC/ABS) × (TR0/ABS) × (ET0/TR0) (1)
Since a higher amount of active PSII reaction centers (i.e., RC/ABS), a higher quantum yield of PSII photo-chemistry (i.e., TR0/ABS), and a higher efficiency of the electron transport from QA
- to the PQ pool (i.e., ET0/TR0) would all lead to increased photosynthesis, an increase in SFIABS was suggested to reflect changes that “favor” photosynthesis. PIABS – performance index on absorption basis: PIABS is the most widely used PI, and was proposed by Strasser et al. (1999) as a product of RC/ABS and terms in the form pi/(1 – pi), where the pis (i = 1, 2) are TR0/ABS and ET0/TR0:
PIABS = (RC/ABS) × [(TR0/ABS)/(1 – TR0/ABS)] × [(ET0/TR0)/(1 – ET0/TR0)] (2)
Here, the density of active PSII centers on absorption basis, the RC/ABS, can be also written as p/(1 – p), when it is approximated by (ChlRC/Chltotal)/(1 – ChlRC/Chltotal) = ChlRC/Chlantenna, where: ChlRC/Chlantenna is the density of active PSII centers per antenna Chl of all PSIIs, and Chltotal (= ChlRC + Chlantenna) is the total Chl concentration in all PSIIs (see Tsimilli-Michael et al. 2000).
We note that PIABS (Eq. 2) may be viewed as a ratio
between two SFIs (see e.g., Strasser et al. 1999), one that “favors” photosynthesis (SFIABS,Po), and another that does not “favor” photosynthesis (SFIABS,No):
SFIABS,Po = (ChlRC/Chltotal) × φP0 × ψE0 (3) SFIABS,No = (1 – ChlRC/Chltotal) × (1 – φP0) × (1 – ψE0) (4)
PIABS,total – total performance index on absorption basis: This “newer” index was proposed by Tsimilli-Michael and Strasser (2008) and is calculated by multiplying PIABS with a term in the form of p/(1 – p), where “p” is RE0/ET0 (i.e., the proxy of the efficiency with which an electron from PQH2 is transferred to the final PSI acceptors):
PIABS,total = PIABS × [(RE0/ET0)/(1 – RE0/ET0)] (5)
PIABS,total can have positive or negative values, with negative values expressing a “loss” of ability for energy conservation (Yusuf et al. 2010). Since PIABS,total is related to the function of the “whole” linear electron transport, whereas PIABS is related only to the electron transport to the PQ pool, it would seem preferable to use only PIABS,total; however, both PIABS and PIABS,total have been used in photosynthesis studies (see examples in the section on applications).
Expressing PIABS or PIABS,total per cross-section instead of per reaction center yields four additional PIs, by replacing the RC/ABS in the formula for PI, with RC/CS0 = F0 × RC/ABS or RC/CSM = FM × RC/ABS:
PICSo = F0 × PIABS; PICSo,total = F0 × PIABS,total; PICSm = FM × PIABS; PICSm,total = FM × PIABS,total.
Definition of driving forces (DFs): Strasser et al. (1999) considered the mathematical formula used to define the PIs as analogous to that used in electrochemistry, with pi representing the fraction of the reduced, and (1 − pi) the fraction of the oxidized form of a compound. By analogy with the Nernst equation (see Nernst 1888), in which log[pi/(1 − pi)] is used to calculate the reduction potential (the driving force for the corresponding redox reaction), Strasser et al. (1999) defined the driving force (DF) to be equal to log(PI), which was suggested to estimate the global driving force of processes evaluated by the corresponding PI. (Note: This DF should not be confused with delayed fluorescence, another name for delayed light emission.) This led to four types of DFs:
DFABS = log(PIABS); DFABS,total = log(PIABStotal); DFCS = log(PICS); DFCS,total = log(PICS,total), where CS can be CS0 or CSM
(see above discussion).
In analogy with the Nernst equation, the individual terms log[pi/(1 – pi)] were considered by Strasser et al. (1999) to be analogous to partial potentials for energy conservation for processes related to light absorption by
CHL a FLUORESCENCE INDUCTION FOR STRESS DETECTION
93
PSII (DFRC), exciton trapping in PSII reaction centers that leads to QA reduction (DFPo), electron transfer from QA
- to the PQ pool (DFEo), and electron transfer from PQH2 to the final electron acceptors of PSI (DFRo) (Fig. 2): i.e., DFABS,total = DFRC + DFPo + DFEo + DFRo.
We note that the analogy between the DFs and the Nernst equation should be seen only as a mathematical formalism since DFs do not represent similar physical
laws, nor real potentials or real driving forces. Therefore, the definition of DF as the sum of partial potentials for energy conservation should not be taken literally. Moreover, since DF is simply another mathematical expression of PI [i.e., DF = log(PI)], it may be considered redundant as an index, since it does not bring any new information beyond that provided by PI.
Application of performance indices to estimate photosynthetic stress tolerance
For growth and survival, plants require extraordinary adaptation potential to the surrounding environment (Bohnert et al. 1995, Pareek et al. 2010). Abiotic stress factors potentially generate deleterious effects in plants, but at the same time induce complex adaptive mechanisms (see reviews by Morales et al. 2008, Adams et al. 2008, Niinemets 2010, Acosta-Motos et al. 2017). Below, we review research using PIs to quantify different abiotic stress effects.
High light: Although light is the central driver of photosynthesis, CO2 assimilation of a typical C3 species saturates between 30–50 percent of full sunlight. As a result, leaves often receive significantly more light than can be processed by photosynthesis (Adams et al. 2008). This can lead to photoinhibition of PSII due to inactivation of PSII reaction centers, damage to the OEC and/or decreased turnover of D1 protein (Hakala et al. 2005, Murata et al. 2007, Kale et al. 2017). To avoid this, several photoprotective processes are induced to help dissipate the excess absorbed energy in a controlled way, such as energy-dependent nonphotochemical quenching (NPQ) of the excited state of chlorophyll (Müller et al. 2001) or more sustained NPQ associated with build-up of zeaxanthin (Demmig-Adams 1990, Nilkens et al. 2010) via reversible de-epoxidation of violaxanthin in the xanthophyll cycle. The kinetics of induction and relaxation of NPQ were recently shown to have a significant impact on biomass productivity of field-grown tobacco (Nicotiana tabacum, Kromdijk et al. 2016).
Several researchers have measured PIABS after prolonged exposure to excessive light. In most cases, PIABS
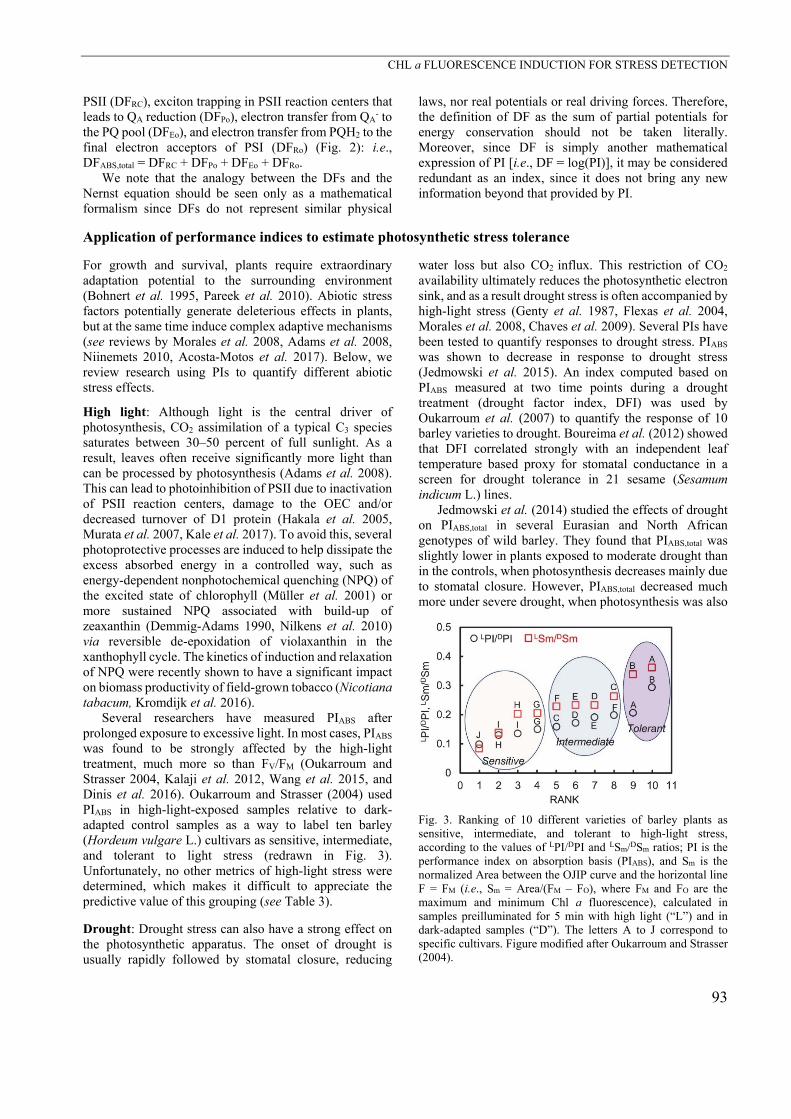
was found to be strongly affected by the high-light treatment, much more so than FV/FM (Oukarroum and Strasser 2004, Kalaji et al. 2012, Wang et al. 2015, and Dinis et al. 2016). Oukarroum and Strasser (2004) used PIABS in high-light-exposed samples relative to dark-adapted control samples as a way to label ten barley (Hordeum vulgare L.) cultivars as sensitive, intermediate, and tolerant to light stress (redrawn in Fig. 3). Unfortunately, no other metrics of high-light stress were determined, which makes it difficult to appreciate the predictive value of this grouping (see Table 3).
Drought: Drought stress can also have a strong effect on the photosynthetic apparatus. The onset of drought is usually rapidly followed by stomatal closure, reducing
water loss but also CO2 influx. This restriction of CO2 availability ultimately reduces the photosynthetic electron sink, and as a result drought stress is often accompanied by high-light stress (Genty et al. 1987, Flexas et al. 2004, Morales et al. 2008, Chaves et al. 2009). Several PIs have been tested to quantify responses to drought stress. PIABS
was shown to decrease in response to drought stress (Jedmowski et al. 2015). An index computed based on PIABS measured at two time points during a drought treatment (drought factor index, DFI) was used by Oukarroum et al. (2007) to quantify the response of 10 barley varieties to drought. Boureima et al. (2012) showed that DFI correlated strongly with an independent leaf temperature based proxy for stomatal conductance in a screen for drought tolerance in 21 sesame (Sesamum indicum L.) lines.
Jedmowski et al. (2014) studied the effects of drought on PIABS,total in several Eurasian and North African genotypes of wild barley. They found that PIABS,total was slightly lower in plants exposed to moderate drought than in the controls, when photosynthesis decreases mainly due to stomatal closure. However, PIABS,total decreased much more under severe drought, when photosynthesis was also
Fig. 3. Ranking of 10 different varieties of barley plants as sensitive, intermediate, and tolerant to high-light stress, according to the values of LPI/DPI and LSm/DSm ratios; PI is the performance index on absorption basis (PIABS), and Sm is the normalized Area between the OJIP curve and the horizontal line F = FM (i.e., Sm = Area/(FM – FO), where FM and FO are the maximum and minimum Chl a fluorescence), calculated in samples preilluminated for 5 min with high light (“L”) and in dark-adapted samples (“D”). The letters A to J correspond to specific cultivars. Figure modified after Oukarroum and Strasser (2004).

A. STIRBET et al.
94
Table 3. Summary of indices used to quantify response to various stress-factors. Also indicated are whether the responses observed were generic enough to produce a reliable ranking to the stress response, as well as whether the ranking was benchmarked against an independent measurement for the same stress response.
Stress factor Performance index Generic response suitable for ranking? Benchmarked against independent proxy to quantify stress level?
High light PIABS Yes No
Drought PIABS, DFI Yes Leaf temperature proxy for stomatal conductance (Boureima et al. 2012)
PIABS,total Not clear, inconsistent results (Jedmowski et al. 2014, Goltsev et al. 2012)
Relative water content (Goltsev et al. 2012)
High temperature PIABS, log(PIABS), HSI Yes No PIABS,total No, increased in response to high
temperature stress (Stefanov et al. 2011) No
Chilling temperature PIABS, log(PIABS), CFI Not clear. Index showed opposite rank relative to severity of temperature treatment (Ferrante and Maggiore 2007, Baldassare et al. 2011)
CO2 assimilation and known genotypic sensitivity to chilling (Van Heerden et al. 2003). Chlorophyll/carotenoid content (Ferrante and Maggiore (2007). Respiration rate (Baldassare et al. 2011)
Freezing temperature PIABS, PIABS,total Not clear, inconsistent results. Survival tests (Rapacz et al. 2015a,b and references therein).
Nutrient limitation PIABS, PIABStotal No, responses are distinctly species- and nutrient-specific (Kalaji et al. 2014b)
No
Salinity PIABS Yes No PIABS,total No, inconsistent results (index
increased in response to salt stress, Yusuf et al. 2010).
Plant mass
Chromium PIABS Yes Chlorophyll/carotenoid content (Appenroth et al. 2001). Respiration and oxygen evolution rates (Appenroth et al. 2001)
Aluminum PIABS,total Yes Chlorophyll content (Jiang et al. 2008) CO2 assimilation (Jiang et al. 2008)
Ground-level ozone PIABS Not clear, index showed opposite rank compared to severity of ozone treatment (Paoletti et al. 2004)
Visual and microscopic damage symptoms (Bussotti et al. 2005).
affected by nonstomatal limitations, such as due to reduced Rubisco content and activity, and increased amount of nonreducing QA PSII centers. In contrast, Goltsev et al. (2012) found that PIABS,total in detached bean leaves did not respond to a reduction in relative water content (RWC) from
100–20% and only responded more strongly when leaves
were further desiccated from 20% to 0% RWC. High temperature: High leaf temperature increases leaf-to-air vapor pressure deficit, which can exacerbate the effects of drought stress. However, high temperatures in the range of 35–50°C also have more direct negative impact on photosynthesis. Rubisco activase (Feller et al. 1998), which is essential for the activation of Rubisco, as well as the OEC (Nash et al. 1985) and the CF0-CF1
ATP-synthase, are all inactivated by high temperature. When the OEC is damaged under high temperature, a new peak appears at ~ 0.3 ms, which has been called the K-peak (Guissé et al. 1995, Srivastava et al. 1997, Strasser 1997, Lazár et al. 1997, 1999). Concurrent with the appearance of the K-peak, FM decreases and FO increases (Fig. 1). We note that before the K-peak was discovered, the FO increase was generally used for screening plants for high temperature sensitivity/resistance (Schreiber and Berry 1977, Nauš et al. 1992, Lazár and Ilík 1997). Several studies have looked at the response of PIs to high temperature. Stefanov et al. (2011) screened nine bean (Phaseolus vulgaris L.) accessions for high-temperature tolerance by exposing plants to 45°C for 2 h followed by two hours of recovery. PIABS decreased in response to the
CHL a FLUORESCENCE INDUCTION FOR STRESS DETECTION
95
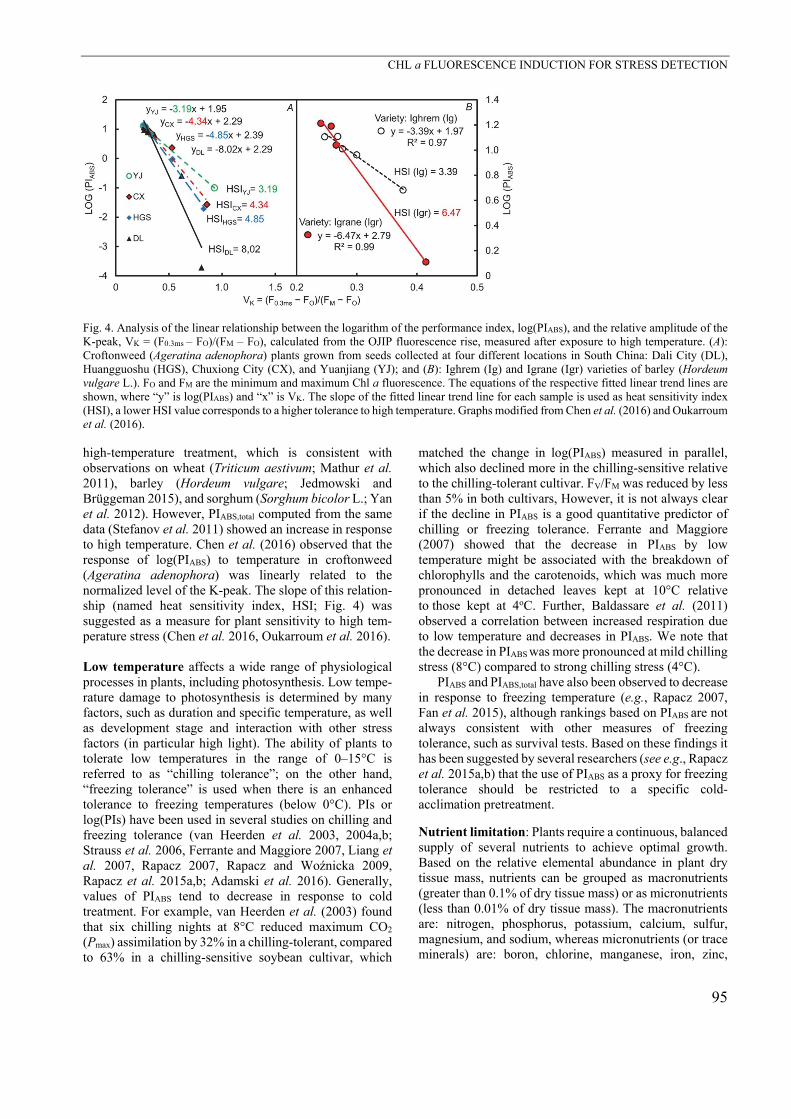
Fig. 4. Analysis of the linear relationship between the logarithm of the performance index, log(PIABS), and the relative amplitude of the K-peak, VK = (F0.3ms – FO)/(FM – FO), calculated from the OJIP fluorescence rise, measured after exposure to high temperature. (A): Croftonweed (Ageratina adenophora) plants grown from seeds collected at four different locations in South China: Dali City (DL), Huangguoshu (HGS), Chuxiong City (CX), and Yuanjiang (YJ); and (B): Ighrem (Ig) and Igrane (Igr) varieties of barley (Hordeum vulgare L.). FO and FM are the minimum and maximum Chl a fluorescence. The equations of the respective fitted linear trend lines are shown, where “y” is log(PIABS) and “x” is VK. The slope of the fitted linear trend line for each sample is used as heat sensitivity index (HSI), a lower HSI value corresponds to a higher tolerance to high temperature. Graphs modified from Chen et al. (2016) and Oukarroum et al. (2016). high-temperature treatment, which is consistent with observations on wheat (Triticum aestivum; Mathur et al. 2011), barley (Hordeum vulgare; Jedmowski and Brüggeman 2015), and sorghum (Sorghum bicolor L.; Yan et al. 2012). However, PIABS,total computed from the same data (Stefanov et al. 2011) showed an increase in response to high temperature. Chen et al. (2016) observed that the response of log(PIABS) to temperature in croftonweed (Ageratina adenophora) was linearly related to the normalized level of the K-peak. The slope of this relation-ship (named heat sensitivity index, HSI; Fig. 4) was suggested as a measure for plant sensitivity to high tem-perature stress (Chen et al. 2016, Oukarroum et al. 2016).
Low temperature affects a wide range of physiological processes in plants, including photosynthesis. Low tempe-rature damage to photosynthesis is determined by many factors, such as duration and specific temperature, as well as development stage and interaction with other stress factors (in particular high light). The ability of plants to tolerate low temperatures in the range of 0–15°C is referred to as “chilling tolerance”; on the other hand, “freezing tolerance” is used when there is an enhanced tolerance to freezing temperatures (below 0°C). PIs or log(PIs) have been used in several studies on chilling and freezing tolerance (van Heerden et al. 2003, 2004a,b; Strauss et al. 2006, Ferrante and Maggiore 2007,Liang et al. 2007, Rapacz 2007, Rapacz and Woźnicka 2009, Rapacz et al. 2015a,b; Adamski et al. 2016). Generally, values of PIABS tend to decrease in response to cold treatment. For example, van Heerden et al. (2003) found that six chilling nights at 8°C reduced maximum CO2 (Pmax) assimilation by 32% in a chilling-tolerant, compared to 63% in a chilling-sensitive soybean cultivar, which
matched the change in log(PIABS) measured in parallel, which also declined more in the chilling-sensitive relative to the chilling-tolerant cultivar. FV/FM was reduced by less than 5% in both cultivars, However, it is not always clear if the decline in PIABS is a good quantitative predictor of chilling or freezing tolerance. Ferrante and Maggiore (2007) showed that the decrease in PIABS by low temperature might be associated with the breakdown of chlorophylls and the carotenoids, which was much more pronounced in detached leaves kept at 10°C relative to those kept at 4oC. Further, Baldassare et al. (2011) observed a correlation between increased respiration due to low temperature and decreases in PIABS. We note that the decrease in PIABS was more pronounced at mild chilling stress (8°C) compared to strong chilling stress (4°C).
PIABS and PIABS,total have also been observed to decrease in response to freezing temperature (e.g., Rapacz 2007, Fan et al. 2015), although rankings based on PIABS are not always consistent with other measures of freezing tolerance, such as survival tests. Based on these findings it has been suggested by several researchers (see e.g., Rapacz et al. 2015a,b) that the use of PIABS as a proxy for freezing tolerance should be restricted to a specific cold-acclimation pretreatment.
Nutrient limitation: Plants require a continuous, balanced supply of several nutrients to achieve optimal growth. Based on the relative elemental abundance in plant dry tissue mass, nutrients can be grouped as macronutrients (greater than 0.1% of dry tissue mass) or as micronutrients (less than 0.01% of dry tissue mass). The macronutrients are: nitrogen, phosphorus, potassium, calcium, sulfur, magnesium, and sodium, whereas micronutrients (or trace minerals) are: boron, chlorine, manganese, iron, zinc,

A. STIRBET et al.
96
copper, molybdenum, nickel, and cobalt (Marschner 1995). Design of an optimal nutrient solution was an important theme in early 20th century plant science, and the recipe outlined by Hoagland and Arnon (1938) still forms the basis of most nutrient solutions currently used. However, the topic is attracting renewed interest, fueled in particular by the rise of soilless cultivation as an alternative commercial growing system, suitable for urban areas (e.g., van Straten et al. 2006).
In a study of a broad range of nutrient deficiencies in maize and tomato (Kalaji et al. 2014b), substantial species- and element-specific responses of PIABS and PIABS,total were observed, with a general decline in both indices due to a decrease in FV/FM. Several other studies looked speci-fically at nitrogen deficiency. Nitrogen is a strong deter-minant of plant growth, being both a major component of amino acids (and thus essential for protein synthesis) as well as of chlorophyll. Additionally, up to 50% of total leaf N can be invested in the photosynthetic machinery and CO2 assimilation, in particular in Rubisco (e.g., Makino 2003). Thus, it is not unreasonable to expect more general responses of PIs to N deficiency. Nitrogen deficiency stimulates redistribution of N from older to younger leaves. To capture this, Živčák et al. (2014) defined an index based on several PIABS measurements on leaves of different age (performance index leaf ratio), which provided a good indication of total plant nitrogen status. Additionally, Nikiforou and Manetas (2011) found season-dependent and independent nitrogen effects on compo-nents of PIABS,total. Both of these examples suggest that PIs may be reliably used to assess specific N deficiency.
Salinity: Salt stress has a strong impact on agricultural yield, in particular on irrigated land in arid and semiarid regions (Hasegawa et al. 2000, Chaves et al. 2009). Salt stress affects plants through osmotic stress and ionic stress (Parida and Das 2005, Munns and Tester 2008, Acosta-Motos et al. 2017), both of which are likely to affect photosynthesis (Sudhir and Murthy 2004, see a review on the role of ions in photosynthesis by Kaňa and Govindjee 2016). Osmotic stress ultimately leads to cell dehydration, whereas ionic stress is caused by excessive accumulation of Na+ and Cl-, reducing uptake of other nutrient ions. As such, the stress symptoms can show similarities with both drought and nutrient limitations, highlighted above. CO2 availability is affected due to increased diffusion resistance through stomatal pores and into mesophyll cells (Chaves et al. 2009), which reduces the photochemical electron sink. On the other hand, PSII activity is reduced by salt stress due to deleterious effects on the Mn cluster of OEC, and PSI activity is also reduced due to the dissociation of plastocyanin/cytochrome c553 (see e.g., Allakhverdiev and Murata 2008). As a result, whole-chain electron transport is also strongly inhibited by salt stress.
Mehta et al. (2010) showed that PIABS declined in salt-stressed wheat leaves as a result of both ionic and osmotic stress. Furthermore, in a study with mung bean seedlings
Fig. 5. Analysis of the linear relationship between the logarithm of the relative performance index, log(PIABS)rel., and the logarithm of the relative quantum yield of the electron transport from QA
- to PQ, log(ET0/ABS)rel., calculated from the OJIP fluorescence induction data, measured on Mung bean seedlings treated with different concentrations of K+ salt (closed red circles) and Na+ salt (open circles). The slope “m” of the linear trend line fitted for each sample is used as a measure of salt tolerance, a lower “m” value corresponding to a higher salt tolerance. Figure modified from Misra et al. (2001). it was shown that the decline of PIABS was associated with a decrease in (FM – FJ)/FV (Misra et al. 2001). These authors used this relationship to derive a slope between the
log-response ratios of PIABS and (FM – FJ)/FV to salt (Fig. 5)
as an indicator of salt tolerance (Misra et al. 2001). Whereas PIABS generally declined after exposure to salt, responses of PIABS,total to salt appeared less generic. PIABS,total decreased significantly in Indian mustard (Brassica juncea) plants exposed to salt stress, but showed an increase in transgenic plants overexpressing the γ-tocopherol methyl transferase (γ-TMT) gene (Yusuf et al. 2010, Yusuf and Sarin 2007). In the same work, it was also evident that the values of PIABS,total did not provide a good indication for growth, since plant mass was not affected by the treatment.
Pollution: As it is well known, and discussed above, photosynthetic organisms respond and adapt strongly to the environment they are exposed to. This environment can sometimes be intensely affected by anthropogenic distur-bance, in particular in urban areas. Now, we review the use of PIs to quantify stress responses to a number of key contrasting pollutants.
Soils in urban areas are generally contaminated with heavy metals, such as lead, zinc, cadmium, and copper (Alloway 2013), whereas specific industrial use may also lead to other distinct heavy metal contaminants. Although several heavy metal ions, such as those of iron, manganese, magnesium, copper, zinc, cobalt, molybdenum, aluminum, and nickel are essential for plant growth in trace amounts, they are toxic when they exceed a threshold concentration (see e.g., Clijsters et al. 1999, Joshi and Mohanty 2004, Nagajyoti et al. 2010, Shabnam et al. 2017). Chl a

CHL a FLUORESCENCE INDUCTION FOR STRESS DETECTION
97
fluorescence measurements have been used for a long time to study toxic effects of heavy metals on photosynthesis, as for example by Bazzaz and Govindjee (1974a) for Cd, and by Bazzaz and Govindjee (1974b) and Wong and Govindjee (1976) for Pb. Here we will highlight a few examples where PIs are used to quantify the effects of Cr (a very common pollutant in the aquatic environment) and Al. PIABS decreased in duckweed (Spirodela polyrhiza) exposed to chromate, concurrent with declines in respiration and oxygen evolution rates, as well as decrease in Chl and carotenoid content (Appenroth et al. 2001). This decrease in PIABS in response to chromate was also observed in the cyanobacterium Synechocystis sp. (Pan et al. 2009) and seemed to arise mainly from a decrease in (FM – FJ)/FV (similar to that observed by salt stress). PIABS,total decreased in Al-treated leaves of grapefruit trees (Citrus grandis L.), concomitant with a reduction in Chl content and decline in CO2 assimilation rate (Jiang et al. 2008). Similar to PIABS responses to chromate, Al-treated leaves showed a decline of (FM – FJ)/FV, but additionally a K-peak was observed. As previously suggested by Blevins and Lukaszewski (1998), small amount of boron addition alleviated toxic effects of aluminum (Jiang et al. 2009), suggesting that aluminum toxicity is at least partially caused by antagonistic effects on boron uptake.
Several studies have used PIABS to evaluate city habitats, where soil as well as atmospheric pollution have added significant pressure on tree growth and survival. Hermans et al. (2003) used PIABS measurements to evaluate positional effects on London plane trees (Platanus acerifolia L.) growing in Brussels, on a boulevard with substantial road traffic. Ranking the PIABS values relative to the mean of all trees correlated well with other measures of pollution injury and helped the city council to identify areas particularly impacted by pollution. Similarly, PIABS measured on trees in Moscow (Russia) corresponded well to differences in exposure to traffic pollution (Volgusheva et al. 2011).
The most damaging air pollutant for plant growth is ground-level ozone. Ground-level ozone (O3) forms as a result of a complex interaction between primary pollutants from burning of fossil fuels (nitrogen oxides, volatile organic hydrocarbons, and carbon monoxide) and energy from sunlight. Since these pollutants are able to be transported for a long distance, ozone pollution is not confined to urban areas. Instead, rural areas can also have substantially elevated ground-level ozone, which is harmful for crop yields (Ainsworth et al. 2012, McGrath et al. 2015). PIABS measurements on two trees (Fraxinus excelsior L. and Prunus avium L.), and a shrub (Viburnum lantana L.) species showed increases in response to halving of the ambient ozone concentration (Gravano et al. 2004). A negative relationship between PIABS and ozone content was also found in several contrasting shrub and tree species, either by filtering ambient air to reduce ozone concentrations (Fagus sylvatica, Populus nigra, and Quercus robur; Bussotti et al. 2007) or by looking at ozone
damage in an area naturally subjected to high ozone concentrations (Fagus sylvatica, Acer pseudoplatanus, Fraxinus excelsior, Viburnum lantana, and Ailanthus altissima; Bussotti et al. 2005). In the latter case, a good match was found between PIABS and visual or microscopic damage symptoms. Paoletti et al. (2004) exposed three Mediterranean evergreen shrubs, laurel (Laurus nobilis), a strawberry tree (Arbutus unedo), and a phillyrea tree (Phillyrea latifolia), to 0, 55, or 110 nmol mol–1 ozone during 90 days. Here, the negative relationship between ozone exposure and PIABS was found for 110 nmol mol–1 treatment, whereas PIABS increased in L. nobilis and A. unedo at 55 nmol mol–1 relative to the control treatment.
Development-specific stresses: Photosynthetic sensitivity to various stress conditions, and the ability to recover after stress are not only species- and variety-dependent, but they also strongly depend on the developmental stage of the plant. PICSo (= F0 × PIABS) was found to gradually increase with leaf development in grapevine (Vitis vinifera L., Jiang et al. 2006), whereas FV/FM increased only slightly. This gradual increase in PICSo during leaf development originated from increases in FO as well as (FM – FJ)/FV. The latter term was also shown to correlate with 820 nm transmittance, measured in parallel as a proxy for PSI quantum yield. Prakash et al. (2003) used Chl a fluo-rescence induction to study senescence in cucumber (Cucumis sativus) cotyledons. PIABS declined from 1.0 to 0.28 to 0.03 in 6, 20, and 27-d-old cotyledons; as a result of a gradual decrease of all component fluorescence parameters that define PIABS. Liu et al. (2006) examined the damage to PSII during senescence in Spirodela polyrrhiza explants under long-day conditions, and its prevention by 6-benzyladenine (a synthetic cytokinin, a class of plant hormones involved in plant growth and development; D’Agostino and Kieber 1999). After 8 days of cultivation under long-day conditions, PIABS approached zero, the J and I steps of the OJIP transient disappeared, and the FK level was very close to that of FM, similar to results by Prakash et al. (2003) at advanced stages of senescence.
Duarte et al. (2017) studied several seagrass Zostera nolti samples, which were in different developmental stages, growing at several sites on the coast of Portugal. Here, response to natural environmental stress factors was evaluated by calculating a novel index, called the photochemical stress index (PSi), which had been defined based on 15 different parameters of the JIP-test. These were considered as biomarkers (i.e., measurable indicators of the photochemical stress). We emphasize that the PSi is very different from the PIs and the DFs defined above. Instead, the PSi was calculated using a general algorithm called Integrated Biomarker Response (IBR) (Beliaeff and Burgeot 2002; for details, see the Appendix) which has previously been used in ecological studies of environ-mental stress (see e.g., Broeg and Lehtonen 2006, Ferreira et al. 2015a,b). Duarte et al. (2017) found that PSi values

A. STIRBET et al.
98
derived with the IBR protocol decreased substantially with development, from approximately 0.9 at stage 1 to zero at stage 5.
Concluding remarks: It is imperative to remember that PIs only evaluate the performance of relatively fast (less than one second) photosynthetic processes in dark-adapted samples. As a result, the predictive value for processes related to CO2 assimilation, which need longer time to be fully activated, will always remain limited. However, several researchers have assumed that PIs can also provide an assessment of whole-plant “performance”, including CO2 assimilation, and even growth and grain yield. Although in some cases the PI values were shown to correlate with data related to CO2 assimilation or even growth (e.g., Strasser et al. 2007, Zubek et al. 2009), several other results confirm that PIs cannot reliably evaluate these processes (e.g., Yusuf et al. 2010, Jedmowski et al. 2015). When Chl a fluorescence induction is evaluated after exposure to light on a longer time scale (minutes – hours), parameters such as Fqꞌ/FMꞌ (also known as PSII or Genty´s parameter, Genty et al. 1989; see footnote1) may indeed predict CO2 assimilation when photorespiration is low (see e.g., Edwards and Baker 1993, Toepel et al. 2004). Therefore, results of gas-exchange measurements, or data from Chl FI measured on a longer time scale, should be included if the aim is to analyze the complete time scale of photosynthesis and beyond. This suggestion is in agreement with Kalaji et al. (2017b) who concluded that the best way to properly evaluate the performance of plants is to combine many parameters at once. It seems, however, unlikely that growth and yield can ever be reliably predicted from a photosynthesis-based proxy, considering the multitude of processes controlling these complex traits.
In this review, we have discussed several performance indices (PIs) and their applications for the evaluation of stress tolerance of plants to different types of stressors. It is obvious from these results that the O-J-I-P transient contains useful information beyond that from FV/FM, which is most widely used for the evaluation of stress response in plants (e.g., Lazár and Nauš 1998, Kouřil et al. 2003, Frolec et al. 2010). Including this information has potential to get a more sensitive assessment of stress responses (summarized in Table 3). Whereas the discussed PIs are derived according to the interpretation proposed by Reto J. Strasser and his coworkers, we emphasize that
acceptance of this framework is not required to make use of the information encoded in fluorescence transients. Instead, many researchers have taken a more empirical approach to the use of these PIs, which does not require any interpretation as long as an independent alternative proxy for the stress response is measured in parallel. Indeed, several indices have been customized to better suit the stress factor under evaluation (Table 2), see e.g.: (1) Misra et al. (2001), for salt stress; (2) Oukarroum and Strasser (2004), for light stress; (3) Strauss et al. (2006), for chilling stress at night; (4) Oukarroum et al. (2007), for drought stress; (5) Živčák et al. (2014), for N-deficiency; (6) Jedmovski et al. (2014) and Chen et al. (2016), for high temperature stress; and (7) Duarte et al. (2017), for natural environmental stress.
These new indices were shown to be more sensitive to differences in the specific stress tolerance between samples than the original PIs. The so-called photochemical stress index (PSi), as used by Duarte et al. (2017), merits special attention. Although it still extracts information from fluorescence transients using the so-called JIP test, it has been calculated with a general algorithm designed by Beliaeff and Burgeot (2002), called the Integrated Biomarker Response (IBR). Since the IBR algorithm represents a simple, practical and accommodating method to create well-standardized multi-parametric indexes that can be defined for various applications; we have presented the general steps necessary for its calculation in the Appendix (see below). Additionally, we propose that an even more radical approach could be obtained by adopting a fully empirical, unbiased and non-interpretive strategy from the field of hyperspectral imaging (Serbin et al. 2012) to obtain the most predictive information from fluorescence transients for the trait of interest. In this method, partial least squares regression analysis was used to derive maximum RuBP carboxylation and regeneration rates from hyperspectral leaf reflectance samples. It seems that this approach could easily be replicated on fluorescence transients to extract the most predictive information for several of the quantitative traits, using ‘training sets’ where both fluorescence transient and trait of interest are determined in parallel. Using these alternative approaches, we anticipate that the information encoded in fluorescence transients, and eventually also from different type of data, can be most efficiently employed in high-throughput screens for stress tolerance.
1 The so-called Genty´s parameter, named after Bernard Genty, equals Fqꞌ/FMꞌ = (FMꞌ – Ft)/FMꞌ, where FMꞌ is the maximum Chl fluorescence reached during a saturating pulse applied for ~ 1 s at steady state under illumination with actinic light (the light-adapted state), and Ft is the fluorescence at steady state (subscript “t” is for the time it was measured, just before the measurement of FMꞌ). The above equation reflects the quantum yield of PSII photochemistry for the light-adapted state, and it correlates with the quantum yield of CO2 assimilation (Genty et al. 1989, see also Lazár 2015).

CHL a FLUORESCENCE INDUCTION FOR STRESS DETECTION
99
Appendix: Calculation of the Integrated Biomarker Response (IBR) index We describe below the successive data-processing steps for the calculation of the IBR index (Beliaeff and Burgeot 2002, Broeg and Lehtonen 2006, Ferreira et al. 2015a,b). These calculations are referred to biomarkers (i.e., measurable indicators of some biological state or condition) measured at different locations (stations), but they can also be related to surveys made at different periods of time, or to various types of samples, depending on the comparisons needed for one’s study.
The steps involved for each biomarker are: Step 1. Calculation of the mean values (X) of the biomarkers, and their standard deviations (s) corresponding to each
station (or type of sample). Step 2. Standardization of the datafrom each station, which allows their direct visual comparison: Y = (X – m)/s,
where Y is the standardized value of the biomarker; X and s are as defined in Step 1, and m is the mean value of the biomarker calculated for all stations (or all types of samples).
Step 3. Calculation of a quantity Z as: Z = –Y or Z = +Y, if the biological effect on the marker corresponds to an inhibition or a stimulation.
Step 4. Calculation of the score (S) for each biomarker, where S≥0; this is done by adding to Z the absolute (i.e., positive) value of the minimum of the standardized data (i.e., the Y values calculated at Step 2) calculated for all stations (or types of samples), which is labeled |Min|: S = Z + |Min|. This leads to the lowest value in the set to be zero.
Step 5. The “scores” calculated for all the biomarkers, Si, are then represented graphically using a star plot (known also as spider, web, or a radar plot), the star plot radius coordinate representing the score of a given biomarker at a given station.
Step 6. Finally, the IBR is calculated from the star plot as: IBR = ∑ A , where: n is the number of biomarkers, and Ai corresponds to the area of the triangle formed by two consecutive scores (radius coordinates), Si and Si+1, and the center of the star plot. The area Ai is calculated as: Ai = (Si/2)sinβ(Sicosβ + Si+1sinβ), with β = Arctan [(Si+1sinα)/(Si – Si+1cosα)], α = 2π/n, and Sn+1 = S1 (see an example below). If two consecutive scores are zero, the respective Ai is set to 0.
The IBR, thus calculated, represents the average of different arrangements of the biomarkers in the star plot. The formula for IBR is much simpler when only four biomarkers are used (i.e., when n = 4 and α = π/2), with: Ai = (Si·Si+1/2), IBR = (S1·S2 + S2·S3 + S3·S4 + S4·S1)/2. We note that, since IBR is directly dependent on the number (n) of biomarkers in the set, IBR/n must be used for comparing different samples (Broeg and Lehtonen 2006, Ferreira et al. 2015a,b). References Acosta-Motos J.R., Ortuño M.F., Bernal-Vicente A. et al.:
Responses to salt stress: Adaptive mechanisms. – Agronomy 7: 18, 2017.
Adams III W.W., Zarter C.R., Mueh K.E. et al.: Energy dissipation and photoinhibition: A continuum of photo-protection. – In: Demmig-Adams B., Adams III W.W., Mattoo A.K. (ed.): Photoprotection, Photoinhibition, Gene Regulation, and Environment. Pp. 49-64. Springer Science+Business Media B.V., Dordrecht 2008.
Adamski J.M., Cargnelutti D., Sperotto R.A. et al.: Identification and physiological characterization of two sister lines of indica rice (Oryza sativa L.) with contrasting levels of cold tolerance. – Can. J. Plant Sci. 96: 197-214, 2016.
Ainsworth E.A., Yendrek C.R., Sitch S. et al.: The effects of ozone on net primary productivity and implications for climate change. – Annu. Rev. Plant Biol. 63: 637-661, 2012.
Allakhverdiev S.I., Murata N.: Salt stress inhibits photosystem II and I in cynobacteria. – Photosynth. Res. 98: 529-539, 2008.
Alloway B.J.: Sources of heavy metals and metalloids in soils. – In: Alloway B. (ed.): Heavy Metals in Soils. Environmental Pollution, Vol. 22. Springer, Dordrecht 2013.
Appenroth K.J., Stöckel J., Srivastava A. et al.: Multiple effects of chromate on the photosynthetic apparatus of Spirodela polyrhiza as probed by OJIP chlorophyll a fluorescence measurements. – Environ. Pollut. 115: 49-64, 2001.
Baker N.R.: Chlorophyll fluorescence: A probe of photosynthesis in vivo. – Annu. Rev. Plant Biol. 59: 89-113, 2008.
Baldassarre V., Cabassi G., Ferrante A.: Use of chlorophyll a fluorescence for evaluating the quality of leafy vegetables. – Aust. J. Crop Sci. 5: 735-741, 2011.
Bazzaz M.B., Govindjee: Effects of cadmium nitrate on spectral characteristics and light reactions of chloroplasts. – Environ. Lett. 6: 1-12, 1974a.
Bazzaz M.B., Govindjee: Effects of lead chloride on chloroplast reactions. – Environ. Lett. 6: 175-191, 1974b.
Beliaeff B., Burgeot T.: Integrated biomarker response: a useful tool for ecological risk assessment. – Environ. Toxicol. Chem. 21: 1316-1322, 2002.
Björkman O., Demmig B.: Photon yield of O2 evolution and chlorophyll fluorescence characteristics at 77 K among vascular plants of diverse origins. – Planta 170: 489-504, 1987.
Blankenship R.E.: Molecular Mechanisms of Photosynthesis, 2nd ed. Pp. 312. Blackwell-John Wiley, Oxford 2014.
Blevins D.G., Lukaszewski K.M.: Boron in plant structure and function. – Annu. Rev. Plant Phys. 49: 481-500, 1998.
Bohnert H.J., Nelson D.E., Jensen R.G.: Adaptations to environmental stresses. – Plant Cell 7: 1099-1111, 1995.
Boureima S. Oukarroum A., Diouf M. et al.: Screening for drought tolerance in mutant germplasm of sesame (Sesamum indicum) probing by chlorophyll a fluorescence. – Environ. Exp. Bot. 81: 37-43, 2012.
Broeg K., Lehtonen K.K.: Indices for the assessment of environmental pollution of the Baltic Sea coasts: Integrated assessment of a multi-biomarker approach. – Mar. Pollut. Bull.

A. STIRBET et al.
100
53: 508-522, 2006. Bussotti F., Agati G., Desotgiu R. et al.: Ozone foliar symptoms
in woody plants assessed with ultrastructural and fluorescence analysis. – New Phytol. 166: 941-955, 2005.
Bussotti F., Strasser R.J., Schaub M.: Photosynthetic behavior of woody species under high ozone exposure probed with the JIP-test: A review. – Environ. Pollut. 147: 430-437, 2007.
Butler W.L., Kitajima M.: Fluorescence quenching in photo-system II of chloroplasts. – Biochim. Biophys. Acta 376: 116-125, 1975.
Chaves M.M., Flexas J., Pinheiro C.: Photosynthesis under drought and salt stress: Regulation mechanisms from whole plant to cell. – Ann. Bot.-London 103: 551-560, 2009.
Chen S., Yang J., Zhang M. et al.: Classification and charac-teristics of heat tolerance in Ageratina adenophora populations using fast chlorophyll a fluorescence rise O-J-I-P. – Environ. Exp. Bot. 122: 126-140, 2016.
Clijsters H., Cuypers A., Vangronsveld J.: Physiological responses to heavy metals in higher plants; Defence against oxidative stress.–Z. Naturforsch. 54c: 720-734, 1999.
D’Agostino I.B., Kieber J.J.: Molecular mechanisms of cytokinin action. – Curr. Opin. Plant Biol. 2: 359-364, 1999.
Demmig-Adams B., Adams W.W., Heber U. et al.: Inhibition of zeaxanthin formation and of rapid changes in radiationless energy dissipation by dithiothreitol in spinach leaves and chloroplasts. – Plant Physiol. 92: 293-301, 1990.
Dinis L.-T., Ferreira H., Pinto G. et al.: Kaolin-based, foliar reflective film protects photosystem II structure and function in grapevine leaves exposed to heat and high solar radiation. – Photosynthetica 54: 47-55, 2016.
Duarte B., Pedro S., Marques J.C. et al.: Zostera noltii develop-ment probing using chlorophyll a transient analysis (JIP-test) under field conditions: Integrating physiological insights into a photochemical stress index. – Ecol. Indic. 76: 219-229, 2017.
Edwards G.E., Baker N.R.: Can CO2 assimilation in maize leaves be predicted accurately from chlorophyll fluorescence analysis? – Photosynth. Res. 37: 89-102, 1993.
Fahlgren N., Gehan M.A., Baxter I.: Lights, camera, action: high-throughput plant phenotyping is ready for a close up. – Curr. Opin. Plant Biol. 24: 93-99, 2015.
Fan J., Hu Z., Xie Y. et al.: Alleviation of cold damage to photosystem II and metabolisms by melatonin in Bermudagrass. – Front. Plant Sci. 6: 925, 2015.
Feller U., Crafts-Brandner S.J., Salvucci M.E.: Moderately high temperatures inhibit ribulose-1,5-bisphosphate carboxylase/ oxygenase (Rubisco) activase-mediated activation of Rubisco. – Plant Physiol. 116: 539-546, 1998.
Ferrante A., Maggiore T.: Chlorophyll a fluorescence measure-ments to evaluate storage time and temperature of Valeriana leafy vegetables. – Postharvest Biol. Tec. 45: 73-80, 2007.
Ferreira N.G.C., Cardoso D.N., Morgado R. et al.: Long-term exposure of the isopod Porcellionides pruinosus to nickel: costs in the energy budget and detoxification enzymes. – Chemosphere 135: 354-362, 2015b.
Ferreira N.G.C., Morgado R., Santos M.J.G. et al.: Biomarkers and energy reserves in the isopod Porcellionides pruinosus: The effects of long-term exposure to dimethoate. – Sci. Total Environ. 502: 91-102, 2015a.
Flexas J., Bota J., Loreto F. et al.: Diffusive and metabolic limitations to photosynthesis under drought and salinity in C3 plants. – Plant Biol. 6: 269-279, 2004.
Frolec J., Řebiček J., Lazár D. et al.: Impact of two different types of heat stress on chloroplast movement and fluorescence signal
of tobacco leaves. – Plant Cell Rep. 29: 705-714, 2010. Genty B., Briantais J.-M., Baker N.R.: The relationship between
the quantum yield of photosynthetic electron transport and quenching of chlorophyll fluorescence. – Biochim. Biophys. Acta 990: 87-92, 1989.
Genty B., Briantais J.-M., Da Silva J.B.V.: Effect of drought on primary photosynthetic processes of cotton leaves. – Plant Physiol. 83: 360-364, 1987.
Goltsev V., Zaharieva I., Chernev P. et al.: Drought-induced modifications of photosynthetic electron transport in intact leaves: Analysis and use of neural networks as a tool for a rapid non-invasive estimation. – Biochim. Biophys. Acta 1817: 1490-1498, 2012.
Govindjee, Amesz J., Fork D.C. (ed.): Light Emission by Plants and Bacteria. Pp. 660. Academic Press, Orlando 1986.
Govindjee, Papageorgiou G.C.: Chlorophyll fluorescence and photosynthesis: fluorescence transients. – In: Giese A.C. (ed.): Photophysiology, Vol. 6. Pp. 1-46. Academic Press, New York 1971.
Govindjee, Shevela D., Björn L.-O.: Evolution of the Z-scheme of photosynthesis: a perspective. – Photosynth. Res. 133: 5-15, 2017.
Govindjee: Chlorophyll a fluorescence: a bit of basics and his-tory. – In: Papageorgiou G.C., Govindjee (ed.): Chlorophyll a fluorescence: A signature of Photosynthesis, Advances in Photosynthesis and Respiration. Vol. 19. Pp. 1-41. Springer, Dordrecht 2004.
Govindjee: Sixty-three years since Kautsky: chlorophyll a fluorescence.– Aust. J. Plant Physiol. 22: 131-160, 1995.
Gravano E., Bussotti F., Strasser R.J. et al.: Ozone symptoms in leaves of woody plants in open-top chambers: ultrastructural and physiological characteristics. – Physiol. Plantarum 121: 620-633, 2004.
Greenbaum N.L., Ley A.C., Mauzerall D.C.: Use of a light-induced respiratory transient to measure the optical cross section of photosystem I in Chlorella. – Plant Physiol. 84: 879-882, 1987.
Guanter L., Zhang Y., Jung M. et al.: Global and time-resolved monitoring of crop photosynthesis with chlorophyll fluores-cence. – Proc. Natl. Acad. Sci. USA 111: E1327-E1333, 2014.
Guissé B., Srivastava A., Strasser R.J.: The polyphasic rise of the chlorophyll a fluorescence (O–K–J–I–P) in heat stressed leaves. – Arch. Sci. Genève 48: 147-160, 1995.
Hakala M., Tuominen I., Keränen M.: Evidence for the role of the oxygen-evolving manganese complex in photoinhibition of Photosystem II. – Biochim. Biophys. Acta 1706: 68-80, 2005.
Hamdani S., Qu M., Xin C.-P. et al.: Variations between the photosynthetic properties of elite and landrace Chinese rice cultivars revealed by simultaneous measurements of 820 nm transmission signal and chlorophyll a fluorescence induction. – J. Plant Physiol. 177: 128-138, 2015.
Hasegawa P.M., Bressan R.A., Zhu J. et al.: Plant cellular and molecular responses to high salinity. – Annu. Rev. Plant Phys. 51: 463-499, 2000.
Hendrickson L., Förster B., Pogson B.J. et al.: A simple chlorophyll fluorescence parameter that correlates with the rate coefficient of photoinactivation of photosystem II. – Photosynth. Res. 84: 43-49, 2005.
Hermans C., Smeyers M., Rodriguez R.M. et al.: Quality assessment of urban trees: A comparative study of physio-logical characterisation, airborne imaging and on site fluores-cence monitoring by the OJIP-test. – J. Plant Physiol. 160: 81-90, 2003.

CHL a FLUORESCENCE INDUCTION FOR STRESS DETECTION
101
Hoagland D.R., Arnon D.I.: The water-culture method for growing plants without soil. – In: Agricultural Experiment Station, Circular 347. Pp. 1-39. College of Agriculture, University of California, Berkeley 1938.
Humplík J.F., Lazár L., Husičková A. et al.: Automated phenotyping of plant shoots using imaging methods for analysis of plant stress responses – a review. – Plant Methods 11: 29, 2015.
Jedmowski C., Ashoub A., Momtaz O. et al.: Impact of drought, heat, and their combination on chlorophyll fluorescence and yield of wild barley (Hordeum spontaneum).– J. Bot. 2015: 120868, 2015.
Jedmowski C., Bayramov S., Brüggemann W.: Comparative analysis of drought stress effects on photosynthesis of Eurasian and North African genotypes of wild barley. – Photosynthetica 52: 564-573, 2014.
Jedmowski C., Brüggemann W.: Imaging of fast chlorophyll fluorescence induction curve (OJIP) parameters, applied in a screening study with wild barley (Hordeum spontaneum) genotypes under heat stress. – J. Photoch. Photobio. B 151: 153-160, 2015.
Jiang C.-D., Shi L., Gao H.-Y. et al.: Development of photo-systems 2 and 1 during leaf growth in grapevine seedlings probed by leaf chlorophyll a fluorescence transient and 820 nm transmission in vivo. – Photosynthetica 44: 454-463, 2006.
Jiang H.-X., Chen L.-S., Zheng J.-G. et al.: Aluminum-induced effects on Photosystem II photochemistry in citrus leaves assessed by the chlorophyll a fluorescence transient. – Tree Physiol. 28: 1863-1871, 2008.
Jiang H.-X., Tang N., Zheng J.-G. et al.: Antagonistic actions of boron against inhibitory effects of aluminum toxicity on growth, CO2 assimilation, ribulose-1,5-bisphosphate carboxy-lase/oxygenase, and photosynthetic electron transport probed by the JIP-test, of Citrus grandis seedlings. – BMC Plant Biol. 9: 102, 2009.
Joshi M.K., Mohanty P.: Chlorophyll a fluorescence as a probe of heavy metal ion toxicity in plants. – In: Papageorgiou G.C., Govindjee (ed.): Chlorophyll a Fluorescence: A Signature of Photosynthesis. Advances in Photosynthesis and Respiration. Vol. 19. Pp. 637-661. Springer, Dordrecht 2004.
Kalaji H.M., Carpentier R., Allakhverdiev S.I. et al.: Fluores-cence parameters as early indicators of light stress in barley. – J. Photoch. Photobio. B 112: 1-6, 2012.
Kalaji H.M., Jajoo A., Oukarroum A. et al.: Chlorophyll a fluorescence as a tool to monitor physiological status of plants under abiotic stress conditions. – Acta Physiol. Plant. 38: 102, 2016.
Kalaji H.M., Oukarroum A., Alexandrov V. et al.: Identification of nutrient deficiency in maize and tomato plants by in vivo chlorophyll a fluorescence measurements. – Plant Physiol. Biochem. 81: 16-25, 2014b.
Kalaji H.M., Schansker G., Brestic M. et al.: Frequently asked questions about chlorophyll fluorescence, the sequel. – Photosynth. Res. 132: 13-66, 2017a.
Kalaji H.M., Schansker G., Ladle R.J. et al.: Frequently asked questions about chlorophyll fluorescence: practical issues. – Photosynth. Res. 122: 121-158, 2014a.
Kalaji M.H., Goltsev V.N., Żuk-Gołaszewska K. et al.: Chloro-phyll Fluorescence: Understanding Crop Performance – Basics and Applications. Pp. 222. CRC Press, Boca Raton 2017b.
Kale R., Hebert A.E., Frankel L.K. et al.: Amino acid oxidation of the D1 and D2 proteins by oxygen radicals during photoinhibition of Photosystem II. – Proc. Natl. Acad. Sci.
USA 114: 2988-2993, 2017. Kaňa R., Govindjee: Role of ions in the regulation of light
harvesting. – Front. Plant Sci. 7: 1849, 2016. Kouřil R., Lazár D, Lee H. et al.: Moderately elevated
temperature eliminates resistance of rice plants with enhanced expression of glutathione reductase to intensive photooxidative stress. – Photosynthetica 41: 571-578, 2003.
Krause G.H., Weis E.: Chlorophyll fluorescence and photosyn-thesis: the basics. – Annu. Rev. Plant Phys. 42: 313-349, 1991.
Kromdijk J., Głowacka K., Leonelli L. et al.: Improving photosynthesis and crop productivity by accelerating recovery from photoprotection. – Science 354: 857-861, 2016.
Lazár D., Ilík P., Nauš J.: An appearance of K-peak in fluores-cence induction depends on the acclimation of barley leaves to higher temperatures. – J. Lumin. 72-74: 595-596, 1997.
Lazár D., Ilík P.: High-temperature induced chlorophyll fluorescence changes in barley leaves. Comparison of the critical temperatures determined from fluorescence induction and from fluorescence temperature curve. – Plant Sci. 124: 159-164, 1997.
Lazár D., Nauš J.: Statistical properties of chlorophyll fluores-cence induction parameters. – Photosynthetica 35: 121-127, 1998.
Lazár D., Pospíšil P., Nauš J.: Decrease of fluorescence intensity after the K step in chlorophyll a fluorescence induction is suppressed by electron acceptors and donors to photosystem 2. – Photosynthetica 37: 255-265, 1999.
Lazár D., Schansker G.: Models of chlorophyll a fluorescence transients. – In: Laisk A., Nedbal A.L., Govindjee (ed.): Photosynthesis in Silico: Understanding Complexity from Molecules to Ecosystems. Advances in Photosynthesis and Respiration. Vol. 29. Pp. 85-123. Springer, Dordrecht 2009.
Lazár D.: Chlorophyll a fluorescence induction. – Biochim. Biophys. Acta 1412: 1-28, 1999.
Lazár D.: Chlorophyll a fluorescence rise induced by high light illumination of dark-adapted plant tissue studied by means of a model of photosystem II and considering photosystem II heterogeneity. – J. Theor. Biol. 220: 469-503, 2003.
Lazár D.: Modelling of light-induced chlorophyll a fluorescence rise (O–J–I–P transient) and changes in 820 nm-transmittance signal of photosynthesis. – Photosynthetica 47: 483-498, 2009.
Lazár D.: Parameters of photosynthetic energy partitioning. – J. Plant Physiol. 175: 131-147, 2015.
Lazár D.: Simulations show that a small part of variable chlorophyll a fluorescence originates in photosystem I and contributes to overall fluorescence rise. – J. Theor. Biol. 335: 249-264, 2013.
Lazár D.: The polyphasic chlorophyll a fluorescence rise measured under high intensity of exciting light. – Funct. Plant Biol. 33: 9-30, 2006.
Ley A.C., Mauzerall D.C.: Absolute absorption cross-sections for photosystem II and the minimum quantum requirement of photosynthesis in Chlorella vulgaris. – Biochim. Biophys. Acta 680: 95-106, 1982.
Liang Y., Chen H., Tang M.J. et al.: Responses of Jatropha curcas seedlings to cold stress: photosynthesis-related proteins and chlorophyll fluorescence characteristics. – Physiol. Plantarum 131: 508-517, 2007.
Lichtenthaler H.K., Buschmann C., Rinderle U. et al.: Appli-cation of chlorophyll fluorescence in ecophysiology. – Radiat. Environ. Biophys. 25: 297-308, 1986.
Liu Q.D., Zhu Y.R., Tao H.L. et al.: Damage of PSII during senescence of Spirodela polyrrhiza explants under long-day

A. STIRBET et al.
102
conditions and its prevention by 6-benzyladenine. – J. Plant Res. 119: 145-152, 2006.
Makino A.: Rubisco and nitrogen relationships in rice: Leaf photosynthesis and plant growth. – Soil Sci. Plant Nutr. 49: 317-327, 2003.
Marschner H.: Mineral Nutrition of Higher Plants, 2nd ed. Academic Press, London 1995.
Mathur S., Jajoo A., Mehta P. et al.: Analysis of elevated temperature-induced inhibition of photosystem II using chlorophyll a fluorescence induction kinetics in wheat leaves (Triticum aestivum). – Plant Biol. 13: 1-6, 2011.
McGrath J.M., Beztelberger A.M., Wang S. et al.: An analysis of ozone damage to historical maize and soybean yields in the United States. – Proc. Natl. Acad. Sci. USA 112: 14390-14395, 2015.
Mehta P., Jajoo A., Mathur S. et al.: Chlorophyll a fluorescence study revealing effects of high salt stress on Photosystem II in wheat leaves. – Plant Physiol. Biochem. 48: 16-20, 2010.
Meroni M., Rossini M., Guanter L. et al.: Remote sensing of solar-induced chlorophyll fluorescence: Review of methods and applications. – Remote Sens. Environ. 113: 2037-2051, 2009.
Mishra K.B., Mishra A., Klem K. et al.: Plant phenotyping: a perspective. – Ind. J. Plant Physiol. 21: 514-527, 2016a.
Mishra K.B., Mishra A., Novotná K. et al.: Chlorophyll a fluorescence, under half of the adaptive growth-irradiance, for high-throughput sensing of leaf-water deficit in Arabidopsis thaliana accessions. – Plant Methods 12: 46, 2016b.
Misra A.N. Srivastava A., Strasser R.J.: Utilization of fast chloro-phyll a fluorescence technique in assessing the salt/ion sensitivity of mung bean and Brassica seedlings. – J. Plant Physiol. 158: 1173-1181, 2001.
Morales F., Abadía A., Abadía J.: Photoinhibition and photo-protection under nutrient deficiencies, drought and salinity. – In: Demmig-Adams B., Adams III W.W., Mattoo A.K. (ed.): Photoprotection, Photoinhibition, Gene Regulation, and Environment. Pp. 65-85. Springer Science+Business Media B.V. Dordrecht 2008.
Moya I., Cerovic Z.G.: Remote sensing of chlorophyll fluores-cence: instrumentation and analysis. – In: Papageorgiou G.C., Govidjee (ed.): Chlorophyll a Fluorescence: A Signature of Photosynthesis. Pp. 429-445. Springer, Dordrecht 2004.
Müller P., Li X.-P-., Niyogi K.K.: Non-photochemical quen-ching. A response to excess light energy. – Plant Physiol. 125: 1558-1566, 2001.
Munday J.C. Jr., Govindjee: Light-induced changes in the fluorescence yield of chlorophyll a in vivo. III. The dip and the peak in the fluorescence transient of Chlorella pyrenoidosa. – Biophys. J. 9: 1-21, 1969a.
Munday J.C. Jr., Govindjee: Light-induced changes in the fluorescence yield of chlorophyll a in vivo. IV. The effect of preillumination on the fluorescence transient of Chlorella pyrenoidosa. – Biophys. J. 9: 22-35, 1969b.
Munns R., Tester M.: Mechanisms of salinity tolerance. – Annu. Rev. Plant Biol. 59: 651-681, 2008.
Murata N., Takahashi S., Nishiyama Y. et al.: Photoinhibition of photosystem II under environmental stress. – Biochim. Biophys. Acta 1767: 414-421, 2007.
Murchie E.H., Lawson T.: Chlorophyll fluorescence analysis: a guide to good practice and understanding some new applications. – J. Exp. Bot. 64: 3983-3998, 2013.
Nagajyoti P.C., Lee K.D., Sreekanth T.V.M.: Heavy metals, occurrence and toxicity for plants: a review. – Environ. Chem.
Lett. 8: 199-216, 2010. Nash D., Miyao M., Murata N.: Heat inactivation of oxygen
evolution in photosystem II particles and its acceleration by chloride depletion and exogenous manganese. – Biochim. Biophys. Acta 807: 127-133, 1985.
Nauš J., Kuropatwa R., Klinkovský T. et al.: Heat injury of barley leaves detected by the chlorophyll fluorescence temperature curve. – Biochim. Biophys. Acta 1101: 359-362, 1992.
Nernst W.H.: [Kinetics of solids: theory of difussion.] – Z. Phys. Chem. 3: 613-637, 1888. [In German]
Niinemets U.: A review of light interception in plant stands from leaf to canopy in different plant functional types and in species with varying shade tolerance. – Ecol. Res. 25: 693-714, 2010.
Nikiforou C., Manetas Y.: Inherent nitrogen deficiency in Pistacia lentiscus preferentially affects photosystem I: a seasonal field study. – Funct. Plant Biol. 38: 848-855, 2011.
Nilkens M., Kress E., Lambrev P. et al.: Identification of a slowly inducible zeaxanthin-dependent component of non-photoche-mical quenching of chlorophyll fluorescence generated under steady-state conditions in Arabidopsis. – Biochim. Biophys. Acta 1797: 466-475, 2010.
Oukarroum A., El Madidi S., Schansker G. et al.: Probing the responses of barley cultivars (Hordeum vulgare L.) by chlorophyll a fluorescence OLKJIP under drought stress and re-watering. – Environ. Exp. Bot. 60: 438-446, 2007.
Oukarroum A., El Madidi S., Strasser R.J.: Differential heat sensitivity index in barley cultivars (Hordeum vulgare L.) monitored by chlorophyll a fluorescence OKJIP. – Plant Physiol. Biochem. 105: 102-108, 2016.
Oukarroum A., Strasser R.J., van Staden J.: Phenotyping of dark and light adapted barley plants by the fast chlorophyll a fluorescence rise OJIP. – S. Afr. J. Bot. 70: 277-283, 2004.
Pan X., Chen X., Zhang D. et al.: Effect of Chromium(VI) on photosystem II activity and heterogeneity of Synechocystis sp. (Cyanophyta): studied with in vivo chlorophyll fluorescence tests. – J. Phycol. 45: 386-394, 2009.
Paoletti E., Bussotti F., Della Rocca G. et al.: Fluorescence transient in ozonated Mediterranean shrubs. – Phyton 44: 121-131, 2004.
Papageorgiou G.C., Govindjee (ed.): Chlorophyll a Fluores-cence: A Signature of Photosynthesis. Advances in Photosynthesis and Respiration, Vol. 19. Pp. 820. Springer, Dordrecht 2004.
Papageorgiou G.C., Govindjee: Photosystem II fluorescence: slow changes - scaling from the past. – J. Photochem. Photobiol. B. 104: 258-270, 2011
Papageorgiou G.C., Tsimilli-Michael M., Stamatakis K.: The fast and slow kinetics of chlorophyll a fluorescence induction in plants, algae and cyanobacteria: a viewpoint. – Photosynth. Res. 94: 275-290, 2007.
Pareek A., Sopory S.K., Bohnert H.K. et al. (ed.): Abiotic Stress Adaptation in Plants: Physiological, Molecular and Genomic Foundation. Pp. 526, Springer, Dordrecht 2010.
Parida A.K., Das A.B.: Salt tolerance and salinity effects on plants: A review. – Ecotoxicol. Environ. Safe. 60: 324-349, 2005.
Prakash J.S.S., Srivastava A., Strasser R.J. et al.: Senescence induced alterations in the photosystem II functions of Cucumis sativus cotyledons: probing of senescence driven alterations of photosystem II by chlorophyll a fluorescence induction O-J-I-P transients. – Indian J. Biochem. Biophys. 40: 160-168, 2003.
Rapacz M., Sasal M., Kalaji H.M. et al.: Is the OJIP test a reliable indicator of winter hardiness and freezing tolerance of common

CHL a FLUORESCENCE INDUCTION FOR STRESS DETECTION
103
wheat and triticale under variable winter environments? – PLoS ONE 10: e0134820, 2015b.
Rapacz M., Sasal M., Wójcik-Jagła M.: Direct and indirect measurements of freezing tolerance: advantages and limitations. – Acta Physiol. Plant. 37: 157-173, 2015a.
Rapacz M., Woźniczka A.: A selection tool for freezing tolerance in common wheat using the fast chlorophyll a fluorescence transient. – Plant Breeding 128: 227-234, 2009.
Rapacz M.: Chlorophyll a fluorescence transient during freezing
and recovery in winter wheat. – Photosynthetica 45: 409-418, 2007.
Schansker G., Tóth S.Z., Holzwarth A.R. et al.: Chlorophyll a fluorescence: beyond the limits of the QA-model. – Photosynth. Res. 120: 43-58, 2014.
Schansker G., Tóth S.Z., Kovács L. et al.: Evidence for a fluorescence yield change driven by a light induced conformational change within photosystem II during the fast chlorophyll a fluorescence rise. – Biochim. Biophys. Acta 1807: 1032-1043, 2011.
Schreiber U., Berry J.A.: Heat-induced changes of chlorophyll fluorescence in intact leaves correlated with damage of photosynthetic apparatus. – Planta 136: 233-238, 1977.
Serbin S.P., Dillaway D.N., Kruger .E.L. et al.: Leaf optical properties reflect variation in photosynthetic metabolism and its sensitivity to temperature. – J. Exp. Bot. 63: 489-502, 2012.
Shabnam N., Sharmila P., Govindjee et al.: Differential response of floating and submerged leaves of long leaf pondweed to silver ions. – Front. Plant Sci. 8: 1052, 2017.
Srivastava A, Govindjee, Strasser R.J.: Greening of peas: parallel measurements on 77 K emission spectra, OJIP chlorophyll a fluorescence transient, period four oscillation of the initial fluorescence level, delayed light emission, and P700. – Photosynthetica 37: 365-392, 1999.
Srivastava A., Guissé B., Greppin H. et al.: Regulation of antenna structure and electron transport in PSII of Pisum sativum under elevated temperature probed by the fast polyphasic chlorophyll a fluorescence transient OKJIP. – Biochim. Biophys. Acta 1320: 95-106, 1997.
Stauffer P.H.: Flux flummoxed: A proposal for consistent usage. – Ground Water 44: 125-128, 2006.
Stefanov D., Petkova V., Denev I.D.: Screening for heat toler-ance in common bean (Phaseolus vulgaris L.) lines and culti-vars using JIP-test. – Sci. Hortic.-Amsterdam 128: 1-6, 2011.
Stirbet A., Govindjee, Strasser B.J. et al.: Chlorophyll a fluorescence induction in higher plants: Modelling and numerical simulation. – J. Theor. Biol. 193: 131-151, 1998.
Stirbet A., Govindjee: Chlorophyll a fluorescence induction: a personal perspective of the thermal phase, the J-I-P rise. – Photosynth. Res. 113: 15-61, 2012.
Stirbet A., Govindjee: On the relation between the Kautsky effect (chlorophyll a fluorescence induction) and photosystem II: Basis and applications of the OJIP fluorescence transient. – J. Photochem. Photobiol. B 104: 236-257, 2011.
Stirbet A., Riznichenko G.Yu., Rubin A.B. et al.: Modeling chlorophyll a fluorescence transient: relation to photosynthesis. – Biochemistry-Moscow 79: 291-323, 2014.
Strasser B.J, Strasser R.J.: Measuring fast fluorescence transients to address environmental questions: The JIP test. – In: Mathis P. (ed.): Photosynthesis: from Light to Biosphere. Vol. 5. Pp. 977-980. Kluwer Academic Publishers, Dordrecht 1995.
Strasser B.J.: Donor side capacity of photosystem II probed by chlorophyll a fluorescence transients. – Photosynth. Res. 52: 147-155, 1997.
Strasser R.J., Srivastava A., Govindjee: Polyphasic chlorophyll a fluorescence transient in plants and cyanobacteria. – Photochem. Photobiol. 61: 32-42, 1995.
Strasser R.J., Srivastava A., Tsimilli-Michael M.: Screening the vitality and photosynthetic activity of plants by fluorescence transient. – In: Behl R.K., Punia M.S., Lather B.P.S. (ed.): Crop Improvement for Food Security. Pp. 72-115. SSARM, Hisar, India 1999.
Strasser R.J., Tsimilli-Michael M., Dangre D. et al.: Biophysical phenomics reveals functional building blocks of plants systems biology: a case study for the evaluation of the impact of mycorrhization with Piriformospora indica. – In: Varma A., Oelmüler R. (ed.): Advanced Techniques in Soil Microbiology. Soil Biology. Pp. 319-341. Springer, Berlin 2007.
Strasser R.J., Tsimilli-Michael M., Srivastava A.: Analysis of the chlorophyll a fluorescence transient. – In: Papageorgiou G.C., Govindjee (ed.): Chlorophyll a Fluorescence: A Signature of Photosynthesis,Advances in Photosynthesis and Respiration, Vol. 19. Pp. 321-362. Springer, Dordrecht 2004.
Strasser R.J., Tsimilli-Michael M., Srivastava A.: The fluores-cence transient as a tool to characterize and screen photo-synthetic samples. – In: Yunus M., Pathre U., Mohanty P. (ed.): Probing Photosynthesis: Mechanisms, Regulation and Adaptation. Pp. 443-480. Taylor & Francis, London 2000.
Strasser R.J.: The grouping model of plant photosynthesis. – In: Akoyunoglou G., Argyroudi-Akoyunoglou J.H. (ed.): Chloroplast Development. Pp. 513-538. Elsevier Biomedical, Amsterdam 1978.
Strauss A.J., Krüger G.H.J., Strasser R.J. et al.: Ranking of dark chilling tolerance in soybean genotypes probed by the chlorophyll a fluorescence transient O-J-I-P. – Environ. Exp. Bot. 56: 147-157, 2006.
Sudhir P., Murthy S.D.S.: Effects of salt stress on basic processes of photosynthesis. – Photosynthetica 42: 481-486, 2004.
Toepel J., Gilbert M., Wilhelm C.: Can chlorophyll a in-vivo fluorescence be used for quantification of carbon-based primary production in absolute terms? – Arch. Hydrobiol. 160: 515-526, 2004.
Tsimilli-Michael M., Eggenberg P., Biro B. et al.: Synergistic and antagonistic effects of arbuscular mycorrhizal fungi and Azospirillum and Rhizobium nitrogen-fixers on the photo-synthetic activity of alfalfa, probed by the polyphasic chlorophyll a fluorescence transient O-J-I-P. – Appl. Soil Ecol. 15: 169-182, 2000.
Tsimilli-Michael M., Pêcheux M., Strasser R.J.: Vitality and stress adaptation of the symbionts of coral reef and temperate foraminifers probed in hospite by the fluorescence kinetics O-J-I-P. – Arch. Sci. Genève 51: 1-36, 1998.
Tsimilli-Michael M., Strasser R.J.: In vivo assessment of plants’ vitality: applications in detecting and evaluating the impact of mycorrhization on host plants. – In: Varma A. (ed.): Mycorrhiza: State of the Art. Genetics and Molecular Biology, Eco-Function, Biotechnology, Eco-Physiology, Structure and Systematics, 3rd ed. Pp. 679-703. Springer, Dordrecht 2008.
van Heerden P.D.R., Strasser R.J., Krüger G.H.J.: Reduction of dark chilling stress in N2-fixing soybean by nitrate as indicated by chlorophyll a fluorescence kinetics. – Physiol. Plantarum 121: 239-249, 2004b.
van Heerden P.D.R., Tsimilli-Michael M., Krüger G.H.J. et al.: Dark chilling effects on soybean genotypes during vegetative development: Parallel studies of CO2 assimilation, chlorophyll a fluorescence kinetics O-J-I-P and nitrogen fixation. – Physiol. Plantarum 117: 476-491, 2003.

A. STIRBET et al.
104
van Heerden P.D.R., Viljoen M.M., DeVilliers M. et al.: Limitation of photosynthetic carbon metabolism by dark chilling in temperate and tropical soybean genotypes. – Plant Physiol. Biochem. 42: 117-124, 2004a.
van Straten G., van Thoor B., van Willegenburg L.G. et al.: A ‘big leaf, big fruit, big substrate’ model for experiments on receding horizon optimal control of nutrient supply to greenhouse tomato. – Acta Hortic. 718: 147-155, 2006.
Volgusheva A., Yakovleva O.V., Kukarskikh G.P. et al.: Performance index in assessing the physiological state of trees in urban ecosystems. – Biophysics 56: 90-95, 2011.
Wang X.Y., Xu X.M., Cui J.: The importance of blue light for leaf area expansion, development of photosynthetic apparatus, and chloroplast ultrastructure of Cucumis sativus grown under weak light. – Photosynthetica 53: 213-222, 2015.
Wong D., Govindjee: Effects of lead ions on photosystem I in isolated chloroplasts: Studies on the reaction center P700. – Photosynthetica 10: 241-254, 1976.
Yan K., Chen P., Shao H. et al.: Responses of photosynthesis and photosystem II to higher temperature and salt stress in sorghum. – J. Agron. Crop Sci. 198: 218-226, 2012.
Yusuf M.A., Kumar D., Rajwanshi R. et al.: Overexpression of gamma-tocopherol methyl transferase gene in transgenic Brassica juncea plants alleviates abiotic stress: Physiological and chlorophyll fluorescence measurements. – Biochim. Biophys. Acta 1797: 1428-1438, 2010.
Yusuf M.A., Sarin N.B.: Antioxidant value addition in human diets: genetic transformation of Brassica juncea with γ-TMT gene for increased α-tocopherol content. – Transgenic Res. 16: 109-113, 2007.
Zhu X.-G., Govindjee, Baker N.R. et al.: Chlorophyll a fluorescence induction kinetics in leaves predicted from a model describing each discrete step of excitation energy and electron transfer associated with Photosystem II. – Planta 223: 114-133, 2005.
Zubek S., Stojakowska A., Anielska T. et al.: Arbuscular mycorrhizal fungi alter thymol derivative contents of Inula ensifolia L. – Mycorrhiza 20: 497-504, 2010.
Živčák M., Olšovská K., Slamka P. et al.: Measurements of chlorophyll fluorescence in different leaf positions may detect nitrogen deficiency in wheat. – Zemdirbyste-Agriculture 101: 437-443, 2014.