CHK 2016 Analyst Day
177
DOUG LAWLER
-
Upload
chesapeake-energy-corporation -
Category
Presentations & Public Speaking
-
view
12.749 -
download
0
Transcript of CHK 2016 Analyst Day

DOUG LAWLER

CAUTIONARY STATEMENTS
This presentation includes “forward-looking statements” within the meaning of Section 27A of the Securities Act of 1933 and Section 21E of theSecurities Exchange Act of 1934. Forward-looking statements are statements other than statements of historical fact. They include statements thatgive our current expectations or forecasts of future events, production and well connection forecasts, estimates of operating costs, anticipatedcapital and operational efficiencies, planned development drilling and expected drilling cost reductions, general and administrative expenses, capitalexpenditures, the timing of anticipated noncore asset sales and proceeds to be received therefrom, projected cash flow and liquidity, our ability toenhance our cash flow and financial flexibility, plans and objectives for future operations (including our ability to optimize base production andexecute gas gathering agreements), the ability of our employees, portfolio strength and operational leadership to create long-term value, and theassumptions on which such statements are based. Although we believe the expectations and forecasts reflected in the forward-looking statementsare reasonable, we can give no assurance they will prove to have been correct. They can be affected by inaccurate or changed assumptions or byknown or unknown risks and uncertainties.
Factors that could cause actual results to differ materially from expected results include those described under “Risk Factors” in Item 1A of ourannual report on Form 10-K and any updates to those factors set forth in Chesapeake’s subsequent quarterly reports on Form 10-Q or currentreports on Form 8-K (available at http://www.chk.com/investors/sec-filings). These risk factors include the volatility of oil, natural gas and NGLprices; the limitations our level of indebtedness may have on our financial flexibility; our inability to access the capital markets on favorable terms orat all; the availability of cash flows from operations and other funds to finance reserve replacement costs or satisfy our debt obligations; a furtherdowngrade in our credit rating requiring us to post more collateral under certain commercial arrangements; write-downs of our oil and natural gasasset carrying values due low commodity prices; our ability to replace reserves and sustain production; uncertainties inherent in estimatingquantities of oil, natural gas and NGL reserves and projecting future rates of production and the amount and timing of development expenditures;our ability to generate profits or achieve targeted results in drilling and well operations; leasehold terms expiring before production can beestablished; commodity derivative activities resulting in lower prices realized on oil, natural gas and NGL sales; the need to secure derivativeliabilities and the inability of counterparties to satisfy their obligations; adverse developments or losses from pending or future litigation andregulatory proceedings, including royalty claims; charges incurred in response to market conditions and in connection with our ongoing actions toreduce financial leverage and complexity; drilling and operating risks and resulting liabilities; effects of environmental protection laws and regulationon our business; legislative and regulatory initiatives further regulating hydraulic fracturing; our need to secure adequate supplies of water for ourdrilling operations and to dispose of or recycle the water used; impacts of potential legislative and regulatory actions addressing climate change;federal and state tax proposals affecting our industry; potential OTC derivatives regulation limiting our ability to hedge against commodity pricefluctuations; competition in the oil and gas exploration and production industry; a deterioration in general economic, business or industry conditions;negative public perceptions of our industry; limited control over properties we do not operate; pipeline and gathering system capacity constraintsand transportation interruptions; terrorist activities and cyber-attacks adversely impacting our operations; potential challenges of our spin-off ofSeventy Seven Energy Inc. (SSE) in connection with SSE’s recently completed bankruptcy under Chapter 11 of the U.S. Bankruptcy Code; aninterruption in operations at our headquarters due to a catastrophic event; the continuation of suspended dividend payments on our common stockand preferred stock; certain anti-takeover provisions that affect shareholder rights; and our inability to increase or maintain our liquidity through debtrepurchases, capital exchanges, asset sales, joint ventures, farmouts or other means.
2016 ANALYST DAY – WELCOME AND COMPANY OVERVIEW 2

CAUTIONARY STATEMENTS (CONT.)
In addition, disclosures concerning the estimated contribution of derivative contracts to our future results of operations are based upon marketinformation as of a specific date. These market prices are subject to significant volatility. Our production forecasts are also dependent upon manyassumptions, including estimates of production decline rates from existing wells and the outcome of future drilling activity. Expected asset salesmay not be completed in the time frame anticipated or at all. We caution you not to place undue reliance on our forward-looking statements, whichspeak only as of the date of this presentation, and we undertake no obligation to update any of the information provided in this presentation, exceptas required by applicable law.
PV10 is a non-GAAP measurement used by the industry, investors and analysts to estimate present value, discounted at 10% per annum, ofestimated future cash flows of our estimated proved reserves before income tax and asset retirement obligations. The most directly comparableGAAP measure is the standard measure of discounted future net cash flows. Management believes that PV10 provides useful information toinvestors because it is widely used by professional analysts and sophisticated investors in evaluating oil and natural gas companies. Because thereare many unique factors that can impact an individual company when estimating the amount of future income taxes to be paid, we believe the use ofa pre-tax measure is valuable for evaluating our company. PV10 should not be considered as an alternative to the standardized measure ofdiscounted future net cash flows as computed under GAAP. With respect to PV10 calculated as of an interim date, it is not practical to calculatetaxes for the related interim period because GAAP does not provide for disclosure of standardized measure on an interim basis.
The SEC requires oil and gas companies, in their filings with the SEC, to disclose proved reserves that a company has demonstrated by actualproduction or conclusive formation tests to be economically and legally producible under existing economic and operating conditions. We usecertain terms in this presentation, such as “estimated ultimate recovery” (EUR), “oil in place” (OIP), “gross recoverable resource,” “resourcepotential,” “type curve” and similar phrases. These estimates are by their nature more speculative than estimates of proved, probable and possiblereserves and accordingly are subject to substantially greater risk of being actually realized. The SEC guidelines strictly prohibit us from includingthese estimates in filings with the SEC. Investors are urged to consider closely the disclosures and risk factors in our most recent Form 10-K and inother reports on file with the SEC.
2016 ANALYST DAY – WELCOME AND COMPANY OVERVIEW 2

2016 ANALYST DAY – WELCOME AND COMPANY OVERVIEW 3

2016 ANALYST DAY – WELCOME AND COMPANY OVERVIEW 4
Rediscovering
Chesapeake Energy…

2016 ANALYST DAY – WELCOME AND COMPANY OVERVIEW 5
FINANCIAL
DISCIPLINE

2016 ANALYST DAY – WELCOME AND COMPANY OVERVIEW 6

(1) 2016E represents 10/20 Outlook ranges
2016 ANALYST DAY – WELCOME AND COMPANY OVERVIEW 7
(1)

2016 ANALYST DAY – WELCOME AND COMPANY OVERVIEW 8
BUSINESS
DEVELOPMENT

*Represents gross proceeds from asset sales
2016 ANALYST DAY – WELCOME AND COMPANY OVERVIEW 9

2016 ANALYST DAY – WELCOME AND COMPANY OVERVIEW 10
EXPLORATION

2016 ANALYST DAY – WELCOME AND COMPANY OVERVIEW 11

2016 ANALYST DAY – WELCOME AND COMPANY OVERVIEW 12
PROFITABLE AND
EFFICIENT GROWTH

(1) Economics assume $3/mcf and $60/bbl flat
2016 ANALYST DAY – WELCOME AND COMPANY OVERVIEW 13
(1)
(1)

2016 ANALYST DAY – WELCOME AND COMPANY OVERVIEW 14

(1) Includes Upper Eagle Ford and Austin Chalk locations; operated gross risked locations
(2) PV10 positive breakeven price assuming $3 gas price
2016 ANALYST DAY – WELCOME AND COMPANY OVERVIEW 15
(1)
(2)

(1) Includes all Gulf Coast locations; operated gross risked locations
2016 ANALYST DAY – WELCOME AND COMPANY OVERVIEW 16
(1)

(1) Price deck at $3 and $60 flat
(2) PV10 positive breakeven price assuming $3 gas price
2016 ANALYST DAY – WELCOME AND COMPANY OVERVIEW 17
(1)
(2)

(1) Operated gross risked locations
2016 ANALYST DAY – WELCOME AND COMPANY OVERVIEW 18
(1)
(1) Operated gross risked locations
(2) PV10 positive breakeven price assuming $3 gas price
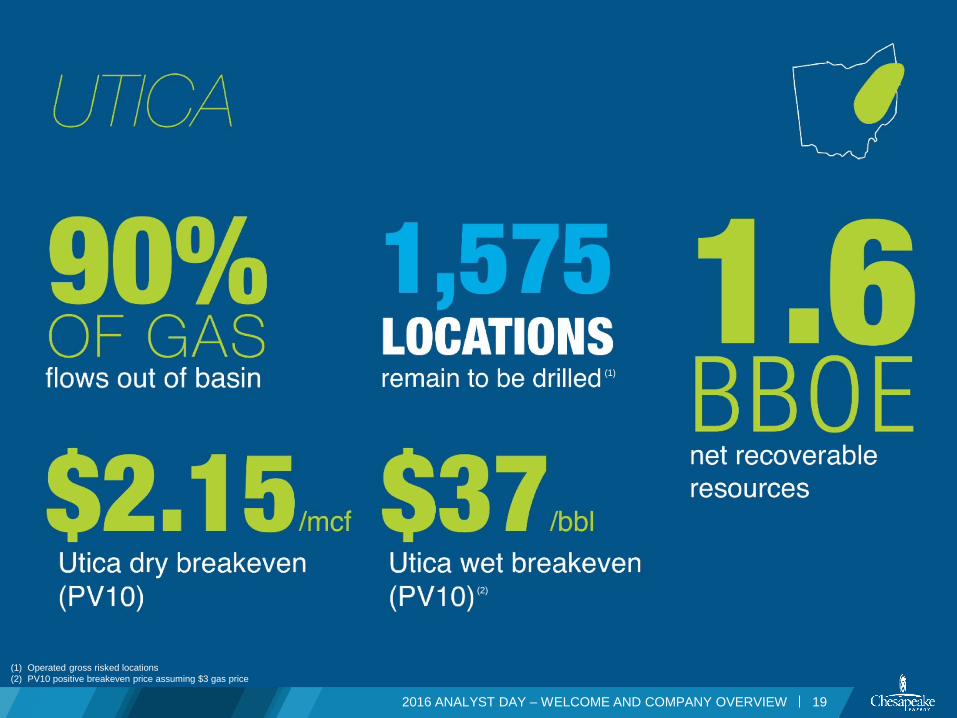
2016 ANALYST DAY – WELCOME AND COMPANY OVERVIEW 19
(2)
(1)

(1) Operated gross risked locations
(2) PV10 positive breakeven price assuming $3 gas price
2016 ANALYST DAY – WELCOME AND COMPANY OVERVIEW 20
(1)
(2)

2016 ANALYST DAY – WELCOME AND COMPANY OVERVIEW 21

(1) ~7.0mm net acres
2016 ANALYST DAY – WELCOME AND COMPANY OVERVIEW 22
(1)

WHAT YOU NEED TO KNOW…
> Large acreage position that is largely held, so no longer drilling just to hold acreage,
but drilling to deliver value
> We are expanding the economic core in several plays and have more remaining
locations to drill than we have drilled in our history
> Stacked potential in almost every play
> Leading drilling and completion technology in several plays – technological advances
rapidly being deployed throughout the portfolio
> Multiple oil growth opportunities in portfolio
Our program today will build on
this foundation and more…

FRANK PATTERSON

POWDER RIVER BASIN – WHAT HAS CHANGED?
• Renegotiated midstream
agreement unlocks a material
development opportunity
• Leveraged learnings throughout
CHK to optimize performance
• Petroleum systems-based analysis
provides new stacked-play
opportunities
2016 ANALYST DAY – POWDER RIVER BASIN 3
4+ Rigs
Development program commences November 2016

• One vertical mile of opportunity
˃ 8+ stacked formations
• ~2,600 risked locations
• The next oil growth asset
-
20
40
60
80
100
120
2017E 2018E 2019E 2020E 2021E 2022E
mb
oe
/d
Net Production Potential
Oil NGL Natural Gas
35%
16%
49%
Resource Mix
Oil NGL Natural Gas
~2.7 BBOE RESOURCE POTENTIAL
2016 ANALYST DAY – POWDER RIVER BASIN 4
Gross Recoverable Resource Potential
2016E CHK Eagle Ford Equivalent
4+ Rigs1–2 Rigs

307,000 ACRES OF GROWTH POTENTIAL
• ~90% undeveloped locations
• 98% of leases cover all depths
• 10 operated federal units
˃ Single-operator control
˃ Minimal drilling obligations
˃ Long-lateral development
2016 ANALYST DAY – POWDER RIVER BASIN
80%
20%
Acreage Status
HBO/HBP/HBU
Non-Producing
5
90%
10%
Locations
Remaining Development
Drilled
48%45%
7%
Acreage Type
Federal Fee State
~307,000 Net Acres in Powder
River Basin – 80% HBP/HBU

HOTSPOT ADVANTAGE
2016 ANALYST DAY – POWDER RIVER BASIN 6
• CHK owns Southern PRB hotspot
• DJ Basin and Northern PRB analog
• Advantages of CHK hotspot position
˃ Higher pressure
˃ Greater hydrocarbon generation (maturity)
˃ Exposed to all three hydrocarbon phases
Volatile Oil Black OilCondensate
DVN, EOG, etc. CHK Core Area

SUSSEX SANDSTONEHIGHLY ECONOMIC OIL PLAY
• Moving to development
• Dominant position in the play
• ~200 undrilled locations
˃ Assumes 1,320' spacing
˃ Overpressured – high deliverability
• Targeted development
˃ EUR: 825 – 1,350 mboe
˃ ROR: 50 – 70% (1)
˃ 2017 focused drilling program
2016 ANALYST DAY – POWDER RIVER BASIN
53%
12%
35%
Production Mix
Oil NGL Natual Gas
7
(1) Assumes $3 gas and $60 oil prices flat
(2) PV10 positive breakeven price assuming $3 gas price
Teapot
ParkmanE, A, B/C & Deep
Surrey
Sussex
Niobrara
Turner
Frontier
Mowry
Oil breakeven price (2)
<$40

SUSSEX SANDSTONEBEST IN BASIN
2016 ANALYST DAY – POWDER RIVER BASIN 8
#1 PRB Sussex well640 mboe cumulative production
• Best Sussex performance in the Powder River Basin
• Development plan optimized
˃ Spacing
˃ Drilling and completion design
• Competitive economics in current environment
(1) IHS data
Best Sussex in the PRB

Turner North CHK Turner
Depth ~10,000' ~11,000'
Reservoir Pressure (Est.) ~4,800 psi ~6,800 psi
Avg. Porosity 7% 7%
Avg. Water Saturation 45 – 60% 35 – 60%
TURNER SANDSTONEPROVEN RESERVOIR – UNREALIZED VALUE
• Same play as northern hotspot with
similar rock properties and anticipated
higher pressure
• >300 industry wells drilled to date
• One of the most actively permitted
sandstones in the Powder River Basin
• Offset activity proves potential, but not
optimized for drilling and completion
2016 ANALYST DAY – POWDER RIVER BASIN 9

TURNER SANDSTONEPROVEN RESERVOIR – UNREALIZED VALUE
• CHK controls 65% of southern
high-grade
˃ CHK position overlies thickest net pay
• ~340 undrilled locations
˃ Assumes 2,640' spacing
• Targeted development through 2020
˃ EUR: ~1,300 mboe
˃ ROR: ~45% (1)
2016 ANALYST DAY – POWDER RIVER BASIN
48%
14%
38%
Production Mix
Oil NGL Natural Gas
10
(1) Assumes $3 gas and $60 oil
(2) PV10 positive breakeven price assuming $3 gas price
Teapot
ParkmanE, A, B/C & Deep
Surrey
Sussex
Niobrara
Turner
Frontier
Mowry
Oil breakeven price (2)
~$40

NIOBRARAPOSITIONED FOR SUCCESS
• Premier Niobrara position in the PRB
• Oil, gas and condensate – provides
flexibility
• ~580 undrilled locations
˃ Assumes 1,100' – 1,320' spacing
• Targeted development through 2020
˃ EUR: ~880 mboe
˃ ROR: ~45% (1)
(1) Assumes $3 gas and $60 oil
(2) PV10 positive breakeven price assuming $3 gas price
(3) IHS data
2016 ANALYST DAY – POWDER RIVER BASIN 11
54%
12%
34%
Production Mix
Oil NGL Natural Gas
CHK Barton Test
Peak Rate of 1,600+ boe/d (85% Oil)
230 mbo 1-Year Cum.
DJ Basin, Green River Basin, North Park Basin, Piceance Basin,
Powder River Basin and Williston Basin
Teapot
ParkmanE, A, B/C & Deep
Surrey
Sussex
Niobrara
Turner
Frontier
Mowry
Oil breakeven price (2)
~$40
Outperforming all U.S. Niobrara
horizontal wells to date

MOWRY SHALEHIDDEN RESOURCE GIANT
• World-class source rock
˃ Overpressured
˃ Three phases present
• Multiple penetrations and core
data available
• ~25 horizontal wells drilled by
industry since 2005
2016 ANALYST DAY – POWDER RIVER BASIN
15%
21%64%
Production Mix
Oil NGL Natural Gas
1.45 bboeGross recoverable resource potential
12
Teapot
ParkmanE, A, B/C & Deep
Surrey
Sussex
Niobrara
Turner
Frontier
Mowry

2016 ANALYST DAY – POWDER RIVER BASIN 13
MOWRY SHALEHIDDEN RESOURCE GIANT
• Mowry compares favorably to other prolific source rocks
• Strong relationship between competitor frac size and EUR
˃ Large upside with Chesapeake-style frac
• Anticipate significantly greater reservoir pressure than
northern Mowry wells
Positive Correlation of
Proppant vs. EUR/ft. (1)
Mowry
Porosity
Pressure Thickness Porosity TOC Mineralogy
Mowry is similar to… Utica Haynesville Woodford Eagle Ford Woodford
(1) IHS data

-
20
40
60
80
100
120
2017E 2018E 2019E 2020E 2021E 2022E
mb
oe
/d
Net Production Potential
Oil NGL Natural Gas
4+ Rigs1–2 Rigs
WHY POWDER RIVER BASIN?ONE MILE OF OPPORTUNITY
2016 ANALYST DAY – POWDER RIVER BASIN 14
2016E CHK Eagle Ford Equivalent
• ~2.7 bboe gross recoverable resource potential
• ~2,600 risked locations
• Stacked potential – equivalent to 730,000 acres
• Renegotiated midstream unlocks value
• Significant exposure to Mowry upside
• The next oil growth asset
Teapot
ParkmanE, A, B/C & Deep
Surrey
Sussex
Niobrara
Turner
Frontier
Mowry

APPENDIX
2016 ANALYST DAY – POWDER RIVER BASIN 15

MOWRY SHALEHIDDEN RESOURCE GIANT
• CHK Mowry maturity 20% – 30%
higher than northern Mowry
• Strong correlation with completion
size and performance
(1) IHS data
2016 ANALYST DAY – POWDER RIVER BASIN 16
Positive Correlation of
Proppant vs. EUR/ft. (1)

PARKMAN SANDSTONESHIGH VOLUME OIL PLAYS
• Extensive play development to north
˃ BC sand produced by DVN and EOG
• CHK controls the southern extension of
the Parkman BC trend
˃ Similar rock quality and thickness to that
in the northern area
• CHK Parkman area contains
three additional, discrete sands
• EUR: 860 mboe
• ROR: ~45% (1)
(1) Assumes $3 gas and $60 oil flat
2016 ANALYST DAY – POWDER RIVER BASIN 17
Four Parkman sandsWithin CHK’s position

CHK LAND POSITIONA STRATEGIC ADVANTAGE
• CHK dominates
southern Powder
hotspot
• Northern hotspot
shared by multiple
competitors (1)
(1) Competitor leasehold sourced from Drilling Info and company press releases
2016 ANALYST DAY – POWDER RIVER BASIN 18

PV10 DEVELOPMENT MONEY MAPS
2016 ANALYST DAY – POWDER RIVER BASIN 19

-
100
200
300
400
500
600
700
800
2013 2014 2015 2016E
Appalachia North Appalachia South Powder River South Texas
Gulf Coast Mid-Continent Central Texas Marcellus South
NET EQUIVALENT PRODUCTIONPOWDER RIVER BASIN: ~2% TOTAL PRODUCTION 2016E
Divested - 2014Divested - 2016
2016 ANALYST DAY – POWDER RIVER BASIN 20
mboe/d

POWDER RIVER MODELING INPUTS
2016 ANALYST DAY – POWDER RIVER BASIN 21
51%36%
13%
Production Mix
Oil Natural Gas NGL
0
200
400
600
800
1000
0
400
800
1200
1600
2000
0 12 24 36 48
Oil
and N
GL R
ate
(bbl/d)
Gas R
ate
(m
cf/
d)
Producing Months
Powder River Type Curve Production Profile
Gas Oil NGLs
Base Production(1)
3Q’16E Net Production 14 mboe/d
4 Yr. Average Annual Decline(2) 24%
Gross Capex
Drilling(6) (136 days to TIL) $4.3mm
Completion (62 days to TIL) $3.2mm
TIL $1.0mm
TOTAL $8.5mm
Curve Parameters
IP(5) (Oil / Gas) 990 bbl/d / 1.7 mmcf/d
Decline (Oil / Gas) 74%/42.5%
B-factor (Oil / Gas) 1.0/0.9
Shrink 92%
NGL Yield 55 bbl/mmcf
EUR 1.2 mmboe
Lateral Length 8,400 ft.
2017 Expenses & Differential Estimates(1)
Production Expense(3) ($/boe) $4.95 – $5.35
2017 GP&T(4) ($/boe) $13.25 – $13.45
Future Dev. GP&T(4) ($/boe) $4.75 – $6.75
Interest / Gross Locations
WI / NRI(7) 80%/65%
Producing 185
DUCs 15
Undrilled(8) 2,600
Rig Count 1 – 10
2017 – 2020 Blended Development Program
(1) Applies to total asset inclusive of non-operated
(2) Compound Annual Decline from 7/2016 – 6/2020
(3) Reflects net asset level production expense including LOE, overhead and Ad Val
(4) Excludes all intercompany marketing fees
(5) 30 day average IP
(6) 27 days spud to spud
(7) Assumed until well proposed
(8) All potential locations; not necessarily all drilled by 2020

FRANK PATTERSON

NORTHEAST GAS POWERHOUSE
• Free cash flow generator
• High-quality and diverse position
• Growth potential and portfolio
flexibility
• Operational excellence
2016 ANALYST DAY – APPALACHIA 2
4% of domestic gas production
Access to premium markets

UTICA SHALETHREE PHASE PETROLEUM SYSTEM
2016 ANALYST DAY – APPALACHIA 3
Abundant opportunitiesSignificant resource optionality
~1,100,000 Net Acres in Utica
Wet 790Dry
370
Oil 415
Undrilled Locations
Drilled 30%
Location Count
Remaining
Development
70%

CHESAPEAKE’S MARKETING ADVANTAGESUTICA
2016 ANALYST DAY – APPALACHIA 4
Significant access to premium markets
• >90% of gas flows out of basin
Increasing basin takeaway
• Opportunity to acquire available capacity
No projected shortfalls
• Requires less than four rigs per year
TGP Utica BH
NEXUS
OPEN
0
100
200
300
400
500
600
700
800
900
7/1/2016 10/1/2016 1/1/2017 4/1/2017 7/1/2017 10/1/2017 1/1/2018 4/1/2018 7/1/2018 10/1/2018
Projected Utica Net Marketed Volume(mmbtu)
Production (mmbtu)
TGP BH

BASIN-LEADING OPERATIONAL PERFORMANCEUTICA
Competitor data from IHS, public data and company disclosures, competitors include AR, ARU, ECR and GPOR (ARU excluded from gross well capex)
2016 ANALYST DAY – APPALACHIA 5
0
2,000
4,000
6,000
8,000
10,000
12,000
2013 2014 2015 2015Competitor
Average
2016E
Completed Lateral Length (ft.)
$0
$400
$800
$1,200
$1,600
2013 2014 2015 2015Competitor
Average
2016E
Gross Well Capex ($/ft. of Completed Lateral)
0
5,000
10,000
15,000
20,000
25,000
2013 2014 2015 2015Competitor
Average
2016YTD
Measured Depth (ft.)
0
500
1,000
1,500
2,000
2,500
2013 2014 2015 2015Competitor
Average
2016YTD
Drilling Efficiency (ft./d)
~40% increase
in drilling efficiency
~50% increase
in capital efficiency

DRY GAS GROWTHUTICA
(1) Assumes $3/mcf gas flat
2016 ANALYST DAY – APPALACHIA 6
Utica Dry Locations
Drilled
10%
Remaining
Development
90%
>350% Production growth
>40% RORAverage CHK WI ~ 90% (1)
~93% of dry gas is sent to Gulf market
$2.14Per mcf Utica Dry PV10
breakeven
Utica Dry Production
(mmcf/d)
Ga
s P
rod
uctio
n m
mcf/
d

FLEXIBLE INVESTMENT OPPORTUNITIESSTRENGTH IN OPTIONALITY – UTICA
(1) Assumes $3 / $48 for 2017 and $3 / $60 in 2018, excluding hedges
2016 ANALYST DAY – APPALACHIA 7
• High-quality and diverse position
• Operational excellence
• Market advantages
• Large inventory
~$200mmProjected free cash flow
through 2018 (1)
Drilled 30%
Location Count
Remaining
Development
70% $40
$50
$60
$70
$80
$2.00
$2.50
$3.00
$3.50
$4.00
0% 50% 100% 150%
Oil
Price $
/bbl
Gas P
rice (
$/m
cf)
Rate of Return
DRY TYPE CURVE WET TYPE CURVE

Production Mix Marcellus Locations
Natural Gas
100%
MARCELLUS SHALETHE PREMIER DOMESTIC GAS
• Growth potential in a
remarkable reservoir
• Operational excellence
• Stable free cash flow
(1) DUC: “Drilled uncompleted” wells
2016 ANALYST DAY – APPALACHIA 8
Well Status Marcellus Locations
Producing 686
DUC(1) Inventory 85
Undrilled Inventory 2,900
Remaining
Development
75%
Drilled
25%
~795,000 Net Acres in North Appalachia
>3.2 Tcf gross produced

(1) Bradford, Susquehanna, Sullivan, and Wyoming Counties PA
(2) Core and Core Expansion delineated using water saturation, porosity, permeability, pressure and thickness
2016 ANALYST DAY – APPALACHIA 9
Dominant position 92% CHK acreage HBP (1)
CHK Core OperatedPosition
CONTROL THE COREMARCELLUS
Competition
35%
CHK
65%
CHK Core(2) Core Expansion(2)
HBP 93% 88%
Gross 429,400 240,900
Net 277,400 148,000

GROWTH POTENTIAL AND FUTURE DEVELOPMENT
• Longer laterals
• Optimal completion designs
• Substantial Upper Marcellus
fairway
• Additional upside in Utica
development
(1) Optimizing future Marcellus locations to >10,000' lateral length where possible
2016 ANALYST DAY – APPALACHIA 10
Lateral LengthLocations
Remaining
Lower Marcellus Core (1) 6,000' 780
Lower Marcellus Core Expansion (1) 6,000' 620
Upper Marcellus 5,000' 1,500
Upper Marcellus Optimized (1) 10,000' ~750
~ 3
00
'
Not to Scale
Upper Marcellus
Lower Marcellus
Lateral Well
~1,200'
~1,200'
Spacing Assumptions
~1,200'

CONTINUOUS IMPROVEMENTMARCELLUS
(1) Normalized to 6,000-ft. LL
(2) Gross core operated controllable LOE (excluding Ad Val taxes and overhead)
2016 ANALYST DAY – APPALACHIA 11
$0.066
$0.047 $0.045
$0.038 $0.038 $0.035
$0.030
1.94
1.84
1.77 1.78
1.96
1.86
1.95
1.0
1.1
1.2
1.3
1.4
1.5
1.6
1.7
1.8
1.9
2.0
$0.02
$0.03
$0.04
$0.05
$0.06
$0.07
$0.08
1Q'15 2Q'15 3Q'15 4Q'15 1Q'16 2Q'16 3Q'16
Lease Operating Expense (LOE) Reduction (2)
LOE/mcfe Gross daily production (bcf/d)
Avg.
LO
E $
/m
cfe
Gro
ss d
aily
pro
duction (
bcf/
d)
$9.1 $8.7
$7.5 $7.0
$5.0
2012 2013 2014 2015 2016E
Average Well Cost ($mm) (1)
Capex:
Reduced 29% YTD
LOE:
Reduced 33% YTD

MARCELLUS PRODUCTION STRENGTH SUSTAINABLE PRODUCTION WITH MINIMAL CAPITAL
• 300 mmcf/d shut-in
˃ Produce into favorable market
• > 300 mmcf/d curtailed
˃ Available with planned wellhead
pressure reductions
• DUC focus in 2017 and 2018
> Exceptional point forward
economics
• Minimal obligations
> 11 obligatory spuds through 2018
2016 ANALYST DAY – APPALACHIA 12
Remarkable productivityMinimal capital required
Gro
ss D
aily
Pro
du
ctio
n (
mm
cf/
d)
Base Producing Wells Includes curtailed volumes
No D&C capital spend required

MARCELLUS SHALE
• Stable free cash flow
> Flat production generates significant
free cash flow
• Operational excellence
> Basin-leading performance
• Remarkable reservoir quality
> Massive Marcellus upside and
significant base strength
2016 ANALYST DAY – APPALACHIA 13
99%
Undrilled
1%
Drilled49%
Undrilled
51%
Drilled
The premier domestic basinCHK = The Core Operator
Drilled 25%
Marcellus LocationsCHK Core OperatedPosition
Competition
35% CHK
65%Remaining
Development
75%

APPALACHIA – ADVANTAGE CHESAPEAKEONE BASIN, TWO ASSETS = OUTSTANDING VALUE
2016 ANALYST DAY – APPALACHIA 14
$150
$220
$500
95 90100
0
50
100
150
200
250
300
350
400
450
500
$0
$50
$100
$150
$200
$250
$300
$350
$400
$450
$500
2016E 2017E 2018E
2016 – 2018 Projected Free Cash Flow(1,2) and Production
Production (mmboe)
Fre
e C
ash F
low
($
mm
)
Pro
du
ction
(m
mb
oe
)
(1) Assumes $3 / $48 for 2017 and $3 / $60 in 2018
(2) Free cash flow defined as net revenue less all operating, marketing and capital expenditures
(Excluding Hedges)
~$700mm In projected Appalachia FCF generation from 2017 – 2018

APPENDIX
2016 ANALYST DAY – APPALACHIA 15

WORLD-CLASS RESERVOIR QUALITYMARCELLUS SHALE
2016 ANALYST DAY – APPALACHIA 16
A prolific resourceWith near-term and long-term growth opportunity
Lower Marcellus (Core)
EUR/ft. (mcf) (1) 3,000 – 4,300
Thickness (ft.) 125 – 145
Depth (ft.) 5,200 – 6,900
Porosity (%) 6.0 – 8.5
Pressure Gradient (psi/ft.) 0.60 – 0.70
Breakeven ($) (2) 2.02
Upper Marcellus
EUR/ft. (mcf) (1) 2,200 – 3,250
Thickness (ft.) 125 – 250
Depth (ft.) 4,800 – 6,700
Porosity (%) 5.5 – 8.0
Pressure Gradient (psi/ft.) 0.55 – 0.70
Breakeven ($) (2) 2.43
Utica
Future Potential
(1) Assumes 50 psi wellhead pressure
(2) PV10 based on $4.5mm capex

2016 ANALYST DAY – APPALACHIA 17
TREMENDOUS WELL PERFORMANCECONTINUAL IMPROVEMENT THROUGH TECHNOLOGY
Improving PerformanceLonger laterals and enhanced completions
Increased PotentialWell performance outperforming expectations
0
5
10
15
20
25
100 200 300 400 500 600
Ga
s P
rod
uctio
n R
ate
, m
mcf/
d
Normalized Producing Days
Current U.Marcellus Production U. Marcellus Type Curve
Improving performance
Longer laterals and enhanced completions
0
5
10
15
20
25
30
35
100 200 300 400 500 600 700 800 900
Ga
s P
rod
uctio
n R
ate
, m
mcf/
d
Normalized Producing Days
Current L.Marcellus Production Historical Type Curve
Increased potential
Well performance outperforming expectations
Lower Marcellus optimization>$900,000 value acceleration/well
Upper Marcellus stacked payExtending asset life

NET EQUIVALENT PRODUCTION APPALACHIA: ~43% TOTAL PRODUCTION 2016E
(1) Source EIA Jul 2016 US Dry Gas Production Monthly volumes released 9/30/16 (https://www.eia.gov/dnav/ng/hist/n9070us1m.htm)
-
100
200
300
400
500
600
700
800
2013 2014 2015 2016E
mb
oe/d
Appalachia North Appalachia South Powder River South Texas
Gulf Coast Mid-Continent Central Texas Marcellus South
A p p a l a c h i a
Divested - 2014Divested - 2016
3 bcf/d gross~4% of U.S. gas production (1)
2016 ANALYST DAY – APPALACHIA 18

MARCELLUS MODELING INPUTS
100%
Production Mix
Natural Gas
0
5
10
15
20
25
30
0 12 24 36 48
Gas R
ate
(m
mcf/d)
Producing Months
Marcellus Type Curve Production Profile
Gas
2016 ANALYST DAY – APPALACHIA 19
Base Production(1)
3Q’16E Net Production 805 mmcf/d
4 Yr. Average Annual Decline(2) 24%
Gross Capex
Drilling(7) (109 days to TIL) $2.2mm
Completion (57 days to TIL) $1.9mm
TIL $0.4mm
TOTAL $4.5mm
Curve Parameters
IP(5) 28.5 mmcf/d
Decline 68.5%
B-factor 0.70
EUR(6) 17.1 bcf
Lateral Length 6,200 ft.
Interest / Gross Locations
WI / NRI(8) 48%/41%
Producing 686
DUCs 85
Undrilled(9) 2,900
Rig Count 0 – 2
2017 Expenses & Differential Estimates(1)
Production Expense(3) ($/mcf) $0.08 – $0.11
GP&T(4) ($/mcf) $0.93 – $0.97
2017 – 2020 Blended Development Program
(1) Applies to total asset inclusive of non-operated
(2) Compound Annual Decline from 7/2016 – 6/2020
(3) Reflects net asset level production expense including LOE, overhead and Ad Val
(4) Excludes all intercompany marketing fees
(5) 30 day average IP
(6) Assumes 600psi
(7) 13 days spud to spud
(8) Assumed until well proposed
(9) All potential locations, not necessarily all drilled by 2020

UTICA DRY MODELING INPUTS
100%
Production Mix
Natural Gas
0
3
6
9
12
15
18
0 12 24 36 48
Gas R
ate
(m
mcf/d)
Producing Months
Utica Dry Type Curve Production Profile
Gas
2016 ANALYST DAY – APPALACHIA 20
Base Production(1)
3Q’16E Net Production 85 mmcf/d
4 Yr. Average Annual Decline(2) 26%
Gross Capex
Drilling(6) (93 days to TIL) $3.1mm
Completion (39 days to TIL) $2.4mm
TIL $0.5mm
TOTAL $6.0mm
Curve Parameters
IP(5) 16.2 mmcf/d
Decline 67%
B-factor 1.25
EUR 16.9 bcf
Lateral Length 10,500 ft.
Interest / Gross Locations
WI / NRI(7) 89%/73%
Producing 40
DUCs 25
Undrilled(8) 370
Rig Count 0 – 1
2017 Expenses & Differential Estimates(1)
Production Expense(3) ($/mcf) $0.16 – $0.20
GP&T(4) ($/mcf) $1.00 – $1.10
2017 – 2020 Blended Development Program
(1) Applies to total asset inclusive of non-operated
(2) Compound Annual Decline from 7/2016 – 6/2020
(3) Reflects net asset level production expense including LOE, overhead and Ad Val
(4) Excludes all intercompany marketing fees
(5) 30 day average IP
(6) 15 days spud to spud
(7) Assumed until well proposed
(8) All potential locations; not necessarily all drilled by 2020

UTICA WET MODELING INPUTS
0
100
200
300
400
500
600
700
0
1000
2000
3000
4000
5000
6000
7000
8000
0 12 24 36 48
Oil
& N
GL R
ate
(bbl/d)
Gas R
ate
(m
cf/
d)
Producing Months
Utica Wet Type Curve Production Profile
Gas Oil NGLs
2016 ANALYST DAY – APPALACHIA 21
6%
64%
30%
Production Mix
Oil Natural Gas NGL
Base Production(1)
3Q’16E Net Production 110 mboe/d
4 Yr. Average Annual Decline(2) 25%
Gross Capex
Drilling(6) (105 days to TIL) $2.4mm
Completion (51 days to TIL) $2.5mm
TIL $0.6mm
TOTAL $5.5mm
Curve Parameters
IP(5) (Oil / Gas) 275 bbl/d / 7.4 mmcf/d
Decline (Oil / Gas) 80%/66%
B-factor (Oil / Gas) 0.64/1.50
Shrink 90%
NGL Yield 71 bbl/mmcf
EUR 2.0 mmboe
Lateral Length 9,000 ft.
Interest / Gross Locations
WI / NRI(7) 67%/54%
Producing 600
DUCs 30
Undrilled(8) 790
Rig Count 1 – 4
2017 Expenses & Differential Estimates(1)
Production Expense(3) ($/boe) $1.02 – $1.12
GP&T(4) ($/boe) $8.50 – $9.50
(1) Applies to total asset inclusive of non-operated
(2) Compound Annual Decline from 7/2016 – 6/2020
(3) Reflects net asset level production expense including LOE, overhead and Ad Val
(4) Excludes all intercompany marketing fees
(5) 30 day average IP
(6) 12 days spud to spud
(7) Assumed until well proposed
(8) All potential locations; not necessarily all drilled by 2020
2017 – 2020 Blended Development Program

FRANK PATTERSON

EXPLORING FOR THE FUTURE
Current Exploration Opportunities
11 new basin-entry plays
15 growth opportunities in
CHK-operated basins
17 prospects adding value
to current HBP position
2016 ANALYST DAY – EXPLORATION 2
• Unmatched subsurface data with in-house expertise
• Petroleum systems approach generating innovative play concepts
• Building inventory of stacked play opportunities

WE ARE UNCONVENTIONAL EXPERTS
2016 ANALYST DAY – EXPLORATION 3
Seismic inventory3D: 96,000 square mi.
2D: 328,000 mi.
Current acreage~7.0 million net acres
In-house core65,000 ft. analyzed
Data leaders2.5 million well logs
Horizontal experts>11,000 horizontals drilled
CHK core labAccelerates
exploration value

CHK VALUE REALIZATIONANALYSIS TO IMPLEMENTATION IN MONTHS NOT YEARS
2016 ANALYST DAY – EXPLORATION 4
VA
LU
E

1,600,000 ACRES – CHK ADVANTAGEROME TROUGH
• Multi-zone stacked potential
˃ ~1 to 4.5 bboe recoverable in
single zone
• 1.4mm acres HBP/minerals
˃ Two vertical core wells drilled
• Competitors de-risking around
CHK HBP position
• Access to Gulf Coast markets
2016 ANALYST DAY – EXPLORATION 5
Oil-prone source rock and stacked reservoirs
Target A Target BOil-saturated
reservoir
Target BHydrocarbon
fluorescence
65% of acreageIn liquids window

IT’S NOT ALL ABOUT SHALE
2016 ANALYST DAY – EXPLORATION 6
Conventional sands:
Red Fork, Springer
Source rock plays:
Eagle Ford, Haynesville
Low-perm clastics:
Sussex, Turner
Low-perm carbonate plays:
Oswego
Mixed clastic/
carbonate plays:
Meramec
Fractured plays:
Austin Chalk
Our Future is Stacked!
Petroleum system-
based approach opens
new stacked potential.
Industry first focused on
basin-extensive source rocks.
Then moved toward hybrid
source rock plays.

FRANK PATTERSON

MID-CONTINENT IS NOT WHAT YOU REMEMBER
• Shift from historical plays to new
concepts and formations
• Substantial NAV value
• Legacy acreage position offers
extensive opportunity
• Oswego – a bridge to oil
production growth
• Actively exploiting “The Wedge”
opportunity
2016 ANALYST DAY – MID-CONTINENT 2
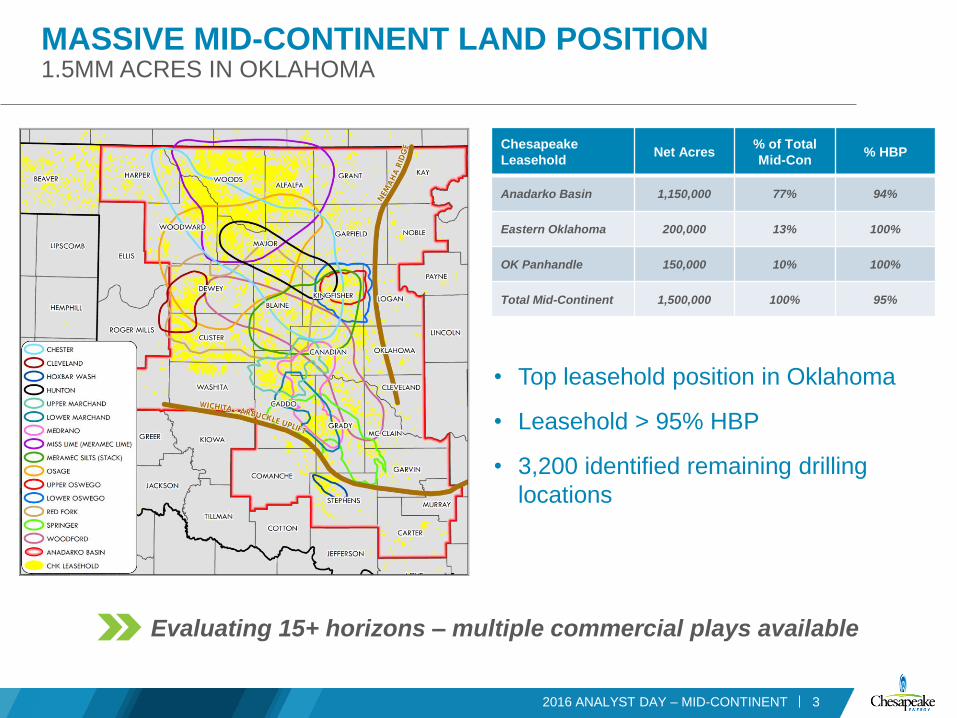
~1.5mm Net Acres in Mid-Continent
3 – 4 rigsActive in 2017
Chesapeake
LeaseholdNet Acres
% of Total
Mid-Con% HBP
Anadarko Basin 1,150,000 77% 94%
Eastern Oklahoma 200,000 13% 100%
OK Panhandle 150,000 10% 100%
Total Mid-Continent 1,500,000 100% 95%
MASSIVE MID-CONTINENT LAND POSITION1.5MM ACRES IN OKLAHOMA
32016 ANALYST DAY – MID-CONTINENT
• Top leasehold position in Oklahoma
• Leasehold > 95% HBP
• 3,200 identified remaining drilling
locations
Evaluating 15+ horizons – multiple commercial plays available

NAV CONTINUES TO GROW
(1) Jan 2015 average of seven analysts who provided breakout of total development value remaining in CHK’s Mid-Continent asset
(2) Internal valuation based on $3/mcf gas and $60/bbl oil price flat
2016 ANALYST DAY – MID-CONTINENT 4
Jan 2015 Market Valuation (1)
Jan 2016CHK Valuation (2)
2016 Divestitures
Jan 2016 Value(Post-Divestitures)
Jul 2016 CHK Valuation (2)
Identified Exploratory
Upside
$-
$1
$2
$3
$4
Net A
sse
t V
alu
e (
PV
10
$b
illio
n)
New
Mid-Con
Valued at $2.8 billion after $1.0 billion in 2016 asset sales

71%
12% 17%
Oil NGL Natural Gas
OSWEGO DELIVERING IMPRESSIVE RESULTS
2016 ANALYST DAY – MID-CONTINENT 5
40 MILES
Lightle 4-18-6 1H
IP 30 = 1,098 bo/dIP 30 = 1,235 boe/d
Hasty 3-18-6 1H
IP 30 = 897 bo/dIP 30 = 1,033 boe/d
Caldwell 22-18-6 1H
IP 30 = 1,447 bo/dIP 30 = 1,813 boe/d
Themer 6-17-6 1H
IP 30 = 717 bo/dIP 30 = 832 boe/d
Hughes Trust 33-18-7 1H
IP 30 = 1,257 bo/dIP 30 = 1,326 boe/d
40 M
ILE
S
Farrar 11-18-6 1H
IP 30 = 727 bo/dIP 30 = 852 boe/d
$3.0mm/wellDevelopment cost
~400 mboe EUR83% liquid, average WI 53%

THE OSWEGO TRANSFORMATIONUNLOCKING VALUE THROUGH RAPID OPTIMIZATION
6
(1) Price deck: $3/mcf and $60/bbl flat
2016 ANALYST DAY – MID-CONTINENT
Well deliverability
increased by
140%
Total well capex
reduced by
19%
Single-well returns
across the play of
170%
100 locations at 170% ROR and 200 upside locations
0
20
40
60
0 25 50 75 100
Cum
ula
tive P
roduction (
mbo)
Increasing Performance
$0
$2
$4
$6
Tota
l W
ell
Capex (
$m
m)
Decreasing Costs
Type Curve
19% reduction
0%
100%
200%
300%
RO
R
Transformational Returns (1)
Gen 1 Completion
Type Curve
CHK Gen 2 Completion CHK Gen 3 CompletionType Curve

0
5
10
15
20
25
30
35
01/2016 07/2016 01/2017 07/2017
Gro
ss O
pe
rate
d P
rod
uctio
n (
mb
oe
/d)
OSWEGO DELIVERING TREMENDOUS GROWTH
72016 ANALYST DAY – MID-CONTINENT
Gen 3 Completion
Type Curve Performance
1 Rig 2 Rigs
High-volume, low-cost production quick to market

MISS LIME CONTINUES TO DELIVERTREMENDOUS FUTURE OPTIONALITY
Transformational strategy
• Shift from statistical to technical field
development approach
• New wells selected on basis of improved
subsurface technical understanding
• Targeted completion design improves
oil-to-water cut
(1) Price deck: $3/mcf for gas and $60/bbl oil flat
2016 ANALYST DAY – MID-CONTINENT 8
Abundant potential development
• 300 development wells with >50% ROR (1)
• 700 incremental upside inventory
0%
15%
30%
45%
0
200
400
600
2014Q4
2015Q1
2015Q2
2015Q3
2016Q2
Oil
Cut
%
Oil
IP-3
0 (
bo/d
)
Average Oil Oil Cut
1Q’15 2Q’15 3Q’15 2Q’16
Statistical
Approach
Technical
Approach
4Q’14Miss Lime Play
~425 mmboe
Produced to Date

THE WEDGE PLAYPROLIFIC OIL-RICH RESERVOIRS
9
The Wedge PlayA geologically defined area in NW Oklahoma
that is comprised of six oil-rich stacked
reservoirs under current industry development.
Wedge Play Cross Section Schematic
2016 ANALYST DAY – MID-CONTINENT
Miss Lime Play
~425 mmboe
Produced to Date
~150 miles
150-mile fairway of stacked pay
NORTH

Sharon 31-27-11 1H
IP: 2,062 boe/d
Anderson 1206 1-33WH
IP: 745 boe/d
Governor James B. Edwards
IP 30: 1,684 boe/d
Whistle Pig 10-4AH
IP 30: 719 boe/d
Ward 21-1H
IP: 596 boe/d
McCray 2414 1-10H/15H
IP: 1,267 boe/d
Howard 5-19-17 1H
IP: 2,454 boe/d
School Land 1-36H
IP 30: 1,353 boe/d
THE WEDGE PLAYCHESAPEAKE’S FUTURE MID-CONTINENT GROWTH ASSET
(1) Location counts exclude Miss Lime locations
(2) Price deck: $3/mcf for gas and $60/bbl oil flat
102016 ANALYST DAY – MID-CONTINENT
• ~870,000 net acres
˃ 94% HBP
• Robust economics
˃ ~500 locations at 50% ROR (1,2)
• Significant running room
˃ ~1,400 additional upside locations
• Efficient capital spend
˃ Industry actively de-risking plays
New Wedge step-out test
1,073 boe/d (51% oil)One-mile lateral with opportunity
for two-mile development
Strong economics – large land position

0
20
40
60
80
100
120
140
06/2016 06/2017 06/2018 06/2019 06/2020
Gro
ss O
pe
rate
d P
rod
uctio
n, m
bo
e/d
Oswego Oswego Gen 3 Completion Miss Lime Development Wedge Development
11
Development model only reflects the first 100 Oswego locations
MID-CON GROWTH ENGINESCALABLE GROWTH FROM OSWEGO AND THE WEDGE
2016 ANALYST DAY – MID-CONTINENT
1 – 4 Rigs 4 – 8 Rigs

The Wedge PlayA geologically defined area in
NW Oklahoma that is comprised of
six oil-rich stacked reservoirs under
current industry development.
MOST UNDERVALUED ROCK IN THE U.S.
• Current value of $2.8 billion plus upside
• 1.5 million acres – 95% HBP
• Oswego generating industry-leading economics
• 500 Wedge locations with 50% ROR (1)
• Evaluating 15+ horizons for future growth
• Legacy acreage position allows de-risking through
competitor activity
(1) Price deck: $3/mcf for gas and $60/bbl oil flat
2016 ANALYST DAY – MID-CONTINENT 12

APPENDIX
2016 ANALYST DAY – MID-CONTINENT 13

NET EQUIVALENT PRODUCTION MID-CONTINENT: ~11% TOTAL PRODUCTION 2016E
-
200
400
600
800
2013 2014 2015 2016E
mb
oe
/d
Appalachia North Appalachia South Powder River South Texas
Gulf Coast Mid-Continent Central Texas Marcellus SouthDivested - 2014Divested - 2016
142016 ANALYST DAY – MID-CONTINENT

OSWEGO MODELING INPUTS
70%
17%
13%
Production Mix
Oil Natural Gas NGL
0
100
200
300
400
500
600
700
800
0
100
200
300
400
500
600
700
800
0 12 24 36 48
Oil
and N
GL R
ate
(bbl/d)
Gas R
ate
(m
cf/
d)
Producing Months
Oswego Type Curve Production Profile
Gas Oil NGLs
2016 ANALYST DAY – MID-CONTINENT 15
Base Production(1)
3Q’16E Net Production 3 mboe/d
4 Yr. Average Annual Decline(2) 33%
Gross Capex
Drilling(6) (32 days to TIL) $1.4mm
Completion (17 days to TIL) $0.7mm
TIL $0.9mm
TOTAL $3.0mm
Curve Parameters
IP(5) (Oil / Gas) 600 bbl/d / 700 mcf/d
Decline (Oil / Gas) 85.5%/79%
B-factor (Oil / Gas) 1.30/1.30
Shrink 85%
NGL Yield 110 bbl/mmcf
EUR 393 mboe
Lateral Length 4,800 ft.
Interest / Gross Locations
WI / NRI(7) 53%/42%
Producing 15
DUCs 2
Undrilled(8) 300
Rig Count 1 – 2
2017 Expenses & Differential Estimates(1)
Production Expense(3) ($/boe) $3.80 – $4.20
GP&T(4) ($/boe) $5.75 – $5.95
2017 – 2020 Blended Development Program
(1) Applies to total asset inclusive of non-operated
(2) Compound Annual Decline from 7/2016 – 6/2020
(3) Reflects net asset level production expense including LOE, overhead and Ad Val
(4) Excludes all intercompany marketing fees
(5) 30 day average IP
(6) 10 days spud to spud
(7) Assumed until well proposed
(8) All potential locations; not necessarily all drilled by 2020

WEDGE AND MISS LIME MODELING INPUTS
34%
44%
22%
Production Mix
Oil Natural Gas NGL
0
50
100
150
200
250
300
350
400
0
200
400
600
800
1000
1200
1400
1600
1800
0 12 24 36 48
Oil
and N
GL R
ate
(bbl/d)
Gas R
ate
(m
cf/
d)
Producing Months
The Wedge Type Curve Production Profile
Gas Oil NGLs
2016 ANALYST DAY – MID-CONTINENT 16
Base Production(1)
3Q’16E Net Production 52 mboe/d
4 Yr. Average Annual Decline(2) 13%
Gross Capex
Drilling(6) (41 days to TIL) $2.0mm
Completion (18 days to TIL) $1.3mm
TIL $0.6mm
TOTAL $3.9mm
Curve Parameters
IP(5) (Oil / Gas) 380 bbl/d / 1.7 mmcf/d
Decline (Oil / Gas) 83%/64%
B-factor (Oil / Gas) 1.20/1.30
Shrink 87%
NGL Yield 72 bbl/mmcf
EUR 658 mboe
Lateral Length 5,400 ft.
2017 Expenses & Differential Estimates(1)
Production Expense(3) ($/boe) $6.75 – $7.35
GP&T(4) ($/boe) $5.75 – $5.95
(1) Applies to total asset inclusive of non-operated
(2) Compound Annual Decline from 7/2016 – 6/2020
(3) Reflects net asset level production expense including LOE, overhead and Ad Val
(4) Excludes all intercompany marketing fees
(5) 30 day average IP
(6) 18 days spud to spud
(7) Assumed until well proposed
(8) All potential locations; not necessarily all drilled by 2020
Interest / Gross Locations
WI / NRI(7) 61%/49%
Producing 3,485
DUCs 45
Undrilled(8) 2,900
Rig Count 3 – 10
2017 – 2020 Blended Development Program

JASON PIGOTT

Operations Services
Drilling
Completions

CHESAPEAKE’S COMPETITIVE ADVANTAGE
2016 ANALYST DAY – OPERATIONS & TECHNICAL SERVICES 3
2.5mmWell logs
65,000 ft.Analyzed core
150mmGPS readings
26,000Producing wells
120mm ft. Drilled
70 trillionSensor data points
96,000 square mi.3D seismic
Option 1
Industry-Leading Operations Support
• 24x7 real-time monitoring
• Advanced processing technology
˃ High-volume, high-variety, high-velocity data analytics
• Collaborative environment
˃ Engineering, geology and technology expertise
Superior Well Data

BETTER PLANNING REDUCES TROUBLE TIME
• Better well planning and continuous
monitoring dramatically reduce trouble time
• Well road maps predict problems before
they happen
• Collaborative culture improves response
time when unanticipated challenges occur
2016 ANALYST DAY – OPERATIONS & TECHNICAL SERVICES 4
0
50
100
150
200
250
300
350
400
2014 2015 2016E
2014 2015 2016ETrouble Time (hours) / 100,000 ft.
~116 days per yearEfficiency gain
$14mmIncremental value generated
in 2016E

80%
85%
90%
95%
100%
5,000
5,500
6,000
6,500
7,000
7,500
8,000
8,500
9,000
2014 2015 2016 YTD
Avg. Lateral Length % Drilled in Zone
MAINTAINING TARGET ACCURACY IN LONGER LATERALS
• Continuous monitoring maintains
targeting accuracy
• Minimizes impact on well recovery
when drilling longer laterals
2016 ANALYST DAY – OPERATIONS & TECHNICAL SERVICES 5
14' – 50'Typical target window
~45%Longer laterals
~95%In-zone

Operations Services
Drilling
Completions

Value creation through
the drill bit
Operations Support Center
Simulation Software
Geologic Steering
Field Operations
Drilling Technology
Supply Chain
EHS
CHESAPEAKE DRILLING PREDICTABLE, REPEATABLE, PERFORMANCE LEADER
2016 ANALYST DAY – OPERATIONS & TECHNICAL SERVICES 7
Leading horizontal driller worldwide>11,000 wells drilled
CHK drilled around the world –
footage drilled in the last 10 years
The Chesapeake Drilling Advantage
• Extensive extra-long-lateral experience
• State-of-the-art real-time operations center
• Repeatable and sustained performance
• Industry-leading health and safety record

DRILLING COMPETITIVE ADVANTAGES10 RIGS IS THE NEW 35 RIGS AT CHESAPEAKE
2016 ANALYST DAY – OPERATIONS & TECHNICAL SERVICES 8
45% – 113% gainIn lateral footage drilled per rig
Drilled more lateral footage in first nine months of 2016 than all of 2015
• Maximize capital efficiency
• Less capital intensity
• Smaller surface footprint
36 24
101
65
41 48
160
7353
44
186200
8193
268
377
89%
Lateral Footage Drilled Per Rig (1,000 ft.)
Haynesville Mid-Con Utica South Texas
2013
2014
2015
2016E
113%
45%
53%

Source: Bloomberg, September 2016
EAGLE FORD SHIFT TO LONGER LATERALSA CRUCIAL VALUE-CREATION DECISION
2016 ANALYST DAY – OPERATIONS & TECHNICAL SERVICES 9
0
2,000
4,000
6,000
8,000
Chesapeake Anadarko Conoco Devon EOG EP Energy Marathon
2013 2014 2015 2016
'
'
'
'
CHK APC COP DVN MROEPEEOG
Average Lateral Length (ft.)

Operations Services
Drilling
Completions

SUPERIOR OPERATIONAL EFFICIENCIES EAGLE FORD SHALE
2016 ANALYST DAY – OPERATIONS & TECHNICAL SERVICES 11
Single-Day
Record
2017E Avg.
2016 YTD Avg.
2015 Avg.
2014 Avg.
2013 Avg.
Multiwell Frac1 frac crew + 2 wireline crews
19 stages/day
Single Well Frac1 frac crew + 1 wireline crew
6 – 8 stages/day
Dual Well Frac1 frac crew + 1 wireline crew
8 – 13 stages/day
Stages/DayChasing Perfection
Continuing to break
efficiency records

Producing Days
Cum
ula
tive
Pro
du
ctio
n
Proven Results from Optimization
HAYNESVILLE COMPLETION OPTIMIZATIONIT’S A WHOLE NEW BALL GAME
2016 ANALYST DAY – OPERATIONS & TECHNICAL SERVICES 12
Vintage≥1,500 lbs./ft.Pre 2012
Modern≥1,750 lbs./ft.2015
Prop-a-geddon≥3,000 lbs./ft.Current
Unlocking additional opportunities and expanding
the core with completion technology
Vintage Modern Prop-a-geddon
$1.21/mcf
$0.47/mcf
$0.28/mcf
More Productivity for Your DollarGross Completions Capital / Gross EUR
70%Overall production increase from
Vintage to Prop-a-geddon
76%Overall $/boe improvement
from Vintage to Prop-a-geddon

Producing Days
Cum
ula
tive
Pro
du
ctio
n
Dramatic Performance ImprovementTransformative Capital EfficiencyGross Completions Capital / Gross EUR
Gen 1 Gen 2 Gen 3
$6.34/boe
$4.12/boe
$2.37/boe
OSWEGO COMPLETION OPTIMIZATIONMORE SAND ISN’T ALWAYS THE ANSWER
2016 ANALYST DAY – OPERATIONS & TECHNICAL SERVICES 13
Generation 1Propped fracUncemented sleeves4Q’14 – 1Q’15
Generation 2Diverting acid fracUncemented sleeves1Q’16 – 3Q’16
Generation 3Large volume acid fracModified well design2Q’16 – Present
Next GenerationLarge volumeOptimized acid fracModified well design
Optimizing completion design adds significant value
63%Overall $/boe improvement
from Gen 1 to Gen 3
140%Overall production increase
from Gen 1 to Gen 3

PROVEN RESULTS LEAD TO HUGE SUCCESS
2016 ANALYST DAY – OPERATIONS & TECHNICAL SERVICES 14
$557/ft.$529/ft.
$463/ft.
$278/ft.
0
100
200
300
400
500
600
2013 2014 2015 2016 YTD
Completions Cost per Foot
50% reductionIn completion cost per foot since 2013
~$1.8 billion savedTotal gross cost savings since 2013

DELIVERING VALUE THROUGH STANDARDIZATION, PLANNING AND DESIGN
2016 ANALYST DAY – OPERATIONS & TECHNICAL SERVICES 15
15
• Decreasing construction costs
• Reducing cycle time
• Improving quality
• Driving continuous improvement
Drilling and
Completions
Field Fabrication Turn-in-line (TIL)
Standard Surface Construction Operations Concurrent Surface Construction Activities
Drilling and
Completions
Shop Fabrication
Turn-in-line (TIL)
0%
10%
20%
30%
40%
50%
60%
70%
80%
90%
100%
2012 2013 2014 2015 2016 YTD
Per-Well Equipment Costs (1)
Eagle Ford
Haynesville
(1) Base year 2012 equipment costs of $727,000 for Eagle Ford and $365,000 for Haynesville
50% – 80% reductionIn equipment costs

0
0.5
1
1.5
2
2.5
3
3.5
4
Cum
. m
mboe A
bove F
ore
cast
2017E
10% Downtime Reduction
10% Base Decline Reduction
1.9 mmboe
2.0 mmboe
BASE OPTIMIZATION
2016 ANALYST DAY – OPERATIONS & TECHNICAL SERVICES 16
3.9 mmboePotential uplift in 2017 from
downtime and decline reduction Opportunity
Artificial Lift
60%
Flowing
40%
Optimization

EAGLE FORD ARTIFICIAL LIFT INSTALLS
Proactive artificial lift program
• Anticipates well needs
• Reduces suboptimal
performance
• Reduces downtime
• Improves supply chain
efficiencies
Proactive well set begins January 2014
2016 ANALYST DAY – OPERATIONS & TECHNICAL SERVICES 17
0
40
80
120
160
200
-150
-141
-132
-123
-114
-105
-96
-87
-78
-69
-60
-51
-42
-33
-24
-15 -6 4
13
22
31
40
49
58
67
76
85
94
103
112
121
130
139
148
Oil
Rate
(bopd)
Days Before Installation Days After Installation
Legacy Approach
0
40
80
120
160
200-1
50
-141
-132
-123
-114
-105
-96
-87
-78
-69
-60
-51
-42
-33
-24
-15 -6 4
13
22
31
40
49
58
67
76
85
94
103
112
121
130
139
148
Oil
Rate
(bopd)
Days Before Installation Days After Installation
Proactive Approach

JASON PIGOTT

SOUTH TEXAS ASSET OVERVIEWUNDRILLED ACREAGE, POSITIONED FOR GROWTH
(1) Net processed production mix
• Secure acreage position
• Best-in-class operations
• Extended laterals are working
• Broad investment portfolio
56%19%
25%
Production Mix (1)
Oil NGL Natural Gas
2016 ANALYST DAY – SOUTH TEXAS 2
~270,000 Net Acres in Eagle Ford – 99% HBP/ HBO
Locations
Remaining
Development
75%
Drilled
25%
Upper Eagle Ford
1,000
Austin Chalk
1,000
Lower Eagle Ford
3,260

SOUTH TEXAS EXTENDED LATERALSDRIVING CHESAPEAKE’S COMPETITIVE COST ADVANTAGE
(1) Completed lateral length based on frac date; includes 142 DUC locations with an average of 7,089 feet
(2) Average cost per foot of wells drilled and/or completed within the time period.
Extended laterals today
OutperformAt $50 oil vs. 2014 program
at $80 oil
Retain 65% Cost savings captured
from efficiencies,
not market reductions
63% reductionIn development cost per
foot with 79% increase in
drilled lateral
5,830 5,846 6,2487,538
10,117
2013 2014 2015 2016E 2017E
Completed Lateral Length, ft. (1)
$1,207$1,011
$866
$480 $435
2013 2014 2015 2016E 2017E
Total Well Cost per Lateral Foot (2)
$6.4$5.4
$4.6
$2.5 $2.3
2013 2014 2015 2016E 2017E
Total Well Cost, Normalized to 5,300' Lateral ($mm)
2016 ANALYST DAY – SOUTH TEXAS 3

2016 Performance Records
• Eight days spud to rig release –
for 17,446' total well depth
• 5,837' – 24-hour footage record
• $65/ft. drilling cost – lowest monthly average
• 14,289' – single-well record lateral length
$2.1 $2.1
$1.7$1.5
$1.4
$1.6
2Q'15 3Q'15 4Q'15 1Q'16 2Q'16 3Q'16
Drilling Cost, $mm (1)
6,108'
7,965'8,776'
9,213' 9,478'
10,910'
2Q'15 3Q'15 4Q'15 1Q'16 2Q'16 3Q'16
Lateral Length, ft. (1)
DRILLING PERFORMANCERELENTLESSLY PURSUING EXCELLENCE
2016 ANALYST DAY – SOUTH TEXAS 4
(1) Drilled lateral length and drilling cost based on spud date

COMPLETION PERFORMANCERELENTLESSLY PURSUING EXCELLENCE
2016 ANALYST DAY – SOUTH TEXAS 5
2016 Performance Records
• 16 stages completed in a single day
• 284 stages in one month with one crew
• 757 stages in a single quarter with
one crew
2016 Testing Focus
• Reinvesting $12mm into 38
completions tests YTD
• Applying optimal completion
design from test results to deliver
incremental value
49% reductionIn cost per lateral foot without sacrificing
well performance
$478 $451
$429
$313
$264 $246
0
400
800
1,200
1,600
2,000
$0
$100
$200
$300
$400
$500
$600
2Q'15 3Q'15 4Q'15 1Q'16 2Q'16 3Q'16
Pro
ppant, lbs./ft
.
Gro
ss $
/ft.
Completion Cost Proppant

CONTINUOUS FOCUS ON REDUCING LOE LOW-COST LEADER
(1) Data represents operated net lease production expenses excluding Ad Valorem taxes / net equivalent volume
(2) Peer group includes CRZO, DVN, EOG, MRO and MUR, data is sourced from public data bases and IR materials
17% reduction in LOELifted well count increase
5X since 2013
40% belowAverage peer group LOE
$3.62 $4.00$4.81
$6.17$6.85
$8.46
CHK A B C D E
Basin LOE Pacesetter, $/boe (2)
2016 ANALYST DAY – SOUTH TEXAS 6
$4.36
$4.15$4.09
$3.62
$3.80
-200
100
400
700
1,000
1,300
$3.00
$3.50
$4.00
$4.50
$5.00
2013 2014 2015 2016E 2017E
LOE, $/boe Lifted Well Count(1)

0
200
400
600
800
1,000
1,200
1,400
1,600
1,800
$2.0 $3.0 $4.0 $5.0 $6.0 $7.0
Pro
du
ction
IP
(b
oe
/d)
Well Cost ($mm)
Well Cost vs. Production IP (1)
Lazy A Cotulla G 4H
LL: 10,547' Lazy A Cotulla G 5H
LL: 10,563'
Lazy A Cotulla G 3H
LL: 10,523' Valley Wells C 6H
LL: 9,180'
Valley Wells C 4H
LL: 9,778'
2016: 6,500' TC laterals
2016: 10,000' TC laterals
2014: 5,000' TC laterals
2015: 6,500' TC laterals
TRANSFORMING THE LOWER EAGLE FORDEXTENDED LATERALS UNLOCK VALUE IN LOW PRICE ENVIRONMENT
(1) Assumes $3/mcf gas price flat
2016 ANALYST DAY – SOUTH TEXAS 7
Extended Lateral Wells (>9,000')
Avg. Extended Lateral Performance
10,000' Lateral Type Curve
5,000' Lateral Type Curve
-$5.0
-$4.0
-$3.0
-$2.0
-$1.0
$0.0
$1.0
$2.0
0 1 2 3 4 5
Cumulative 10% Discounted Cash Flow, $(mm)
Two 5,000' Laterals Single 10,000' Lateral
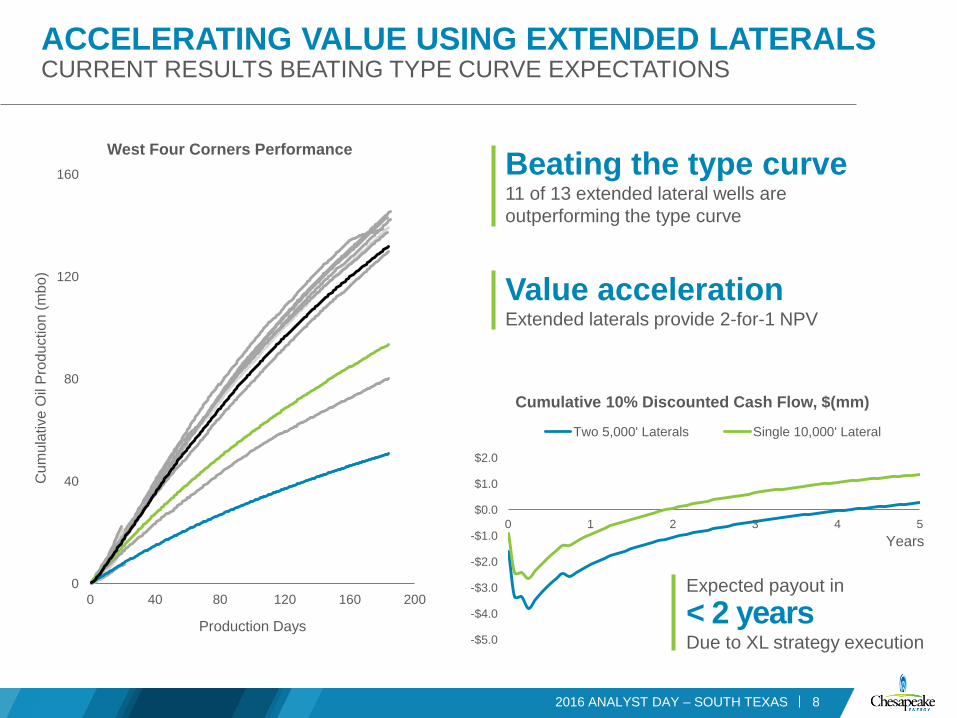
ACCELERATING VALUE USING EXTENDED LATERALSCURRENT RESULTS BEATING TYPE CURVE EXPECTATIONS
Beating the type curve11 of 13 extended lateral wells are
outperforming the type curve
Expected payout in
< 2 yearsDue to XL strategy execution
0
40
80
120
160
0 40 80 120 160 200
Cu
mu
lative
Oil
Pro
du
ction
(m
bo)
Production Days
West Four Corners Performance
Value accelerationExtended laterals provide 2-for-1 NPV
Years
2016 ANALYST DAY – SOUTH TEXAS 8

12%
26%
82%
92%
2014 2015 2016 2017E
Extended Laterals as a Percentage of Program
SOUTH TEXAS LATERAL LENGTH EVOLUTIONCOMMITTED TO THE STRATEGY
92%Of laterals drilled in 2017
will be greater than 7,500'
2016 ANALYST DAY – SOUTH TEXAS 9

0
5
10
15
20
25
Jan-17 Apr-17 Jul-17 Oct-17 Jan-18 Apr-18 Jul-18 Oct-18
Cu
mu
lative
Gro
ss O
il, m
mb
o
Three-rig planned extended lateral program Three-rig theoretical 5,000' program
SOUTH TEXAS EXTENDED LATERAL PROGRAMIMPACT ON 2017 WEDGE PRODUCTION
+9.8 mmboOil volume increase from 2017
extended lateral investment
vs. basin standard lateral
2016 ANALYST DAY – SOUTH TEXAS 10

2016 DUC PROGRAMFRAC-A-PALOOZA
53
24
65
Well Count and Location
Dimmit Volatile Oil
Dimmit Black Oil
McMullen Black Oil
142 wellsCompleted and turned in
line in 2016
0
1
2
3
4
5
6
Jan-16 Apr-16 Jul-16 Oct-16
Net C
um
ula
tive O
il, m
mbo
Program Impact
13 mbo/dNet annualized production
73% Program ROR at
$3/$50 pricing
1 millionFeet of lateral treated
2016 ANALYST DAY – SOUTH TEXAS 11

WELL POSITIONED TO GROW
2016 ANALYST DAY – SOUTH TEXAS 12
0
5
10
15
20
25
30
35
0
50
100
150
200
250
300
2011 2012 2013 2014 2015 2016 2017 2018
Gro
ss R
ig C
oun
t
Gro
ss O
pera
ted
Pro
du
ction
, m
boe
/d
2011 2012 2013 2014 2015 2016E 2017E 2018E
2016ERig Count 2011 2012 2013 2014 2015 2016E 2018E2017E

MASSIVE UNTAPPED RESOURCE POTENTIAL
>28 bboeGross total resource
OIP on CHK acreage
0.3 bboeGross produced from
CHK acreage
>3.6 bboeEstimated gross
undeveloped resource
2016 ANALYST DAY – SOUTH TEXAS 13
AUSTIN CHALK
UPPER EAGLE FORD
LOWER EAGLE FORD
SHALLOW GROWTH TARGETS
Buda
Lower Eagle Ford
Upper Eagle Ford
Austin Chalk
San Miguel
Olmos
Escondido
Wilcox

Company D
IP: 808 boe/d / 55% oil
LL': 5,300
MULTIZONE DEVELOPMENT POTENTIALAREAS OF INTEREST AND COMPETITOR ACTIVITY
ASTN Chalk Transition
18 wells
LEGFD Stacked
102 wells
Lower
Eagle Ford
Wellbores
UEGFD
142 wells
2016 ANALYST DAY – SOUTH TEXAS 14
Company A
IP: 975 boe/d / 48% oil
LL': 5,450
Company C
IP: 672 boe/d / 64% oil
LL': 5,700
Company A
IP: 692 boe/d / 70% oil
LL': 6,700
Company B
IP: 495 boe/d / 90% oil
LL': 5,600
Company A
IP: 692 boe/d / 70% oil
LL': 6,700
Company B
IP: 495 boe/d / 90% oil
LL': 5,600
Company D
IP: 808 boe/d / 55% oil
LL': 5,300
Company A
IP: 975 boe/d / 48% oil
LL': 5,450
Company C
IP: 672 boe/d / 64% oil
LL': 5,700
Lower
Eagle Ford
Transition
Upper
Eagle Ford
Austin
Chalk

Buda
Lower Eagle Ford
Upper Eagle Ford
Austin Chalk
San Miguel
Olmos
Escondido
Wilcox
SOUTH TEXAS STAYING POWER
(1) Based on five rigs and 36 wells/rig
(2) Value estimate is gross and undiscounted based on remaining 3,200 Lower Eagle Ford locations and 5,200 South Texas locations
~30 years of drilling (1)
• >5,200 undrilled locations
• >3,200 high-confidence Lower Eagle Ford locations
• >1,700 strong ROR locations
$13.2 billionFuture development costs eliminated (2016 vs. 2014) (2)
>3.6 bboeEstimated gross undeveloped resources
Culture of excellence• Relentless focus on capital efficiencies
• Commitment to test new concepts and technologies
• Striving to be the low-cost operator
• Leverage existing acreage and infrastructure
• Safety culture and environmental stewardship champion
2016 ANALYST DAY – SOUTH TEXAS 15

APPENDIX
2016 ANALYST DAY – SOUTH TEXAS 16

NET EQUIVALENT PRODUCTION SOUTH TEXAS: ~15% TOTAL PRODUCTION 2016E
-
100
200
300
400
500
600
700
800
2013 2014 2015 2016E
mb
oe
/d
Appalachia North Appalachia South Powder River South Texas
Gulf Coast Mid-Continent Central Texas Marcellus SouthDivested - 2014Divested - 2016
2016 ANALYST DAY – SOUTH TEXAS 17

SOUTH TEXAS MODELING INPUTS
2016 ANALYST DAY – SOUTH TEXAS 18
59%24%
17%
Production Mix
Oil Natural Gas NGL
0
100
200
300
400
500
600
700
0
200
400
600
800
1000
0 12 24 36 48
Oil
and N
GL R
ate
(bbl/d)
Gas R
ate
(m
cf/
d)
Producing Months
Eagle Ford Type Curve Production Profile
Gas Oil NGL
Base Production(1)
3Q’16E Net Production 101 mboe/d
4 Yr. Average Annual Decline(2) 21%
Gross Capex
Drilling(6) (120 days to TIL) $1.4mm
Completion (58 days to TIL) $2.1mm
TIL $0.7mm
TOTAL $4.2mm
Curve Parameters
IP(5) (Oil / Gas) 575 bbl/d / 855 mcf/d
Decline (Oil / Gas) 72.5%/54%
B-factor (Oil / Gas) 1.18/1.18
Shrink 85%
NGL Yield 100 bbl/mmcf
EUR 810 mboe
Lateral Length 8,400 ft.
Interest / Gross Locations
WI / NRI(7) 63%/47%
Producing 1,580
DUCs 50
Undrilled(8) 3,200
Rig Count 5 – 15
2017 Expenses & Differential Estimates(1)
Production Expense(3) ($/boe) $4.45 – $4.85
GP&T(4) ($/boe) $10.55 – $10.75
2017 – 2020 Blended Development Program
(1) Applies to total asset inclusive of non-operated
(2) Compound Annual Decline from 7/2016 – 6/2020
(3) Reflects net asset level production expense including LOE, overhead and Ad Val
(4) Excludes all intercompany marketing fees
(5) 30 day average IP
(6) 13 days spud to spud
(7) Assumed until well proposed
(8) All potential locations; not necessarily all drilled by 2020; excludes Upper Eagle Ford and Austin Chalk locations

JASON PIGOTT

CHESAPEAKE OWNS THE HAYNESVILLEGROSS PRODUCTION AND RIG COUNT
0
5
10
15
20
25
30
35
40
0.0
0.2
0.4
0.6
0.8
1.0
1.2
1.4
1.6
2008 2009 2010 2011 2012 2013 2014 2015 2016
Rig
Count
bcf/
d
Appraisal
Program
HBP
Acreage
Decreased
Activity
Core
Development
Technological
Breakthrough
Rig Count
2016 ANALYST DAY – GULF COAST 2
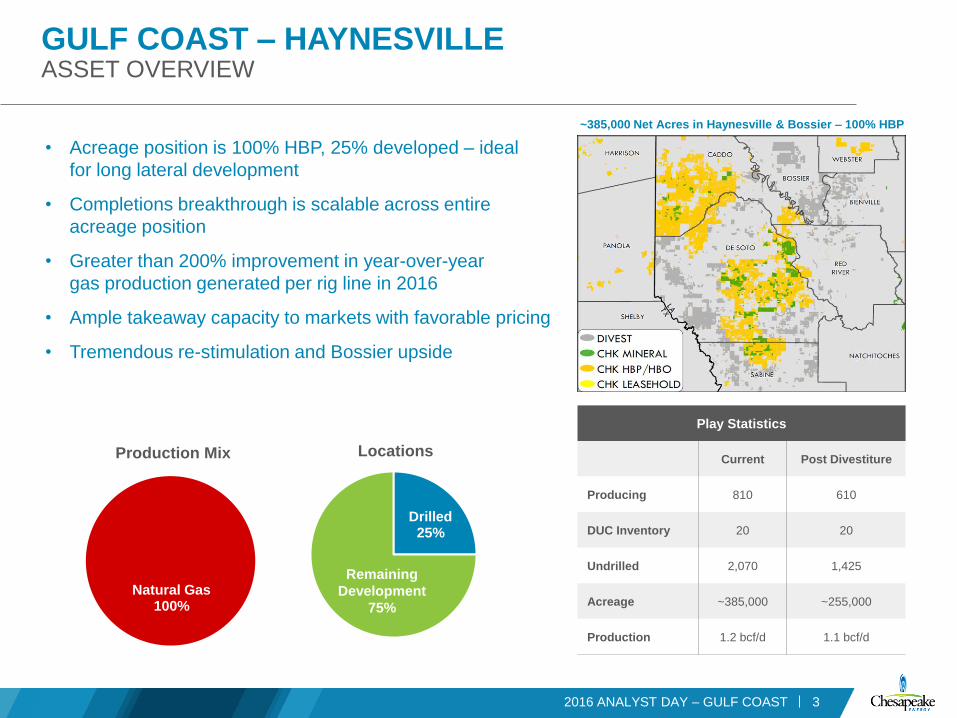
GULF COAST – HAYNESVILLEASSET OVERVIEW
• Acreage position is 100% HBP, 25% developed – ideal
for long lateral development
• Completions breakthrough is scalable across entire
acreage position
• Greater than 200% improvement in year-over-year
gas production generated per rig line in 2016
• Ample takeaway capacity to markets with favorable pricing
• Tremendous re-stimulation and Bossier upside
2016 ANALYST DAY – GULF COAST 3
Oil 0%
Natural Gas100%
Production Mix
Play Statistics
Current Post Divestiture
Producing 810 610
DUC Inventory 20 20
Undrilled 2,070 1,425
Acreage ~385,000 ~255,000
Production 1.2 bcf/d 1.1 bcf/d
Drilled25%
Remaining
Development
75%
Locations
~385,000 Net Acres in Haynesville & Bossier – 100% HBP

OPERATIONAL PERFORMANCEGULF COAST
• Leading drilling performance founded on
a culture of continuous improvement
• Record-setting productivity delivers more
reserves per dollar invested
• Ultra-high density, large volume frac jobs
and XL laterals significantly improve capital
efficiency
• Relentless pursuit of value drives low
production costs and greater efficiency
(1) Data represents operated net lease operating expenses excluding taxes / net equivalent volume.
(2) Average cost per foot of wells drilled and/or completed within the time period.
(3) Data represents average net D&C / net EUR, grouped by TIL year.
2016 ANALYST DAY – GULF COAST 4
$0.48 $0.47
$0.26
$0.19 $0.18
2013 2014 2015 2016E 2017E
LOE ($/mcf) (1)
$2,067
$1,705
$1,420
$1,090 $1,250
2013 2014 2015 2016E 2017E
Cost per Lateral Foot (2)
$2.17
$1.17 $1.00
$0.75 $0.67
2013 2014 2015 2016E 2017E
F&D Cost ($/mcf) (3)

CHESAPEAKE’S COMPETITIVE ADVANTAGE
2016 ANALYST DAY – GULF COAST 5
50mm poundsProppant planned for the Black 2&11-15-11 1H
Completion in progress: 70 of 85 stages pumped
19 of 20 longest lateralsDrilled by Chesapeake in the Louisiana Haynesville Shale

TODAY
OLD CORE VS. NEW CORE FULL-FIELD PARADIGM SHIFT
2016 ANALYST DAY – GULF COAST 6
Chesapeake retained acreage after planned divestitures
PRE 2016
PKY 1HQ3 10,000' lateral;
4,000 lbs./ft. completion test
CA 1H38 mmcf/d; 10,000' lateral;
3,000 lbs./ft. proppant
PCK 1H31 mmcf/d; 7,000' lateral;
2,700 lbs./ft. proppant
NABORS 2H & 3HQ4 5,200' lateral;
3,000 & 5,000 lbs./ ft.
WILL 1H34 mmcf/d; 8,350' lateral;
2,800 lbs./ft. proppant
Completion designs increase field-wide productivity to unprecedented levels

6 712
2124
42
29
44
140
170
'08 '09 '10 '11 '12 '13 '14 '15 '16E '17E
Year
Annualized Gas Rate per Rig (mmcf/d/rig)
DELIVERING EXCEPTIONAL PRODUCTIVITY
> 200% improvementIn production delivered per rig line from 2015 to 2016
2016 ANALYST DAY – GULF COAST 7
50% improvement in ‘17 Productivity projected to increase due to faster drilling, longer laterals and next generation completions
1,7352,137
3,000+
2015 2016 2017E
Proppant Per Lateral Foot
5,847
7,5789,100
2015 2016 2017E
Drilled Lateral Length
3633
30
2015 2016 2017E
Drilling Days
E
E
E
>200% improvementIn production delivered per rig line
from 2015 to 2016
~20% improvement in ‘17Productivity projected to increase due
to faster drilling, longer laterals and
next-generation completions

3.0
1.6
1.2
0.8
0
0.5
1
1.5
2
2.5
3
3.5
0 20 40 60 80 100 120 140
Cu
mu
lative
Pro
du
ction
(b
cf)
Producing Days
GAME-CHANGING PERFORMANCELONGER LATERALS AND BIGGER COMPLETIONS
2016 ANALYST DAY – GULF COAST 8
New CHK wells delivering monster IPsCA 1H – 38 mmcf/d, 10,000' lateral
PCK 1H – 31 mmcf/d, 7,000' lateral
WILL 1H – 34 mmcf/d, 8,350' lateral
>250% increaseIn 90-day production with extended
laterals, increased proppant loading
and reduced cluster spacing

0.0 0.5 1.0 1.5 2.0 2.5 3.0 3.5
90-D
ay P
res
su
re D
raw
do
wn
(p
si/
day)
90-Day Cumulative Production (bcf)
DRAWDOWN MANAGEMENTRECORD PRODUCTIVITY WITH RESPONSIBLE DRAWDOWN
2016 ANALYST DAY – GULF COAST 9
CA 1H
10,000' lateral well
‘07
‘08 – ‘09
‘10 – ‘13
‘14 – ‘15‘16YTD
Optim
al
Less E
ffic
ient
3 bcf in 90 daysCA 1H cumulative production –a 63% improvement over the next-best CHK well in the play
One-year payoutCA 1H estimate – Haynesville wells driving short-cycle cash flow
9.3 bcf in first yearCA 1H first year estimated cumulative production – a ~50% increase over a 10K lateral with an improved completion
Prioritizing long-term value over short-term gains

NEW TECHNOLOGY DRIVES VALUE CREATIONLONGER LATERALS AND BIGGER COMPLETIONS
2016 ANALYST DAY – GULF COAST 10
3% ROR 47% ROR (1)
Combination of extended laterals and current
completions revolutionize economics
(1) Assumes $3.00 flat price deck
$2.30 break-evenCA 1H PV10 break-even gas price
10,000' wells remaining660 Haynesville locations
190 Bossier locations
3%
18%
25%
37%
47%
Springridge 5KLateral
Springridge 7.5KLateral
Springridge 10KLateral
10K CA 2H 10K CA 1H
Longer Laterals
Reduced D&C
Costs
Enhanced
Completion
& High IP
2014 20162015
Rate of Return (1)

0
1,000
2,000
3,000
4,000
5,000
6,000
7,000
8,000
-30 -20 -10 0 10 20 30
Gas R
ate
(m
cf/
d)
Days Before / After Re-stimulation
Clingman Acres 12-15-15 H-1
OFFSET FRAC UPLIFTBREATHING NEW LIFE INTO AGING WELLS
250 mcf/d
7,500 mcf/d
2016 ANALYST DAY – GULF COAST 11
7,250 mcf/d increaseIn production from the Clingman Acres 1H
after the CA 1H stimulation
85% success rateIn 26 trials the existing well production uplift
>1,000 mcf/d after offsetting stimulation

GULF COAST WORLD-CLASS RESOURCE
• CHK Haynesville position is 100% HBP
and only 25% developed
• Unique opportunity to develop field with
newest technology
• Industry-leading Bossier position and
re-stimulation potential
(1) Assumes $3 mcf gas price
2016 ANALYST DAY – GULF COAST 12
2016E 2017+
2Q '16 10,000' Laterals w/Modern Completion
10,000'+ Lateral w/3,000'+ lbs./ft.
Completion
Future Returns of the Gulf Coast (1)
27%
50%
~70%
The Haynesville is no longer a Chesapeake obligation –
it is a world-class investment opportunity

APPENDIX
2016 ANALYST DAY – GULF COAST 13

BOSSIER SHALESIGNIFICANT UPSIDE POTENTIAL
• First 7,500' lateral drilled in 2015
˃ IP 17.7 mmcf/d at 7,480 psi
˃ 1,900 lbs. of proppant per ft.
• Completions optimization
˃ Promising results observed with
vintage completions
˃ Substantial uplift anticipated with
3,000 – 5,000 lbs./ft.
• Significant upside potential across
CHK-operated acreage
˃ Estimated 190 10,000' lateral locations
˃ Nearly 5 tcf of recoverable reserves
2016 ANALYST DAY – GULF COAST 14
0
5,000
10,000
15,000
20,000
25,000
30,000
0 5 10 15 20 25G
as R
ate
(m
cf/
d)
Producing Months
Unit Well
7,500' Well
10K Type Curve - Enhanced Completion
The Bossier is a blank canvas upon which we can apply
eight years of learnings from the Haynesville
70% IP and 50% EUR improvementExpected with 10,000' lateral and
3,000 lbs./ft.

NET EQUIVALENT PRODUCTION GULF COAST: ~20% TOTAL PRODUCTION 2016E
-
100
200
300
400
500
600
700
800
2013 2014 2015 2016E
mb
oe/d
Appalachia North Appalachia South Powder River South Texas
Gulf Coast Mid-Continent Central Texas Marcellus SouthDivested - 2014Divested - 2016
2016 ANALYST DAY – GULF COAST 15

GULF COAST MODELING INPUTS
100%
Production Mix
Natural Gas
0
5
10
15
20
25
30
0 12 24 36 48
Gas R
ate
(m
mcf/d)
Producing Months
Haynesville Type Curve Production Profile
Gas
2016 ANALYST DAY – GULF COAST 16
Base Production(1)
3Q’16E Net Production 835 mmcf/d
4 Yr. Average Annual Decline(2) 30%
Gross Capex
Drilling(6) (133 days to TIL) $3.8mm
Completion (37 days to TIL) $5.7mm
TIL $0.8mm
TOTAL $10.3mm
Curve Parameters
IP(5) 24.6 mmcf/d
Decline 73.5%
B-factor 0.96
EUR 19.9 bcf
Lateral Length 9,800 ft.
Interest / Gross Locations
WI / NRI(7) 80%/63%
Producing 810
DUCs 20
Undrilled(8) 2,070
Rig Count 2 – 4
2017 Expenses & Differential Estimates(1)
Production Expense(3) ($/mcf) $0.20 - $0.26
GP&T(4) ($/mcf) $0.90 – $1.00
2017 – 2020 Blended Development Program
(1) Applies to total asset inclusive of non-operated
(2) Compound Annual Decline from 7/2016 – 6/2020
(3) Reflects net asset level production expense including LOE, overhead and Ad Val
(4) Excludes all intercompany marketing fees
(5) 6 month flat period
(6) 35 days spud to spud
(7) Assumed until well proposed
(8) All potential locations; not necessarily all drilled by 2020

NICK DELL’OSSO

WHERE WE’VE COME FROM
2016 ANALYST DAY – CAPITAL STRUCTURE AND OUTLOOK 2
Substantial progress on every front
2012 – 2016
Reduced total net leverage by
~50% ($10.9 billion)
Improved cash costs by
~50% per boe
Reduced financial and balance
sheet complexity
Led to substantial reduction
in financing costs
Increase in margins on
$/boe basis
Reduction in overhead due
to simpler structure

RESTORING COST OF CAPITAL
2016 ANALYST DAY – CAPITAL STRUCTURE AND OUTLOOK 3
Source: Bloomberg
(1) The composite yield represents the weighted-average yield by outstanding principal for nine different bonds with maturities ranging from 2017 to 2023
0%
5%
10%
15%
20%
25%
30%
35%
40%
45%
50%
Dec-14 Dec-15 Jan-16 Feb-16 Mar-16 Apr-16 May-16 Jun-16 Jul-16 Aug-16 Sep-16
COMPOSITE
Restored liquidity
Refinanced maturities
Reduced total leverage
Average Yield on Traded Debt Securities(1)
• Third amendment to RCF
• Open-market repurchases
• Second amendment to RCF
• Debt exchange
• Common equity for debt exchanges
• Tender offers
• Open-market repurchases
• Divestitures target set to >$2 billion
• Common for preferred equity exchanges
• Access debt and convertible markets

(1) Pro forma convertible note offering, preferred stock for common stock exchanges and open market repurchases of outstanding long-term bonds in October
(2) 2016 security is 1.5 Lien Term Loan
(3) Assumes euro-denominated notes are converted to USD at the relevant exchange rate for each calendar period; for pro forma 3Q’16E, exchange rate as of 9/30/16
(4) Using Moody’s valuation methodology
REDUCED TOTAL LEVERAGE AND COMPLEXITY
Chesapeake continues to simplify the business:
> Eliminated finance leases, subsidiary preferred equity
and seven VPPs
> Optimizing the capital structure
2016 ANALYST DAY – CAPITAL STRUCTURE AND OUTLOOK 4
($mm) 2012 2013 2014 2015 3Q’16Pro Forma
3Q’16 (1)
Credit Facility $418 $405 $0 $0 $240 $0
Term Loan (2) $2,000 $2,000 $0 $0 $1,500 $1,500
Second-Lien Notes $0 $0 $0 $2,425 $2,425 $2,425
Long-Term Bonds (3) $10,647 $10,825 $11,756 $7,281 $4,552 $5,697
Less: Cash ($287) ($837) ($4,108) ($825) ($4) ($900)
Net Debt $12,778 $12,393 $7,648 $8,881 $8,713 $8,722
VPPs $3,186 $2,454 $1,702 $1,289 $675 $675
Operating and Finance Leases $1,255 $948 $0 $0 $0 $0
Subsidiary Preferred $2,500 $2,310 $1,250 $0 $0 $0
Corporate Preferred (4) $1,531 $1,531 $1,531 $1,531 $1,518 $932
Total Adjusted Net Leverage $21,250 $19,636 $12,131 $11,701 $10,906 $10,329
-32%
-51%
~50% reduction (1)
In total net leverage
= $10.9 billion (1)

WHERE WE ARE GOING
2016 ANALYST DAY – CAPITAL STRUCTURE AND OUTLOOK 5
Strategic financial targets
Leads to investment
grade metrics
Allows more stable development
profile through cycles
Provides flexibility to pursue
opportunities for growth
Grow production 5 – 15% annually
Retire $2 – $3 billion of debt
Reduce leverage to 2X net
debt/ebitda
Achieve free cash flow neutrality
More than double ebitda by 2018

2016E AND 2017E OUTLOOK SUMMARY
6
2016E 2017E
Adjusted Production Growth (1) 0% – 3% Adjusted Production Growth (1) (5%) – 0%
Absolute Production: Absolute Production:
Liquids – mmbbls 56 – 60 Liquids – mmbbls 51 – 55
Oil – mmbbls 33 – 35 Oil – mmbbls 33 – 35
NGL– mmbbls 23 – 25 NGL– mmbbls 18 – 20
Natural gas – bcf 1,020 – 1,040 Natural gas – bcf 860 – 900
Total absolute production – mmboe 226 – 233 Total absolute production – mmboe 194 – 205
Absolute daily rate – mboe 617 – 637 Absolute daily rate – mboe 532 – 562
Operating Costs per Boe of Projected Production:
Production expenses, production taxes and G&A (2)
Gathering, processing and transportation expenses
$4.25 – $4.75
$7.60 – $8.10
Operating Costs per Boe of Projected Production:
Production expenses, production taxes and G&A (2)
Gathering, processing and transportation expenses
$4.00 – $4.50
$7.00 – $7.50
Capital Expenditures ($mm) (3) $1,400 – $1,500 Capital Expenditures ($mm) (3) $1,600 – $2,400
Capitalized Interest ($mm) $250 Capitalized Interest ($mm) $220
Total Capital Expenditures ($mm) $1,650 – $1,750 Total Capital Expenditures ($mm) $1,820 – $2,620
(1) Based on 2015 production of 550 mboe per day, adjusted for 2015 and 2016 sales
(2) Includes stock-based compensation
(3) Includes capital expenditures for drilling and completion, leasehold, geological and geophysical
costs, rig termination payments and other property and plant and equipment
(1) Based on 2016 estimated production of 548 mboe per day, adjusted for 2016 sales.
Subject to future A&D activity.
(2) Includes stock-based compensation
(3) Includes capital expenditures for drilling and completion, leasehold, geological and
geophysical costs, rig termination payments and other property and plant and equipment
2016 ANALYST DAY – CAPITAL STRUCTURE AND OUTLOOK
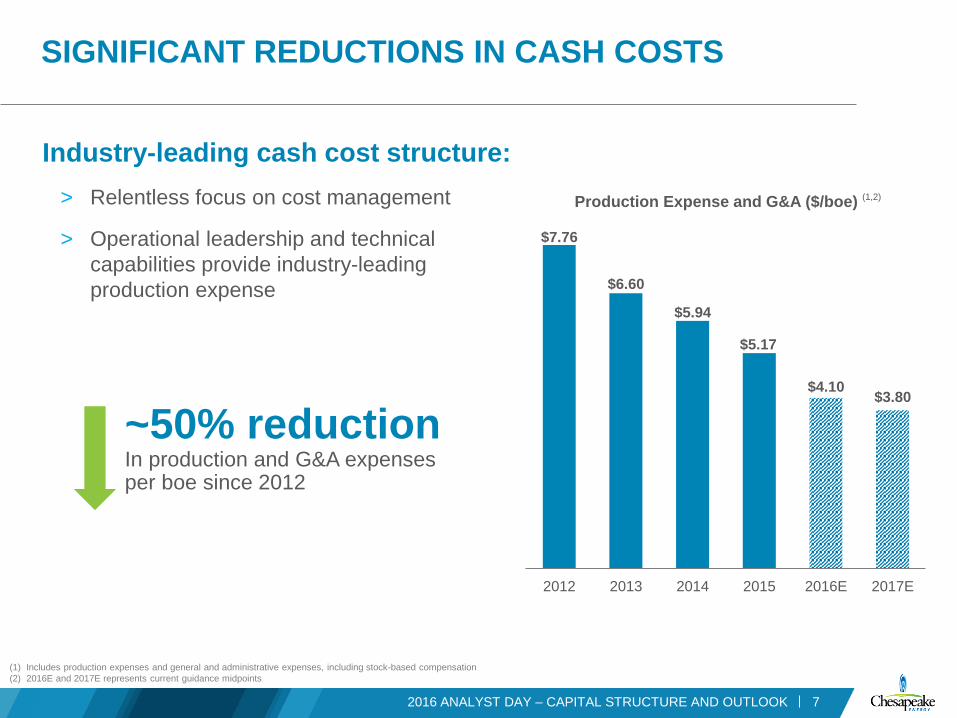
(1) Includes production expenses and general and administrative expenses, including stock-based compensation
(2) 2016E and 2017E represents current guidance midpoints
SIGNIFICANT REDUCTIONS IN CASH COSTS
Industry-leading cash cost structure:
> Relentless focus on cost management
> Operational leadership and technical
capabilities provide industry-leading
production expense
2016 ANALYST DAY – CAPITAL STRUCTURE AND OUTLOOK 7
~50% reductionIn production and G&A expenses per boe since 2012
$7.76
$6.60
$5.94
$5.17
$4.10$3.80
2012 2013 2014 2015 2016E 2017E
Production Expense and G&A ($/boe) (1,2)

CONTINUED IMPROVEMENT IN MIDSTREAM FEES
2016 ANALYST DAY – CAPITAL STRUCTURE AND OUTLOOK 8
Utica
Optimized COS (Wet),
Fixed (Dry) Fees
24% of GP&T Exposure
Eagle Ford
Optimizing Fee
25% of GP&T Exposure
Haynesville
Optimized Fixed Fee
21% of GP&T Exposure
Mid-Continent
Optimized Fixed Tiered Fee
8% of GP&T Exposure
Marcellus
Optimized COS Fee
18% of GP&T Exposure
Powder River
Optimizing to Fixed Tiered Fee
4% GP&T Exposure

0%
20%
40%
60%
80%
100%
2014 2015 2016E 2017E
$0
$50
$100
$150
$200
$250
Firm
Tra
nsp
ort
Utiliz
ation
Sh
ort
fall
($m
m)
Shortfall ($MM) Firm Transport Utilization
OPTIMIZING COMMITMENTS TO FURTHER INCREASE EBITDA
(1) 2016E excludes Barnett (divestment pending)
(2) Also have additional gas gathering agreements with cost-of-service based fees; redetermined annually or tiered fees based on volumes
2016 ANALYST DAY – CAPITAL STRUCTURE AND OUTLOOK 9
GP&T Commitments ($ billion)
YE’14 YE’15 YE’16E (1,2)
$16.0 $14.0 $11.1
~$5.0 billionreduction In midstream and marketing
commitments since 2014
~$59mm reductionIn natural gas transportation
shortfall in 2016
~25% improvementIn natural gas transportation
utilization in 2016
Shortfall ($mm)

~15% IMPROVEMENT IN GP&T COSTS SINCE 2015
(1) Includes MVC shortfall
(2) Excludes all intercompany marketing fees
2016 ANALYST DAY – CAPITAL STRUCTURE AND OUTLOOK 10
PRE AUG 2015 SEPT 2015 AUG 2016
Powder RiverUnder binding LOI
to restructure COS fee
to fixed fee
Mid-Con & BarnettRestructured fixed fee in Mid-Con
and signed PSA in Barnett;
Reduced several transportation
commitments
Utica Dry &
HaynesvilleRestructured COS
fee to fixed fee
MarcellusOptimized
COS fee
OCT 2016
Eagle FordOptimizing fee
80%+ of revenues
driven by oil
2017: Expect 14% improvement in GP&T due to recent
Mid-Con restructuring and Barnett divestiture (pending)
$8.43 $8.55 $8.58
$7.60 – $8.10
$7.00 – $7.50$6.00 – $7.00
$6.00
$7.00
$8.00
$9.00
2014 2015 2016E 2016E New 2017E New 2018 Goal
GP&T $/boe (1,2)
2016 Prior Estimate 2016E Future

THE PATH TO FCF NEUTRAL
(1) Compared to 2017 guidance midpoints
(2) Represents reductions to corporate preferred dividends, subsidiary preferred dividends and interest expense on debt instruments and financing leases
2016 ANALYST DAY – CAPITAL STRUCTURE AND OUTLOOK 11
$10.9 billionIn total net leverage reduction
since 2012
~$600mm reduction In annual leverage service
costs since 2012 (2)
40% – 60% improvement In capital efficiency since 2012
~$5.50/boe reductionIn LOE, G&A and GP&T
from peak rates since 2012 (1)
Cost structure improvements are clearing the path to FCF
neutrality in 2018

CASH FLOW NEUTRAL IN 2018
(1) Excluding judgment for BONY litigation and debt maturities
2016 ANALYST DAY – CAPITAL STRUCTURE AND OUTLOOK 12
CHK turns
FCF neutralIn 2018 due to production
growth from 2017 investment
2017 vs. 2016 Adjusted
Production Decline of
(5%) – 0%
2018 vs. 2017 Adjusted
Production Growth of
10% – 15%
2017 cash flow outspend
of $400mm – $600mm (1)
Da
ily E
qu
iva
lent
Ra
te, m
boe
/d

APPENDIX
2016 ANALYST DAY – CAPITAL STRUCTURE AND OUTLOOK 13

HEDGING POSITION
2016 ANALYST DAY – CAPITAL STRUCTURE AND OUTLOOK 14
(1) Calculated off of 4Q production forecast as of 10/10/16
(2) Using midpoints for projected 2017 total production from 8/9/2016 Outlook
Oil2017 (2)
52%
Swaps $49.68/bbl
Natural Gas2017 (2)
63%
60%Swaps
3%Collars
$3.00/$3.48/mcfNYMEX
$3.07/mcfNYMEX
Natural Gas2016 (1)
72%
66%Swaps
6%Collars
$3.00/$3.48/mcfNYMEX
$2.85/mcfNYMEX
Oil2016 (1)
75%
Swaps $46.84/bbl
NGL2016 (1)
17%
Ethane Swaps $0.17/galPropane Swaps $0.46/gal

$387 $339 $275
$660
$315
$233
$1,168
$730
$117
$0
$500
$1,000
$1,500
$2,000
$2,500
9/30/15 Outstanding 6/30/16 Outstanding 9/30/16 Outstanding
2.50% 2037 6.5% 2017 6.25% 2017
$2,214 (2)
$1,384 (2)
$625 (2)
REDUCTION IN 2017 MATURITIES
2016 ANALYST DAY – CAPITAL STRUCTURE AND OUTLOOK 15
Financial Transaction Liquidity Savings (4)
Debt Exchange$305mm of
second-lien notes$291mm
Open Market
Repurchases$138mm of cash $85mm
Debt for Equity
Exchanges
68.6mm shares
(valued at $295mm)$354mm
Tender Offer$722mm of 1.5 lien
term loan$684mm
~$1.4 billion
~$4,200 (1)
Available
Liquidity
Sources: Company management and disclosures. Note: $ in millions.
(1) $4.0 billion credit facility plus cash pro forma the convertible note funds, less outstanding letters of credit as of 9/30/2016
(2) 6.25% 2017’s converted to USD for entire period using exchange rate of $1.1235 to €1.00 as of 9/30/2016
(3) Pro forma open market repurchases in October 2016
(4) Incremental liquidity savings includes principal savings and net interest impact
70% reductionIn maturities from 9/30/15 to 9/30/16 (3)
(3)

$1,500
$2,425
$625 $599$504
$1,100
$827
$453
$339
$1,250
2017 2018 2019 2020 2021 2022 2023 2024 2025 2026
(1) Recognizes earliest investor put option as maturity for the 2.75% 2035, 2.50% 2037 and 2.25% 2038 Contingent Convertible Senior Notes(2) Pro forma convertible note offering and open market repurchases in October 2016
DEBT MATURITY PROFILE
16
$2.1 billion Debt principal removed from books
in 2015 and 2016 as of 9/30/16 (2)
2016 ANALYST DAY – CAPITAL STRUCTURE AND OUTLOOK
1.5 Lien Term Loan
Unsecured Notes(1)
Second-Lien Notes
Pre-fundRemaining 2017 – 2018 maturities with
convertible note offering due 2026

PREFERRED STOCK EXCHANGES
To further improve the capital structure, Chesapeake negotiated agreements to
exchange shares of preferred stock for common shares
> Issued an aggregate of 110.3 millions of shares of common stock to eliminate approximately $1.2 billion of preferred
stock obligations from capital structure
> Secured annual dividend savings of approximately $67mm
2016 ANALYST DAY – CAPITAL STRUCTURE AND OUTLOOK 17
$586mm reductionIn leverage from cap structure (1)
Position as of 9/30/16 Exchange Transaction Summary Position as of 10/20/16
SeriesAnnual
Dividend
($000)
Preferred
Shares
Liquidation
Preference
Value
($000)
Preferred
Shares
Eliminated
Preference
Value
Eliminated
($000)
Common
Shares Issued
Annual
Dividend
($000)
Preferred
Shares
Liquidation
Preference
Value
($000)
4.50% $11,515 2,558,900 $255,890 - - - $11,515 2,558,900 $255,890
5.00% $10,478 2,095,615 $209,562 134,000 $13,400 1,012,032 $9,808 1,961,615 $196,162
5.75% $84,663 1,472,399 $1,472,399 606,271 $606,271 55,083,869 $49,802 866,128 $866,128
5.75% (A) $63,181 1,098,799 $1,098,799 553,007 $553,007 54,243,322 $31,383 545,792 $545,792
$169,837 7,225,713 $3,036,650 1,293,278 $1,172,678 110,339,223 $102,508 5,932,435 $1,863,972
$67mm reductionIn cumulative annual dividends
(1) Using Moody’s valuation methodology

MARCELLUS NORTH
2016 ANALYST DAY – CAPITAL STRUCTURE AND OUTLOOK
$0.0
$0.5
$1.0
$1.5
$2.0
$2.5
$3.0
Jan-16 Feb-16 Mar-16 Apr-16 May-16 Jun-16 Jul-16 Aug-16 Sep-16
$m
m
Incremental Value for the Manhattan Lateral
18
$1.04
$0.99
$0.90 – $1.00$0.93 – $0.97
$0.90
$0.95
$1.00
$1.05
2014 2015 2016E 2017E
Gas (
$/m
cf)
Marcellus North GP&T (1)
(1) Excludes all intercompany marketing fees
Cost-of-service advantageContinued fee reduction through
midstream optimization
• Increase infrastructure utilization
• Decrease capex for wedge production
• 20% decrease in gathering fees since 2014
Transport optionality enables margin capture above postings

HAYNESVILLE
2016 ANALYST DAY – CAPITAL STRUCTURE AND OUTLOOK 19
0%
20%
40%
60%
80%
2014 2015 2016E 2017E
$0
$20
$40
$60
$80
$100
$120
Firm
Tra
nsport
Utiliz
atio
n
Short
fall
($m
m)
Transportation Shortfall and Utilization
Shortfall ($MM) Firm Transport UtilizationShortfall ($mm) Firm Transport Utilization
$1.21 $1.20
$1.05 – $1.15
$0.90 – $1.00
$0.80
$0.95
$1.10
$1.25
2014 2015 2016E 2017E
Gas (
$/m
cf)
Haynesville GP&T (1)
Transportation portfolio Allows access to major market hubs,
industrial market centers and export
markets for LNG and Mexico
(1) Excludes all intercompany marketing fees
Improved Tiger commitment by 30% – 50%In 2016

UTICA
2016 ANALYST DAY – CAPITAL STRUCTURE AND OUTLOOK 20
(1) Excludes all intercompany marketing fees
Selling gas to premium out-of-basin locations with limited basis exposure
Focus on expanding marginsSignificant cost savings on crude oil
hauling realized over past 14 months
Aug 15Company A – 20%
Sep 15Company B –
3.5%Oct 15
Company C –11%
Feb 16Company D –
15%Mar 16
Company B –15%
Apr 16Company C – 11%Company B – 13%Company E – 8%Company F – 4%
MonthWt. Avg.
Haul/bbl
Diesel
$/gal
Aug 2015 $1.94 $2.60
Jun 2016 $1.58 $2.42
Change -19% -7%
Negotiated Crude Oil Hauling Rate Reductions
$8.50
$8.09
$8.20 – $8.40$8.10 – $8.30
$7.00
$8.00
$9.00
2014 2015 2016E 2017E
Utica GP&T, $/boe (1)

POWDER RIVER
$(7.00)
$(6.00)
$(5.00)
$(4.00)
$(3.00)
$(2.00)
$(1.00)
$-
$/b
bl D
iffe
rentia
l to
WT
I
Powder River Wellhead Crude Pricing
Targeting downstream markets with a premium to CIG
Development of crude takeaway from basin leads to improved margins
212016 ANALYST DAY – CAPITAL STRUCTURE AND OUTLOOK
(1) Excludes all intercompany marketing fees
$8.79
$10.17
$14.10 – $14.30
$13.25 – $13.45
$4.75 – $6.75
$4.00
$8.00
$12.00
$16.00
2014 2015 2016E 2017E DevelopmentProgram
Powder River GP&T, $/boe (1)

MID-CONTINENT
$0.00
$0.20
$0.40
$0.60
$0.80
$1.00
$/b
bl
Realized Premium to WTI
2016 ANALYST DAY – CAPITAL STRUCTURE AND OUTLOOK
(1) Excludes all intercompany marketing fees. 2017 Mid-Con impact from NGL wedge production under fixed processing fee.
Increased revenue through additional NGL recoveryWedge production under fixed-fee contracts
allow greater NGL yields from gas production
(vs. historical POP contracts)
22
Recognizing increasing premiums for Miss Lime production
$5.22
$5.57
$5.15 – $5.35
$5.75 – $5.95
$4.50
$5.50
$6.50
2014 2015 2016E 2017E
Mid-Con GP&T, $/boe (1)

SOUTH TEXAS
(1) Excludes all intercompany marketing fees
2016 ANALYST DAY – CAPITAL STRUCTURE AND OUTLOOK 23
Better margins through crude oil hauling
Better margins through downstream marketingCrude market access to:
• ~2,500 mbo/d per day refinery demand in Houston
• ~700 mbo/d per day refinery demand in Corpus
• Multiple deep-water docks for potential exports
Negotiated Crude Oil Hauling Rate Reductions
Jan 16Company A – 1%
Feb 16Company A – 14% Mar 16
Company A – 4%Company B – 8%Company C – 2%
Apr 16Company B – 7%
Sep 16Company C – 10%
MonthWt. Avg.
Haul/bbl
Diesel
$/gal
Aug 2015 $1.70 $2.04
Jun 2016 $1.53 $1.97
Change -11% -3.5%
$12.15
$9.73 $10.00 – $10.20
$10.55 – $10.75
$7.00
$9.00
$11.00
$13.00
2014 2015 2016E 2017E
Eagle Ford GP&T, $/boe (1)

MARKETING COMMITMENTS ESTIMATES ($MM)
Category 2016 (2) 2017 2018 2019 2020 2021 Thereafter
Barnett Gathering 415 - - - - - -
Barnett Transportation 165 - - - - - -
Haynesville Gathering 215 195 - - - - -
Haynesville Transportation 160 160 150 150 125 115 425
Northeast Gathering 10 25 45 45 45 45 550
Northeast Transport 275 270 260 260 260 255 2470
NGL Transportation 60 70 90 90 90 90 600
Crude Oil Transportation 260 290 260 255 260 255 580
Processing/Treating 150 150 155 155 150 125 680
Other Commitments 230 210 210 185 185 85 10
Total 1,940 1,370 1,170 1,140 1,115 970 5,315
(1) Continuing to optimize firm transportation shortfalls through capacity releases, third-party gas purchases and asset management agreements
(2) Also have additional gas gathering agreements with cost-of-service based fees; redetermined annually or tiered fees based on volumes
2016 ANALYST DAY – CAPITAL STRUCTURE AND OUTLOOK 24
~15% improvement in transport utilization since 2015 (1)

RECONCILIATION OF PV10 TO STANDARDIZED MEASURE
PV10 is a non-GAAP metric used by the industry, investors and analysts to estimate the present value, discounted at 10% per annum,
of estimated future cash flows of the company’s estimated proved reserves before income tax and asset retirement obligations. The
following table shows the reconciliation of PV10 to the company’s standardized measure of discounted future net cash flows, the most
directly comparable GAAP measure, for the year ended December 31, 2015 and for the interim period ended June 30, 2016.
Management believes that PV10 provides useful information to investors because it is widely used by professional analysts and
sophisticated investors in evaluating oil and natural gas companies. Because there are many unique factors that can impact an
individual company when estimating the amount of future income taxes to be paid, management believes the use of a pre-tax measure
is valuable for evaluating the company. PV10 should not be considered as an alternative to the standardized measure of discounted
future net cash flows as computed under GAAP. With respect to PV10 calculated as of an interim date, it is not practical to calculate
taxes for the related interim period because GAAP does not provide for disclosure of standardized measure on an interim basis.
2016 ANALYST DAY – CAPITAL STRUCTURE AND OUTLOOK 25
PV10 – June 30, 2016 @ NYMEX Strip 11,050
Less: Change in pricing assumption from NYMEX Strip to SEC (7,995)
PV10 – June 30, 2016 @ SEC 3,055
Change in PV10 from 12/31/15 to 6/30/16 1,672
PV10 – December 31, 2015 @ SEC 4,727
Less: Present value of future income tax discounted at 10% (34)
Standardized measure of discounted future cash flows – December 31, 2015 $ 4,693

DOUG LAWLER

2016 ANALYST DAY – SUMMARY AND PATH FORWARD 2
FINANCIAL
DISCIPLINE

2016 ANALYST DAY – SUMMARY AND PATH FORWARD 3
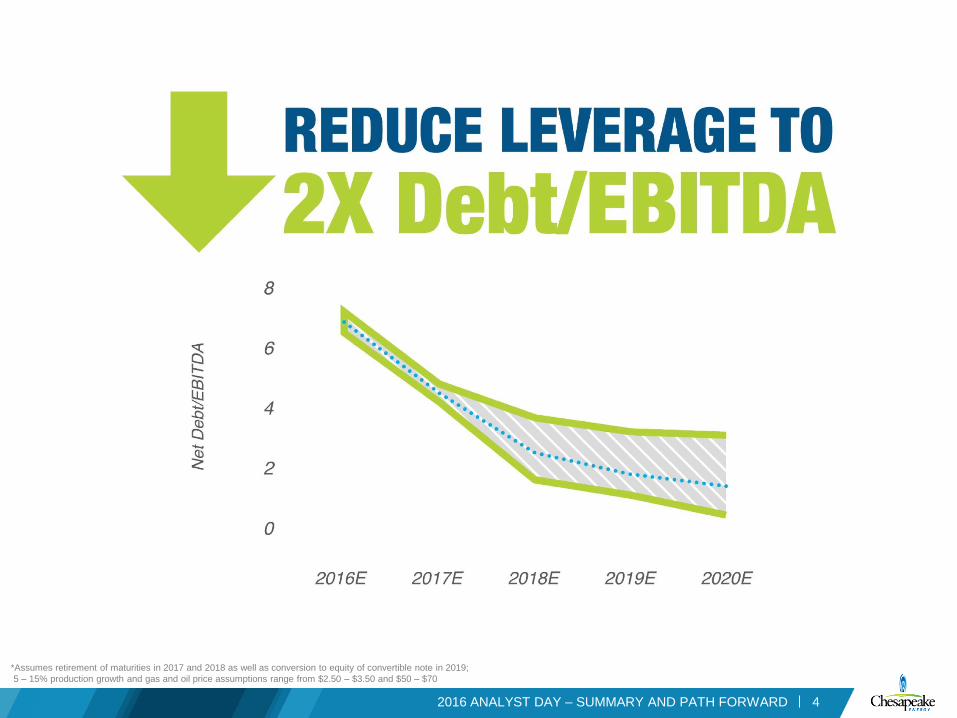
*Assumes retirement of maturities in 2017 and 2018 as well as conversion to equity of convertible note in 2019;
5 – 15% production growth and gas and oil price assumptions range from $2.50 – $3.50 and $50 – $70
2016 ANALYST DAY – SUMMARY AND PATH FORWARD 4

2016 ANALYST DAY – SUMMARY AND PATH FORWARD 5
BUSINESS
DEVELOPMENT

2016 ANALYST DAY – SUMMARY AND PATH FORWARD 6

2016 ANALYST DAY – SUMMARY AND PATH FORWARD 7
EXPLORATION

2016 ANALYST DAY – SUMMARY AND PATH FORWARD 8

2016 ANALYST DAY – SUMMARY AND PATH FORWARD 9
PROFITABLE AND
EFFICIENT GROWTH

*5 – 15% represents an adjusted production growth; capital ranges dependent on anticipated pricing
2016 ANALYST DAY – SUMMARY AND PATH FORWARD 10

*5 – 15% production growth and gas and oil price assumptions range from $2.50 – $3.50 and $50 – $70
2016 ANALYST DAY – SUMMARY AND PATH FORWARD 11

*5 – 15% production growth and gas and oil price assumptions range from $2.50 – $3.50 and $50 – $70
2016 ANALYST DAY – SUMMARY AND PATH FORWARD 12

2016 ANALYST DAY – SUMMARY AND PATH FORWARD 13

2016 ANALYST DAY – SUMMARY AND PATH FORWARD 14