Chittenden County Regional Planning Commission 110 West ... · All soil samples were screened with...
185
COVER LETTER July 12, 2017 Emily Nosse-Leirer Planner Chittenden County Regional Planning Commission 110 West Canal Street, Suite 202 Winooski, VT 05404 Jon Adams-Kollitz Parks Project Coordinator Burlington Parks, Recreation & Waterfront 645 Pine Street, Suite B Burlington, Vermont 05401 Re: Alden Waterfront Park Supplemental Soil and Groundwater Investigation VT SMS#: 20154595 JCO Project #: 3-3049-05 Dear Ms. Nosse-Leirer and Mr. Adams-Kollitz: The Johnson Company is pleased to provide the City of Burlington Parks, Recreation & Waterfront (BPRW) and the Chittenden County Regional Planning Commission (CCRPC) with the following Phase II Environmental Site Assessment Report. This report describes the results of the March and April 2017 soil and groundwater sampling efforts that were conducted at the Alden Waterfront Park west of Lake Street in Burlington, Vermont. Should you have any questions or require additional assistance, please do not hesitate to contact us at (802) 229-4600. Sincerely, The Johnson Company, INC. By:________________________ Kurt Muller, P.E. Senior Project Engineer /Manager Attachments Cc: Hugo Martinez Cazon, VTDEC \\jcoafp\projects\3-3049-05\Reporting\Spring 2017 Investigation\060717 JCO Alden Waterfront Park Investigation Report.docx Reviewed by: GWV
Transcript of Chittenden County Regional Planning Commission 110 West ... · All soil samples were screened with...

COVER LETTER
July 12, 2017 Emily Nosse-Leirer Planner Chittenden County Regional Planning Commission 110 West Canal Street, Suite 202 Winooski, VT 05404 Jon Adams-Kollitz Parks Project Coordinator Burlington Parks, Recreation & Waterfront 645 Pine Street, Suite B Burlington, Vermont 05401 Re: Alden Waterfront Park Supplemental Soil and Groundwater Investigation VT SMS#: 20154595 JCO Project #: 3-3049-05 Dear Ms. Nosse-Leirer and Mr. Adams-Kollitz: The Johnson Company is pleased to provide the City of Burlington Parks, Recreation & Waterfront (BPRW) and the Chittenden County Regional Planning Commission (CCRPC) with the following Phase II Environmental Site Assessment Report. This report describes the results of the March and April 2017 soil and groundwater sampling efforts that were conducted at the Alden Waterfront Park west of Lake Street in Burlington, Vermont. Should you have any questions or require additional assistance, please do not hesitate to contact us at (802) 229-4600. Sincerely, The Johnson Company, INC. By:________________________ Kurt Muller, P.E. Senior Project Engineer /Manager Attachments Cc: Hugo Martinez Cazon, VTDEC 4T4T4T4T4T4T4T4T4T4T4T4T4T4T4T4T4T4T4T4T4T4T4T4T4T4T4T4T4T4T4T4T4T4T4T4T4T4T4T4T4T4T4T4T4T4T4T4T4T4T4T4T4T4T4T4T4T4T4T4T4T4T4T4T4T4T4T4T4T4T4T4T4T4T4T4T4T4T4T4T4T4T4T4T4T4T4T4T4T4T4T4T4T4T4T4T4T4T4T4T4T4T4T4T4T4T4T4T4T4T4T4T4T4T4T4T4T4T4T4T4T4T4T4T4T4T4T4T4T4T4T4T4T4T4T4T4T4T4T4T4T4T4T4T4T4T4T4T4T4T4T4T4T4T4T4T4T4T4T4T4T4T4T4T4T4T4T4T4T4T4T4T4T4T4T4T4T4T4T4T4T4T4T4T4T4T4T4T4T4T4T4T4T4T4T4T4T4T4T4T4T4T4T4T4T4T4T4T4T4T4T4T4T4T4T4T4T4T4T4T4T4T4T4T4T4T4T4T4T4T4T4T4T4T4T4T4T4T4T4T4T4T4T4T4T4T4T4T4T4T4T4T4T4T4T4T4T4T4T4T4T4T4T4T4T4T4T4T4T4T4T4T4T4T4T4T4T4T4T4T4T4T4T4T4T4T4T4T4T4T4T4T4T4T4T4T4T4T4T4T4T4T4T4T4T4T4T4T4T4T4T4T4T4T4T4T4T4T4T4T4T4T4T4T4T4T4T4T4T4T4T4T4T4T4T4T4T4T4T4T4T4T4T4T4T4T4T4T4T4T4T4T4T4T4T4T4T4T4T4T4T4T4T4T4T4T4T4T4T4T4T4T4T4T4T4T4T4T4T4T4T4T4T4T4T4T4T4T4T4T4T4T4T4T4T4T4T4T4T4T4T4T4T4T4T4T4T4T4T4T4T4T4T4T4T4T4T4T4T4T4T4T4T4T4T4T4T4T4T4T4T4T4T4T4T4T4T4T4T4T4T4T4T4T4T4T4T4T4T4T4T4T4T4T4T4T4T4T4T4T4T4T4T4T4T4T4T4T4T4T4T4T4T4T4T4T4T4T4T4T4T4T4T4T4T4T4T4T4T4T4T4T4T4T4T4T4T4T4T4T4T4T4T4T4T4T4T4T4T4T4T4T4T4T4T4T4T4T4T4T4T4T4T4T4T4T4T4T4T4T4T4T4T4T4T4T4T4T4T4T4T4T4T4T4T4T4T4T4T4T4T4T4T4T4T4T4T4T4T4T4T4T4T4T4T4T4T4T4T4T4T4T4T4T4T4T4T4T4T4T4T4T4T4T4T4T4T4T4T4T4T4T4T4T4T4T4T4T4T4T4T4T4T4T4T4T4T4T4T4T4T4T4T4T4T4T4T4T4T4T4T4T4T4T4T4T4T4T4T4T4T4T4T4T4T4T4T4T4T4T4T4T4T4T4T4T4T4T4T4T4T4T4T4T4T4T4T4T4T4T4T4T4T4T4T4T4T4T4T4T4T4T4T4T4T4T4T4T4T4T4T4T4T4T4T4T4T4T4T4T4T4T4T4T4T4T4T4T4T4T4T4T4T4T4T4T4T4T4T4T4T4T4T4T4T4T4T4T4T4T4T4T4T4T4T4T4T4T4T4T4T4T4T4T4T4T4T4T4T4T4T4T4T4T4T4T4T4T4T4T4T4T4T4T4T4T4T4T4T4T4T4T4T4T4T4T4T4T4T4T4T4T4T4T4T4T4T4T4T4T4T4T4T4T4T4T4T4T4T4T4T4T4T4T4T4T4T4T4T4T4T4T4T4T4T4T4T4T4T4T4T4T4T4T4T4T4T4T4T4T4T4T4T4T4T4T4T4T4T4T4T4T4T4T4T4T4T4T4T4T4T4T4T4T4T4T4T4T4T4T4T4T4T4T4T4T4T4T4T4T4T4T4T4T4T4T4T4T4T4T4T4T4T4T4T4T4T4T4T4T4T4T4T4T4T4T4T4T4T4T4T4T4T4T4T4T4T4T4T4T4T4T4T4T4T4T4T4T4T4T4T4T4T4T4T4T4T4T4T4T4T4T4T4T4T4T4T4T4T4T4T4T4T4T4T4T4T4T4T4T4T4T4T4T4T4T4T4T4T4T4T4T4T4T4T4T4T4T4T4T4T4T4T4T4T4T4T4T4T4T4T4T4T4T4T4T4T4T4T4T4T4T4T4T4T4T4T4T4T4T4T4T4T4T4T4T4T4T4T4T4T4T4T4T4T4T4T4T4T4T4T4T4T4T4T4T4T4T4T4T4T4T4T4T4T4T4T4T4T4T4T4T4T4T4T4T4T4T4T4T4T4T4T4T4T4T4T4T4T4T4T4T4T4T4T4T4T4T4T4T4T4T4T4T4T4T4T4T4T4T4T4T4T4T4T4T4T4T4T4T4T4T4T4T4T4T4T4T4T4T4T4T4T4T4T4T4T4T4T4T4T4T4T4T4T4T4T4T4T4T4T4T4T4T4T4T4T4T4T4T4T4T4T4T4T4T4T4T4T4T4T4T4T4T4T4T4T4T4T4T4T4T4T4T4T4T4T4T4T4T4T4T4T4T4T4T4T4T4T4T4T4T4T4T4T4T4T4T4T4T4T4T4T4T4T4T4T4T4T4T4T4T4T4T4T4T4T4T4T4T4T4T4T4T4T4T4T4T4T4T4T4T4T4T4T4T4T4T4T4T4T4T4T4T4T4T4T4T4T4T4T4T4T4T4T4T4T4T4T4T4T4T4T4T4T4T4T4T4T4T4T4T4T4T4T4T4T4T4T4T4T4T4T4T4T4T4T4T4T4T4T4T4T4T4T4T4T4T4T4T4T4T4T4T4T4T4T4T4T4T4T4T4T4T4T4T4T4T4T4T4T4T4T4T4T4T4T4T4T4T4T4T4T4T4T4T4T4T4T4T4T4T4T4T4T4T4T4T4T4T4T4T4T4T4T4T4T4T4T4T4T4T4T4T4T4T4T4T4T4T4T4T4T4T4T4T4T4T4T4T4T4T4T4T4T4T4T4T4T4T4T4T4T4T4T4T4T4T4T4T4T4T4T4T4T4T4T4T4T4T4T4T4T4T4T4T4T4T4T4T4T4T4T4T4T4T4T4T4T4T4T4T4T4T4T4T4T4T4T4T4T4T4T4T4T4T4T4T4T4T4T4T4T4T4T4T4T4T4T4T4T4T4T4T4T4T4T4T4T4T4T4T4T4T4T4T4T4T4T4T4T4T4T4T4T4T4T4T4T4T4T4T4T4T4T4T4T4T4T4T4T4T4T4T4T4T4T4T4T4T4T4T4T4T4T4T4T4T4T4T4T4T4T4T4T4T4T4T4T4T4T4T4T4T4T4T4T4T4T4T4T4T4T4T4T4T4T4T4T4T4T4T4T4T4T4T4T4T4T4T4T4T4T4T4T4T4T4T4T4T4T4T4T4T4T4T4T4T4T4T4T4T4T4T4T4T4T4T4T4T4T4T4T4T4T4T4T4T4T4T4T4T4T4T4T4T4T4T4T4T4T4T4T4T4T4T4T4T4T4T4T4T4T4T4T4T4T4T4T4T4T4T4T4T4T4T4T4T4T4T4T4T4T4T4T4T4T4T4T4T4T4T4T4T4T4T4T4T4T4T4T4T4T4T4T4T4T4T4T4T4T4T4T4T4T4T4T4T4T4T4T4T4T4T4T4T4T4T4T4T4T4T4T4T4T4T4T4T4T4T4T4T4T4T4T4T4T4T4T4T4T4T4T4T4T4T4T4T4T4T4T4T4T4T4T4T4T4T4T4T4T4T4T4T4T4T4T4T4T4T4T4T4T4T4T4T4T4T4T4T4T4T4T4T4T4T4T4T4T4T4T4T4T4T4T4T4T4T4T4T4T4T4T4T4T4T4T4T4T4T4T4T4T4T4T4T4T4T4T4T4T4T4T4T4T4T4T4T4T4T4T4T4T4T4T4T4T4T4T4T4T4T4T4T4T4T4T4T4T4T4T4T4T4T4T4T4T4T4T4T4T4T4T4T4T4T4T4T4T4T4T4T4T4T4T4T4T4T4T4T4T4T4T4T4T4T4T4T4T4T4T4T4T4T4T4T4T4T4T4T4T4T4T4T4T4T4T4T4T4T4T4T4T4T4T4T4T4T4T4T4T4T4T4T4T4T4T4T4T4T4T4T4T4T4T4T4T4T4T4T4T4T4T4T4T4T4T4T4T4T4T4T4T4T4T4T4T4T4T4T4T4T4T4T4T4T4T4T4T4T4T4T4T4T4T4T4T4T4T4T4T4T4T4T4T4T4T4T4T4T4T4T4T4T4T4T4T4T4T4T4T4T4T4T4T4T4T4T4T4T4T4T4T4T4T4T4T4T4T4T4T4T4T4T4T4T4T4T4T4T4T4T4T4T4T4T4T4T4T4T4T4T4T4T4T4T4T4T4T4T4T4T4T4T4T4T4T4T4T4T4T4T4T4T4T4T4T4T4T4T4T4T4T4T4T4T4T4T4T4T4T4T4T4T4T4T4T4T4T4T4T4T4T4T4T4T4T4T4T4T4T4T4T4T4T4T4T4T4T4T4T4T4T4T4T4T4T4T4T4T4T4T4T4T4T4T4T4T4T4T4T4T4T4T4T4T4T4T4T4T4T4T4T4T4T4T4T4T4T4T4T4T4T4T4T4T4T4T4T4T4T4T4T4T4T4T4T4T4T4T4T4T4T4T4T4T4T4T4T4T4T4T4T4T4T4T4T4T4T4T4T4T4T4T4T4T4T4T4T4T4T4T4T4T4T4T4T4T4T4T4T4T4T4T4T4T4T4T4T4T4T4T4T4T4T4T4T4T4T4T4T4T4T4T4T4T4T4T4T4T4T4T4T4T4T4T4T4T4T4T4T4T4T4T4T4T4T4T4T4T4T4T4T4T4T4T4T4T4T4T4T4T4T4T4T4T4T4T4T4T4T4T4T4T4T4T4T4T4T4T4T4T4T4T4T4T4T4T4T4T4T4T4T4T4T4T4T4T4T4T4T4T4T4T4T4T4T4T4T4T4T4T4T4T4T4T4T4T4T4T4T4T4T4T4T4T4T4T4T4T4T4T4T4T4T4T4T4T4T4T4T4T4T4T4T4T4T4T4T4T4T4T4T4T4T4T4T4T4T4T4T4T4T4T4T4T4T4T4T4T4T4T4T4T4T4T4T4T4T4T4T4T4T4T4T4T4T4T4T4T4T4T4T4T4T4T4T4T4T4T4T4T4T4T4T4T4T4T4T4T4T4T4T4T4T4T4T4T4T4T4T4T4T4T4T4T4T4T4T4T4T4T4T4T4T4T4T4T4T4T4T4T4T4T4T4T4T4T4T4T4T4T4T4T4T4T4T4T4T4T4T4T4T4T4T4T4T4T4T4T4T4T4T4T4T4T4T4T4T4T4T4T4T4T4T4T4T4T4T4T4T4T4T4T4T4T4T4T4T4T4T4T4T4T4T4T4T4T4T4T4T4T4T4T4T4T4T4T4T4T4T4T4T4T4T4T4T4T4T4T4T4T4T4T4T4T4T4T4T4T4T4T4T4T4T4T4T4T4T4T4T4T4T4T4T4T4T4T4T4T4T4T4T4T4T4T4T4T4T4T4T4T4T4T4T4T4T4T4T4T4T4T4T4T4T4T4T4T4T4T4T4T4T4T4T4T4T4T4T4T4T4T4T4T4T4T4T4T4T4T4T4T4T4T4T4T4T4T4T4T4T4T4T4T4T4T4T4T4T4T4T4T4T4T4T4T4T4T4T4T4T4T4T4T4T4T4T4T4T4T4T4T4T4T4T4T4T4T4T4T4T4T4T4T4T4T4T4T4T4T4T4T4T4T4T4T4T4T4T4T4T4T4T4T4T4T4T4T4T4T4T4T4T4T4T4T4T4T4T4T4T4T4T4T4T4T4T4T4T4T4T4T4T4T4T4T4T4T4T4T4T4T4T4T4T4T4T4T4T4T4T4T4T4T4T4T4T4T4T4T4T4T4T4T4T4T4T4T4T4T4T4T4T4T4T4T4T4T4T4T4T4T4T4T4T4T4T4T4T4T4T4T4T4T4T4T4T4T4T4T4T4T4T4T4T4T4T4T4T4T4T4T4T4T4T4T4T4T4T4T4T4T4T4T4T4T4T4T4T4T4T4T4T4T4T4T4T4T4T4T4T4T4T4T4T4T4T4T4T4T4T4T4T4T4T4T4T4T4T4T4T4T4T4T4T4T4T4T4T4T4T4T4T4T4T4T4T4T4T4T4T4T4T4T4T4T4T4T4T4T4T4T4T4T4T4T4T4T4T4T4T4T4T4T4T4T4T4T4T4T4T4T4T4T4T4T4T4T4T4T4T4T4T4T4T4T4T4T4T4T4T4T4T4T4T4T4T4T4T4T4T4T4T4T4T4T4T4T4T4T4T4T4T4T4T4T4T4T4T4T4T4T4T4T4T4T4T4T4T4T4T4T4T4T4T4T4T4T4T4T4T4T4T4T4T4T4T4T4T4T4T4T4T4T4T4T4T4T4T4T4T4T4T4T4T4T4T4T4T4T4T4T4T4T4T4T4T4T4T4T4T4T4T4T4T4T4T4T4T4T4T4T4T4T4T4T4T4T4T4T4T4T4T4T4T4T4T4T4T4T4T4T4T4T4T4T4T4T4T4T4T4T4T4T4T4T4T4T4T4T4T4T4T4T4T4T4T4T4T4T4T4T4T4T4T4T4T4T4T4T4T4T4T4T4T4T4T4T4T4T4T4T4T4T4T4T4T4T4T4T4T4T4T4T4T4T4T4T4T4T4T4T4T4T4T4T4T4T4T4T4T4T4T4T4T4T4T4T4T4T4T4T4T4T4T4T4T4T4T4T4T4T4T4T4T4T4T4T4T4T4T4T4T4T4T4T4T4T4T4T4T4T4T4T4T4T4T4T4T4T4T4T4T4T4T4T4T4T4T4T4T4T4T4T4T4T4T4T4T4T4T4T4T4T4T4T4T4T4T4T4T4T4T4T4T4T4T4T4T4T4T4T4T4T4T4T4T4T4T4T4T4T4T4T4T4T4T4T4T4T4T4T4T4T4T4T4T4T4T4T4T4T4T4T4T4T4T4T4T4T4T4T4T4T4T4T4T4T4T4T4T4T4T4T4T4T4T4T4T4T4T4T4T4T4T4T4T4T4T4T4T4T4T4T4T4T4T4T4T4T4T4T4T4T4T4T4T4T4T4T4T4T4T4T4T4T4T4T4T4T4T4T4T4T4T4T4T4T4T4T4T4T4T4T4T4T4T4T4T4T4T4T4T4T4T4T4T4T4T4T4T4T4T4T4T4T4T4T4T4T4T4T4T4T4T4T4T4T4T4T4T4T4T4T4T4T4T4T4T4T4T4T4T4T4T4T4T4T4T4T4T4T4T4T4T4T4T4T4T4T4T4T4T4T4T4T4T4T4T4T4T4T4T4T4T4T4T4T4T4T4T4T4T4T4T4T4T4T4T4T4T4T4T4T4T4T4T4T4T4T4T4T4T4T4T4T4T4T4T4T4T4T4T4T4T4T4T4T4T4T4T4T4T4T4T4T4T4T4T4T4T4T4T4T4T4T4T4T4T4T4T4T4T4T4T4T4T4T4T4T4T4T4T4T4T4T4T4T4T4T4T4T4T4T4T4T4T4T4T4T4T4T4T4T4T4T4T4T4T4T4T4T4T4T4T4T4T4T4T4T4T4T4T4T4T4T4T4T4T4T4T4T4T4T4T4T4T4T4T4T4T4T4T4T4T4T4T4T4T4T4T4T4T4T4T4T4T4T4T4T4T4T4T4T4T4T4T4T4T4T4T4T4T4T4T4T4T4T4T4T4T4T4T4T4T4T4T4T4T4T4T4T4T4T4T4T4T4T4T4T4T4T4T4T4T4T4T4T4T4T4T4T4T4T4T4T4T4T4T4T4T4T4T4T4T4T4T4T4T4T4T4T4T4T4T4T4T4T4T4T4T4T4T4T4T4T4T4T4T4T4T4T4T4T4T4T4T4T4T4T4T4T4T4T4T4T4T4T4T4T4T4T4T4T4T4T4T4T4T4T4T4T4T4T4T4T4T4T4T4T4T4T4T4T4T4T4T4T4T4T4T4T4T4T4T4T4T4T4T4T4T4T4T4T4T4T4T4T4T4T4T4T4T4T4T4T4T4T4T4T4T4T4T4T4T4T4T4T4T4T4T4T4T4T4T4T4T4T4T4T4T4T4T4T4T4T4T4T4T4T4T4T4T4T4T4T4T4T4T4T4T4T4T4T4T4T4T4T4T4T4T4T4T4T4T4T4T4T4T4T4T4T4T4T4T4T4T4T4T4T4T4T4T4T4T4T4T4T4T4T4T4T4T4T4T4T4T4T4T4T4T4T4T4T4T4T4T4T4T4T4T4T4T4T4T4T4T4T4T4T4T4T4T4T4T4T4T4T4T4T4T4T4T4T4T4T4T4T4T4T4T4T4T4T4T4T4T4T4T4T4T4T4T4T4T4T4T4T4T4T4T4T4T4T4T4T4T4T4T4T4T4T4T4T4T4T4T4T4T4T4T4T4T4T4T4T4T4T4T4T4T4T4T4T4T4T4T4T4T4T4T4T4T4T4T4T4T4T4T4T4T4T4T4T4T4T4T4T4T4T4T4T4T4T4T4T4T4T4T4T4T4T4T4T4T4T4T4T4T4T4T4T4T4T4T4T4T4T4T4T4T4T4T4T4T4T4T4T4T4T4T4T4T4T4T4T4T4T4T4T4T4T4T4T4T4T4T4T4T4T4T4T4T4T4T4T4T4T4T4T4T4T4T4T4T4T4T4T4T4T4T4T4T4T4T4T4T4T4T4T4T4T4T4T4T4T4T4T4T4T4T4T4T4T4T4T4T4T4T4T4T4T4T4T4T4T4T4T4T4T4T4T4T4T4T4T4T4T4T4T4T4T4T4T4T4T4T4T4T4T4T4T4T4T4T4T4T4T4T4T4T4T4T4T4T4T4T4T4T4T4T4T4T4T4T4T4T4T4T4T4T4T4T4T4T4T4T4T4T4T4T4T4T4T4T4T4T4T4T4T4T4T4T4T4T4T4T4T4T4T4T4T4T4T4T4T4T4T4T4T4T4T4T4T4T4T4T4T4T4T4T4T4T4T4T4T4T4T4T4T4T4T4T4T4T4T4T4T4T4T4T4T4T4T4T4T4T4T4T4T4T4T4T4T4T4T4T4T4T4T4T4T4T4T4T4T4T4T4T4T4T4T4T4T4T4T4T4T4T4T4T4T4T4T4T4T4T4T4T4T4T4T4T4T4T4T4T4T4T4T4T4T4T4T4T4T4T4T4T4T4T4T4T4T4T4T4T4T4T4T4T4T4T4T4T4T4T4T4T4T4T4T4T4T4T4T4T4T4T4T4T4T4T4T4T4T4T4T4T4T4T4T4T4T4T4T4T4T4T4T4T4T4T4T4T4T4T4T4T4T4T4T4T4T4T4T4T4T4T4T4T4T4T4T4T4T4T4T4T4T4T4T4T4T4T4T4T4T4T4T4T4T4T4T4T4T4T4T4T4T4T4T4T4T4T4T4T4T4T4T4T4T4T4T4T4T4T4T4T4T4T4T4T4T4T4T4T4T4T4T4T4T4T4T4T4T4T4T4T4T4T4T4T4T4T4T4T4T4T4T4T4T4T4T4T4T4T4T4T4T4T4T4T4T4T4T4T4T4T4T4T4T4T4T4T4T4T4T4T4T4T4T4T4T4T4T4T4T4T4T4T4T4T4T4T4T4T4T4T4T4T4T4T4T4T4T4T4T4T4T4T4T4T4T4T4T4T4T4T4T4T4T4T4T4T4T4T4T4T4T4T4T4T4T4T4T4T4T4T4T4T4T4T4T4T4T4T4T4T4T4T4T4T4T4T4T4T4T4T4T4T4T4T4T4T4T4T4T4T4T4T4T4T4T4T4T4T4T4T4T4T4T4T4T4T4T4T4T4T4T4T4T4T4T4T4T4T4T4T4T4T4T4T4T4T4T4T4T4T4T4T4T4T4T4T4T4T4T4T4T4T4T4T4T4T4T4T4T4T4T4T4T4T4T4T4T4T4T4T4T4T4T4T4T4T4T4T4T4T4T4T4T4T4T4T4T4T4T4T4T4T4T4T4T4T4T4T4T4T4T4T4T4T4T4T4T4T4T4T4T4T4T4T4T4T4T4T4T4T4T4T4T4T4T4T4T4T4T4T4T4T4T4T4T4T4T4T4T4T4T4T4T4T4T4T4T4T4T4T4T4T4T4T4T4T4T4T4T4T4T4T4T4T4T4T4T4T4T4T4T4T4T4T4T4T4T4T4T4T4T4T4T4T4T4T4T4T4T4T4T4T4T4T4T4T4T4T4T4T4T4T4T4T4T4T4T4T4T4T4T4T4T4T4T4T4T4T4T4T4T4T4T4T4T4T4T4T4T4T4T4T4T4T4T4T4T4T4T4T4T4T4T4T4T4T4T4T4T4T4T4T4T4T4T4T4T4T4T4T4T4T4T4T4T4T4T4T4T4T4T4T4T4T4T4T4T4T4T4T4T4T4T4T4T4T4T4T4T4T4T4T4T4T4T4T4T4T4T4T4T4T4T4T4T4T4T4T4T4T4T4T4T4T4T4T4T4T4T4T4T4T4T4T4T4T4T4T4T4T4T4T4T4T4T4T4T4T4T4T4T4T4T4T4T4T4T4T4T4T4T4T4T4T4T4T4T4T4T4T4T4T4T4T4T4T4T4T4T4T4T4T4T4T4T4T4T4T4T4T4T4T4T4T4T4T4T4T4T4T4T4T4T4T4T4T4T4T4T4T4T4T4T4T4T4T4T4T4T4T4T4T4T4T4T4T4T4T4T4T4T4T4T4T4T4T4T4T4T4T4T4T4T4T4T4T4T4T4T4T4T4T4T4T4T4T4T4T4T4T4T4T4T4T4T4T4T4T4T4T4T4T4T4T4T4T4T4T4T4T4T4T4T4T4T4T4T4T4T4T4T4T4T4T4T4T4T4T4T4T4T4T4T4T4T4T4T4T4T4T4T4T4T4T4T4T4T4T4T4T4T4T4T4T4T4T4T4T4T4T4T4T4T4T4T4T4T4T4T4T4T4T4T4T4T4T4T4T4T4T4T4T4T4T4T4T4T4T4T4T4T4T4T4T4T4T4T4T4T4T4T4T4T4T4T4T4T4T4T4T4T4T4T4T4T4T4T4T4T4T4T4T4T4T4T4T4T4T4T4T4T4T4T4T4T4T4T4T4T4T4T4T4T4T4T4T4T4T4T4T4T4T4T4T4T4T4T4T4T4T4T4T4T4T4T4T4T4T4T4T4T4T4T4T4T4T4T4T4T4T4T4T4T4T4T4T4T4T4T4T4T4T4T4T4T4T4T4T4T4T4T4T4T4T4T4T4T4T4T4T4T4T4T4T4T4T4T4T4T4T4T4T4T4T4T4T4T4T4T4T4T4T4T4T4T4T4T4T4T4T4T4T4T4T4T4T4T4T4T4T4T4T4T4T4T4T4T4T4T4T4T4T4T4T4T4T4T4T4T4T4T4T4T4T4T4T4T4T4T4T4T4T4T4T4T4T4T4T4T4T4T4T4T4T4T4T4T4T4T4T4T4T4T4T4T4T4T4T4T4T4T4T4T4T4T4T4T4T4T4T4T4T4T4T4T4T4T4T4T4T4T4T4T4T4T4T4T4T4T4T4T4T4T4T4T4T4T4T4T4T4T4T4T4T4T4T4T4T4T4T4T4T4T4T4T4T4T4T4T4T4T4T4T4T4T4T4T4T4T4T4T4T4T4T4T4T4T4T4T4T4T4T4T4T4T4T4T4T4T4T4T4T4T4T4T4T4T4T4T4T4T4T4T4T4T4T4T4T4T4T4T4T4T4T4T4T4T4T4T4T4T4T4T4T4T4T4T4T4T4T4T4T4T4T4T4T4T4T4T4T4T4T4T4T4T4T4T4T4T4T4T4T4T4T4T4T4T4T4T4T4T4T4T4T4T4T4T4T4T4T4T4T4T4T4T4T4T4T4T4T4T4T4T4T4T4T4T4T4T4T4T4T4T4T4T4T4T4T4T4T4T4T4T4T4T4T4T4T4T4T4T4T4T4T4T4T4T4T4T4T4T4T4T4T4T4T4T4T4T4T4T4T4T4T4T4T4T4T4T4T4T4T4T4T4T4T4T4T4T4T4T4T4T4T4T4T4T4T4T4T4T4T4T4T4T4T4T4T4T4T4T4T4T4T4T4T4T4T4T4T4T4T4T4T4T4T4T4T4T4T4T4T4T4T4T4T4T4T4T4T4T4T4T4T4T4T4T4T4T4T4T4T4T4T4T4T4T4T4T4T4T4T4T4T4T4T4T4T4T4T4T4T4T4T4T4T4T4T4T4T4T4T4T4T4T4T4T4T4T4T4T4T4T4T4T4T4T4T4T4T4T4T4T4T4T4T4T4T4T4T4T4T4T4T4T4T4T4T4T4T4T4T4T4T4T4T4T4T4T4T4T4T4T4T4T4T4T4T4T4T4T4T4T4T4T4T4T4T4T4T4T4T4T4T4T4T4T4T4T4T4T4T4T4T4T4T4T4T4T4T4T4T4T4T4T4T4T4T4T4T4T4T4T4T4T4T4T4T4T4T4T4T4T4T4T4T4T4T4T4T4T4T4T4T4T4T4T4T4T4T4T4T4T4T4T4T4T4T4T4T4T4T4T4T4T4T4T4T4T4T4T4T4T4T4T4T4T4T4T4T4T4T4T4T4T4T4T4T4T4T4T4T4T4T4T4T4T4T4T4T4T4T4T4T4T4T4T4T4T4T4T4T4T4T4T4T4T4T4T4T4T4T4T4T4T4T4T4T4T4T4T4T4T4T4T4T4T4T4T4T4T4T4T4T4T4T4T4T4T4T4T4T4T4T4T4T4T4T4T4T4T4T4T4T4T4T4T4T4T4T4T4T4T4T4T4T4T4T4T4T4T4T4T4T4T4T4T4T4T4T4T4T4T4T4T4T4T4T4T4T4T4T4T4T4T4T4T4T4T4T4T4T4T4T4T4T4T4T4T4T4T4T4T4T4T4T4T4T4T4T4T4T4T4T4T4T4T4T4T4T4T4T4T4T4T4T4T4T4T4T4T4T4T4T4T4T4T4T4T4T4T4T4T4T4T4T4T4T4T4T4T4T4T4T4T4T4T4T4T4T4T4T4T4T4T4T4T4T4T4T4T4T4T4T4T4T4T4T4T4T4T4T4T4T4T4T4T4T4T4T4T4T4T4T4T4T4T4T4T4T4T4T4T4T4T4T4T4T4T4T4T4T4T4T4T4T4T4T4T4T4T4T4T4T4T4T4T4T4T4T4T4T4T4T4T4T4T4T4T4T4T4T4T4T4T4T4T4T4T4T4T4T4T4T4T4T4T4T4T4T4T4T4T4T4T4T4T4T4T4T4T4T4T4T4T4T4T4T4T4T4T4T4T4T4T4T4T4T4T4T4T4T4T4T4T4T4T4T4T4T4T4T4T4T4T4T4T4T4T4T4T4T4T4T4T4T4T4T4T4T4T4T4T4T4T4T4T4T4T4T4T4T4T4T4T4T4T4T4T4T4T4T4T4T4T4T4T4T4T4T4T4T4T4T4T4T4T4T4T4T4T4T4T4T4T4T4T4T4T4T4T4T4T4T4T4T4T4T4T4T4T4T4T4T4T4T4T4T4T4T4T4T4T4T4T4T4T4T4T4T4T4T4T4T4T4T4T4T4T4T4T4T4T4T4T4T4T4T4T4T4T4T4T4T4T4T4T4T4T4T4T4T4T4T4T4T4T4T4T4T4T4T4T4T4T4T4T4T4T4T4T4T4T4T4T4T4T4T4T4T4T4T4T4T4T4T4T4T4T4T4T4T4T4T4T4T4T4T4T4T4T4T4T4T4T4T4T4T4T4T4T4T4T4T4T4T4T4T4T4T4T4T4T4T4T4T4T4T4T4T4T4T4T4T4T4T4T4T4T4T4T4T4T4T4T4T4T4T4T4T4T4T4T4T4T4T4T4T4T4T4T4T4T4T4T4T4T4T4T4T4T4T4T4T4T4T4T4T4T4T4T4T4T4T4T4T4T4T4T4T4T4T4T4T4T4T4T4T4T4T4T4T4T4T4T4T4T4T4T4T4T4T4T4T4T4T4T4T4T4T4T4T4T4T4T4T4T4T4T4T4T4T4T4T4T4T4T4T4T4T4T4T4T4T4T4T4T4T4T4T4T4T4T4T4T4T4T4T4T4T4T4T4T4T4T4T4T4T4T4T4T4T4T4T4T4T4T4T4T4T4T4T4T4T4T4T4T4T4T4T4T4T4T4T4T4T4T4T4T4T4T4T4T4T4T4T4T4T4T4T4T4T4T4T4T4T4T4T4T4T4T4T4T4T4T4T4T4T4T4T4T4T4T4T4T4T4T4T4T4T4T4T4T4T4T4T4T4T4T4T4T4T4T4T4T4T4T4T4T4T4T4T4T4T4T4T4T4T4T4T4T4T4T4T4T4T4T4T4T4T4T4T4T4T4T4T4T4T4T4T4T4T4T4T4T4T4T4T4T4T4T4T4T4T4T4T4T4T4T4T4T4T4T4T4T4T4T4T4T4T4T4T4T4T4T4T4T4T4T4T4T4T4T4T4T4T4T4T4T4T4T4T4T4T4T4T4T4T4T4T4T4T4T4T4T4T4T4T4T4T4T4T4T4T4T4T4T4T4T4T4T4T4T4T4T4T4T4T4T4T4T4T4T4T4T4T4T4T4T4T4T4T4T4T4T4T4T4T4T4T4T4T4T4T4T4T4T4T4T4T4T4T4T4T4T4T4T4T4T4T4T4T4T4T4T4T4T4T4T4T4T4T4T4T4T4T4T4T4T4T4T4T4T4T4T4T4T4T4T4T4T4T4T4T4T4T4T4T4T4T4T4T4T4T4T4T4T4T4T4T4T4T4T4T4T4T4T4T4T4T4T4T4T4T4T4T4T4T4T4T4T4T4T4T4T4T4T4T4T4T4T4T4T4T4T4T4T4T4T4T4T4T4T4T4T4T4T4T4T4T4T4T4T4T4T4T4T4T4T4T4T4T4T4T4T4T4T4T4T4T4T4T4T4T4T4T4T4T4T4T4T4T4T4T4T4T4T4T4T4T4T4T4T4T4T4T4T4T4T4T4T4T4T4T4T4T4T4T4T4T4T4T4T4T4T4T4T4T4T4T4T4T4T4T4T4T4T4T4T4T4T4T4T4T4T4T4T4T4T4T4T4T4T4T4T4T4T4T4T4T4T4T4T4T4T4T4T4T4T4T4T4T4T4T4T4T4T4T4T4T4T4T4T4T4T4T4T4T4T4T4T4T4T4T4T4T4T4T4T4T4T4T4T4T4T4T4T4T4T4T4T4T4T4T4T4T4T4T4T4T4T4T4T4T4T4T4T4T4T4T4T4T4T4T4T4T4T4T4T4T4T4T4T4T4T4T4T4T4T4T4T4T4T4T4T4T4T4T4T4T4T4T4T4T4T4T4T4T4T4T4T4T4T4T4T4T4T4T4T4T4T4T4T4T4T4T4T4T4T4T4T4T4T4T4T4T4T4T4T4T4T4T4T4T4T4T4T4T4T4T4T4T4T4T4T4T4T4T4T4T4T4T4T4T4T4T4T4T4T4T4T4T4T4T4T4T4T4T4T4T4T4T4T4T4T4T4T4T4T4T4T4T4T4T4T4T4T4T4T4T4T4T4T4T4T4T4T4T4T4T4T4T4T4T4T4T4T4T4T4T4T4T4T4T4T4T4T4T4T4T4T4T4T4T4T4T4T4T4T4T4T4T4T4T4T4T4T4T4T4T4T4T4T4T4T4T4T4T4T4T4T4T4T4T4T4T4T4T4T4T4T4T4T4T4T4T4T4T4T4T4T4T4T4T4T4T4T4T4T4T4T4T4T4T4T4T4T4T4T4T4T4T4T4T4T4T4T4T4T4T4T4T4T4T4T4T4T4T4T4T4T4T4T4T4T4T4T4T4T4T4T4T4T4T4T4T4T4T4T4T4T4T4T4T4T4T4T4T4T4T4T4T4T4T4T4T4T4T4T4T4T4T4T4T4T4T4T4T4T4T4T4T4T4T4T4T4T4T4T4T4T4T4T4T4T4T4T4T4T4T4T4T4T4T4T4T4T4T4T4T4T4T4T4T4T4T4T4T4T4T4T4T4T4T4T4T4T4T4T4T4T4T4T4T4T4T4T4T4T4T4T4T4T4T4T4T4T4T4T4T4T4T4T4T4T4T4T4T4T4T4T4T4T4T4T4T4T4T4T4T4T4T4T4T4T4T4T4T4T4T4T4T4T4T4T4T4T4T4T4T4T4T4T4T4T4T4T4T4T4T4T4T4T4T4T4T4T4T4T4T4T4T4T4T4T4T4T4T4T4T4T4T4T4T4T4T4T4T4T4T4T4T4T4T4T4T4T4T4T4T4T4T4T4T4T4T4T4T4T4T4T4T4T4T4T4T4T4T4T4T4T4T4T4T4T4T4T4T4T4T4T4T4T4T4T4T4T4T4T4T4T4T4T4T4T4T4T4T4T4T4T4T4T4T4T4T4T4T4T4T4T4T4T4T4T4T4T4T4T4T4T4T4T4T4T4T4T4T4T4T4T4T4T4T4T4T4T4T4T4T4T4T4T4T4T4T4T4T4T4T4T4T4T4T4T4T4T4T4T4T4T4T4T4T4T4T4T4T4T4T4T4T4T4T4T4T4T4T4T4T4T4T4T4T4T4T4T4T4T4T4T4T4T4T4T4T4T4T4T4T4T4T4T4T4T4T4T4T4T4T4T4T4T4T4T4T4T4T4T4T4T4T4T4T4T4T4T4T4T4T4T4T4T4T4T4T4T4T4T4T4T4T4T4T4T4T4T4T4T4T4T4T4T4T4T4T4T4T4T4T4T4T4T4T4T4T4T4T4T4T4T4T4T4T4T4T4T4T4T4T4T4T4T4T4T4T4T4T4T4T4T4T4T4T4T4T4T4T4T4T4T4T4T4T4T4T4T4T4T4T4T4T4T4T4T4T4T4T4T4T4T4T4T4T4T4T4T4T4T4T4T4T4T4T4T4T4T4T4T4T4T4T4T4T4T4T4T4T4T4T4T4T4T4T4T4T4T4T4T4T4T4T4T4T4T4T4T4T4T4T4T4T4T4T4T4T4T4T4T4T4T4T4T4T4T4T4T4T4T4T4T4T4T4T4T4T4T4T4T4T4T4T4T4T4T4T4T4T4T4T4T4T4T4T4T4T4T4T4T4T4T4T4T4T4T4T4T4T4T4T4T4T4T4T4T4T4T4T4T4T4T4T4T4T4T4T4T4T4T4T4T4T4T4T4T4T4T4T4T4T4T4T4T4T4T4T4T4T4T4T4T4T4T4T4T4T4T4T4T4T4T4T4T4T4T4T4T4T4T4T4T4T4T4T4T4T4T4T4T4T4T4T4T4T4T4T4T4T4T4T4T4T4T4T4T4T4T4T4T4T4T4T4T4T4T4T4T4T4T4T4T4T4T4T4T4T4T4T4T4T4T4T4T4T4T4T4T4T4T4T4T4T4T4T4T4T4T4T4T4T4T4T4T4T4T4T4T4T4T4T4T4T4T4T4T4T4T4T4T4T4T4T4T4T4T4T4T4T4T4T4T4T4T4T4T4T4T4T4T4T4T4T4T4T4T4T4T4T4T4T4T4T4T4T4T4T4T4T4T4T4T4T4T4T4T4T4T4T4T4T4T4T4T4T4T4T4T4T4T4T4T4T4T4T4T4T4T4T4T4T4T4T4T4T4T4T4T4T4T4T4T4T4T4T4T4T4T4T4T4T4T4T4T4T4T4T4T4T4T4T4T4T4T4T4T4T4T4T4T4T4T4T4T4T4T4T4T4T4T4T4T4T4T4T
\\jcoafp\projects\3-3049-05\Reporting\Spring 2017 Investigation\060717 JCO Alden Waterfront Park Investigation Report.docx Reviewed by: GWV

REPORT COVER
Supplemental Soil and Groundwater Investigation Report
Alden Waterfront Park
Lake Street Burlington, Vermont
(VTDEC SMS #20154595)
July 12, 2017
Prepared for:
Emily Nosse-Leirer
Planner Chittenden County Regional Planning Commission
110 West Canal Street, Suite 202 Winooski, VT 05404
-and-
Jon Adams-Kollitz
Parks Project Coordinator Burlington Parks, Recreation & Waterfront
645 Pine Street, Suite B Burlington, Vermont 05401

Alden Waterfront Park Supplemental Soil and Groundwater Investigation Burlington, VT The Johnson Company i July 12, 2017
EXECUTIVE SUMMARY The Johnson Company (JCO) was retained by the City of Burlington Parks, Recreation & Waterfront (BPRW) and the Chittenden County Regional Planning Commission (CCRPC), with funding from CCRPC’s Cooperative Agreement with the U.S. Environmental Protection Agency (EPA) (BF - 00A00214 - 0), to conduct a Supplemental Soil and Groundwater Investigation of the Alden Waterfront Park (the Site) in Burlington, Vermont. For the purposes of this investigation, the Site is comprised of the approximately 4.7-acre recreational field located to the north of the waterfront boardwalk and south of Penny Lane between Lake Champlain to the west and the railroad tracks to the east. The Site is owned by the City of Burlington, Vermont and is currently used for general public recreation purposes and to host concerts and festivals. Other than an electrical service panel, no structures are located at the Site. Previous industrial land uses at the Site included timber storage, bulk fuel storage, a railroad yard, and an automotive junk/salvage yard. After a series of subsurface investigations were completed between 1985 and 1987, the Site (formerly referred to as Central VT Railroad/Alden Waterfront) was assigned Site Management Section number (SMS# 87-0005) by the Vermont Department of Environmental Conservation (VTDEC). The Site was closed by VTDEC on November 10, 1992 after a background study was performed on area wide soils in Burlington. Between 1992 and 2014, no additional subsurface assessment was performed at the Site. However, during the 2014 construction of Phase 1a of the Burlington Bike Path, which transected the Site, Vanasse Hangen Brustlin (VHB), the consultant overseeing the project, noted evidence of subsurface contamination (blue-gray stained soils, petroleum and creosote odors, preserved wood, and possible battery fragments) and the Site was reopened on July 6, 2015 under a new SMS number (2015-4595).
VHB identified multiple areas of concern (AOCs) at the Site during the Phase 1a construction (VHB, 2016); however, after reviewing the available information and participating in several technical meetings with JCO, the VTDEC determined that additional field investigation of only the following three AOCs was required:
1. Blue-Gray Soil and Battery Fragment Area According to VHB, during the 2014 Bike Path reconstruction in the far north western portion of the Site, blue-gray stained soils were encountered and broken battery fragments were reportedly associated with these stained soils. In September 2015 JCO conducted an investigation of the Blue-Gray Soil and Battery Fragment Area which consisted of advancement of soil borings, collection of soil samples, installation of monitoring wells, and collection of groundwater samples. The analytical for this investigation focused on polycyclic aromatic hydrocarbons (PAHs) in soil and polychlorinated biphenyls (PCBs) in soil and groundwater. After reviewing the available data, the VTDEC determined that additional investigation of PCB and PAH impacts were not warranted, but that an assessment of lead concentrations in groundwater should be conducted.
2. Swale and high-density polyethylene (HDPE) Drainage Pipe Area During the 2014 Bike Path construction, VHB encountered soils exhibiting elevated photoionization detector (PID) readings of up to 446 parts per million by volume (ppmV) in the vicinity of a swale and high density polyethylene (HDPE) drainage pipe that runs across the event area in an east-to-west direction. The degree and extent of the impacts to soil and

Alden Waterfront Park Supplemental Soil and Groundwater Investigation Burlington, VT The Johnson Company ii July 12, 2017
the potential impacts to groundwater were undetermined and warranted additional investigation.
3. Wooden Culvert/Walkway Area During the 2014 Bike Path construction, VHB encountered buried wood timbers and a creosote odor in the subsurface that were oriented laterally in the eastern portion of the Site. Although many of these timbers were removed and disposed of during construction, several reportedly remained in the sidewalls of the excavation. The degree and extent of the impacts to soil and the potential impacts to groundwater were undetermined and warranted additional investigation.
In March and April 2017, JCO conducted the Site investigation documented in this report in accordance with the Environmental Protection Agency (EPA) and VTDEC approved site-specific Quality Assurance Project Plan (Revision 2), RFA 13071 for the Alden Waterfront Park dated March 14, 2017. The purpose of this investigation was to assess the degree and extent of potential impacts to groundwater at each of three AOCs and to better understand the degree and extent of impacts to the soil at the Swale/HDPE Drainage Pipe Area and the Wooden Culvert/Walkway Area. Investigation field activities included: advancement of 28 soil borings to characterize subsurface soil conditions and to allow for the collection of 22 soil samples for laboratory analysis; installation of 6 monitoring wells; and the collection of 8 groundwater samples for laboratory analysis.
The contaminants of concern for this investigation were lead in groundwater at the Blue-Gray Soil and Battery Fragment Area, volatile organic compounds (VOCs) and semi-VOCs (SVOCs) in soil and groundwater at the Swale and HDPE Drainage Pipe Area, and SVOCs in soil at the Wooden Culvert/Walkway Area. All soil samples were screened with a PID and laboratory analytical samples of soil and groundwater were collected to assess the contaminants of concern in each area.
Based upon the data collected during the March and April 2017 investigation JCO provides the following conclusions: Blue-Gray Soil and Battery Fragment Area
Lead was not detected in groundwater at concentrations exceeding the Vermont Groundwater Enforcement Standards (VGES); therefore, it is considered likely that lead impacts previously detected in soil during the 2014 Phase 1a Burlington Bike Path construction have not significantly impacted groundwater at this AOC.
Swale and HDPE Drainage Pipe Area Only “petroleum list” VOC compounds and PAHs were detected in the soil at concentrations exceeding their respective EPA Regional Screening Level (RSLs) or Vermont Department of Health (VDH) Soil Screening Values (SSV). Only two VOC compounds exceeded their respective residential RSLs or VDH SSVs, which are applicable under a recreation reuse scenario. The majority of the sampled soil had PAH concentrations exceeding the residential RSLs and SSVs. However, when the urban background value of 0.58 mg/kg for PAHs is considered, none of the 11 soil samples submitted for laboratory analysis exceed this proposed background standard, which should be effective as of July 2017. Groundwater sampling

Alden Waterfront Park Supplemental Soil and Groundwater Investigation Burlington, VT The Johnson Company iii July 12, 2017
analytical results indicated that no VOC or SVOC compounds exceeded their respective VGES. Although evidence of sheen in the field was observed in saturated site soil at depth, analytical results suggest that impacts to the subsurface above the applicable standards appear to be confined to soils.
Wooden Culvert/Walkway Area Based on the SVOC soil sampling analytical results, PAH concentrations exceeded the current residential SSV at all locations. However, when the urban background value of 0.58 mg/kg is considered, only one of the four soil samples collected in the area surrounding the AOC and submitted for laboratory analysis exceeded this proposed standard, which should be effective as of July 2017. Groundwater sampling results indicated that no SVOC compounds exceeded their respective VGES; therefore, PAH impacts associated with the soil do not appear to have adversely impacted groundwater at this AOC.
The elevated PAH concentrations detected in the soils at the Site are likely a result of historic industrial usage of the Site and surrounding area. The soil cap that was reportedly installed over the Site in the 1990’s (VHB, 2016) acts to reduce the exposure risk to humans. The groundwater sampling analytical results indicate that Site groundwater is not impacted above VGES values and detectable petroleum constituents in groundwater appear to be decreasing in concentration in a westerly direction towards Lake Champlain.

Alden Waterfront Park Supplemental Soil and Groundwater Investigation Burlington, VT The Johnson Company iv July 12, 2017
TABLE OF CONTENTS
COVER LETTER .......................................................................................................................... i REPORT COVER ......................................................................................................................... i EXECUTIVE SUMMARY ........................................................................................................... i 1.0 INTRODUCTION AND BACKGROUND ..................................................................... 1
1.1 INTRODUCTION ............................................................................................................ 1 1.1.1 Site History................................................................................................................ 1 1.1.2 Land Use ................................................................................................................... 1
1.2 PREVIOUS INVESTIGATIONS .................................................................................... 1 1.3 MARCH AND APRIL 2017 INVESTIGATION OBJECTIVES.................................... 4
2.0 INVESTIGATION METHODOLOGY & RESULTS ................................................... 4 2.1 DIGSAFE PRE-MARK AND SITE WALKOVER ........................................................ 4 2.2 SOIL BORING & MONITORING WELL INSTALLATION..... Error! Bookmark not defined.
2.2.1 Methodology - Soil Boring & Monitoring Well Installation .. Error! Bookmark not defined.
2.3 SOIL SAMPLE COLLECTION & RESULTS ................................................................ 6 2.3.1 Methodology ............................................................................................................. 6 2.3.2 Field Results.............................................................................................................. 8 2.3.3 Analytical Results...................................................................................................... 9
2.4 GROUNDWATER SAMPLE COLLECTION & RESULTS ....................................... 10 2.4.1 Methodology ........................................................................................................... 10 2.4.2 Field Results............................................................................................................ 11 2.4.3 Analytical Results.................................................................................................... 12
3.0 DATA QUALITY EVALUATION ................................................................................ 12 3.1 DUPLICATE SAMPLES ............................................................................................... 12 3.2 TREATMENT OF NON-DETECTS ............................................................................. 13 3.3 TRIP BLANKS/EQUIPMENT BLANKS ..................................................................... 14 3.4 DECONTAMINATION................................................................................................. 14 3.5 ELEVATED REPORTING LIMITS ............................................................................. 14 3.6 QAPP DEVIATIONS .................................................................................................... 15
4.0 CONCEPTUAL SITE MODEL ..................................................................................... 16 5.0 CONCLUSIONS .............................................................................................................. 18 6.0 LIMITATIONS ................................................................................................................ 20 REFERENCES ............................................................................................................................ 21

Alden Waterfront Park Supplemental Soil and Groundwater Investigation Burlington, VT The Johnson Company v July 12, 2017
LIST OF FIGURES Figure 1 Site Location Map Figure 2 Site Features Figure 3 Soil Boring Analytical Results Figure 4 Groundwater Potentiometric Contour Map LIST OF TABLES Table 1 Groundwater Measurements and Monitoring Well Design Table 2 Soil VOC Analytical Results Table 3 Soil SVOC Analytical Results Table 4 Groundwater VOC Analytical Results Table 5 Groundwater SVOC Analytical Results Table 6 Groundwater Lead Analytical Results LIST OF APPENDICES Appendix A Soil Boring Logs Appendix B Laboratory Reports Appendix C Field Notes

Alden Waterfront Park Supplemental Soil and Groundwater Investigation Burlington, VT The Johnson Company 1 July 12, 2017
1.0 INTRODUCTION AND BACKGROUND
1.1 INTRODUCTION
The Johnson Company (JCO) was retained by Burlington Parks, Recreation & Waterfront
(BPRW) and the Chittenden County Regional Planning Commission (CCRPC), with funding from
CCRPC’s Cooperative Agreement with the U.S. Environmental Protection Agency (EPA) (BF -
00A00214 - 0), to conduct a Supplemental Soil and Groundwater Investigation of Alden Waterfront
Park on the Burlington Waterfront (the Site). For the purposes of this investigation, the Site is comprised
of the approximately 4.7-acre recreational field located to the north of the waterfront boardwalk and south
of Penny Lane between Lake Champlain to the west and the railroad tracks to the east. The Site is owned
by the City of Burlington, Vermont. The location of the Site relative to its surroundings is shown on
Figure 1.
1.1.1 Site History
According the previous investigation reports, fill was used to raise the grade of the Site in the
mid-1800s to facilitate the expansion of railroad tracks (VHB, 2016). Previous industrial land uses at the
Site included timber storage, bulk fuel storage, a railroad yard, and an automotive junk/salvage yard.
Industrial and commercial operations at the Site ceased in 1979 (Weston, 1986) and a soil cap was
installed over the Site during redevelopment activities in the early 1990’s (VHB, 2016).
1.1.2 Land Use
The Site consists of an open grassy area which is used for public recreation and events including
concerts and festivals. A paved bike path runs north-south along the eastern edge of the grassy area. A
railroad corridor and Lake Street bound the Site to the east, both of which run parallel to the paved bike
path. The bike path turns to run east-west at the north end of the Site and is parallel to and south of Penny
Lane. A concrete walking path borders the grassy area to the south and west and intersects the paved bike
path at the northwest corner of the Site. A public boat launch ramp to access Lake Champlain is located
west of the concrete walking path. Other than an electrical service panel, no structures are located at the
Site. Site features and the approximate investigation area are shown on Figure 2.
1.2 PREVIOUS INVESTIGATIONS
During a 1985 to 1986 field investigation at the Site, Roy F. Weston, Inc. (Weston) collected soil
and groundwater samples to asses potential impacts to the soil and groundwater at the Site (Weston,

Alden Waterfront Park Supplemental Soil and Groundwater Investigation Burlington, VT The Johnson Company 2 July 12, 2017
1986). Laboratory analytical results found no VOC soil detections exceeding applicable residential
regional screening levels (RSLs) at the time; however, the number of compounds included on the VOC
analyte list was limited. Soil samples were not analyzed for semi-VOCs (SVOCs), polychlorinated
biphenyls (PCBs), or metals. Weston also submitted groundwater samples in 1986 for VOC, SVOC,
metals, and PCB analyses. No VOCs, SVOCs, or metals were detected at concentrations exceeding the
current Vermont Groundwater Enforcement Standards (VGES) and no PCBs were detected above
laboratory detection limits; however, some laboratory detection limits were greater than current VGES.
Visual and olfactory evidence of petroleum contamination was noted in both soil and groundwater at the
Site. While the analytical results suggested impacts were below soil and groundwater screening levels,
the analytical methods used are currently out-of-date, lists of analytical compounds were limited, and the
soil and groundwater sampling locations were limited. Upon completion of these subsurface
investigations between 1985 and 1987, the Site (formerly referred to as Central VT Railroad/Alden
Waterfront) was assigned Site Management Section number (SMS# 87-0005) by the Vermont Department
of Environmental Conservation (VTDEC).
In 1992, Wagner, Heindel, and Noyes, Inc. (WHN) collected soil samples of the 2-feet of material
that was reportedly imported to the Site to be used as a soil cap (WHN, 1992). Soil samples were
collected from the southern end of the Site and were submitted for VOC and SVOC analysis. Field
screening results using a photoionization detector (PID) ranged from 1 parts per million by volume
(ppmV) to 13 ppmV; however, no VOC exceedances were reported by the laboratory. Polycyclic
aromatic hydrocarbons (PAHs) a sub-set of SVOCs were detected at concentrations exceeding the
applicable industrial RSLs at the time of investigation in all but one of the samples submitted for
laboratory analysis. The Site was closed by VTDEC on November 10, 1992 after a background study
was performed on area wide soils in Burlington, which suggested that soil concentrations were generally
consistent with soils typically encountered in Burlington.
Between 1992 and 2014, no additional subsurface assessment was performed at the Site. During
the 2014 construction of Phase 1a of the Burlington Bike Path, Vanasse Hangen Brustlin (VHB), resident
engineers on the project, noted evidence of subsurface contamination including blue-gray stained soils
and possible battery fragments, elevated VOCs during field screening activities, petroleum and creosote
odors, and preserved wooden timbers. The soil in question was stockpiled by ECI (the contractor) and the

Alden Waterfront Park Supplemental Soil and Groundwater Investigation Burlington, VT The Johnson Company 3 July 12, 2017
process was overseen by VHB in a City owned parking lot (approximately 2 miles north of the Site),
pending an assessment to determine appropriate disposal options. The Site was reopened by VTDEC on
July 6, 2015 under a new SMS number (2015-4595).
In support of the soil disposal planning effort, a follow-up investigation consisting of sampling
and analysis of the stockpiled soil for disposal purposes and an investigation was conducted by JCO in
September 2015 in the area where blue-gray soil staining and battery fragments were identified (see
below). This September 2015 assessment focused on stratifying subsurface PCB and PAH impacts to soil
and PCB impacts to groundwater. Analytical data of the soil removed from this area had previously
confirmed the lead impacts to soil and therefore lead analysis was not included in the September 2015
investigation. Following completion of the 2015 assessment, a total of 2,216 tons of stockpiled soil
impacted by PAH, lead, and/or PCBs, was transported off-site for appropriate disposal.
As was identified above, VHB identified multiple areas of concern (AOCs) at the Site during the
2014 Phase 1a construction; however, after reviewing the available information, consulting with VHB,
and participating in several technical meetings with JCO, the VTDEC determined that additional field
investigation of only the following three AOCs was required:
1) Blue-Gray Soil and Battery Fragment Area Blue-gray stained soils, broken battery fragments, and soil lead concentrations in exceedance of
the applicable soil screening values were discovered near the northwest corner of the Site.
2) Swale and high-density polyethylene (HDPE) Drainage Pipe Area
During work conducted by VHB, elevated PID readings of up to 446 ppmV were detected in the
vicinity of a swale and HDPE drainage pipe in the central-eastern portion of the event area.
3) Wooden Culvert/Walkway Area
During excavation overseen by VHB, a creosote odor was detected in soils associated with buried
wooden timbers. The timbers in the Phase 1a excavation limits were removed; however, timbers
observed in the excavation sidewall to the east were left in-place. Analytical data of the
excavated soils associated with the buried wood suggested total petroleum hydrocarbon (TPH)

Alden Waterfront Park Supplemental Soil and Groundwater Investigation Burlington, VT The Johnson Company 4 July 12, 2017
detections and Vermont Department of Health (VDH) soil screening value (SSV) exceedances of
naphthalene and PAH. A paved bike path and permeable pavement access road were installed
over the location of the excavated soil and wooden timbers.
1.3 MARCH AND APRIL 2017 INVESTIGATION OBJECTIVES
The investigation activities described in this section were performed by JCO in accordance with
the site-specific Quality Assurance Project Plan, RFA: 13071 for the Alden Waterfront Park project dated
March 14, 2017. The site-specific Quality Assurance Project Plan (QAPP) was reviewed and approved
by the VTDEC and the Environmental Protection Agency (EPA) prior to the start of work. Any
deviations from the QAPP are described in Section 3.6. The objectives of this investigation are
summarized as follows:
• Determine if the lead impacted soil in the Blue-Gray Soil and Battery Fragment Area has
adversely impacted groundwater and to confirm groundwater flow direction by installing a
monitoring well that is hydraulically up gradient.
• Further assess the degree, nature, and extent of subsurface impacts to soil and groundwater in
the Swale and HDPE Drainage Pipe Area. The contaminants of concern in this area were
VOCs and SVOCs.
• Further characterize the degree, nature and extent of contamination to both soil and
groundwater associated with the wood timbers that remain in place on either side of the
existing bike path corridor in the Wooden Culvert/Walkway Area. The contaminants of
concern in this area were SVOCs.
2.0 INVESTIGATION METHODOLOGY & RESULTS
2.1 DIGSAFE PRE-MARK AND SITE WALKOVER
On March 23, 2017, Jeremy Matt of JCO arrived on-site to mark out the proposed sample
locations for Dig Safe. During this walk through, Mr. Matt met with a representative of VHB, who used a
Trimble sub-meter GPS unit to mark out the AOCs encountered by VHB during the bike path
reconstruction. Mr. Matt also met with representatives of the City of Burlington to discuss the presence
of City-owned utilities (including the irrigation system) located within the limits of the investigation.

Alden Waterfront Park Supplemental Soil and Groundwater Investigation Burlington, VT The Johnson Company 5 July 12, 2017
2.2 SOIL BORING & MONITORING WELL INSTALLATION METHODOLOGY On March 28, 2017 and March 29, 2017, 28 borings were advanced by Eastern Analytical, Inc.
(EAI) with oversight by JCO using a Geoprobe direct-push drill rig. Five-foot-long soil cores were
collected continuously into dedicated butyrate liners to the termination depth of approximately 10 feet
below ground surface (fbgs). Soil borings were advanced at three different locations: up-gradient of the
Blue-Gray Soil and Battery Fragment Area (1 boring), the Swale and HDPE Drainage Pipe Area (15
borings), and the Wooden Culvert/Walkway Area (12 borings). The initial soil boring location at both the
Swale and HDPE Drainage Pipe Area and the Wooden Culvert/Walkway Area were determined based on
VHB observations during the construction of Phase 1a of the Burlington Bike Path. After the center
boring was advanced at these AOCs, four “initial” soil borings were advanced at approximately evenly
spaced locations 25 feet around the central soil boring. Next, five secondary soil borings were planned at
locations approximately 50 feet from the central soil boring. The borings in the Wooden
Culvert/Walkway Area were advanced as planned. However, the borings in the Swale and HDPE
Drainage Pipe Area were adjusted in response to the field screening results and it was determined in the
field that the area of subsurface impact may be larger than was anticipated. Therefore, two additional soil
borings were advanced downgradient of this area in order to further delineate the extent of impacts.
Following completion of the soil boring and soil sampling efforts, monitoring wells were installed
at six of the soil boring locations. The well locations were adjusted from the locations described in the
QAPP based on the field screening results following discussion with the VTDEC and the City of
Burlington. Monitoring well, MW-3 was installed up-gradient of the Blue-Gray Soil and Battery
Fragment Area to assess up-gradient groundwater conditions and to obtain additional potentiometric data
to develop a groundwater contour map, MW-4 was installed at a location that was up-gradient of both the
Wooden Culvert/Walkway Area and the Swale and HDPE Drainage Pipe Area. Monitoring well MW-5
was installed at the location of greatest evidence of contamination at the Wooden Culvert/Walkway Area.
Monitoring wells MW-6, MW-7, and MW-8 were installed to assess the Swale and HDPE Drainage Pipe
Area. Monitoring well MW-6 was installed at the location of greatest evidence of contamination.
Monitoring well MW-7 and MW-8 were installed at locations downgradient of the location of greatest
evidence of contamination.

Alden Waterfront Park Supplemental Soil and Groundwater Investigation Burlington, VT The Johnson Company 6 July 12, 2017
Each of the monitoring wells was constructed from 1-inch polyvinyl chloride (PVC)
casing/screen material and were screened across the water table using a 10-foot section of screened PVC.
Total depths were between 12.0 fbgs and 13.5 fbgs. All wells were finished with concrete supported
flush-mount road boxes. Driller’s sand was installed to approximately 1-foot above the top of screen
elevation and a seal of hydrated bentonite chips was installed to approximately 1-fbgs. The remainder of
the borehole was backfilled with “native” material. Following installation, the monitoring wells were
developed by purging at a high flow rate to remove silt from the well sump and filter pack. Well
construction details are provided in Table 1. Soil boring and well construction notes are provided in
Appendix A. Following installation of the six new monitoring wells; the top-of-casing elevations of all
on-Site monitoring wells were surveyed relative to the Lake Champlain water surface. The lake elevation
as recorded by the Leahy ECHO Center gauge was used to calculate the top-of-casing elevations relative
to the National Geodetic Vertical Datum of 1929 (NGVD 29).
2.3 SOIL SAMPLE COLLECTION & RESULTS
2.3.1 Methodology-Soil Sampling
An experienced JCO field geologist oversaw soil boring and monitoring well installation;
continuously screened the soil for VOCs with a field calibrated PID; and evaluated the soil cores for
visual and olfactory evidence of contamination. Soil characteristics, field observations, PID screening
results, and visual/olfactory evidence of contamination (i.e. sheen) were recorded using indelible ink on
dedicated log sheets. This information was summarized by JCO and is presented in soil boring and well
construction logs (see Appendix A) and in Section 2.3.2.
Prior to the advancement of soil borings, JCO measured the depth to groundwater in an existing
monitoring well (MW-1) located west of the bike path at the Blue-Gray Soil and Battery Fragment Area
to determine the approximate groundwater elevation at the Site. Soil samples were collected from the
interval that exhibited the greatest PID field screening values and/or where the strongest visual/olfactory
evidence of contamination was observed. If no evidence of impacted material was found the sample was
collected from a 1-foot interval above the apparent saturated zone. A total of 22 soil samples were
collected for laboratory analysis from soil borings JCO-SB-01 through JCO-SB-21 and MW-7 to capture
localized soil impacts above the groundwater table. Following sample collection from the soil cores, the

Alden Waterfront Park Supplemental Soil and Groundwater Investigation Burlington, VT The Johnson Company 7 July 12, 2017
excess material was returned to the borehole and driller’s sand was used to fill the remainder of the
borehole to ground surface.
No soil samples were collected from the Blue-Gray Soil and Battery Fragment Area in
accordance with the site-specific QAPP, as lead impacts to groundwater were the primary focus in this
area. A total of 12 soil samples were collected from the Swale and HDPE Drainage Pipe Area (JCO-SB-
01 through JCO-SB-11 and MW-7) and 10 soil samples were collected from the Wooden
Culvert/Walkway Area (JCO-SB-12 through JCO-SB-21). Samples were collected from depths ranging
from 0.6 to 7.0 fbgs in the Swale and HDPE Drainage Pipe Area. Specifically, the soil samples in this
area were collected from the 1-foot unsaturated interval which displayed the most elevated PID response
as per the site-specific QAPP. Soil samples were collected from depths ranging from 1.5 to 3.5 fbgs in
the Wooden Culvert/Walkway Area, specifically from the 1-foot depth interval that showed the most
visual and/or olfactory evidence of contamination as per the site-specific QAPP. All of the soil samples
were placed in an ice-filled cooler and transported under chain of custody (COC) protocol to EAI for
analysis. The five primary samples (center sample and four surrounding samples) collected from the
Wooden Culvert/Walkway Area Swale and the five primary samples collected from the HDPE Drainage
Pipe Area were selected for immediate analysis and the remaining (secondary) samples were placed “on
hold” at the laboratory pending the evaluation of results of the primary analysis.
The five primary soil samples from the Swale and HDPE Drainage Pipe Area, JCO-SB-01 (0.6-
1.6), JCO-SB-02 (1.4-2.4), JCO-SB-03 (2-3), JCO-SB-04 (1.8-2.8), and JCO-SB-05 (1.8-2.8), were
submitted for VOC and SVOC analysis. Following receipt of the primary data and discussion between
JCO, the VTDEC, and the City of Burlington, it was determined that the seven on-hold soil samples from
the Swale and HDPE Drainage Pipe Area, JCO-SB-06 (6-7), JCO-SB-07 (6-7), JCO-SB-08 (1.9-2.9),
JCO-SB-09 (5.5-6.5), JCO-SB-10 (1.8-2.8), JCO-SB-11 (6-7), and JCO-MW-7 (6-7), should be analyzed
for the 8021B list of petroleum-related VOCs (benzene, toluene, ethylbenzene, xylenes, methyl-t-butyl
ether, naphthalene, ethylene dibromide, 1,2-dichloroethane, and trimethylbenzenes), and polycyclic
aromatic hydrocarbons (PAHs; a sub-set of the SVOC list). A blind duplicate sample was also collected
from the Swale and HDPE Drainage Pipe Area and was submitted for VOC and SVOC analysis.

Alden Waterfront Park Supplemental Soil and Groundwater Investigation Burlington, VT The Johnson Company 8 July 12, 2017
The five primary soil samples from the Wooden Culvert/Walkway Area, JCO-SB-12 (2.5-3.5),
JCO-SB-13 (1.9-2.9), JCO-SB-14 (2-3), JCO-SB-15 (1.5-2.5), and JCO-SB-16 (1.5-2.5), were analyzed
for SVOCs only. After review of the initial data and following discussion with the VTDEC and City of
Burlington, it was determined that no additional analysis in connection with the Wood Culvert/Walkway
Area was warranted, because the extent of impact associated with this area had been adequately defined.
Soil analytical results are discussed in Section 2.3.3, below.
2.3.2 Field Results-Soil
The soils encountered during the investigation were predominately comprised of sand or sand
with trace gravel and trace silt. Anthropogenic material such as coal fragments, brick fragments, glass,
and paint chips were generally encountered at depths less than 5 fbgs. Soil PID screening results and
visual/olfactory evidence of contamination are summarized by AOC, below.
Blue-Gray Soil and Battery Fragment Area
The PID soil screening results for the boring advanced to install monitoring well MW-3 identified
no detectable VOCs above the background PID reading of 0.0 ppmV. Coal fragments were observed at
this boring/well location from approximately 0.9 fbgs to 2.7 fbgs. No odors or sheens were observed.
Swale and HDPE Drainage Pipe Area
Soil PID screening results for 12 of the 15 soil borings advanced in the Swale and HDPE
Drainage Pipe Area exhibited elevated peak PID screening responses that ranged from 7.5 ppmV to 504
ppmV above background. The zones of elevated PID readings were encountered at depths ranging from
approximately 4.5 fbgs to 7.0 fbgs (approximately at or below the field-estimated groundwater table at the
Site). The peak PID responses in the remaining three soil borings (JCO-SB-01, JCO-SB-05, and JCO-
SB-08) ranged from 0.0 to 1.0 ppmV above background PID readings and are therefore considered to be
outside the area of impact. Elevated PID readings, accompanied by petroleum odors and sheens were
observed in the saturated portions of the soil core. Coal fragments were encountered in several of the soil
borings at depths ranging from 0.4 to 5.0 fbgs (see Appendix A, Field Notes).
Wooden Culvert/Walkway Area
Soil PID screening results from the 12 soil borings advanced in the Wooden Culvert/Walkway
Area were all 0.0 ppmV with the exception of JCO-SB-16 which had a PID screening value of 1.4 ppmV

Alden Waterfront Park Supplemental Soil and Groundwater Investigation Burlington, VT The Johnson Company 9 July 12, 2017
above background PID readings. No sheens were observed in any of the soil borings and no odors were
observed in any of the soil borings with the exception of JCO-SB-12. Wood fragments accompanied by a
mild creosote odor were observed in JCO-SB-12 (center boring for this area) at approximately 3.5 fbgs,
similar to the approximate depth of the wooden timbers reportedly encountered by VHB during the 2014
bike path rehabilitation construction. Coal fragments were encountered in several of the soil borings and
ranged in depth from 0.9 to 5.8 fbgs (see Appendix A, Field Notes).
2.3.3 Analytical Results-Soil
The soil analytical results were compared to the May 2016 EPA residential RSLs and to the VDH
SSVs. In addition, the PAH concentrations were used to calculate the benzo(a)pyrene (BaP) toxicity
equivalence (TEQ). The BaP-TEQ was calculated by summing the product of the detected concentrations
for each of the PAHs with the corresponding BaP toxicity equivalence factor (TEF). For the purposes of
this calculation, non-detect results were assumed to be one half of the detection limit. The BaP-TEQ
values were compared to the current BaP RSLs and SSVs. The BaP-TEQ values were also compared to
the proposed BaP-TEQ urban background standard of 0.58 mg/kg in anticipation that this rehabilitation
project may take place after the current screening levels are revised. Laboratory reports are provided as
Appendix B and soil analytical results are summarized in Table 2 and Table 3. Summaries of the soil
analytical results are presented by AOC below. Exceedances of RSLs or SSVs are presented on Figure 3.
Swale and HDPE Drainage Pipe Area
A total of five soil samples were analyzed for the full 8260B VOC list during the primary round
of soil boring sample analysis. The analytical results suggested that only petroleum compounds were
detected at concentrations exceeding their respective RSLs or SSVs in these samples. A total of seven
secondary on-hold soil samples were submitted for analysis of the abbreviated VOC “petroleum list”
constituents (see Section 3.6 for a discussion regarding the decision to analyze on-hold samples for
abbreviated lists). The VOC analysis identified residential RSL and SSV exceedances of 1,2,4-
trimethylbenzene and naphthalene. All other VOC compounds were either not-detected above laboratory
reporting limits or were detected at concentrations below RSLs and SSVs. The 1,2,4-trimethylbenzene
concentrations exceeded the residential RSL or SSV in 1 of 12 samples: JCO-SB-03 (2-3) and
naphthalene (analyzed as a VOC) concentrations exceeded the residential RSL or SSV in 3 of 12 samples:

Alden Waterfront Park Supplemental Soil and Groundwater Investigation Burlington, VT The Johnson Company 10 July 12, 2017
JCO-SB-02 (1.4-2.4), JCO-SB-03 (2-3), and JCO-SB-10 (1.8-2.8). The same five primary soil samples
were also analyzed for the full SVOC list during the first round of laboratory analysis. Only PAH
compounds were detected at concentrations exceeding their respective RSLs or SSVs in these samples. A
total of seven secondary on-hold soil boring samples were submitted for analysis of PAH constituents
only (see Section 3.6 for a discussion regarding the decision to analyze on-hold samples for abbreviated
lists). The PAH concentrations (as summarized by the BaP-TEQ) exceeded the residential RSL and SSV
in 9 of 12 samples: JCO-SB-01 (0.6-1.6), JCO-SB-02 (1.4-2.4), JCO-SB-03 (2-3), JCO-SB-04 (1.8-2.8),
JCO-SB-05 (1.8-2.8), JCO-SB-06 (6-7), JCO-SB-09 (5.5-6.5), JCO-SB-11 (6-7), and JCO-MW-7 (6-7).
No soil samples were found to have BaP-TEQ concentrations in exceedance of the proposed urban
background value of 0.58 mg/kg. The RSL and SSV exceedances of both VOCs and PAHs occurred at
depths ranging from 1.4 to 3 fbgs.
Wooden Culvert/Walkway Area
The SVOC analysis identified RSL and SSV exceedances of PAHs only. All other SVOC
compounds were either not-detected or were detected at concentrations below RSLs and SSVs (primarily
non-BaP-TEQ PAH compounds in addition to dibenzofuran). The PAH concentrations (as summarized
by the BaP-TEQ) exceeded the residential RSL and SSV in each of the five samples: JCO-SB-12 (2.5-
3.5), JCO-SB-13 (1.9-2.9), JCO-SB-14 (2-3), JCO-SB-15 (1.5-2.5), and JCO-SB-16 (1.5-2.5). BaP-TEQ
concentrations in two of the five samples exceeded the proposed urban background value of 0.58 mg/kg:
JCO-SB-12 (2.5-3.5) and JCO-SB-15 (1.5-2.5). There was no apparent correlation between BaP-TEQ
concentrations and depth.
2.4 GROUNDWATER SAMPLE COLLECTION & RESULTS
2.4.1 Methodology-Groundwater On April 10, 2017, groundwater samples were collected by JCO from each of the eight on-site
monitoring wells (MW-1 through MW-8). Prior to the start of purging, the wells were opened and the
headspace above the water table in the wells was screened for VOCs using a calibrated PID. The
potentiometric water level elevations in each of the eight wells, in addition to monitoring well GD-12,
were also measured prior to the start of purging using a water level meter, which was decontaminated
between well locations.

Alden Waterfront Park Supplemental Soil and Groundwater Investigation Burlington, VT The Johnson Company 11 July 12, 2017
Groundwater samples were collected from monitoring wells MW-1 through MW-8 via dedicated
tubing with a peristaltic pump using low flow sampling techniques. The tubing inlet was placed at the
approximate center of the wetted portion of the well screen. During purging, a calibrated YSI® meter
equipped with a flow through cell was used to measure the groundwater’s physiochemical parameters,
including pH, oxidation reduction potential, specific conductivity, temperature, and dissolved oxygen
concentration (see Appendix C). Samples were collected once stabilization of the groundwater
parameters was achieved or once three well volumes were purged as specified in the QAPP. Turbidity
was also monitored during sampling using a field calibrated Lamotte 2020 turbidity meter.
Samples were collected and submitted via courier in an ice filled cooler to EAI under COC
protocol. Groundwater samples from MW-1 through MW-3 were analyzed for lead; groundwater
samples from MW-4, MW-5, MW-6, and MW-8 were analyzed for the full list of VOCs and SVOCs; and
the groundwater sample from MW-7 was analyzed for the full list of VOCs, only. The equipment blank
was analyzed for VOCs, SVOCs, and lead; the trip blank was analyzed for VOCs; a blind duplicate
sample was analyzed for VOCs and SVOCs; an additional blind duplicate sample was analyzed for lead.
Groundwater analytical results are discussed in Section 2.4.3 below and are summarized in Table 4
through Table 6.
2.4.2 Field Results-Groundwater
The potentiometric groundwater measurements collected during the April 10, 2017 groundwater
sampling event were used to develop a potentiometric groundwater flow map (see Figure 4). These data
indicate groundwater flow across the Site in a westerly direction (towards Lake Champlain). The
hydraulic gradient ranges from approximately 0.006 ft/ft as measured just north of MW-6 and MW-8 to
approximately 0.012 ft/ft as measured just north of MW-2. Note that on March 28 and 29, 2017 when the
soil boring advancement was being conducted warm temperatures were causing snow melt which resulted
in standing water in many areas of the Site. As of April 10, 2017 this water had either evaporated or
infiltrated and no surface water was present. The infiltration of this water appears to have resulted in an
elevated groundwater table when compared to previous readings.

Alden Waterfront Park Supplemental Soil and Groundwater Investigation Burlington, VT The Johnson Company 12 July 12, 2017
The headspace in MW-8 registered a PID response of 2.4 ppmV above background. No PID
headspace readings above 0.0 ppmV were detected in any of the other wells during the April 10, 2017
groundwater sampling event.
2.4.3 Analytical Results-Groundwater
The groundwater analytical results were compared to the February 2005 VGES. No VGES
exceedances were reported in any of the samples collected during this groundwater monitoring event.
Blue-Gray Soil and Battery Fragment Area
Groundwater analysis for lead was only performed on samples collected from the monitoring
wells associated with the Blue-Gray Soil and Battery Fragment Area (MW-1, MW-2, and MW-3). Lead
was detected in MW-2, but at concentrations below applicable VGES. No other detections of lead were
reported in the groundwater.
Swale and HDPE Drainage Pipe Area
Detections of VOCs were reported in MW-6 and MW-7. No VOC detections were reported in
any other wells. The compounds ethylbenzene, isopropylbenzene, n-butylbenzene, and n-propylbenzene
were detected in MW-6 only and 1,2,4-trimethylbenzene and 1,3,5-trimethylbenzene were detected in
both MW-6 and MW-7. Detections of eight PAHs at concentrations below applicable VGES
concentrations were reported in MW-6. No SVOCs were detected in any other wells.
Wooden Culvert/Walkway Area
No SVOCs were detected in any of the wells installed at the Wooden Culvert/Walkway Area.
3.0 DATA QUALITY EVALUATION
3.1 DUPLICATE SAMPLES
One duplicate soil sample was collected and submitted for VOC and SVOC analysis as per the
site-specific QAPP. Two duplicate groundwater samples were collected: one duplicate groundwater
sample was collected and submitted for lead analysis and one duplicate groundwater sample was collected
and submitted for VOC/SVOC analysis.

Alden Waterfront Park Supplemental Soil and Groundwater Investigation Burlington, VT The Johnson Company 13 July 12, 2017
A comparison of parent and duplicate samples is provided in Table 2 through Table 6 where there
were reported detections in both the parent and duplicate samples. This comparison is summarized in an
adjacent column labeled Relative Percent Difference (RPD). The RPD is defined as 100 times the
difference between the two samples, divided by the mean of the two samples. The RPD values were only
calculated where both the parent and the duplicate sample results were detections; the RPD values are
provided in the analytical tables in a column immediately to the right of the parent and duplicate results.
A small RPD indicates good correlation between the two samples; in groundwater, RPD values of
less than 30% are desirable. For the groundwater parent/duplicate pairs, the only detected compounds
were VOCs and SVOCs. All of the RPD values for the VOC parent/duplicate pair were 0% and RPD
values for the SVOC parent/duplicate pair ranged from 0 to 9% indicating an overall good correlation
between samples.
For soils, larger RPDs up to 50% are acceptable because the materials are significantly more
heterogeneous. A total of two soil RPDs were in excess of 50%. The parent/duplicate results for
ethylbenzene in the JCO-SB-03 (2-3) sample were 0.3 mg/kg and 0.15 mg/kg respectively resulting in an
RPD of 67%. This elevated RPD value is likely the result of the heterogeneity of soil. The
parent/duplicate results for 1,2,4-trimethylbenzene in the JCO-SB-03 (2-3) sample were 42 mg/kg and 16
mg/kg respectively. The laboratory noted that the reported value of the duplicate sample “exceeded 15
mg/kg which was the concentration of the largest calibration standard. Extrapolation of the calibration
curve was employed to obtain the reported value. This indicates that the reported value of 16 mg/kg for
the duplicated sample may be inaccurate which could explain the elevated RPD value of 90%. While not
ideal, these elevated RPD values do not affect the conclusions of this report.
3.2 TREATMENT OF NON-DETECTS
In cases where non-detect results were involved in calculations (such as determining BaP-TEQ),
non-detects were included in the calculation if the associated compound was ever detected anywhere on
the Site in any media during the March and April 2017 investigation (NOTE: RPDs were only calculated
if both results were detects). Non-detects of compounds which were never detected were treated as zeros.
All of the compounds involved in the BaP-TEQ calculation were detected at least once during the 2017
soil sampling, thus, non-detects were used in the BaP-TEQ calculations.

Alden Waterfront Park Supplemental Soil and Groundwater Investigation Burlington, VT The Johnson Company 14 July 12, 2017
3.3 TRIP BLANKS/EQUIPMENT BLANKS
A total of two trip blanks and two equipment blanks were transported to EAI for analysis along with
soil and/or groundwater samples. No compounds were detected above laboratory reporting limits in any
of the trip blanks or equipment blanks. There were instances of elevated reporting limits exceeding the
SSV or RSL in both the trip blanks and equipment blanks
3.4 DECONTAMINATION
All sample collection was conducted using either dedicated equipment (nitrile gloves, Ziploc
bags, butyrate liners, tubing, etc.) or using decontaminated reusable sample equipment (screwdrivers,
etc.). The groundwater level indicator used to measure the depth to water in each of the monitoring wells
was decontaminated between uses. The reusable equipment was decontaminated by brushing any gross
contamination away with a paper towel, washing with a mixture of deionized water and Alconox
laboratory soap, and then rising with deionized water.
3.5 ELEVATED REPORTING LIMITS
The standard reporting limits for a number of soil VOC and SVOC compounds (1,2,3-
trichloropropane, 1,2-dibromo-3-chloropropane, bromodichloromethane, carbon tetrachloride, vinyl
chloride, 1,2-dibromoethane (EDB), and benzidine) are higher than the corresponding residential RSLs or
VDH SSVs. The standard reporting limits for a number of groundwater VOC and SVOC compounds
(1,2-dibromo-3-chloropropane, 1,2-dibromoethane (EDB), and pentachlorophenol) are higher than the
corresponding VGES. These standard reporting limits are the result of limitations of the 8260B (VOC)
and 8270D (SVOC) analytical methods and were consistent with the values presented in the Form K of
the approved site-specific QAPP and do not change the conclusions of this report.
The JCO-SB-03 (2-3), JCO-SB-09 (5.5-6.5), JCO-SB-11 (6-7), and JCO-SB-Dup-01 SVOC
reporting limits were elevated due to “sample matrix causing internal standard error and/or surrogate
failure in undiluted analysis (see the analytical laboratory reports provided in Appendix B).” This
resulted in 2,4-dinitrotoluene, benzo(a)pyrene, bis(2-chloroethyl)ether, dibenz(a,h)anthracene,
hexachlorobenzene, hexachlorocyclopentadiene, and pentachlorophenol reporting limits to exceed their
respective screening levels. While not ideal, these reporting limits are considered acceptable for the
purposes of this project and do not change the conclusions of this report.

Alden Waterfront Park Supplemental Soil and Groundwater Investigation Burlington, VT The Johnson Company 15 July 12, 2017
The reporting limit for 2,6-dinitrotoluene in the soil samples was elevated to 0.4 mg/kg above the
standard reporting limit of 0.34 mg/kg. The laboratory indicated that the standard reporting limit assumes
that the mass of the analyzed sample is 100% dry weight. As the analyzed samples were below 100% dry
weight, ranging from 80%-88.8% dry weight due to moisture in the soil matrix (see the analytical
laboratory reports provided in Appendix B), the reporting limit was slightly elevated and rounded to a
reporting limit of 0.4 mg/kg. As with the elevated SVOC reporting limits discussed above, these
reporting limits are not ideal but are considered acceptable for the purposes of this project and do not
change the conclusions of this report.
3.6 QAPP DEVIATIONS
During the Phase II site investigation a few minor deviations from the approved site-specific
QAPP occurred and are described below. These deviations were discussed with VTDEC and the City of
Burlington and do not negatively impact the results of the investigation.
Two (2) additional soil borings, in addition to the 10 planned borings, were advanced at the Swale
and HDPE Drainage Pipe Area to better delineate the extent of the petroleum impacts at this AOC. A
second monitoring well was installed down-gradient of the Swale and HDPE Drainage Pipe Area in an
effort to better delineate the extent of the petroleum impacted groundwater related to this AOC. This
second down-gradient monitoring well at the Swale and HDPE Drainage Pipe Area was not described in
the site-specific QAPP; however, as no monitoring well was installed down gradient of the Wooden
Culvert/Walkway Area (a decision made based on the field screening results in accordance with the
QAPP), the additional monitoring well installed at the Swale and HDPE Drainage Pipe Area did not
change the total number of monitoring wells originally planned to be installed at the Site. The secondary
on-hold samples were not analyzed for the entire list of VOCs and SVOCs as described in the site-
specific QAPP. The VTDEC and JCO agreed that the on-hold samples could be analyzed for PAHs and
an abbreviated SVOC petroleum list as these compounds were the only compounds detected in the
“initial” samples at concentrations exceeding the RSLs and VDH SSVs.
In addition to the deviations described above, a number of the soil samples were collected from
below the apparent water table elevation in an effort to sample the most contaminated zone encountered
in the borings. This decision was made in the field due to the abnormally high water level encountered at

Alden Waterfront Park Supplemental Soil and Groundwater Investigation Burlington, VT The Johnson Company 16 July 12, 2017
the Site resulting from recent snowmelt and rainfall events. While this was a deviation from what was
proposed in the site-specific QAPP, it is not anticipated to significantly influence the conclusions of this
report.
4.0 CONCEPTUAL SITE MODEL
Fill was used to raise the grade of the Site in the mid-1800s to facilitate the expansion of railroad
tracks and to develop the waterfront for industrial use. Various industrial land uses at the Site included
timber storage, bulk fuel storage, a railroad yard, and an automotive junk/salvage yard which likely have
contributed to the impacted subsurface conditions encountered at the Site.
4.1 GEOLOGY AND HYDROGEOLOGY Soils encountered at the Site were generally gray sand ranging in composition to sand with trace
to some gravel and trace silt, indicative of marine sand. Bedrock was not encountered during subsurface
exploration at the Site. Soil boring logs describing the subsurface conditions can be found in Appendix
A.
Groundwater at the Site flows west toward Lake Champlain and was encountered from 2 to 4
fbgs (see Figure 4). Groundwater levels were generally constant during monitoring well development and
groundwater sampling indicating moderate to high hydraulic conductivity in the shallow, unconfined
aquifer.
Geologic maps, fracture trace maps, and cross-sections were not created for the Site as bedrock
was not encountered nor is it expected that contaminants have migrated vertically through the water
column. Soil borings extended no deeper than 14 fbgs and surficial soils encountered at the Site appear to
be relatively homogenous and are not expected to play a role in preferential spatiotemporal migration of
contaminants.
4.2 BLUE-GRAY SOIL AND BATTERY FRAGMENT AREA Lead was detected in one of the three monitoring wells installed at the Blue-Gray Soil and Battery
Fragment Area but was not detected above the VGES for lead. This suggests that lead contamination in
the soil at this area has not resulted in significant impacts to groundwater.

Alden Waterfront Park Supplemental Soil and Groundwater Investigation Burlington, VT The Johnson Company 17 July 12, 2017
4.3 SWALE AND HDPE DRAINAGE PIPE AREA A swale is present near the middle of the grassy area of the Site and runs from east to west,
curving north toward a storm drain. The eastern end of the swale is located near the area of greatest
impact within the Swale and HDPE Drainage Pipe Area which exhibited petroleum impacts at the
groundwater interface. Soil borings installed south and north of the swale and west of the area of greatest
impact identified petroleum odor and sheen in soils located within the groundwater smear zone in this
area. However, the profile of the compounds detected in soil (in particular the relative absence of the
lighter, more soluble constituents, such as benzene, toluene, and xylenes) as compared to naphthalene (a
heavier, less soluble constituent) and the relatively low groundwater concentrations are more consistent
with a weathered release (NOAA, 1977). This suggests that the contamination in this area pre-dates the
construction of the swale and is likely associated with the historic bulk petroleum storage operation.
4.4 WOODEN CULVERT WALKWAY AREA Contamination related to the Wooden Culvert/Walkway Area was not detected above screening
levels in the groundwater indicating that the defined extent of the impact is limited to PAHs in the soil at
this area.
4.5 SENSITIVE RECEPTORS The primary sensitive receptors to the Site are Lake Champlain located to the west and human
exposure via direct-contact/ingestion.
Groundwater in the vicinity of the Site is not used as a potable source of water, so groundwater
exposure to the general public is not a concern under the current and proposed reuse scenarios. Reported
detections in groundwater were less than one tenth of the applicable VGES concentrations. The low
concentrations of dissolved petroleum constituents in groundwater (none of which exceeded VGES) as
compared to more elevated soil data that corresponds with these areas of concern suggest that the
contamination in soil is not significantly contributing adversely to groundwater quality. Furthermore, the
detected concentrations of petroleum constituents in groundwater appear to be decreasing as groundwater
flows towards the Lake, which further supports that petroleum contamination is not reaching Lake
Champlain at concentrations above VGES.

Alden Waterfront Park Supplemental Soil and Groundwater Investigation Burlington, VT The Johnson Company 18 July 12, 2017
While numerous compounds were detected in soil samples above current residential RSLs namely
VOC petroleum compounds and PAHs, exposure pathways to the public from soil at the Site are limited
as the Site is overlain by a soil cap isolation barrier (VHB, 2016). Furthermore if the proposed urban
background value for PAHs is adopted, only 2 of the 22 locations sampled for PAHs would exceed that
value. Both of these samples were collected at depth and are therefore not representative of material that
presents a direct contact risk.
5.0 CONCLUSIONS
Based upon the data collected during the March and April 2017 investigation and on historical
data, JCO provides the following conclusions:
1. Blue-Gray Soil and Battery Fragment Area
Lead was only detected in one of three monitoring wells sampled at this AOC and the detected
concentration of lead did not exceed the VGES. This suggests that the lead concentrations in soil
encountered during the 2014 Phase 1a Burlington Bike Path construction have not resulted in
impacts to groundwater.
2. Swale and HDPE Drainage Pipe Area
The VOC and SVOC soil sample analysis found only “petroleum list” compounds and PAHs at
concentrations exceeding their respective residential RSLs or SSVs. Only two VOC compounds
exceeded their respective residential RSLs or VDH SSVs. The PAH analytical results (as
summarized by the BAP-TEQ) indicated that the majority of the sampled soil at this AOC had
BAP-TEQ concentrations exceeding the current residential RSL and VDH SSV; however, the
BaP-TEQ concentrations of all soil samples were below the proposed urban background value of
0.58 mg/kg. Based on soil analytical results, the majority of petroleum and PAH impacts were
found at depths between 0.6 fbgs and 3 fbgs; however, visual/olfactory evidence suggest that this
impacted soil zone may extend to depths associated with the seasonal fluctuation of groundwater
elevation (often referred to as the “smear zone”). Sheens were noted on soil at the apparent water
table; however, it should be noted that no sheens or odors were noted on purge water during
groundwater sampling.

Alden Waterfront Park Supplemental Soil and Groundwater Investigation Burlington, VT The Johnson Company 19 July 12, 2017
Groundwater sampling analytical results indicated that no VOC or SVOC compounds exceeded
their respective VGES. This may be indicative of a highly weathered petroleum release where
the lighter, more soluble, constituents have attenuated, leaving a smear zone of the heavier, less
soluble constituents. The results also suggest that groundwater at the Site is not impacted above
VGES and that the petroleum contamination at the Site is not migrating to Lake Champlain at
concentrations above VGES.
3. Wooden Culvert/Walkway Area
Based on the SVOC soil sampling analytical results, PAH concentrations (as summarized by the
BaP-TEQ) exceeded the residential RSL and SSV at all locations; however, only two of the five
samples exceeded the proposed urban background value of 0.58 mg/kg. These two exceedances
included the centrally located primary sample location that VHB identified. The PAH
concentrations identified at sample locations surrounding the primary sample were between one
and three orders of magnitude lower and therefore suggesting the extent of impact is better
defined. Also, groundwater sampling results indicated that no SVOC compounds exceeded their
respective VGES; therefore, PAH impacts associated with the soil do not appear to be adversely
impacting groundwater quality in this area.
4. Groundwater
Groundwater sampling analytical results indicate that Site groundwater is not impacted above
VGES values.
5. Site Visitor Exposure Risk
The elevated PAH concentrations detected in the soils at the Site are likely a result of historic
industrial usage of the Site and/or the use of imported fill to raise the grade of the Site. The soil
cap that was reportedly installed over the Site in the 1990’s (VHB, 2016) acts to reduce the
exposure risk to humans.

Alden Waterfront Park Supplemental Soil and Groundwater Investigation Burlington, VT The Johnson Company 20 July 12, 2017
6.0 LIMITATIONS
This information is intended for the use of BPRW and CCRPC for the specific purpose of documenting the Phase II Supplemental Soil and Groundwater Investigation at the Alden Waterfront Park site in Burlington, Vermont. No other uses, expressed or implied, are warranted. The implementation of the site-specific QAPP was based on sound scientific techniques and experience with similar investigations. However, the conclusions of this assessment are based on limited information. Should additional information become available pertaining to environmental concerns, JCO reserves the right to re-evaluate conclusions made herein.
The conclusions of this report were derived from information provided to JCO from the following sources: VTDEC; BPRW; and EAI. Independent verification of the work performed by others was not always possible; therefore its accuracy and reliability cannot be warranted.
This report was prepared pursuant to Agreements between BPRW, CCRPC, and JCO. All uses of this report are subject to the conditions and restrictions contained in the Agreements. The observations and investigations described in this report are based solely on the Scope of Services provided pursuant to the Agreement and subsequent amendments. JCO shall not be liable for the existence of any condition the discovery of which would have required the performance of services not authorized under the Agreement. This work has been undertaken in accordance with generally accepted consulting practices. No other warranty, expressed or implied, is made.
This report reflects Site conditions observed and described by records available to JCO as of the date of report preparation. The passage of time may result in significant changes in Site conditions, technology, or economic conditions, which could alter the findings and/or recommendations of the report. Accordingly, the Clients (BPRW and CCRPC) and any other party to whom the report is provided recognize and agree that JCO shall bear no liability for deviations from observed conditions or available records after the time of report preparation.

Alden Waterfront Park Supplemental Soil and Groundwater Investigation Burlington, VT The Johnson Company 21 July 12, 2017
REFERENCES Curl, 1977; Herbert Curl, Jr., Kevin O’Donnell, “NOAA Technical Memorandum ERL MESA-17 -
Chemical and Physical Properties of Refined Petroleum Products”, Section 1.2, October 1977.
VHB, 2016; Vanasse Hangen Brustlin, Inc., “Burlington Bike Path Rehabilitation Project - Phase 1b
Corrective Action Plan,” April 18, 2016.
WHN, 1992; Wagner, Heindel, and Noyes, Inc., “Burlington Waterfront Park Phase II Site - Soil
Characterization Study,” May 1, 1992.
Weston, 1986; Roy F. Weston, Inc., “Report on On-shore and Off-shore Subsurface Investigation, Central
Vermont Railway Option Property, Burlington, Vermont,” April 25, 1986.

TABLES

Notes SheetAlden Waterfront Park, Burlington, VT
Page 1 of 1
The following acronyms are applicable to the text and/or tablesAcronyms
--- = Value Not Available or Not CalculatedBaP = Benzo(a)pyreneDup = DuplicateEAI = Eastern Analytical of Manchester, New HampshireIND = USEPA Industrial RSL
IROCP = VDH Investigation and Remediation of Contaminated Properties, April 5, 2012PCB = Polychlorinated BiphenylPAH = Polycyclic Aromatic HydrocarbonPID = Photoionization DetectorRES = USEPA Residential RSLRPD = Relative Percent Difference (not calculated where one or both results are non-detect)RSL = USEPA Regional Screening Level, May 2016
SB = Soil BoringSIM = Selective Ion MonitoringSSL = VDH Soil Screening Level from the IROCP. If available, SSL trumps residential RSLSU = Standard Unit
SVOC = Semi-Volatile Organic CompoundTCLP = Toxicity Characteristic Leaching Procedure
TEF = Toxicity Equivalence Factors, World Health Organization, 2005TEQ = Toxicity Equivalency (calculated from toxicity equivalence factors)TPH = Total Petroleum Hydrocarbon
USEPA = United States Environmental Protection AgencyVDH = Vermont Department of Health
VGES = Vermont Groundwater Enforcement StandardsVOC = Volatile Organic Compound
Comp = Composite SampleNA = Not Analyzed
Cell & Text ShadingBold =
a) Residential RSL, orb) SSV (when applicable)
Black w/ White Text = Analytical Value exceeds: a) Industrial RSL
Grey Text = Analytical Result: value is non-detect
Data Results and Qualifiers< = not detected, value given is the laboratory reporting limit
Unitsfbgs = feet below ground surface
ft = feetmg/kg = milligrams per kilogram
ug/L = micrograms per litermg/L = milligrams per liter
Analytical Value exceeds:

Table 1 - Groundwater Measurements and Monitoring Well DesignAlden Waterfront Park, Burlington, VT
Page 1 of 1
WellTop of Casing
Elev. (ft)Total Depth
(fbtoc)Screened Interval
(fbtoc)
Depth to Groundwater
(fbtoc)*Water Level
Elevation (ft)*PID Headspace
(ppmV)*MW-1 102.42 12.83 2.83 - 12.83 2.22 100.20 0.0MW-2 102.73 12.81 2.81 - 12.81 2.52 100.21 0.0MW-3 104.38 11.75 1.75 - 11.75 2.80 101.58 0.0MW-4 104.11 12.63 2.63 - 12.63 1.90 102.21 0.0MW-5 104.18 11.65 1.65 - 11.65 2.24 101.94 0.0MW-6 104.16 11.72 1.72 - 11.72 2.85 101.31 0.0MW-7 105.38 11.70 1.70 - 11.70 4.24 101.14 0.0MW-8 103.90 11.60 1.60 - 11.60 2.94 100.96 2.4GD-12 103.31 NA NA 2.51 100.80 0.0
NOTES:*Measurements taken on 04/10/17**Lake Champlain surface elevation averaged over groundwater measurement time interval on 04/10/17 was 98.96 feet above the National Geodetic Vertical Datum (NGVD) 1929Lake Champlain surface elevation data source: https://waterdata.usgs.gov/usa/nwis/uv?04294500Elevations are relative to the NGVD 1929fbtoc : feet below top of casingPID: photoionization detector

Table 2 - Soil VOC Analytical ResultsAlden Waterfront Park, Burlington, VT
See Notes Sheet for Acronym, Units, and Shading Definitions, etc Page 1 of 2
JCO-SB-03 JCO-SB-07 JCO-SB-09 JCO-SB-10 JCO-SB-11 Trip Blank EB-Soil(2-3) (6-7) (5.5-6.5) (1.8-2.8) (6-7)
3/28/2017 3/28/2017 3/28/2017 3/28/2017 3/28/2017 3/28/2017 3/28/2017 3/28/2017 3/28/2017 3/28/2017 3/28/2017 3/28/2017 3/29/2017 3/29/2017 3/29/2017JCO-SB-03
Ind Res SSV (2-3) RPD1,1,1,2-Tetrachloroethane 8.8 2 --- mg/kg < 0.2 < 0.05 --- < 0.2 < 0.3 < 0.05 < 0.08 < 0.05 < 21,1,1-Trichloroethane 36000 8100 --- mg/kg < 0.2 < 0.05 --- < 0.2 < 0.3 < 0.05 < 0.08 < 0.05 < 21,1,2,2-Tetrachloroethane 2.7 0.6 --- mg/kg < 0.2 < 0.05 --- < 0.2 < 0.3 < 0.05 < 0.08 < 0.05 < 21,1,2-Trichloroethane 5 1.1 --- mg/kg < 0.2 < 0.05 --- < 0.2 < 0.3 < 0.05 < 0.08 < 0.05 < 21,1-Dichloroethane 16 3.6 --- mg/kg < 0.2 < 0.05 --- < 0.2 < 0.3 < 0.05 < 0.08 < 0.05 < 21,1-Dichloroethene 1000 230 --- mg/kg < 0.2 < 0.05 --- < 0.2 < 0.3 < 0.05 < 0.08 < 0.05 < 11,1-Dichloropropene --- --- --- mg/kg < 0.2 < 0.05 --- < 0.2 < 0.3 < 0.05 < 0.08 < 0.05 < 21,2,3-Trichlorobenzene 930 63 --- mg/kg < 0.2 < 0.05 --- < 0.2 < 0.3 < 0.05 < 0.08 < 0.05 < 11,2,3-Trichloropropane 0.11 0.0051 0.00313 mg/kg < 0.2 < 0.05 --- < 0.2 < 0.3 < 0.05 < 0.08 < 0.05 < 21,2,4-Trichlorobenzene 110 24 --- mg/kg < 0.2 < 0.05 --- < 0.2 < 0.3 < 0.05 < 0.08 < 0.05 < 11,2-Dibromo-3-chloropropane 0.064 0.0053 --- mg/kg < 0.2 < 0.05 --- < 0.2 < 0.3 < 0.05 < 0.08 < 0.05 < 11,2-Dichlorobenzene 9300 1800 --- mg/kg < 0.2 < 0.05 --- < 0.2 < 0.3 < 0.05 < 0.08 < 0.05 < 11,2-Dichloropropane 4.4 1 --- mg/kg < 0.2 < 0.05 --- < 0.2 < 0.3 < 0.05 < 0.08 < 0.05 < 21,3-Dichlorobenzene --- --- --- mg/kg < 0.2 < 0.05 --- < 0.2 < 0.3 < 0.05 < 0.08 < 0.05 < 11,3-Dichloropropane 23000 1600 --- mg/kg < 0.2 < 0.05 --- < 0.2 < 0.3 < 0.05 < 0.08 < 0.05 < 21,4-Dichlorobenzene 11 2.6 --- mg/kg < 0.2 < 0.05 --- < 0.2 < 0.3 < 0.05 < 0.08 < 0.05 < 12,2-Dichloropropane --- --- --- mg/kg < 0.2 < 0.05 --- < 0.2 < 0.3 < 0.05 < 0.08 < 0.05 < 22-Butanone(MEK) 190000 27000 25,400 mg/kg < 2 < 0.5 --- < 2 < 3 < 0.5 < 0.8 < 0.5 < 102-Chlorotoluene 23000 1600 --- mg/kg < 0.2 < 0.05 --- < 0.2 < 0.3 < 0.05 < 0.08 < 0.05 < 22-Hexanone 1300 200 --- mg/kg < 0.4 < 0.1 --- < 0.4 < 0.7 < 0.1 < 0.2 < 0.1 < 104-Chlorotoluene 23000 1600 --- mg/kg < 0.2 < 0.05 --- < 0.2 < 0.3 < 0.05 < 0.08 < 0.05 < 24-Methyl-2-pentanone(MIBK) 140000 33000 --- mg/kg < 2 < 0.5 --- < 2 < 3 < 0.5 < 0.8 < 0.5 < 10Acetone 670000 61000 --- mg/kg < 8 < 2 --- < 8 < 10 < 2 < 3 < 2 < 10Bromobenzene 1800 290 --- mg/kg < 0.2 < 0.05 --- < 0.2 < 0.3 < 0.05 < 0.08 < 0.05 < 2Bromochloromethane 630 150 --- mg/kg < 0.2 < 0.05 --- < 0.2 < 0.3 < 0.05 < 0.08 < 0.05 < 2Bromodichloromethane 103 0.29 --- mg/kg < 0.2 < 0.05 --- < 0.2 < 0.3 < 0.05 < 0.08 < 0.05 < 1Bromoform 86 19 --- mg/kg < 0.2 < 0.05 --- < 0.2 < 0.3 < 0.05 < 0.08 < 0.05 < 2Bromomethane 30 6.8 --- mg/kg < 0.4 < 0.1 --- < 0.4 < 0.7 < 0.1 < 0.2 < 0.1 < 2Carbon disulfide 3500 770 --- mg/kg < 0.4 < 0.1 --- < 0.4 < 0.7 < 0.1 < 0.2 < 0.1 < 5Carbon tetrachloride 2.9 0.65 0.265 mg/kg < 0.2 < 0.05 --- < 0.2 < 0.3 < 0.05 < 0.08 < 0.05 < 2Chlorobenzene 1300 280 --- mg/kg < 0.2 < 0.05 --- < 0.2 < 0.3 < 0.05 < 0.08 < 0.05 < 2Chloroethane 57000 14000 --- mg/kg < 0.4 < 0.1 --- < 0.4 < 0.7 < 0.1 < 0.2 < 0.1 < 5Chloroform 1.4 0.32 --- mg/kg < 0.2 < 0.05 --- < 0.2 < 0.3 < 0.05 < 0.08 < 0.05 < 2Chloromethane 460 110 --- mg/kg < 0.4 < 0.1 --- < 0.4 < 0.7 < 0.1 < 0.2 < 0.1 < 2cis-1,2-Dichloroethene 2300 160 135 mg/kg < 0.2 < 0.05 --- < 0.2 < 0.3 < 0.05 < 0.08 < 0.05 < 2cis-1,3-Dichloropropene --- --- --- mg/kg < 0.2 < 0.05 --- < 0.2 < 0.3 < 0.05 < 0.08 < 0.05 < 1Dibromochloromethane 39 8.3 --- mg/kg < 0.2 < 0.05 --- < 0.2 < 0.3 < 0.05 < 0.08 < 0.05 < 2Dibromomethane 99 24 --- mg/kg < 0.2 < 0.05 --- < 0.2 < 0.3 < 0.05 < 0.08 < 0.05 < 2Dichlorodifluoromethane 370 87 --- mg/kg < 0.4 < 0.1 --- < 0.4 < 0.7 < 0.1 < 0.2 < 0.1 < 5Diethyl Ether 230000 16000 --- mg/kg < 0.2 < 0.05 --- < 0.2 < 0.3 < 0.05 < 0.08 < 0.05 < 5Hexachlorobutadiene 5.3 1.2 --- mg/kg < 0.2 < 0.05 --- < 0.2 < 0.3 < 0.05 < 0.08 < 0.05 < 1IsoPropylbenzene 9900 1900 --- mg/kg 1.7 1.7 0% 0.7 0.7 0.2 0.99 < 0.05 < 1Methylene chloride 1000 57 --- mg/kg < 0.4 < 0.1 --- < 0.4 < 0.7 < 0.1 < 0.2 < 0.1 < 5n-Butylbenzene 58000 3900 --- mg/kg 5.2 4.9 6% 1 2 0.69 1.7 < 0.05 < 1n-Propylbenzene 24000 3800 --- mg/kg 5.8 4.8 19% 1.2 1.1 0.36 1.1 < 0.05 < 1p-Isopropyltoluene --- --- --- mg/kg < 0.2 < 0.05 --- 0.7 1 0.1 < 0.08 < 0.05 < 1sec-Butylbenzene 120000 7800 --- mg/kg 1.9 2.2 15% 0.4 1.1 0.42 1.3 < 0.05 < 1Styrene 35000 6000 --- mg/kg < 0.2 < 0.05 --- < 0.2 < 0.3 < 0.05 < 0.08 < 0.05 < 1tert-Butylbenzene 120000 7800 --- mg/kg 0.2 0.22 10% < 0.2 < 0.3 0.09 0.16 < 0.05 < 1Tetrachloroethene 100 124 1.57 mg/kg < 0.2 < 0.05 --- < 0.2 < 0.3 < 0.05 < 0.08 < 0.05 < 2
Sample ID:Sample Depth:Sample Date:
AnalyteScreening Level
Units
JCO-SB-Dup-01
JCO-SB-01 (0.6-1.6)
JCO-SB-02 (1.4-2.4)
JCO-SB-06 (6-7)
JCO-SB-08 (1.9-2.9)
JCO-MW-7 (6-7)
NA NA NANA NA
JCO-SB-04 (1.8-2.8)
JCO-SB-05 (1.8-2.8)
NA NA

Table 2 - Soil VOC Analytical ResultsAlden Waterfront Park, Burlington, VT
See Notes Sheet for Acronym, Units, and Shading Definitions, etc Page 2 of 2
JCO-SB-03 JCO-SB-07 JCO-SB-09 JCO-SB-10 JCO-SB-11 Trip Blank EB-Soil(2-3) (6-7) (5.5-6.5) (1.8-2.8) (6-7)
3/28/2017 3/28/2017 3/28/2017 3/28/2017 3/28/2017 3/28/2017 3/28/2017 3/28/2017 3/28/2017 3/28/2017 3/28/2017 3/28/2017 3/29/2017 3/29/2017 3/29/2017JCO-SB-03
Ind Res SSV (2-3) RPD
Sample ID:Sample Depth:Sample Date:
AnalyteScreening Level
Units
JCO-SB-Dup-01
JCO-SB-01 (0.6-1.6)
JCO-SB-02 (1.4-2.4)
JCO-SB-06 (6-7)
JCO-SB-08 (1.9-2.9)
JCO-MW-7 (6-7)
JCO-SB-04 (1.8-2.8)
JCO-SB-05 (1.8-2.8)
Tetrahydrofuran(THF) 94000 18000 --- mg/kg < 2 < 0.5 --- < 2 < 3 < 0.5 < 0.8 < 0.5 < 10trans-1,2-Dichloroethene 23000 1600 150 mg/kg < 0.2 < 0.05 --- < 0.2 < 0.3 < 0.05 < 0.08 < 0.05 < 2trans-1,3-Dichloropropene --- --- --- mg/kg < 0.2 < 0.05 --- < 0.2 < 0.3 < 0.05 < 0.08 < 0.05 < 1Trichloroethene 6 0.94 0.471 mg/kg < 0.2 < 0.05 --- < 0.2 < 0.3 < 0.05 < 0.08 < 0.05 < 2Trichlorofluoromethane 350000 23000 --- mg/kg < 0.4 < 0.1 --- < 0.4 < 0.7 < 0.1 < 0.2 < 0.1 < 5Vinyl chloride 1.7 0.059 --- mg/kg < 0.4 < 0.1 --- < 0.4 < 0.7 < 0.1 < 0.2 < 0.1 < 21,2,4-Trimethylbenzene 240 58 41.6 mg/kg < 0.05 37 42 16E 90% < 0.05 < 0.05 < 0.05 11 < 0.05 14 7.3 8.4 24 < 0.05 < 11,2-Dibromoethane(EDB) 0.16 0.036 --- mg/kg < 0.05 < 0.4 < 0.2 < 0.05 --- < 0.05 < 0.05 < 0.05 < 0.2 < 0.05 < 0.3 < 0.05 < 0.08 < 0.4 < 0.05 < 11,2-Dichloroethane 2 0.46 --- mg/kg < 0.05 < 0.4 < 0.2 < 0.05 --- < 0.05 < 0.05 < 0.05 < 0.2 < 0.05 < 0.3 < 0.05 < 0.08 < 0.4 < 0.05 < 21,3,5-Trimethylbenzene --- --- 35.1 mg/kg < 0.05 16 0.4 < 0.05 --- < 0.05 < 0.05 < 0.05 0.7 < 0.05 0.7 < 0.05 < 0.08 7.4 < 0.05 < 1Benzene 5.1 1.2 0.471 mg/kg < 0.05 < 0.4 < 0.2 < 0.05 --- < 0.05 < 0.05 < 0.05 < 0.2 < 0.05 < 0.3 < 0.05 < 0.08 < 0.4 < 0.05 < 1Ethylbenzene 25 5.8 --- mg/kg < 0.05 0.6 0.3 0.15 67% < 0.05 < 0.05 < 0.05 1.8 < 0.05 0.4 0.39 < 0.08 < 0.4 < 0.05 < 1Methyl-t-butyl ether(MTBE) 210 47 647 mg/kg < 0.1 < 0.7 < 0.4 < 0.1 --- < 0.1 < 0.1 < 0.1 < 0.4 < 0.1 < 0.7 < 0.1 < 0.2 < 0.7 < 0.1 < 5mp-Xylene 2400 550 --- mg/kg < 0.05 1.7 < 0.2 0.1 --- < 0.05 < 0.05 < 0.05 0.3 < 0.05 < 0.3 < 0.05 < 0.08 0.9 < 0.05 < 1Naphthalene 17 3.8 1.53 mg/kg < 0.1 11 1.7 1.1 43% < 0.1 < 0.1 < 0.1 < 0.4 < 0.1 < 0.7 1.8 < 0.2 < 0.7 < 0.1 < 5o-Xylene 2800 650 --- mg/kg < 0.05 < 0.4 < 0.2 0.18 --- < 0.05 < 0.05 < 0.05 < 0.2 < 0.05 < 0.3 0.06 < 0.08 < 0.4 < 0.05 < 1Toluene 47000 4900 --- mg/kg < 0.05 < 0.4 < 0.2 < 0.05 --- < 0.05 < 0.05 < 0.05 < 0.2 < 0.05 < 0.3 < 0.05 < 0.08 < 0.4 < 0.05 < 1Note:
NA NA NANA NA
E: The reported value exceeded 15 mg/kg, which was the concentration of the largest calibration standard. Extrapolation of the calibration curve was employed to obtain the reported value. The parent sample was diluted 4x to achieve the reported 42 mg/kg for 1,2,4-Trimethylbenzene.
NA NA

Table 3 - Soil SVOC Analytical ResultsAlden Waterfront Park, Burlington, VT
See Notes Sheet for Acronym, Units, and Shading Definitions, etc Page 1 of 4
JCO-SB-03 JCO-SB-07 JCO-SB-09 JCO-SB-10 JCO-SB-11(2-3) (6-7) (5.5-6.5) (1.8-2.8) (6-7)
3/28/2017 3/28/2017 3/28/2017 3/28/2017 3/28/2017 3/28/2017 3/28/2017 3/28/2017 3/28/2017 3/28/2017 3/28/2017 3/28/2017
Ind. Res. SSV RPD1,2,4-Trichlorobenzene 110 24 --- 0 mg/kg < 0.9 < 0.8 --- < 0.09 < 0.8 < 0.08 < 0.81,2-Dichlorobenzene 9300 1800 --- 0 mg/kg < 0.9 < 0.8 --- < 0.09 < 0.8 < 0.08 < 0.81,3-Dichlorobenzene --- --- --- 0 mg/kg < 0.9 < 0.8 --- < 0.09 < 0.8 < 0.08 < 0.81,4-Dichlorobenzene 11 2.6 --- 0 mg/kg < 0.9 < 0.8 --- < 0.09 < 0.8 < 0.08 < 0.82,3-Dichloroaniline --- --- --- 0 mg/kg < 0.9 < 0.8 --- < 0.09 < 0.8 < 0.08 < 0.82,4,5-Trichlorophenol 82000 6300 --- 0 mg/kg < 0.9 < 0.8 --- < 0.09 < 0.8 < 0.08 < 0.82,4,6-Trichlorophenol 210 49 --- 0 mg/kg < 0.9 < 0.8 --- < 0.09 < 0.8 < 0.08 < 0.82,4-Dichlorophenol 2500 190 --- 0 mg/kg < 0.9 < 0.8 --- < 0.09 < 0.8 < 0.08 < 0.82,4-Dimethylphenol 16000 1300 --- 0 mg/kg < 0.9 < 0.8 --- < 0.09 < 0.8 < 0.08 < 0.82,4-Dinitrophenol 1600 130 --- 0 mg/kg < 9 < 8 --- < 0.8 < 8 < 0.8 < 72,4-Dinitrotoluene 7.4 1.7 --- 0 mg/kg < 4 < 4 --- < 0.4 < 4 < 0.4 < 42,6-Dinitrotoluene 1.5 0.36 --- 0 mg/kg < 4 < 4 --- < 0.4 < 4 < 0.4 < 42-Chloronaphthalene 60000 4800 --- 0 mg/kg < 0.9 < 0.8 --- < 0.09 < 0.8 < 0.08 < 0.82-Chlorophenol 5800 390 --- 0 mg/kg < 0.9 < 0.8 --- < 0.09 < 0.8 < 0.08 < 0.82-Methylphenol 41000 3200 --- 0 mg/kg < 0.9 < 0.8 --- < 0.09 < 0.8 < 0.08 < 0.82-Nitroaniline 8000 630 --- 0 mg/kg < 4 < 4 --- < 0.4 < 4 < 0.4 < 42-Nitrophenol --- --- --- 0 mg/kg < 4 < 4 --- < 0.4 < 4 < 0.4 < 43,3'-Dichlorobenzidine 5.1 1.2 --- 0 mg/kg < 0.9 < 0.8 --- < 0.09 < 0.8 < 0.08 < 0.83/4-Methylphenol 41000 3200 --- 0 mg/kg < 0.9 < 0.8 --- < 0.09 < 0.8 < 0.08 < 0.83-Nitroaniline --- --- --- 0 mg/kg < 4 < 4 --- < 0.4 < 4 < 0.4 < 44,6-Dinitro-2-methylphenol 66 5.1 --- 0 mg/kg < 4 < 4 --- < 0.4 < 4 < 0.4 < 44-Bromophenyl-phenylether --- --- --- 0 mg/kg < 0.9 < 0.8 --- < 0.09 < 0.8 < 0.08 < 0.84-Chloro-3-methylphenol 82000 6300 --- 0 mg/kg < 0.9 < 0.8 --- < 0.09 < 0.8 < 0.08 < 0.84-Chloroaniline 11 2.7 --- 0 mg/kg < 0.9 < 0.8 --- < 0.09 < 0.8 < 0.08 < 0.84-Chlorophenyl-phenylether --- --- --- 0 mg/kg < 0.9 < 0.8 --- < 0.09 < 0.8 < 0.08 < 0.84-Nitroaniline 110 27 --- 0 mg/kg < 4 < 4 --- < 0.4 < 4 < 0.4 < 44-Nitrophenol --- --- --- 0 mg/kg < 4 < 4 --- < 0.4 < 4 < 0.4 < 4Acetophenone 120000 7800 --- 0 mg/kg < 0.9 < 0.8 --- < 0.09 < 0.8 < 0.08 < 0.8alpha-Terpineol --- --- --- 0 mg/kg < 0.9 < 0.8 --- < 0.09 < 0.8 < 0.08 < 0.8Aniline 400 95 --- 0 mg/kg < 0.9 < 0.8 --- < 0.09 < 0.8 < 0.08 < 0.8Azobenzene 26 5.6 --- 0 mg/kg < 0.9 < 0.8 --- < 0.09 < 0.8 < 0.08 < 0.8Benzidine (estimated) 0.01 0.00053 --- 0 mg/kg < 4 < 4 --- < 0.4 < 4 < 0.4 < 4Benzoic Acid 3300000 250000 --- 0 mg/kg < 40 < 40 --- < 4 < 40 < 4 < 40Benzyl alcohol 82000 6300 --- 0 mg/kg < 9 < 8 --- < 0.8 < 8 < 0.8 < 7bis(2-Chloroethoxy)methane 2500 190 --- 0 mg/kg < 0.9 < 0.8 --- < 0.09 < 0.8 < 0.08 < 0.8bis(2-Chloroethyl)ether 1 0.23 --- 0 mg/kg < 0.9 < 0.8 --- < 0.09 < 0.8 < 0.08 < 0.8bis(2-chloroisopropyl)ether 47000 3100 --- 0 mg/kg < 0.9 < 0.8 --- < 0.09 < 0.8 < 0.08 < 0.8bis(2-Ethylhexyl)phthalate 160 39 19.2 0 mg/kg < 4 < 4 --- < 0.4 < 4 < 0.4 < 4Butylbenzylphthalate 1200 290 --- 0 mg/kg < 4 < 4 --- < 0.4 < 4 < 0.4 < 4Carbazole --- --- --- 0 mg/kg < 0.9 < 0.8 --- < 0.09 < 0.8 < 0.08 < 0.8Dibenzofuran 1000 73 --- 0 mg/kg 3.2 2.8 13% 1.1 4.3 1.6 5.5Diethylphthalate 660000 51000 --- 0 mg/kg < 4 < 4 --- < 0.4 < 4 < 0.4 < 4Dimethylphthalate --- --- --- 0 mg/kg < 0.9 < 0.8 --- < 0.09 < 0.8 < 0.08 < 0.8Di-n-butylphthalate 82000 6300 --- 0 mg/kg < 4 < 4 --- < 0.4 < 4 < 0.4 < 4Di-n-octylphthalate 8200 630 --- 0 mg/kg < 4 < 4 --- < 0.4 < 4 < 0.4 < 4Hexachlorobenzene 0.96 0.21 0.17 0 mg/kg < 0.9 < 0.8 --- < 0.09 < 0.8 < 0.08 < 0.8Hexachlorobutadiene 5.3 1.2 --- 0 mg/kg < 0.9 < 0.8 --- < 0.09 < 0.8 < 0.08 < 0.8Hexachlorocyclopentadiene 7.5 1.8 --- 0 mg/kg < 4 < 4 --- < 0.4 < 4 < 0.4 < 4Hexachloroethane 8 1.8 --- 0 mg/kg < 0.9 < 0.8 --- < 0.09 < 0.8 < 0.08 < 0.8Isophorone 2400 570 --- 0 mg/kg < 0.9 < 0.8 --- < 0.09 < 0.8 < 0.08 < 0.8
Sample ID:Sample Depth:Sample Date:
AnalyteScreening Level BaP
TEF Units
JCO-SB-Dup-01
JCO-SB-03 (2-3)
JCO-SB-01 (0.6-1.6)
JCO-SB-02 (1.4-2.4)
JCO-SB-04 (1.8-2.8)
JCO-SB-05 (1.8-2.8)
JCO-SB-06 (6-7)
JCO-SB-08 (1.9-2.9)
NANA NA NA NA NA

Table 3 - Soil SVOC Analytical ResultsAlden Waterfront Park, Burlington, VT
See Notes Sheet for Acronym, Units, and Shading Definitions, etc Page 2 of 4
JCO-SB-03 JCO-SB-07 JCO-SB-09 JCO-SB-10 JCO-SB-11(2-3) (6-7) (5.5-6.5) (1.8-2.8) (6-7)
3/28/2017 3/28/2017 3/28/2017 3/28/2017 3/28/2017 3/28/2017 3/28/2017 3/28/2017 3/28/2017 3/28/2017 3/28/2017 3/28/2017
Ind. Res. SSV RPD
Sample ID:Sample Depth:Sample Date:
AnalyteScreening Level BaP
TEF Units
JCO-SB-Dup-01
JCO-SB-03 (2-3)
JCO-SB-01 (0.6-1.6)
JCO-SB-02 (1.4-2.4)
JCO-SB-04 (1.8-2.8)
JCO-SB-05 (1.8-2.8)
JCO-SB-06 (6-7)
JCO-SB-08 (1.9-2.9)
Nitrobenzene 22 5.1 --- 0 mg/kg < 0.9 < 0.8 --- < 0.09 < 0.8 < 0.08 < 0.8N-Nitrosodimethylamine 0.034 0.002 --- 0 mg/kg < 0.9 < 0.8 --- < 0.09 < 0.8 < 0.08 < 0.8n-Nitroso-di-n-propylamine 0.33 0.078 --- 0 mg/kg < 0.9 < 0.8 --- < 0.09 < 0.8 < 0.08 < 0.8n-Nitrosodiphenylamine 470 110 --- 0 mg/kg < 0.9 < 0.8 --- < 0.09 < 0.8 < 0.08 < 0.8Pentachlorophenol 4 1 0.46 0 mg/kg < 4 < 4 --- < 0.4 < 4 < 0.4 < 4Phenol 250000 19000 --- 0 mg/kg < 0.9 < 0.8 --- < 0.09 < 0.8 < 0.08 < 0.8Pyridine 1200 78 --- 0 mg/kg < 4 < 4 --- < 0.4 < 4 < 0.4 < 41-Methylnaphthalene 73 18 --- 0 mg/kg 0.27 28 78 65 18% 0.13 0.58 0.078 13 < 0.008 42 23 542-Methylnaphthalene 3000 240 --- 0 mg/kg 0.47 32 40 36 11% 0.37 0.53 0.13 0.16 < 0.008 57 27 0.55Acenaphthene 45000 3600 --- 0 mg/kg < 0.009 0.47 1.2 0.85 34% 0.019 0.019 0.024 1 < 0.008 4.8 2.2 5.6Acenaphthylene --- --- --- 0 mg/kg 0.034 0.49 1.5 1.3 14% 0.03 0.089 0.023 0.32 < 0.008 1.4 < 0.008 1.7Anthracene 230000 18000 --- 0 mg/kg 0.034 0.049 0.15 0.16 6% 0.084 0.079 0.082 0.45 < 0.008 1.9 1.1 2.4Benzo[a]anthracene 2.9 0.16 --- 0.10 mg/kg 0.12 0.0087 0.14 0.14 0% 0.0083 0.32 0.031 < 0.008 < 0.008 < 0.08 < 0.008 < 0.07Benzo[a]pyrene 0.29 0.016 0.01 1.00 mg/kg 0.1 < 0.008 0.097 0.1 3% < 0.008 0.3 0.026 < 0.008 < 0.008 < 0.08 < 0.008 < 0.07Benzo[b]fluoranthene 2.9 0.16 --- 0.10 mg/kg 0.2 0.0085 0.28 0.28 0% 0.015 0.54 0.046 < 0.008 < 0.008 < 0.08 < 0.008 < 0.07Benzo[g,h,i]perylene --- --- --- 0 mg/kg 0.13 < 0.008 0.23 0.25 8% 0.022 0.32 0.027 < 0.008 < 0.008 < 0.08 < 0.008 < 0.07Benzo[k]fluoranthene 29 1.6 --- 0.01 mg/kg 0.055 < 0.008 < 0.09 < 0.08 --- < 0.008 0.16 0.015 < 0.008 < 0.008 < 0.08 < 0.008 < 0.07Chrysene 290 16 --- 0.01 mg/kg 0.23 < 0.008 0.28 0.26 7% 0.013 0.54 0.042 < 0.008 < 0.008 < 0.08 0.01 < 0.07Dibenz[a,h]anthracene 0.29 0.016 --- 1.00 mg/kg 0.036 < 0.008 < 0.09 < 0.08 --- < 0.008 0.097 < 0.008 < 0.008 < 0.008 < 0.08 < 0.008 < 0.07Fluoranthene 30000 2400 --- 0 mg/kg 0.2 0.02 0.28 0.27 4% 0.012 0.5 0.083 0.1 < 0.008 0.55 0.28 0.55Fluorene 30000 2400 --- 0 mg/kg 0.018 1.3 3.3 3 10% 0.037 0.038 0.092 1.8 < 0.008 8.5 3.4 10Indeno[1,2,3-cd]pyrene 2.9 0.16 --- 0.10 mg/kg 0.12 < 0.008 0.21 0.23 9% 0.022 0.32 0.03 < 0.008 < 0.008 < 0.08 < 0.008 < 0.07Naphthalene 17 3.8 1.53 0 mg/kg 0.2 3.8 30 26 14% 0.12 0.33 0.048 0.13 < 0.008 0.39 2 1.8Phenanthrene --- --- --- 0 mg/kg 0.33 0.31 1.8 1.6 12% 0.11 0.67 0.071 4.9 < 0.008 22 13 26Pyrene 23000 1800 --- 0 mg/kg 0.16 0.017 0.21 0.21 0% 0.028 0.42 0.081 0.13 < 0.008 0.8 0.38 0.83
BaP TEQ 0.29 0.016 0.01 --- mg/kg 0.183 0.01 0.208 0.208 0% 0.013 0.522 0.041 0.009 0.009 0.093 0.009 0.081
NANA NA NA NA NA

Table 3 - Soil SVOC Analytical ResultsAlden Waterfront Park, Burlington, VT
See Notes Sheet for Acronym, Units, and Shading Definitions, etc Page 3 of 4
Ind. Res. SSV1,2,4-Trichlorobenzene 110 24 --- 0 mg/kg1,2-Dichlorobenzene 9300 1800 --- 0 mg/kg1,3-Dichlorobenzene --- --- --- 0 mg/kg1,4-Dichlorobenzene 11 2.6 --- 0 mg/kg2,3-Dichloroaniline --- --- --- 0 mg/kg2,4,5-Trichlorophenol 82000 6300 --- 0 mg/kg2,4,6-Trichlorophenol 210 49 --- 0 mg/kg2,4-Dichlorophenol 2500 190 --- 0 mg/kg2,4-Dimethylphenol 16000 1300 --- 0 mg/kg2,4-Dinitrophenol 1600 130 --- 0 mg/kg2,4-Dinitrotoluene 7.4 1.7 --- 0 mg/kg2,6-Dinitrotoluene 1.5 0.36 --- 0 mg/kg2-Chloronaphthalene 60000 4800 --- 0 mg/kg2-Chlorophenol 5800 390 --- 0 mg/kg2-Methylphenol 41000 3200 --- 0 mg/kg2-Nitroaniline 8000 630 --- 0 mg/kg2-Nitrophenol --- --- --- 0 mg/kg3,3'-Dichlorobenzidine 5.1 1.2 --- 0 mg/kg3/4-Methylphenol 41000 3200 --- 0 mg/kg3-Nitroaniline --- --- --- 0 mg/kg4,6-Dinitro-2-methylphenol 66 5.1 --- 0 mg/kg4-Bromophenyl-phenylether --- --- --- 0 mg/kg4-Chloro-3-methylphenol 82000 6300 --- 0 mg/kg4-Chloroaniline 11 2.7 --- 0 mg/kg4-Chlorophenyl-phenylether --- --- --- 0 mg/kg4-Nitroaniline 110 27 --- 0 mg/kg4-Nitrophenol --- --- --- 0 mg/kgAcetophenone 120000 7800 --- 0 mg/kgalpha-Terpineol --- --- --- 0 mg/kgAniline 400 95 --- 0 mg/kgAzobenzene 26 5.6 --- 0 mg/kgBenzidine (estimated) 0.01 0.00053 --- 0 mg/kgBenzoic Acid 3300000 250000 --- 0 mg/kgBenzyl alcohol 82000 6300 --- 0 mg/kgbis(2-Chloroethoxy)methane 2500 190 --- 0 mg/kgbis(2-Chloroethyl)ether 1 0.23 --- 0 mg/kgbis(2-chloroisopropyl)ether 47000 3100 --- 0 mg/kgbis(2-Ethylhexyl)phthalate 160 39 19.2 0 mg/kgButylbenzylphthalate 1200 290 --- 0 mg/kgCarbazole --- --- --- 0 mg/kgDibenzofuran 1000 73 --- 0 mg/kgDiethylphthalate 660000 51000 --- 0 mg/kgDimethylphthalate --- --- --- 0 mg/kgDi-n-butylphthalate 82000 6300 --- 0 mg/kgDi-n-octylphthalate 8200 630 --- 0 mg/kgHexachlorobenzene 0.96 0.21 0.17 0 mg/kgHexachlorobutadiene 5.3 1.2 --- 0 mg/kgHexachlorocyclopentadiene 7.5 1.8 --- 0 mg/kgHexachloroethane 8 1.8 --- 0 mg/kgIsophorone 2400 570 --- 0 mg/kg
Sample ID:Sample Depth:Sample Date:
AnalyteScreening Level BaP
TEF Units
JCO-SB-12 JCO-SB-13 JCO-SB-14 JCO-SB-15 JCO-SB-16 EB-SOIL(2.5-3.5) (1.9-2.9) (2-3) (1.5-2.5) (1.5-2.5)
3/28/2017 3/28/2017 3/28/2017 3/28/2017 3/28/2017 3/29/2017 3/29/2017
< 0.08 < 0.08 < 0.08 < 0.09 < 0.08 < 1 < 0.08 < 0.08 < 0.08 < 0.09 < 0.08 < 1 < 0.08 < 0.08 < 0.08 < 0.09 < 0.08 < 1 < 0.08 < 0.08 < 0.08 < 0.09 < 0.08 < 1 < 0.08 < 0.08 < 0.08 < 0.09 < 0.08 < 1 < 0.08 < 0.08 < 0.08 < 0.09 < 0.08 < 1 < 0.08 < 0.08 < 0.08 < 0.09 < 0.08 < 1 < 0.08 < 0.08 < 0.08 < 0.09 < 0.08 < 1 < 0.08 < 0.08 < 0.08 < 0.09 < 0.08 < 1 < 0.7 < 0.7 < 0.7 < 0.8 < 0.8 < 10 < 0.4 < 0.4 < 0.4 < 0.4 < 0.4 < 5 < 0.4 < 0.4 < 0.4 < 0.4 < 0.4 < 5 < 0.08 < 0.08 < 0.08 < 0.09 < 0.08 < 1 < 0.08 < 0.08 < 0.08 < 0.09 < 0.08 < 1 < 0.08 < 0.08 < 0.08 < 0.09 < 0.08 < 1 < 0.4 < 0.4 < 0.4 < 0.4 < 0.4 < 5 < 0.4 < 0.4 < 0.4 < 0.4 < 0.4 < 5 < 0.08 < 0.08 < 0.08 < 0.09 < 0.08 < 1 < 0.08 < 0.08 < 0.08 < 0.09 < 0.08 < 1 < 0.4 < 0.4 < 0.4 < 0.4 < 0.4 < 5 < 0.4 < 0.4 < 0.4 < 0.4 < 0.4 < 5 < 0.08 < 0.08 < 0.08 < 0.09 < 0.08 < 1 < 0.08 < 0.08 < 0.08 < 0.09 < 0.08 < 1 < 0.08 < 0.08 < 0.08 < 0.09 < 0.08 < 1 < 0.08 < 0.08 < 0.08 < 0.09 < 0.08 < 1 < 0.4 < 0.4 < 0.4 < 0.4 < 0.4 < 5 < 0.4 < 0.4 < 0.4 < 0.4 < 0.4 < 5 < 0.08 < 0.08 < 0.08 < 0.09 < 0.08 < 1 < 0.08 < 0.08 < 0.08 < 0.09 < 0.08 < 1 < 0.08 < 0.08 < 0.08 < 0.09 < 0.08 < 1 < 0.08 < 0.08 < 0.08 < 0.09 < 0.08 < 1 < 0.4 < 0.4 < 0.4 < 0.4 < 0.4 < 5 < 4 < 4 < 4 < 4 < 4 < 50
< 0.7 < 0.7 < 0.7 < 0.8 < 0.8 < 10 < 0.08 < 0.08 < 0.08 < 0.09 < 0.08 < 1 < 0.08 < 0.08 < 0.08 < 0.09 < 0.08 < 1 < 0.08 < 0.08 < 0.08 < 0.09 < 0.08 < 1 < 0.4 < 0.4 < 0.4 < 0.4 < 0.4 < 5 < 0.4 < 0.4 < 0.4 < 0.4 < 0.4 < 5
1.4 < 0.08 < 0.08 < 0.09 < 0.08 < 11.9 < 0.08 < 0.08 0.19 0.13 < 1
< 0.4 < 0.4 < 0.4 < 0.4 < 0.4 < 5 < 0.08 < 0.08 < 0.08 < 0.09 < 0.08 < 1 < 0.4 < 0.4 < 0.4 < 0.4 < 0.4 < 5 < 0.4 < 0.4 < 0.4 < 0.4 < 0.4 < 5
< 0.08 < 0.08 < 0.08 < 0.09 < 0.08 < 1 < 0.08 < 0.08 < 0.08 < 0.09 < 0.08 < 1 < 0.4 < 0.4 < 0.4 < 0.4 < 0.4 < 5 < 0.08 < 0.08 < 0.08 < 0.09 < 0.08 < 1 < 0.08 < 0.08 < 0.08 < 0.09 < 0.08 < 1
Units:μg/L
JCO-MW-7 (6-7)
NA

Table 3 - Soil SVOC Analytical ResultsAlden Waterfront Park, Burlington, VT
See Notes Sheet for Acronym, Units, and Shading Definitions, etc Page 4 of 4
Ind. Res. SSV
Sample ID:Sample Depth:Sample Date:
AnalyteScreening Level BaP
TEF UnitsNitrobenzene 22 5.1 --- 0 mg/kgN-Nitrosodimethylamine 0.034 0.002 --- 0 mg/kgn-Nitroso-di-n-propylamine 0.33 0.078 --- 0 mg/kgn-Nitrosodiphenylamine 470 110 --- 0 mg/kgPentachlorophenol 4 1 0.46 0 mg/kgPhenol 250000 19000 --- 0 mg/kgPyridine 1200 78 --- 0 mg/kg1-Methylnaphthalene 73 18 --- 0 mg/kg2-Methylnaphthalene 3000 240 --- 0 mg/kgAcenaphthene 45000 3600 --- 0 mg/kgAcenaphthylene --- --- --- 0 mg/kgAnthracene 230000 18000 --- 0 mg/kgBenzo[a]anthracene 2.9 0.16 --- 0.10 mg/kgBenzo[a]pyrene 0.29 0.016 0.01 1.00 mg/kgBenzo[b]fluoranthene 2.9 0.16 --- 0.10 mg/kgBenzo[g,h,i]perylene --- --- --- 0 mg/kgBenzo[k]fluoranthene 29 1.6 --- 0.01 mg/kgChrysene 290 16 --- 0.01 mg/kgDibenz[a,h]anthracene 0.29 0.016 --- 1.00 mg/kgFluoranthene 30000 2400 --- 0 mg/kgFluorene 30000 2400 --- 0 mg/kgIndeno[1,2,3-cd]pyrene 2.9 0.16 --- 0.10 mg/kgNaphthalene 17 3.8 1.53 0 mg/kgPhenanthrene --- --- --- 0 mg/kgPyrene 23000 1800 --- 0 mg/kg
BaP TEQ 0.29 0.016 0.01 --- mg/kg
JCO-SB-12 JCO-SB-13 JCO-SB-14 JCO-SB-15 JCO-SB-16 EB-SOIL(2.5-3.5) (1.9-2.9) (2-3) (1.5-2.5) (1.5-2.5)
3/28/2017 3/28/2017 3/28/2017 3/28/2017 3/28/2017 3/29/2017 3/29/2017Units:μg/L
JCO-MW-7 (6-7)
< 0.08 < 0.08 < 0.08 < 0.09 < 0.08 < 1 < 0.08 < 0.08 < 0.08 < 0.09 < 0.08 < 1 < 0.08 < 0.08 < 0.08 < 0.09 < 0.08 < 1 < 0.08 < 0.08 < 0.08 < 0.09 < 0.08 < 1 < 0.4 < 0.4 < 0.4 < 0.4 < 0.4 < 5 < 0.08 < 0.08 < 0.08 < 0.09 < 0.08 < 1 < 0.4 < 0.4 < 0.4 < 0.4 < 0.4 < 5
1.1 < 0.007 0.11 0.52 0.47 29 < 0.10.73 < 0.007 0.083 0.47 0.4 29 < 0.1
2 < 0.007 0.0086 0.05 0.015 1.9 < 0.11.3 < 0.007 0.04 0.091 0.031 1.5 < 0.11.7 < 0.007 0.037 0.17 0.037 1.5 < 0.12.8 0.012 0.15 0.55 0.16 0.01 < 0.12.7 0.0097 0.14 0.5 0.12 < 0.008 < 0.13.8 0.018 0.27 0.76 0.31 0.011 < 0.11.8 0.017 0.15 0.39 0.15 < 0.008 < 0.11.3 < 0.007 0.074 0.25 0.076 < 0.008 < 0.13.1 0.017 0.24 0.79 0.42 0.022 < 0.10.56 < 0.007 0.042 0.12 0.05 < 0.008 < 0.15.8 0.02 0.26 1 0.3 0.29 < 0.12.4 < 0.007 0.017 0.078 0.032 4 < 0.12.2 0.014 0.15 0.43 0.12 < 0.008 < 0.13.4 0.0083 0.063 0.25 0.2 0.97 < 0.14.8 0.025 0.27 1.1 0.6 12 < 0.14.9 0.016 0.22 0.91 0.22 0.3 < 0.1
4.184 0.018 0.242 0.804 0.234 0.011 0.116
NA

Table 4 - Groundwater VOC Analytical ResultsAlden Waterfront Park, Burlington, VT
See Notes Sheet for Acronym, Units, and Shading Definitions, etc Page 1 of 2
MW-4 MW-6 MW-Dup-2 MW-7 MW-8 MW-EB Trip Blank4/10/2017 4/10/2017 4/10/2017 4/10/2017 4/10/2017 4/10/2017 3/17/2017
Analyte VGES Units MW-6 RPD1,1,1,2-Tetrachloroethane 70 ug/l < 1 < 1 < 1 --- < 1 < 1 < 1 < 11,1,1-Trichloroethane 200 ug/l < 1 < 1 < 1 --- < 1 < 1 < 1 < 11,1,2,2-Tetrachloroethane --- ug/l < 1 < 1 < 1 --- < 1 < 1 < 1 < 11,1,2-Trichloroethane 5 ug/l < 1 < 1 < 1 --- < 1 < 1 < 1 < 11,1-Dichloroethane 70 ug/l < 1 < 1 < 1 --- < 1 < 1 < 1 < 11,1-Dichloroethene 7 ug/l < 1 < 1 < 1 --- < 1 < 1 < 1 < 11,1-Dichloropropene --- ug/l < 1 < 1 < 1 --- < 1 < 1 < 1 < 11,2,3-Trichlorobenzene --- ug/l < 1 < 1 < 1 --- < 1 < 1 < 1 < 11,2,3-Trichloropropane 5 ug/l < 0.5 < 0.5 < 0.5 --- < 0.5 < 0.5 < 0.5 < 0.51,2,4-Trichlorobenzene 70 ug/l < 1 < 1 < 1 --- < 1 < 1 < 1 < 11,2,4-Trimethylbenzene --- ug/l < 1 15 15 0% 2 < 1 < 1 < 11,3,5-Trimethylbenzene --- ug/l < 1 2 2 0% 6 < 1 < 1 < 1
Total TMB 350 ug/l 0 17 17 0% 8 0 0 01,2-Dibromo-3-chloropropane 0.2 ug/l < 1 < 1 < 1 --- < 1 < 1 < 1 < 11,2-Dibromoethane (EDB) 0.05 ug/l < 1 < 1 < 1 --- < 1 < 1 < 1 < 11,2-Dichlorobenzene 600 ug/l < 1 < 1 < 1 --- < 1 < 1 < 1 < 11,2-Dichloroethane 5 ug/l < 1 < 1 < 1 --- < 1 < 1 < 1 < 11,2-Dichloropropane 5 ug/l < 1 < 1 < 1 --- < 1 < 1 < 1 < 11,3-Dichlorobenzene 600 ug/l < 1 < 1 < 1 --- < 1 < 1 < 1 < 11,3-Dichloropropane --- ug/l < 1 < 1 < 1 --- < 1 < 1 < 1 < 11,4-Dichlorobenzene 75 ug/l < 1 < 1 < 1 --- < 1 < 1 < 1 < 12,2-Dichloropropane --- ug/l < 1 < 1 < 1 --- < 1 < 1 < 1 < 12-Butanone (MEK) 4,200 ug/l < 10 < 10 < 10 --- < 10 < 10 < 10 < 102-Chlorotoluene 100 ug/l < 1 < 1 < 1 --- < 1 < 1 < 1 < 12-Hexanone --- ug/l < 10 < 10 < 10 --- < 10 < 10 < 10 < 104-Chlorotoluene 100 ug/l < 1 < 1 < 1 --- < 1 < 1 < 1 < 14-Methyl-2-pentanone (MIBK) 560 ug/l < 10 < 10 < 10 --- < 10 < 10 < 10 < 10Acetone 700 ug/l < 10 < 10 < 10 --- < 10 < 10 < 10 < 10Benzene 5 ug/l < 1 < 1 < 1 --- < 1 < 1 < 1 < 1Bromobenzene --- ug/l < 1 < 1 < 1 --- < 1 < 1 < 1 < 1Bromochloromethane 90 ug/l < 1 < 1 < 1 --- < 1 < 1 < 1 < 1Bromomethane 10 ug/l < 2 < 2 < 2 --- < 2 < 2 < 2 < 2Carbon Disulfide --- ug/l < 2 < 2 < 2 --- < 2 < 2 < 2 < 2Carbon Tetrachloride 5 ug/l < 1 < 1 < 1 --- < 1 < 1 < 1 < 1Chlorobenzene 100 ug/l < 1 < 1 < 1 --- < 1 < 1 < 1 < 1Chloroethane --- ug/l < 5 < 5 < 5 --- < 5 < 5 < 5 < 5Chloromethane 30 ug/l < 2 < 2 < 2 --- < 2 < 2 < 2 < 2cis-1,2-Dichloroethene 70 ug/l < 1 < 1 < 1 --- < 1 < 1 < 1 < 1cis-1,3-Dichloropropene --- ug/l < 0.5 < 0.5 < 0.5 --- < 0.5 < 0.5 < 0.5 < 0.5Dibromomethane --- ug/l < 1 < 1 < 1 --- < 1 < 1 < 1 < 1Dichlorodifluoromethane 1,000 ug/l < 5 < 5 < 5 --- < 5 < 5 < 5 < 5Diethyl Ether --- ug/l < 5 < 5 < 5 --- < 5 < 5 < 5 < 5Ethylbenzene 700 ug/l < 1 6 6 0% < 1 < 1 < 1 < 1Hexachlorobutadiene 1 ug/l < 1 < 1 < 1 --- < 1 < 1 < 1 < 1IsoPropylbenzene --- ug/l < 1 2 2 0% < 1 < 1 < 1 < 1Methylene chloride 5 ug/l < 5 < 5 < 5 --- < 5 < 5 < 5 < 5Methyl-t-butyl ether(MTBE) 40 ug/l < 1 < 1 < 1 --- < 1 < 1 < 1 < 1Naphthalene 20 ug/l < 5 < 5 < 5 --- < 5 < 5 < 5 < 5n-Butylbenzene --- ug/l < 1 < 1 1 --- < 1 < 1 < 1 < 1n-Propylbenzene --- ug/l < 1 2 2 0% < 1 < 1 < 1 < 1mp-Xylene --- ug/l < 1 < 1 < 1 --- < 1 < 1 < 1 < 1o-Xylene --- ug/l < 1 < 1 < 1 --- < 1 < 1 < 1 < 1
Total Xylenes 10,000 ug/l 0 0 0 --- 0 0 0 0
Sample ID:Sample Date:

Table 4 - Groundwater VOC Analytical ResultsAlden Waterfront Park, Burlington, VT
See Notes Sheet for Acronym, Units, and Shading Definitions, etc Page 2 of 2
MW-4 MW-6 MW-Dup-2 MW-7 MW-8 MW-EB Trip Blank4/10/2017 4/10/2017 4/10/2017 4/10/2017 4/10/2017 4/10/2017 3/17/2017
Analyte VGES Units MW-6 RPD
Sample ID:Sample Date:
p-Isopropyltoluene --- ug/l < 1 < 1 < 1 --- < 1 < 1 < 1 < 1sec-Butylbenzene --- ug/l < 1 < 1 < 1 --- < 1 < 1 < 1 < 1Styrene 100 ug/l < 1 < 1 < 1 --- < 1 < 1 < 1 < 1tert-Butylbenzene --- ug/l < 1 < 1 < 1 --- < 1 < 1 < 1 < 1Tetrachloroethene 5 ug/l < 1 < 1 < 1 --- < 1 < 1 < 1 < 1Tetrahydrofuran(THF) --- ug/l < 10 < 10 < 10 --- < 10 < 10 < 10 < 10Toluene 1,000 ug/l < 1 < 1 < 1 --- < 1 < 1 < 1 < 1trans-1,2-Dichloroethene 100 ug/l < 1 < 1 < 1 --- < 1 < 1 < 1 < 1trans-1,3-Dichloropropene --- ug/l < 0.5 < 0.5 < 0.5 --- < 0.5 < 0.5 < 0.5 < 0.5Trichloroethene 5 ug/l < 1 < 1 < 1 --- < 1 < 1 < 1 < 1Trichlorofluoromethane 2,100 ug/l < 5 < 5 < 5 --- < 5 < 5 < 5 < 5Bromodichloromethane --- ug/l < 1 < 1 < 1 --- < 1 < 1 < 1 < 1Bromoform --- ug/l < 2 < 2 < 2 --- < 2 < 2 < 2 < 2Chloroform --- ug/l < 1 < 1 < 1 --- < 1 < 1 < 1 < 1Dibromochloromethane --- ug/l < 1 < 1 < 1 --- < 1 < 1 < 1 < 1
Total THM 80 ug/l 0 0 0 --- 0 0 0 0Vinyl chloride 2 ug/l < 2 < 2 < 2 --- < 2 < 2 < 2 < 2

Table 5 - Groundwater SVOC Analytical ResultsAlden Waterfront Park, Burlington, VT
See Notes Sheet for Acronym, Units, and Shading Definitions, etc Page 1 of 1
MW-4 MW-5 MW-6 MW-Dup-2 MW-8 MW-EB4/10/2017 4/10/2017 4/10/2017 4/10/2017 4/10/2017 4/10/2017
Analyte VGES Units MW-6 RPD1,2,4-Trichlorobenzene 70 ug/l < 1 < 1 < 1 < 1 --- < 1 < 11,2-Dichlorobenzene 600 ug/l < 1 < 1 < 1 < 1 --- < 1 < 11,3-Dichlorobenzene 600 ug/l < 1 < 1 < 1 < 1 --- < 1 < 11,4-Dichlorobenzene 75 ug/l < 1 < 1 < 1 < 1 --- < 1 < 12,3-Dichloroaniline --- ug/l < 1 < 1 < 1 < 1 --- < 1 < 12,4,5-Trichlorophenol --- ug/l < 1 < 1 < 1 < 1 --- < 1 < 12,4,6-Trichlorophenol --- ug/l < 1 < 1 < 1 < 1 --- < 1 < 12,4-Dichlorophenol --- ug/l < 1 < 1 < 1 < 1 --- < 1 < 12,4-Dimethylphenol --- ug/l < 1 < 1 < 1 < 1 --- < 1 < 12,4-Dinitrophenol --- ug/l < 10 < 10 < 10 < 10 --- < 10 < 102,4-Dinitrotoluene --- ug/l < 5 < 5 < 5 < 5 --- < 5 < 52,6-Dinitrotoluene --- ug/l < 5 < 5 < 5 < 5 --- < 5 < 52-Chloronaphthalene --- ug/l < 1 < 1 < 1 < 1 --- < 1 < 12-Chlorophenol --- ug/l < 1 < 1 < 1 < 1 --- < 1 < 12-Methylphenol --- ug/l < 1 < 1 < 1 < 1 --- < 1 < 12-Nitroaniline --- ug/l < 5 < 5 < 5 < 5 --- < 5 < 52-Nitrophenol --- ug/l < 5 < 5 < 5 < 5 --- < 5 < 53,3'-Dichlorobenzidine --- ug/l < 1 < 1 < 1 < 1 --- < 1 < 13/4-Methylphenol --- ug/l < 1 < 1 < 1 < 1 --- < 1 < 13-Nitroaniline --- ug/l < 5 < 5 < 5 < 5 --- < 5 < 54,6-Dinitro-2-methylphenol --- ug/l < 5 < 5 < 5 < 5 --- < 5 < 54-Bromophenyl-phenylether --- ug/l < 1 < 1 < 1 < 1 --- < 1 < 14-Chloro-3-methylphenol --- ug/l < 1 < 1 < 1 < 1 --- < 1 < 14-Chloroaniline --- ug/l < 1 < 1 < 1 < 1 --- < 1 < 14-Chlorophenyl-phenylether --- ug/l < 1 < 1 < 1 < 1 --- < 1 < 14-Nitroaniline --- ug/l < 5 < 5 < 5 < 5 --- < 5 < 54-Nitrophenol --- ug/l < 5 < 5 < 5 < 5 --- < 5 < 5Acetophenone --- ug/l < 1 < 1 < 1 < 1 --- < 1 < 1alpha-Terpineol --- ug/l < 1 < 1 < 1 < 1 --- < 1 < 1Aniline --- ug/l < 1 < 1 < 1 < 1 --- < 1 < 1Azobenzene --- ug/l < 1 < 1 < 1 < 1 --- < 1 < 1Benzidine (estimated) --- ug/l < 5 < 5 < 5 < 5 --- < 5 < 5Benzoic Acid --- ug/l < 50 < 50 < 50 < 50 --- < 50 < 50Benzyl alcohol --- ug/l < 10 < 10 < 10 < 10 --- < 10 < 10bis(2-Chloroethoxy)methane --- ug/l < 1 < 1 < 1 < 1 --- < 1 < 1bis(2-Chloroethyl)ether --- ug/l < 1 < 1 < 1 < 1 --- < 1 < 1bis(2-chloroisopropyl)ether 300 ug/l < 1 < 1 < 1 < 1 --- < 1 < 1bis(2-Ethylhexyl)phthalate 6 ug/l < 5 < 5 < 5 < 5 --- < 5 < 5Butylbenzylphthalate --- ug/l < 5 < 5 < 5 < 5 --- < 5 < 5Carbazole --- ug/l < 1 < 1 < 1 < 1 --- < 1 < 1Dibenzofuran --- ug/l < 1 < 1 < 1 < 1 --- < 1 < 1Diethylphthalate --- ug/l < 5 < 5 < 5 < 5 --- < 5 < 5Dimethylphthalate --- ug/l < 1 < 1 < 1 < 1 --- < 1 < 1Di-n-butylphthalate --- ug/l < 5 < 5 < 5 < 5 --- < 5 < 5Di-n-octylphthalate --- ug/l < 5 < 5 < 5 < 5 --- < 5 < 5Hexachlorobenzene 1 ug/l < 1 < 1 < 1 < 1 --- < 1 < 1Hexachlorobutadiene 1 ug/l < 1 < 1 < 1 < 1 --- < 1 < 1Hexachlorocyclopentadiene 50 ug/l < 5 < 5 < 5 < 5 --- < 5 < 5Hexachloroethane --- ug/l < 1 < 1 < 1 < 1 --- < 1 < 1Isophorone 100 ug/l < 1 < 1 < 1 < 1 --- < 1 < 1Nitrobenzene --- ug/l < 1 < 1 < 1 < 1 --- < 1 < 1N-Nitrosodimethylamine --- ug/l < 1 < 1 < 1 < 1 --- < 1 < 1n-Nitroso-di-n-propylamine --- ug/l < 1 < 1 < 1 < 1 --- < 1 < 1n-Nitrosodiphenylamine --- ug/l < 1 < 1 < 1 < 1 --- < 1 < 1n-Decane --- ug/l < 5 < 5 < 5 < 5 --- < 5 < 5n-Octadecane --- ug/l < 5 < 5 < 5 < 5 --- < 5 < 5Pentachlorophenol 1 ug/l < 5 < 5 < 5 < 5 --- < 5 < 5Phenol 2100 ug/l < 1 < 1 < 1 < 1 --- < 1 < 1Pyridine --- ug/l < 5 < 5 < 5 < 5 --- < 5 < 51-Methylnaphthalene --- ug/l < 0.1 < 0.1 10 10 0% < 0.1 < 0.12-Methylnaphthalene --- ug/l < 0.1 < 0.1 2.1 2.3 9% < 0.1 < 0.1Acenaphthene --- ug/l < 0.1 < 0.1 0.59 0.61 3% < 0.1 < 0.1Acenaphthylene --- ug/l < 0.1 < 0.1 0.12 0.12 0% < 0.1 < 0.1Anthracene 2100 ug/l < 0.1 < 0.1 0.15 0.14 7% < 0.1 < 0.1Benzo[a]anthracene --- ug/l < 0.1 < 0.1 < 0.1 < 0.1 --- < 0.1 < 0.1Benzo[a]pyrene 0.2 ug/l < 0.1 < 0.1 < 0.1 < 0.1 --- < 0.1 < 0.1Benzo[b]fluoranthene --- ug/l < 0.1 < 0.1 < 0.1 < 0.1 --- < 0.1 < 0.1Benzo[g,h,i]perylene --- ug/l < 0.1 < 0.1 < 0.1 < 0.1 --- < 0.1 < 0.1Benzo[k]fluoranthene --- ug/l < 0.1 < 0.1 < 0.1 < 0.1 --- < 0.1 < 0.1Chrysene --- ug/l < 0.1 < 0.1 < 0.1 < 0.1 --- < 0.1 < 0.1Dibenz[a,h]anthracene --- ug/l < 0.1 < 0.1 < 0.1 < 0.1 --- < 0.1 < 0.1Fluoranthene 280 ug/l < 0.1 < 0.1 < 0.1 < 0.1 --- < 0.1 < 0.1Fluorene --- ug/l < 0.1 < 0.1 0.98 1 2% < 0.1 < 0.1Indeno[1,2,3-cd]pyrene --- ug/l < 0.1 < 0.1 < 0.1 < 0.1 --- < 0.1 < 0.1Naphthalene 20 ug/l < 0.1 < 0.1 1.4 1.4 0% < 0.1 < 0.1Phenanthrene --- ug/l < 0.1 < 0.1 0.83 0.9 8% < 0.1 < 0.1Pyrene --- ug/l < 0.1 < 0.1 < 0.1 < 0.1 --- < 0.1 < 0.1
Sample ID:Sample Date:

Table 6 - Groundwater Lead Analytical ResultsAlden Waterfront Park, Burlington, VT
See Notes Sheet for Acronym, Units, and Shading Definitions, etc Page 1 of 1
MW-1 MW-Dup-1 MW-2 MW-3 MW-EB4/10/2017 4/10/2017 4/10/2017 4/10/2017 4/10/2017
Analyte VGES Units RPDLead 0.015 mg/l < 0.001 < 0.001 --- 0.005 < 0.001 < 0.001
Sample ID:Sample Date:

FIGURES

Copyright: © 2013 National Geographic Society
Drawn by: JEMChk'd by: JKMApp'd by: JKM
Date: 10/14/15Date: 10/15/15Date: 10/15/15
FIGURE 1: SITE LOCATION MAP
ALDEN WATERFRONT
BURLINGTON, VERMONT
Figure 1 - Site Location Map.mxd
¥100 State Street, Suite 600
Montpelier, VT 05602
Scale: As Shown Project: 3-3049-05
MAPLOCATION
VT0.5 0 0.50.25
MILES
1,000 0 1,000 2,000 3,000
FEET
CONTOUR INTERVAL: 20 FEET
BASE MAP: USGS Seamless iTopo 1:24,000, December 12, 2009
ALDEN WATERFRONT PARK

kj
")
nm
")
nm#*
kjkj
kj
kj
kj

"D
"D
"D"D
"D
"D
"D
"D
"D
"D
"D
"D
"D
"D
"D
"D
"D
"D
"D
"D
"D
"D
"DMW-7
JCO-SB-11 (75)
JCO-SB-10 (94)
JCO-SB-06 (21)
JCO-SB-22 (339)
JCO-SB-09 (114)
JCO-SB-08 (1.0)
JCO-SB-07 (486)
JCO-SB-05 (0.3)
JCO-SB-04 (7.5)
JCO-SB-03 (220)
JCO-SB-02 (219)
JCO-SB-01 (0.0)
JCO-SB-21 (0.0)
JCO-SB-20 (0.0)
JCO-SB-19 (0.0)
JCO-SB-18 (0.0)
JCO-SB-17 (0.0)
JCO-SB-16 (1.4)
JCO-SB-15 (0.0)
JCO-SB-14 (0.0)
JCO-SB-13 (0.0)
JCO-SB-12 (0.2)
Source: Esri, DigitalGlobe, GeoEye, Earthstar Geographics, CNES/Airbus DS, USDA, USGS,AEX, Getmapping, Aerogrid, IGN, IGP, swisstopo, and the GIS User Community
FIGURE 3: SOIL BORING ANALYTICAL RESULTS
ALDEN WATERFRONT
BURLINGTON, VERMONT
ORTHOPHOTO SOURCE: Orthophoto basemap available from ESRI
Legend
"D Soil Boring [Swale and HDPE Drainage Pipe Area] (Peak PID Value - ppmV)
"D Soil Boring [Wooden Culvert/Walkway Area] (Peak PID Value - ppmV)
Paved Path
Swale
NOTE:-All features and locations are approximate-Orthophoto was taken before Phase 1a Waterfront Park Construction
Drawn by: SGHChk'd by: JEMApp'd by: JKM
Date: 5/1/17Date: 5/1/17Date: 5/1/17
100 State Street, Suite 600Montpelier, VT 05602
Scale: As Shown Project: 3-3049-05
MAPLOCATION
¥ VT
Figure 3 - Soil Boring Analytical Results.mxd
Analyte Abbrev Ind. Res. SSV
1-Methylnaphthalene 1-MeNaph 73 18 ---
Benzo[a]anthracene BaA 2.9 0.16 ---
Benzo[a]pyrene BaP 0.29 0.016 0.01
Benzo[b]fluoranthene BbF 2.9 0.16 ---
Dibenz[a,h]anthracene DahA 0.29 0.016 ---
Indeno[1,2,3-cd]pyrene IDCP 2.9 0.16 ---
Naphthalene Naph 17 3.8 1.53
BaP TEQ BaP-TE 0.29 0.016 0.01
1,2,4-Trimethylbenzene 1,2,4-TMB 240 58 41.6
Naphthalene Naph 17 3.8 1.53
KEY
SVOC
VOC
Cell & Text Shading
Black w/ White Text = Analytical Value exceeds:
a) Industrial RSL
Bold & Italic =
a) Residential RSL, or
b) SSV (when applicable)
Black Text = Analytical Value is less than:
a) Residential RSL, or
b) SSV (when applicable)
Grey Text = Analytical Result: value is non-detect
Analytical Value exceeds:
Notes:
BaP TEQ: Benzo(a)pyrene toxicity equivalence
Ind./Res.: industrial/residential
SSV: VDH Soil Screening Value from the IROCP.
If available, SSV trumps residential screening level
RSL: USEPA Regional Screening Level, May 2016
SVOC: semi-volatile organic compounds
VDH: Vermont Department of Health
VOC: volatile organic compounds
NA: not analyzed
ID:
Depth(ft):
Date 3/28/2017
Abbrev Result
SVOC SVOC
1-MeNaph 0.078
BaA 0.031
BaP 0.026
BbF 0.046
DahA < 0.008
IDCP 0.03
Naph 0.048
BaP-TE 0.041
VOC VOC
1,2,4-TMB < 0.05
Naph < 0.1
JCO-SB-06
(6-7)
ID: JCO-SB-11
Depth(ft): (6-7)
Date 3/28/2017
Abbrev Result
SVOC SVOC
1-MeNaph 54
BaA < 0.07
BaP < 0.07
BbF < 0.07
DahA < 0.07
IDCP < 0.07
Naph 1.8
BaP-TE 0.081
VOC VOC
1,2,4-TMB 8.4
Naph < 0.2
ID: JCO-SB-14
Depth(ft): (2-3)
Date 3/28/2017
Abbrev Result
SVOC SVOC
1-MeNaph 0.11
BaA 0.15
BaP 0.14
BbF 0.27
DahA 0.042
IDCP 0.15
Naph 0.063
BaP-TE 0.242
VOC VOC
1,2,4-TMB
NaphNA
ID: JCO-SB-15
Depth(ft): (1.5-2.5)
Date 3/28/2017
Abbrev Result
SVOC SVOC
1-MeNaph 0.52
BaA 0.55
BaP 0.5
BbF 0.76
DahA 0.12
IDCP 0.43
Naph 0.25
BaP-TE 0.804
VOC VOC
1,2,4-TMB
NaphNA
ID: JCO-SB-16
Depth(ft): (1.5-2.5)
Date 3/28/2017
Abbrev Result
SVOC SVOC
1-MeNaph 0.47
BaA 0.16
BaP 0.12
BbF 0.31
DahA 0.05
IDCP 0.12
Naph 0.2
BaP-TE 0.234
VOC VOC
1,2,4-TMB
NaphNA
ID:
Depth(ft):
Date 3/29/2017
Abbrev Result
SVOC SVOC
1-MeNaph 29
BaA 0.01
BaP < 0.008
BbF 0.011
DahA < 0.008
IDCP < 0.008
Naph 0.97
BaP-TE 0.011
VOC VOC
1,2,4-TMB 24
Naph < 0.7
JCO-MW-7
(6-7)
ID: JCO-SB-09
Depth(ft): (5.5-6.5)
Date 3/28/2017
Abbrev Result
SVOC SVOC
1-MeNaph 42
BaA < 0.08
BaP < 0.08
BbF < 0.08
DahA < 0.08
IDCP < 0.08
Naph 0.39
BaP-TE 0.093
VOC VOC
1,2,4-TMB 14
Naph < 0.7
ID: JCO-SB-07
Depth(ft): (6-7)
Date 3/28/2017
Abbrev Result
SVOC SVOC
1-MeNaph 13
BaA < 0.008
BaP < 0.008
BbF < 0.008
DahA < 0.008
IDCP < 0.008
Naph 0.13
BaP-TE 0.009
VOC VOC
1,2,4-TMB 11
Naph < 0.4
ID:
Depth(ft):
Date 3/28/2017
Abbrev Result
SVOC SVOC
1-MeNaph < 0.008
BaA < 0.008
BaP < 0.008
BbF < 0.008
DahA < 0.008
IDCP < 0.008
Naph < 0.008
BaP-TE 0.009
VOC VOC
1,2,4-TMB < 0.05
Naph < 0.1
JCO-SB-08
(1.9-2.9)
ID: JCO-SB-10
Depth(ft): (1.8-2.8)
Date 3/28/2017
Abbrev Result
SVOC SVOC
1-MeNaph 23
BaA < 0.008
BaP < 0.008
BbF < 0.008
DahA < 0.008
IDCP < 0.008
Naph 2
BaP-TE 0.009
VOC VOC
1,2,4-TMB 7.3
Naph 1.8
ID:
Depth(ft):
Date 3/28/2017
Abbrev Result
SVOC SVOC
1-MeNaph 0.27
BaA 0.12
BaP 0.1
BbF 0.2
DahA 0.036
IDCP 0.12
Naph 0.2
BaP-TE 0.183
VOC VOC
1,2,4-TMB < 0.05
Naph < 0.1
JCO-SB-01
(0.6-1.6)
ID:
Depth(ft):
Date 3/28/2017
Abbrev Result
SVOC SVOC
1-MeNaph 28
BaA 0.0087
BaP < 0.008
BbF 0.0085
DahA < 0.008
IDCP < 0.008
Naph 3.8
BaP-TE 0.01
VOC VOC
1,2,4-TMB 37
Naph 11
JCO-SB-02
(1.4-2.4)
ID: JCO-SB-03
Depth(ft): (2-3)
Date 3/28/2017
Abbrev Result
SVOC SVOC
1-MeNaph 78
BaA 0.14
BaP 0.097
BbF 0.28
DahA < 0.09
IDCP 0.21
Naph 30
BaP-TE 0.208
VOC VOC
1,2,4-TMB 42
Naph 1.7
ID:
Depth(ft):
Date 3/28/2017
Abbrev Result
SVOC SVOC
1-MeNaph 0.58
BaA 0.32
BaP 0.3
BbF 0.54
DahA 0.097
IDCP 0.32
Naph 0.33
BaP-TE 0.522
VOC VOC
1,2,4-TMB < 0.05
Naph < 0.1
JCO-SB-05
(1.8-2.8)
ID:
Depth(ft):
Date 3/28/2017
Abbrev Result
SVOC SVOC
1-MeNaph 0.13
BaA 0.0083
BaP < 0.008
BbF 0.015
DahA < 0.008
IDCP 0.022
Naph 0.12
BaP-TE 0.013
VOC VOC
1,2,4-TMB < 0.05
Naph < 0.1
JCO-SB-04
(1.8-2.8)
ID: JCO-SB-12
Depth(ft): (2.5-3.5)
Date 3/28/2017
Abbrev Result
SVOC SVOC
1-MeNaph 1.1
BaA 2.8
BaP 2.7
BbF 3.8
DahA 0.56
IDCP 2.2
Naph 3.4
BaP-TE 4.184
VOC VOC
1,2,4-TMB
NaphNA
ID: JCO-SB-13
Depth(ft): (1.9-2.9)
Date 3/28/2017
Abbrev Result
SVOC SVOC
1-MeNaph < 0.007
BaA 0.012
BaP 0.0097
BbF 0.018
DahA < 0.007
IDCP 0.014
Naph 0.0083
BaP-TE 0.018
VOC VOC
1,2,4-TMB
NaphNA
0 40 80 120Feet

!A
!A
!A
!A
!A
!A
!A
!A
!A
10
1.0
0
101.5
0
10
0.5
0
102.0
0
MW-5 (101.94)
MW-4 (102.21)
MW-8 (100.96)
MW-7 (101.14)
MW-6 (101.31)
MW-1 (100.2)MW-2 (100.21)
MW-3 (101.58)
GD-12(?) (100.8)
98.9
6
Source: Esri, DigitalGlobe, GeoEye, Earthstar Geographics, CNES/Airbus DS, USDA, USGS,AEX, Getmapping, Aerogrid, IGN, IGP, swisstopo, and the GIS User Community
FIGURE 4: GROUNDWATER POTENTIOMETRIC CONTOUR MAP
ALDEN WATERFRONT
BURLINGTON, VERMONT
ORTHOPHOTO SOURCE: Orthophoto basemap available from ESRI
Legend
!A Monitoring Well (GW Elevation on 04/10/17 in feet amsl)
04/10/17 Potentiometric Groundwater Contours (feet amsl)
04/10/17 Inferred Potentiometric Contours (feet amsl)
04/10/17 Lake Elevation (feet amsl)
Paved Path
Swale
NOTE:-All features and locations are approximate-Orthophoto was taken before Phase 1a Waterfront Park Construction
Drawn by: SGHChk'd by: JEMApp'd by: JKM
Date: 5/1/17Date: 5/1/17Date: 5/1/17
100 State Street, Suite 600Montpelier, VT 05602
Scale: As Shown Project: 3-3049-05
MAPLOCATION
¥VT
Figure 4 - Groundwater Elevation Contour Map.mxd
PENNY LANE
LA
KE
ST
RE
ET
LAKE CHAMPLAIN
0 60 120 18030Feet

APPENDIC ES
APPENDIX A
Soil Boring Logs


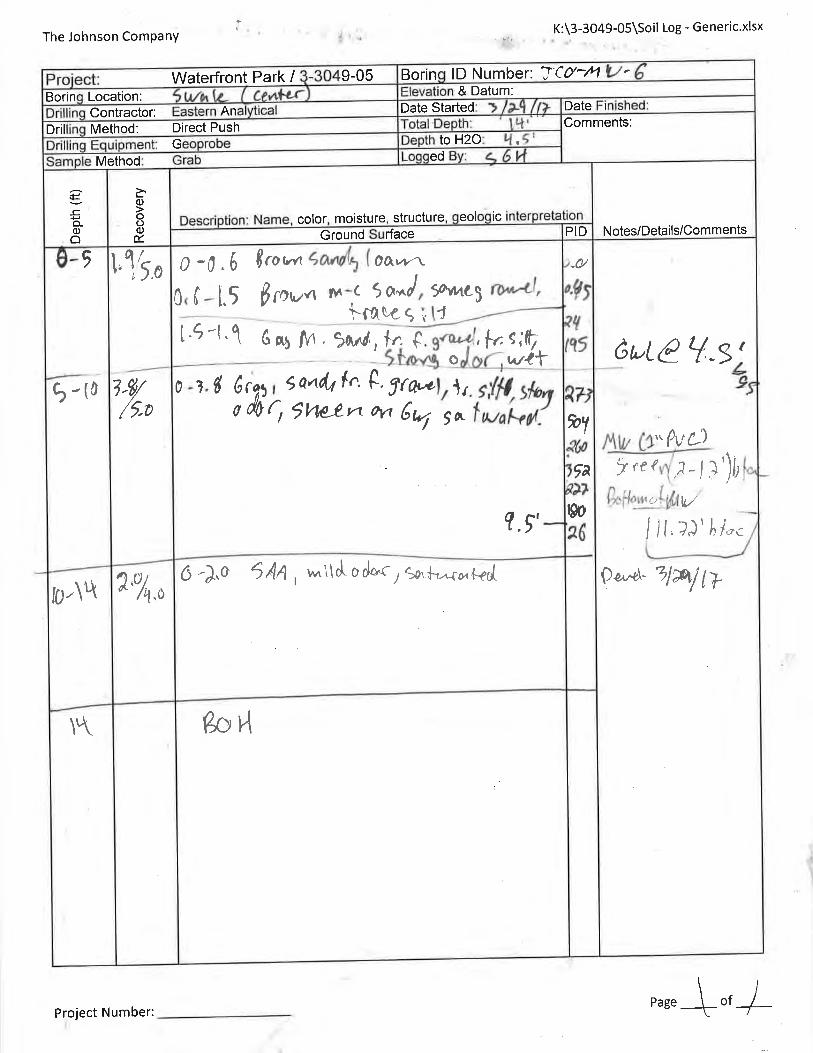


APPENDIX B
Laboratory Reports


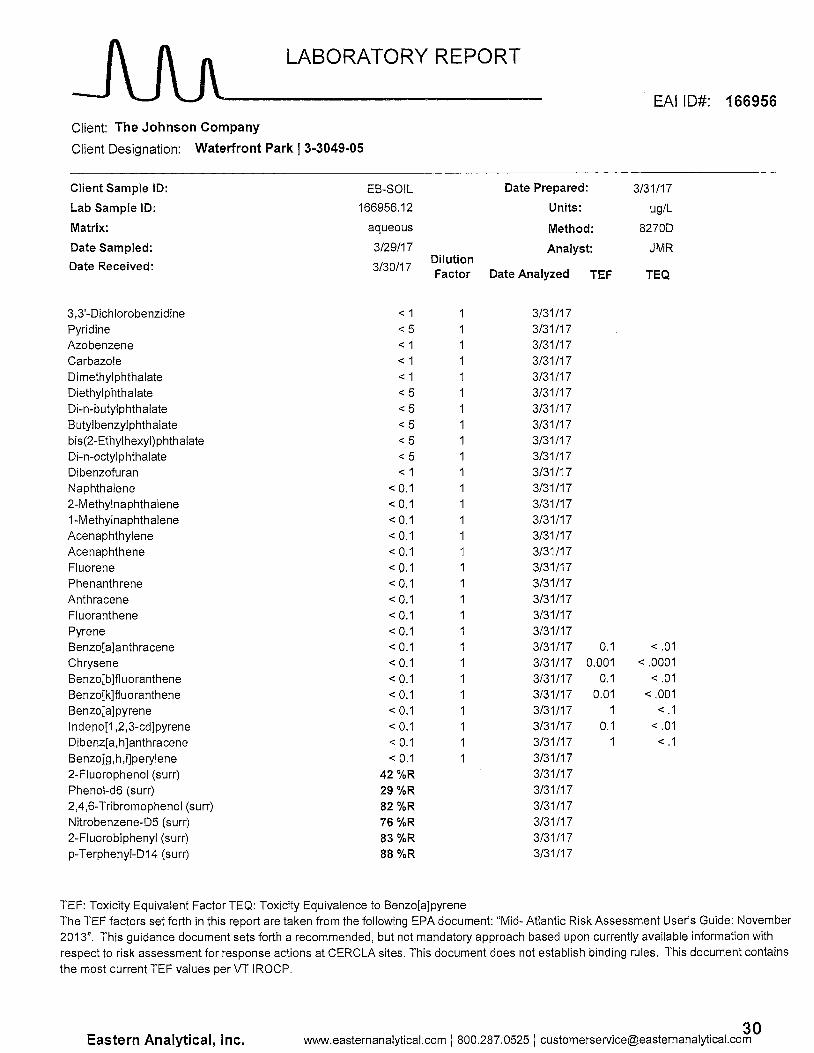


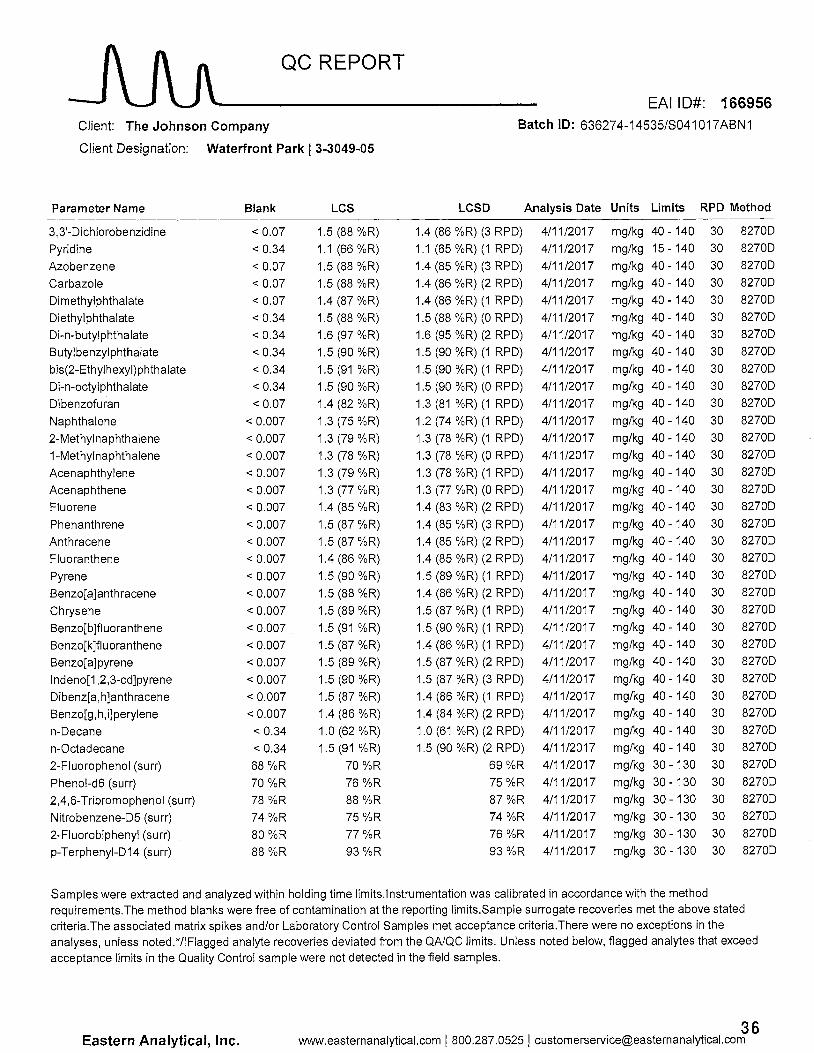


APPENDIX C
Field Notes