Chiral separation of amino-alcohols and amines by fractional reactive extraction
196
Chiral separation of amino-alcohols and amines by fractional reactive extraction
Transcript of Chiral separation of amino-alcohols and amines by fractional reactive extraction

Chiral separation of amino-alcohols and amines by fractional reactive extraction

The research in this thesis was funded by DSM Reseach bv., Geleen, The Netherlands and by
the Institute for Mechanics, Processes and Control Twente (IMPACT).
Promotiecommissie:
Prof. dr. ir. A. Bliek, voorzitter Universiteit Twente
Prof. dr. ir. A.B. de Haan, promotor Universiteit Twente
Dr. ir. N.J.M. Kuipers, assistent-promotor Universiteit Twente
Prof. dr. ir. D.N. Reinhoudt Universiteit Twente
Prof. dr. ir. G.F. Versteeg Universiteit Twente
Prof. dr. ir. H.J. Heeres Rijks Universiteit Groningen
Dr. T. Vries Syncom, Groningen
Dr. ir. G. Kwant DSM Research, Geleen
Dr. B. Simándi Associate Professor Technische Universiteit Budapest, Hongarije
Chiral separation of amino-alcohols and amines by fractional reactive extraction
Steensma, M.
Thesis, University of Twente, The Netherlands
ISBN: 90-9019313-8
Copyright (c) M. Steensma, Enschede, 2005
All rights reserved.
Printed by Febodruk, Enschede, the Netherlands.
Cover: Clazien Medendorp

Chiral separation of amino-alcohols and amines by fractional reactive extraction
Proefschrift
ter verkrijging van
de graad van doctor aan de Universiteit Twente,
op gezag van de rector magnificus,
prof.dr. W.H.M. Zijm,
volgens besluit van het College voor Promoties
in het openbaar te verdedigen
op woensdag 27 april 2005 om 15.00 uur
door
Maria Steensma
geboren op 12 juli 1976
te Deventer

Dit proefschrift is goedgekeurd door de promotor
Prof. dr. ir. A.B. de Haan
en de assistent-promotor
Dr. ir. N.J.M. Kuipers

I
Voorwoord Het is af! En omdat geen enkel proefschrift in een vacuüm ontstaat, wil ik graag beginnen met een dankwoord. Allereerst wil ik mijn promotor André de Haan bedanken, niet alleen voor het vertrouwen dat er altijd was en de vrijheid die ik heb gekregen bij het doen van dit promotieonderzoek, maar ook voor de betrokkenheid en het geduld met name in de moeizame periode van herstel-na-ongeluk. Mijn dagelijkse begeleider en assistent-promotor Norbert Kuipers wil ik graag bedanken voor de plezierige begeleiding, de vele discussies, alle correcties in mijn manuscripten en de muziekkeuze in de auto op weg naar DSM. De vakgroep Scheidingstechnologie was en is erg gezellig; eerst met de ‘eerste lichting André’ en nu met alle ladies, en niet te vergeten de vaste staf: Jeroen, Boris, Fahong, Karin, José, Bart, Johan, Thijs, Renze, Paul, Daleen, Maksym, Tanja, Katarina, Lara, Meritxell, Natasja, Wytze, Hans, Louis: bedankt!! Een speciaal woord van dank voor kamergenoot Jeroen, voor alle gesprekken, politieke discussies en het geduldig verdragen van Rachmaninov en Bach. Ook onze technici wil ik graag apart noemen: Bert bouwde diverse opstellingen en was mijn klankbord als de computer weer eens vastliep, Henny hielp bij de ontwikkeling van de analyses en heeft me tussen de bedrijven door opgeleid tot HPLC-expert, Alfons bestelde eindeloze hoeveelheden chemicaliën, waarvan de restanten dan vervolgens weer door Anita als afval werden afgevoerd. Daarnaast hebben vele anderen binnen de faculteit een steentje bijgedragen aan dit project, bijvoorbeeld de mensen van de glasinstrumentmakerij, technische dienst, bibliotheek en analysegroep. Een grote groep studenten heeft tijdens stage, uitwisseling of afstuderen in mijn project gewerkt. Hartelijk bedankt allemaal! Voor sommigen van jullie moet dit een frustrerende ervaring zijn geweest, want chirale scheidingen zijn lastig (sommigen zullen hun werk alleen terug zien in een tabel in hoofstuk 3), maar daarom waardeer ik jullie inzet des te meer! Thijs en later Meritxell hebben gewerkt aan de meting van reactiekinetiek in vloeistof-vloeistof systemen. Anita heeft tijdens haar stage een zeer nuttige bijdrage geleverd aan de gebruikte analysemethoden. Maria heeft een deel van de systemen uit hoofstuk 3 doorgemeten. Aleksandar en Freddy werkten beiden aan cyclodextrines, waarbij ik samen met Freddy heb moeten leren dat het feit dat artikelen in druk verschijnen helaas niet betekent dat de inhoud klopt. Rob schreef het model dat de basis vormt voor hoofdstuk 6 en Margriet heeft het onderzoek uitgevoerd dat in hoofdstuk 7 beschreven is. Voor de financiering van dit onderzoek wil ik graag DSM Research en het Institute of Mechanics, Processes and Control Twente (IMPACT) bedanken. Met DSM Research, voornamelijk in de persoon van Gerard Kwant, is regelmatig contact geweest. Gerard, bedankt voor je belangstelling voor onze vorderingen en je waardevolle suggesties.

II
Tijdens deze jaren hebben diverse mensen ‘uit het veld’ me van de broodnodige organisch-chemische kennis voorzien, en van hen kreeg ik ook allerlei verbindingen om als extractant te testen. Een aantal mensen binnen Syncom wil ik graag noemen: Ton Vries, José Nieuwenhuijzen, Wendy Hof, TUE-stagair Martijn Veld en Linda Lucas. In Nijmegen een woord van dank voor Simona Müller en Cyrus Afraz, beiden inmiddels gepromoveerd. Ook al is chemische technologie een prachtig vak, gelukkig bestaat er ook nog een wereld buiten CT: immers zonder ontspanning geen creativiteit! Al mijn schaats- en fietsvriendjes en vriendinnetjes bedankt, voor alle gezelligheid, de vakanties en fietsweekendjes en het plezier in sport. Al zal ik nooit een fatsoenlijke bocht leren schaatsen, Skeuvel en Gesneuveld zijn geweldig. Muziek speelt ook altijd een grote rol in mijn leven. De afgelopen jaren heb met veel plezier gezongen bij kamerkoor Canteklaer en bij Marion in de huiskamer. Lieve mensen, bedankt voor de muziek en de uitgebreide evaluaties van de repetities en concerten in het Bolwerk. Clazien, ik ben blij met je prachtige omslagontwerp! Zonder nog meer namen te gaan noemen, wil ik verder graag alle vrienden, oud-huisgenoten en familieleden bedanken die op de achtergrond meeleefden en informeerden of het al een beetje opschoot met dat proefschrift, of ik nou al passende handschoentjes voor mijn linker- en rechterhandjes had gevonden. Papa, mama, Sybren, bedankt voor de steun en broodnodige relativering op bepaalde momenten, voor jullie niet-aflatende belangstelling, kortom voor het thuis dat jullie vormen, ook al ben ik al tien jaar het huis uit. Joris, ik ben dankbaar voor alles waar geen woorden voor zijn.
Maartje

III
Contents Summary VII Samenvatting XI 1. Introduction 1
1.1 Chirality 1 1.2 Implications of chirality for the chemical and pharmaceutical industry 2 1.3 Economical importance of single-enantiomer technology 4 1.4 Sources of enantiopure substances 6 1.5 Importance of chiral separation technology 8 1.6 Fractional reactive extraction 10 1.7 Outline of the thesis 14
2. Feasibility of fractional reactive extraction as chiral separation technique: improved
productivity in the chiral separation of DL-leucine 19 2.1 Introduction 19
2.1.1 Selectivity versus number of stages 21 2.1.2 Flow rates and distribution ratio 21 2.1.3 Chemistry of C12Hyp-Cu(II) extractant 24
2.2 Experimental 25 2.2.1 Materials 25 2.2.2 Extraction experiments 26 2.2.3 Determination of copper-ligand equilibrium constant 26 2.2.4 Determination of ligand exchange equilibrium constant 26
2.3 Single stage equilibrium model 27 2.4 Results 28
2.4.1 Influence of copper-ligand ratio 28 2.4.2 Influence of extractant excess 30 2.4.3 Influence of concentration level 31 2.4.4 Influence of temperature 32 2.4.5 Influence of pH 33 2.4.6 Influence of the solvent 33 2.4.7 Influence of volume ratio 34 2.5 Consequences for design 36
2.6 Conclusion 38

IV
3. Identification of enantioselective extractants for chiral separation of amines and amino-alcohols 41
3.1 Introduction 41 3.2 Theory 43
3.2.1 Chiral recognition 43 3.2.2 Separation mechanism in reactive extraction 43 3.2.3 Separation mechanisms in other chiral separations 44 3.2.4 Summary 47
3.3 Selection of candidate enantioselective extractants for amines and amino- alcohols 47 3.4 Materials and Methods 56
3.4.1 Chemicals 56 3.4.2 Extraction experiments and chemical analysis 57
3.5 Results & Discussion 58 3.5.1 Extractant screening 58 3.5.2 Performance of non-selective candidate extractant systems 58 3.5.3 Performance of selective candidate extractant systems 61 3.5.4 Evaluation of the developed identification procedure 66
3.6 Conclusion 68 4. Influence of process parameters on extraction equilibria for the chiral separation of
amines and amino-alcohols with a chiral crown ether 77
4.1 Introduction 77 4.2 Model description 79 4.3 Materials & Methods 82
4.3.1 Materials 82 4.3.2 Determination of complexation constants KR and KS 82 4.3.3 Partition and extraction experiments 83 4.3.4 Experimental approach 83
4.4 Results and discussion: model parameters 84 4.4.1 Partitioning ratios 84 4.4.2 Complexation constants 86
4.5 Results and discussion: extraction 89 4.5.1 Influence of solvent 89 4.5.2 Influence of extractant concentration 91 4.5.3 Influence of temperature 93 4.5.4 Influence of pH 94 4.5.5 Extractant and enantiomer recovery by back-extraction 96
4.6 Direction for optimisation 98 4.7 Conclusion 98

V
5. Determination of reaction kinetics in reactive extraction for chiral separation of
amino acids and amino-alcohols 101 5.1 Introduction 101
5.1.1 Models for extraction kinetics in reactive extraction 102 5.1.2 Homogeneous reaction model and regime analysis 104
5.2 Simulations with crown ether extractant system 106 5.3 Experimental 107
5.3.1 Materials 107 5.3.2 Lewis cell design and operation 107 5.3.3 Chemical analysis 109 5.3.4 Data treatment 109
5.4 Simulation results 110 5.4.1 Validation of model 110 5.4.2 Influence of kL1 on effective enhancement factor 111 5.4.3 Influence of kL1 and reversibility of reaction on regime analysis 112 5.4.4 Role of acid-base dissociation and other aqueous-phase reactions 115
5.5 Experimental results 117 5.5.1 Validation of method & characterisation of Lewis cell 117 5.5.2 Reactive extraction of phenylglycinol with crown ether 119 5.5.3 Reactive extraction of PEA 122 5.5.4 Reactive extraction of DL-leucine by Cu(II)-C12Hyp 123 5.5.5 Consequences for equipment design 125 5.5.6 Comparison crown system-C12Hyp system 125 5.5.7 Lactic acid/alamine 336 system from literature 125
5.6 Conclusion 126 6. Multistage equilibrium modelling of fractional reactive extraction for chiral
separation 129
6.1 Introduction 129 6.2 Simulations 132
6.2.1 Numerical method 134 6.3 Results 135
6.3.1 Influence of W/S ratio 135 6.3.2 Influence of temperature, pH, extractant excess, concentration level 135 6.3.3 Influence of number of stages 140 6.3.4 Location of feed stage 141 6.3.5 Reflux 141 6.3.6 Back-extraction 146
6.4 Design considerations 148

VI
6.5 Conclusion 151 7. Fractional reactive extraction pilot experiments in hollow fiber membrane
modules 153 7.1 Introduction 153 7.2 Experimental 155
7.2.1 Data treatment 156 7.3 Results and discussion 157
7.3.1 Estimation of number of stages by physical extraction 157 7.3.2 Reactive extraction: influence of solvent-to-feed ratio 158 7.3.3 Fractional reactive extraction: influence of wash-to-solvent ratio 163 7.3.4 Influence of temperature 164 7.3.5 Improvement of separation 166 7.3.6 Improvement of agreement between model and experiment 166
7.4 Conclusion 167 8. Conclusions and outlook 171
8.1 Conclusions 171 8.1.1 Development of enantioselective extractants 171 8.1.2 Extractant performance 171 8.1.3 FREX process performance 172
8.2 Comparison of FREX with current industrial separation techniques 172 8.3 Outlook 173
8.3.1 Process design 173 8.3.2 Equipment design and scale-up 174 8.3.3 Extractant development & design 174
List of symbols 175 List of publications 177

VII
Summary Many naturally occurring substances possess chirality, which is the property that the molecule and its mirror image are not superimposable. Chirality plays an important role in biological systems. For instance, only one enantiomer (mirror isomer) of many pharmaceuticals is the active substance. The availability of optically pure substances is therefore of primary importance in the pharmaceutical and fine chemical industry. Chiral separation is an important, often cost-effective way to obtain these substances. Chiral separation may also be required as final purification step after a selective synthesis. The current industrial separation techniques each have major drawbacks. (Diastereomer) crystallisation is inflexible and involves solid-phase handling. Simulated moving bed (SMB) chromatography is more flexible, but it is very expensive because of the low volumetric productivity and the use of expensive chiral stationary phases (CSP’s). In this thesis, fractional reactive extraction (FREX) is proposed and evaluated as alternative industrial separation technique. In FREX, an enantioselective extractant is applied as chiral selector. The process is versatile if the same extractant can be used with a good selectivity and capacity for a number of different substances from the same chemical class. Both enantiomers can be obtained at the desired purity by application of the fractional extraction scheme. Fractional reactive extraction combines in a liquid process flexibility with lower cost per chiral recognition site and high volumetric capacity. Despite its potential advantages over existing separation techniques, FREX is currently not applied on industrial scale because of a lack of versatile enantioselective extractants and a too low productivity. This thesis is therefore focused on identification of enantioselective extractants, improvement of productivity and technology development. In chapter 2, the large potential of fractional reactive extraction is demonstrated with an enantioselective extractant for amino acid separation, the copper(II) complex of N-dodecyl-L-hydroxyproline. The selectivity and versatility of this extractant are reported in literature to be good, and the application of the extractant in laboratory scale FREX extractors is also described; however, the productivity was in all cases very low. The influence of process conditions on the selectivity and capacity in a single extraction stage were experimentally determined for this extractant system. Along with the experiments, a predictive model was constructed based on the physical and chemical equilibria in the system. The model could explain all experimental trends. Based on the experiments and the model, it was calculated that the productivity in the lab-scale extractors from literature can be increased by a factor 50-100 by using optimal process conditions, without changing existing chemistry. Thus, the importance of optimisation of process conditions for the economical feasibility of FREX is demonstrated.

VIII
A method is developed in chapter 3 to identify potential enantioselective extractants in the vast analytical chiral recognition literature. In this way, selective interactions already known in literature can be exploited for reactive extraction. Because many important chiral intermediates are amines or amino-alcohols, six components with structural variation were selected as model enantiomers from these chemical classes. To test the identification method, a literature database is compiled containing > 100 selectors for amines, amino alcohols and amino acids originating from various (analytical) techniques. 18 systems from this database were experimentally screened for selectivity in extraction. Additional measurements were carried out for the four systems that showed an enantioselectivity > 1.1. The system that gave the best results in the selectivity, an azophenolic crown ether, is a new enantioselective extractant and it is characterised further in later chapters. As for the identification method, the most promising candidate extractants emerge from the database if it is searched for ‘selectors originating from a technique with a similar separation mechanism as extraction’ in combination with ‘high selectivity’ and ‘versatility’; a successful transfer of selectors from other techniques to extraction is the most likely if the selectors form diastereomeric complexes with the enantiomers in the liquid that differ in complexation constant. The identification method is expected to save a lot of experimental trial and error in future extractant development for enantiomers from other chemical classes. In chapter 4, the most promising enantioselective extractant is characterised further. This extractant is an azophenolic crown ether that reversibly forms complexes with neutral amines and amino-alcohols, in contrast with a conventional crown ether that complexes with the ammonium form of amines or amino-alcohols. An extraction mechanism is proposed in which the neutral amine or amino-alcohol partitions between the aqueous and the organic phase (physical extraction), followed by complexation with the crown ether in the organic (bulk) phase. The equilibrium between neutral form and ammonium form of the enantiomers in the aqueous phase is governed by the pH. As all equilibrium constants can be obtained from independent measurements, a predictive single stage model can be formulated based on these equilibria and mass balances. Secondly, experiments are carried out with the model amines and amino-alcohols to find the influence of concentrations, pH, temperature and solvent on the selectivity and capacity of extraction. The capacity (distribution ratio) increases with increasing pH, decreasing temperature, increasing excess of extractant and increasing concentration level of enantiomers and extractant. The selectivity increases with increasing extractant concentration until the intrinsic selectivity is approached; to obtain this selectivity, an excess extractant of only 2-3 is required for the investigated systems, whereas in the literature often an excess of > 100 is applied for similar systems. Five out of six model enantiomers could be separated with a selectivity between 1.5 and 9.4 and sufficient capacity. In this way, it has been demonstrated that the new extractant is both versatile and highly selective. The single stage equilibrium model can be used very well to explain all influences of process conditions on the capacity of extraction, and it gives a quantitatively correct

IX
prediction of the operational selectivity. The developed and validated single stage model will be used as basis for a multistage extractor model in chapter 6. Initial work on determination of the reaction kinetics in reactive extraction systems is described in chapter 5, because it is important to know the mass transfer rates and reaction kinetics separately for a reliable scale-up. To interpret the experimental data from the selected model reactor, the modified Lewis cell, a kinetic model is required. The two-phase ‘homogeneous reaction’ model was selected over the ‘interfacial reaction’ model, because the physical extraction is considerable in all systems. The extraction process in the Lewis cell is simulated based on this reaction model. A regime analysis is associated with the homogeneous reaction model. Strictly speaking, it is only valid for an irreversible reaction and a negligible resistance to mass transfer in the non-reactive phase. These conditions are generally not fulfilled in reactive extraction. It was shown by simulations and by theoretical considerations that the regime analysis indeed fails for reactive extraction in a number of regimes. Furthermore, it follows from the simulations that enhancement of mass transfer by reaction may be (partly) invisible. Finally, it becomes clear that the fraction of the species that is in the ‘extractable’ form should be used in the calculations. As the regime analysis as such cannot be applied to determine the reaction kinetics in the chiral systems, first the mass transfer rate was measured during physical extraction, whereafter the location of the main resistance to mass transfer was determined. Then the enhancement of mass transfer was measured during reactive extraction. By model simulation, it was determined how much enhancement of mass transfer should be observable. In this way, it was concluded that the reaction kinetics of the azophenolic crown ether system are between ‘fast’ and ‘instantaneous’, and the reaction kinetics of the Cu(II)-N-dodecyl-L-hydroxyproline system are between ‘slow’ and ‘fast’. The Lewis cell is not the most suitable model contactor to determine reaction kinetics in reactive extraction systems. A more suitable contactor would have lower mass transfer resistances that can be varied independently over a larger range, for instance the rotating diffusion cell or a novel model reactor. In chapter 6, simulations are carried out for a fractional extractor with a multistage equilibrium model based on the single stage model. A higher pH, lower T, higher concentrations and a higher excess of extractant all result in higher purities in both product streams, but a higher wash stream is required to realise good yield and good purity. The improved purity can be explained from a higher operational selectivity in the single stage, from lower variation of the extraction factors along the extractor, or from a combination of these effects. Application of ‘reflux’ results in higher product purities at a lower wash stream requirement, but a lower process capacity. The consequences for process design are discussed qualitatively. A specification of 99% yield and 98% enantiomeric excess (e.e.) is defined for the extract, which results in 99% yield and 98% e.e. for the other enantiomer in the raffinate as well. To make the best use of the versatile extractant, the design of a versatile extractor for a multiproduct environment is much more interesting than the design of a ‘dedicated’

X
extractor for a single product. It was shown that various combinations of process conditions result in the desired product specifications, and the more stages available above the minimum number, the larger the process capacity. All systems for which a single stage selectivity of 1.5 was obtained in chapter 4, can be separated in a multiproduct extractor containing 50 stages, evenly distributed over the wash and strip section. In chapter 7, the predictions from the multistage model are tested experimentally in a set-up consisting of two hollow fiber membrane modules. Almost two equilibrium stages are realised in each module. In this way a partial chiral separation can be obtained. The influence of the flow rate ratios (S/F and W/S) on the enantiomeric excess in the experiments is lower than predicted, possibly because of insufficient residence time. The experimental and predicted trends in the yield are similar. The experimental effect of a temperature decrease was almost nil, probably because the more favourable theomodynamics and the slower kinetics at lower temperature counteracted. A better separation can be obtained if modules are used containing smaller membrane fibers for more interfacial area. Furthermore, the experimental trends can probably be understood better with the help of a non-equilibrium model. In the last chapter, the overall conclusions are presented and fractional reactive extraction is compared with the main industrial separation techniques, crystallisation and SMB chromatography. Although FREX has some clear advantages over these techniques, more research is required before FREX can be introduced in industry. An economical evaluation should be used to decide if FREX is indeed the best solution for a specific separation problem. More attention is also needed for equipment selection, design and scale-up. For a reliable design, it is in any case required that reaction kinetics and mass transfer in reactive extraction can be described more accurately. For application of FREX as separation technique for enantiomers other than amines or amino-alcohols, identification or design of new affinity extractants is essential. The identification method developed in this thesis is expected to be successful for other classes of enantiomers as well.

XI
Samenvatting Veel in de natuur voorkomende moleculen bezitten chiraliteit, de eigenschap dat het molecuul in chemische structuur niet gelijk is aan zijn spiegelbeeld. Met name in biologische systemen speelt chiraliteit een grote rol. Er zijn bijvoorbeeld veel geneesmiddelen waarbij de werkzaamheid voornamelijk in één van beide spiegelbeeldisomeren zit. De beschikbaarheid van optische zuivere stoffen is dan ook essentieel voor de farmaceutische en fijnchemische industrie. Een belangrijke, vaak kosteneffectieve route om deze stoffen te verkrijgen is de scheiding van een (racemisch) mengsel, een zogenaamde chirale scheiding. Ook als via een selectieve synthese een niet-racemisch productmengsel is verkregen, is vaak nog een chirale scheiding nodig als laatste zuiveringsstap. De huidige technieken voor chirale scheiding op industriële schaal hebben ieder grote nadelen: (diastereomere) kristallisatie is niet flexibel en vereist bovendien het werken met vaste stof, en het meer flexibele Simulated Moving Bed (SMB) chromatografie is relatief duur vanwege de lage volumetrische capaciteit en het gebruik van een chirale vaste fase (CSP). In dit proefschrift wordt fractionerende reactieve extractie (FREX) als alternatieve industriële scheidingstechniek voorgesteld en geëvalueerd. Hierbij wordt een enantioselectieve extractant toegepast als chirale selector. Dit scheidingsproces is flexibel indien één extractant beschikbaar is die een voldoende hoge selectiviteit en capaciteit geeft voor een aantal verschillende stoffen uit dezelfde chemische klasse. Beide enantiomeren kunnen dan in de gewenste zuiverheid verkregen worden door gebruik van het fractionerende extractieschema. Fractionerende reactieve extractie combineert aldus in een vloeistofproces flexibiliteit met lagere kosten per ‘chirale site’ en hoge volumetrische capaciteit. Ondanks deze mogelijke voordelen wordt fractionerende reactieve extractie momenteel niet toegepast op industriële schaal, vanwege een gebrek aan veelzijdige, selectieve extractanten voor de belangrijkste verbindingen en vanwege een te lage productiviteit. Dit promotieonderzoek is derhalve voornamelijk gericht op de identificatie van enantioselectieve extractanten, het verbeteren van de productiviteit en de verdere technologieontwikkeling. Het potentieel van fractionerende reactieve extractie wordt in hoofstuk 2 verder toegelicht met behulp van een enantioselectieve extractant voor het scheiden van aminozuren, het koper(II) complex van N-dodecyl-L-hydroxyproline. Van dit complex is reeds vanuit de literatuur bekend dat de veelzijdigheid en selectiviteit goed zijn, terwijl ook fractionerende reactieve extractie in diverse laboratoriumopstellingen is beschreven; de productiviteit was echter in alle gevallen zeer laag. Met dit extractantsysteem zijn metingen uitgevoerd om de invloed van diverse procesparameters vast te leggen op de selectiviteit en capaciteit in één evenwichtstrap. Tegelijkertijd is een model gemaakt waarin alle evenwichten beschreven worden en waarmee alle experimentele trends kunnen worden verklaard. Op basis van de metingen en het model is berekend dat de capaciteit van de in de literatuur beschreven proefopstellingen met een factor 50-100 verhoogd kan worden door bij optimale procesomstandigheden te werken, zonder de

XII
chemie aan te hoeven passen. Het belang van het optimaliseren van procesomstandigheden voor de economische haalbaarheid van fractionerende reactieve extractie is hiermee aangetoond. In hoofdstuk 3 is een methode ontwikkeld voor de identificatie van potentiële enantioselectieve extractanten op basis van de uitgebreide analytische literatuur over chirale herkenning. Er kan zo gebruik gemaakt worden van de selectieve interacties die al in de literatuur bekend zijn. Als modelenantiomeren zijn zes componenten met onderlinge variatie in chemische structuur gekozen uit de klassen van amines en amino-alcoholen, omdat veel belangrijke chirale tussenproducten optisch zuivere amines en amino-alcoholen zijn. Voor het testen van de identificatiemethode is een literatuurdatabase gemaakt met > 100 selectoren uit diverse technieken voor amines, amino-alcoholen en aminozuren. Hiervan zijn 18 systemen experimenteel gescreend op het vertonen van selectiviteit in extractie. Voor de vier systemen die een selectiviteit > 1.1 gaven zijn aanvullende metingen verricht. Het systeem dat in deze metingen de beste selectiviteit en veelzijdigheid liet zien, een azofenolische kroonether, is een nieuwe enantioselectieve extractant en wordt in de overige hoofstukken verder onderzocht. Het blijkt dat de meest veelbelovende extractanten uit de database naar boven komen als gezocht wordt op ‘afkomstig uit een techniek met vergelijkbaar scheidingsmechanisme’ in combinatie met ‘hoge selectiviteit’ en ‘veelzijdigheid’: de kans op een succesvolle overdracht van de selector naar extractie is het grootst als er diastereomere complexen in de vloeistof gevormd worden die van elkaar verschillen in complexatieconstante. Met behulp van de ontwikkelde identificatiemethode kan gericht gezocht worden naar potentiële extractanten in de literatuur over chirale herkenning en wordt veel experimentele ‘trial and error’ bespaard. De meest veelbelovende extractant uit hoofdstuk 3 is in hoofstuk 4 verder gekarakteriseerd. Deze extractant is een azofenolische kroonether, die reversibel complexen vormt met neutrale amines en amino-alcoholen; dit in contrast met een conventionele kroonether, die complexeert met amines in de ammoniumvorm. Er wordt een extractiemechanisme voorgesteld waarbij de neutrale amines of amino-alcoholen vanuit de waterfase naar de organische fase migreren via fysische extractie (partitie) waarna complexatie met de kroonether plaatsvindt in de organische (bulk)fase. In de waterfase heerst een pH-afhankelijk evenwicht tussen de neutrale amines en het geconjugeerde zuur (ammonium). Omdat alle benodigde evenwichtsconstanten uit onafhankelijke metingen te verkrijgen zijn, kan een voorspellend eentraps-evenwichtsmodel geformuleerd worden, gebaseerd op deze evenwichten en de massabalansen. Vervolgens zijn er extractiemetingen uitgevoerd met de amino-alcoholen en amines uit de modelset teneinde de invloed van concentraties, pH, temperatuur en oplosmiddel op de selectiviteit en capaciteit van de extractie vast te leggen. De capaciteit (verdelingscoefficient) blijkt toe te nemen met toenemende pH, afnemende temperatuur, toenemende overmaat extractant en toenemende concentraties enantiomeer en extractant. De selectiviteit neemt toe met toenemende extractantconcentratie tot de intrinsieke selectiviteit bereikt wordt; bij de onderzochte systemen is hiervoor slechts een overmaat extractant van 2-3 nodig, terwijl in de

XIII
literatuur (voor andere systemen) vaak een overmaat > 100 gebruikt is. Vijf van de zes amines en amino-alcoholen uit de modelset kunnen gescheiden worden met een selectiviteit tussen 1.5 en 9.4 en met voldoende capaciteit, waarmee aangetoond is dat de nieuwe extractant zowel selectief als veelzijdig is. Het evenwichtsmodel blijkt zeer goed in staat de invloeden van de diverse procesparameters op de capaciteit van extractie te verklaren, en de selectiviteit kwantitatief correct te voorspellen. Het ontwikkelde en gevalideerde model van één evenwichtstrap zal gebruikt worden voor extractorberekeningen in hoofdstuk 6. In hoofdstuk 5 is een begin gemaakt met het bestuderen van de extractiekinetiek in reactieve extractie-systemen, omdat het voor betrouwbare opschaling van belang is de invloed van stofoverdracht en reactiekinetiek afzonderlijk te kennen. Voor het interpreteren van de meetgegevens uit de gekozen modelreactor, de gemodificieerde Lewis-cel, is het model van de ‘homogene reactie’ verkozen boven de ‘grensvlakreactie’ omdat de fysische extractie in alle systemen aanzienlijk is. Het extractieproces in de Lewis-cel wordt gesimuleerd op basis van deze modelbeschrijving. Bij het homogene reactiemodel hoort een regime-analyse, die strikt genomen alleen geldig is voor irreversibele reactie met een verwaarloosbare weerstand tegen stofoverdracht in de niet-reactieve fase. Bij reactieve extractie wordt in het algemeen aan geen van beide voorwaarden voldaan. Met behulp van simulaties en theorie is dan ook vastgesteld dat deze regime-analyse in een aantal regimes faalt voor reactieve extractie. Verder volgt ook uit de simulaties dat versnelling van stofoverdracht door reactie deels of geheel onzichtbaar kan worden. Tenslotte wordt duidelijk dat gerekend moet worden met de fractie van de stof die in de ‘overdraagbare’ vorm is. Omdat de regime-analyse niet gebruikt kan worden voor het bepalen van de reactiekinetiek, is voor twee chirale systemen eerst de fysische stofoverdrachtssnelheid gemeten en de locatie bepaald van de belangrijkste weerstand; vervolgens is experimenteel bepaald of en hoeveel versnelling van stofoverdracht plaats vond. Modelmatig is bepaald hoeveel versnelling meetbaar zou moeten zijn. Op deze wijze is vastgesteld dat de reactie tussen kroonether en phenylglycinol of phenylethylamine ‘zeer snel’ tot ‘instantaan’ is, terwijl de reactie tussen koper-C12Hyp complex en leucine tussen ‘langzaam’ en ‘snel’ in zit. De Lewis-cel is niet de meest geschikte contactor om reactiekinetiek in dergelijke systemen vast te stellen; beter lijkt een contactor waarin de beide stofoverdrachtsweerstanden kleiner zijn en ieder apart over een grotere range gevarieerd kunnen worden, zoals de roterende membraancel of een nog te ontwikkelen modelreactor. In hoofdstuk 6 worden berekeningen voor een fractionerende extractor gemaakt met behulp van een meertraps-evenwichtsmodel dat is gebaseerd op het eentrapsmodel. Een hogere pH, lagere temperatuur, hogere concentraties en grotere overmaat extractant resulteren allemaal in een hogere zuiverheid van beide productstromen; echter ook een grotere wasstroom is nodig om in beide productstromen dezelfde hoge zuiverheid en hoge opbrengst te realiseren. De verbeterde zuiverheid kan worden verklaard door een verbeterde operationele selectiviteit per trap, door minder variatie van de extractiefactoren over de extractor of door een combinatie van deze effecten. Verder kan de zuiverheid in beide productstromen verhoogd worden en de

XIV
benodigde wasstroom verkleind worden door ‘reflux’ toe te passen. Dit gaat echter wel ten koste van de capaciteit. De gevolgen voor procesontwerp worden kwalitatief besproken. Als specificatie wordt 99% yield en 98% enantiomere overmaat (e.e.) opgelegd aan het extract, met als gevolg 99% yield en 98% e.e. van het andere enantiomeer in het raffinaat. Om optimaal gebruik te maken van de veelzijdige extractant, is het ontwerpen van een extractor voor een ‘multiproduct’ omgeving interessanter dan het ontwerpen van een ‘één-product’ extractor. Uit berekeningen blijkt dat de specificatie voor een bepaalde productzuiverheid en opbrengst op diverse manieren gerealiseerd kan worden, en dat de procescapaciteit toeneemt naarmate er meer evenwichtstrappen dan het minimum aantal beschikbaar zijn. Alle systemen uit hoofdstuk 4 waarvoor een selectiviteit van 1.5 in de enkele trap is bereikt, kunnen gescheiden worden met de gewenste specificatie als er een extractor beschikbaar is met 50 evenwichtstrappen, gelijk verdeeld over de was- en stripsectie. In hoofdstuk 7 worden de voorspellingen van het multistage model experimenteel getoetst in een opstelling bestaande uit twee holle-vezel membraanmodules. Vrijwel twee evenwichtstrappen worden gerealiseerd per module, waarmee een gedeeltelijke chirale scheiding wordt behaald. De invloed van de stroomverhoudingen (oplosmiddel/voeding) en (wasstroom/oplosmiddel) op de zuiverheid in de experimenten is kleiner dan voorspeld, wellicht doordat de experimentele verblijftijden niet voldoende lang waren. De trends in de experimentele en voorspelde opbrengst (yield) zijn aan elkaar gelijk. Het effect van een temperatuurdaling is in het experiment vrijwel nihil, waarschijnlijk doordat de gunstiger evenwichtsligging en de langzamere kinetiek bij lagere temperatuur elkaars werking opheffen. Een betere scheiding zou kunnen worden gerealiseerd in modules met kleinere membraanvezels door een groter uitwisselend oppervlak. Verder zouden de experimentele resultaten met een tijdsafhankelijk model waarschijnlijk beter verklaard kunnen worden. In het laatste hoofdstuk worden de conclusies uit het proefschrift op een rijtje gezet en wordt FREX vergeleken met de voornaamste concurrerende industriële scheidingstechnieken, te weten kristallisatie en SMB chromatografie. FREX heeft op papier diverse voordelen ten opzichte van deze technieken. Echter, om FREX in de industriële praktijk in te kunnen voeren is meer onderzoek en ontwikkeling nodig. Een economische evaluatie zal moeten uitwijzen of FREX inderdaad de beste keuze is voor een specifiek scheidingsprobleem. Verder moet er aandacht besteed worden aan apparaatselectie en -ontwerp en methoden voor opschaling. Voor een betrouwbaar ontwerp is in ieder geval vereist dat reactiekinetiek en stofoverdracht in reactieve-extractiesystemen beter beschreven kan worden. Voor toepassing van FREX als scheidingstechniek voor enantiomeren anders dan amines en amino-alcoholen is ontwikkeling van nieuwe extractanten voor andere klassen van chemicaliën essentieel. De ontwikkelde selectiemethode lijkt hiervoor bruikbaar.

Chapter 1
1
1 Introduction This thesis is concerned with the development of a new separation method for optical isomers,
namely fractional reactive extraction. In this chapter, it is explained why optically pure
substances are economically interesting, why we aim at separation instead of direct
stereospecific synthesis, why fractional reactive extraction is promising as chiral separation
technique and which obstacles need to be dealt with for successful application. The chapter is
concluded with the outline of the thesis.
1.1 Chirality Many naturally occurring substances possess chirality, which is the property that a substance and its mirror image are not superimposable1. In every-day life, many examples can be found as well: the left and right hand are each other’s mirror image, the right foot does not fit in the left shoe, and a screw is always tightened in the same direction (figure 1).
Figure 1: examples of chiral objects in every-day life: hands, dice, spiral staircase
On molecular scale, chirality originates from the three-dimensional orientation of the atoms in the molecule. In many cases, a ‘chiral centre’ or ‘asymmetric carbon atom’ can be identified in a chiral molecule: if a carbon atom is connected to four different side groups, the molecule is automatically chiral because of the tetraeder structure (figure 2). But the presence of a chiral centre is not a prerequisite for a molecule to be chiral. A molecule can also possess planar or axial chirality, like a macro-scale screw or a spiral staircase.2 In this study, the focus will be on chirality that originates from a chiral centre.
QP
RS
PQ
RS
Figure 2: Chirality originating from a chiral centre; the two molecules are each other’s
mirror image

Introduction
2
Mirror isomers are usually referred to as enantiomers or as optical isomers. A 50/50 mixture of two enantiomers is called a racemic mixture. The term ‘optical isomer’ originates from the rotation effect of chiral molecules on plane-polarised light: one enantiomer will rotate this polarised light to the left-hand side, the other to the right-hand side. Apart from this optical effect, the physical properties such as boiling point, viscosity etc. are in general the same for both enantiomers of a substance. The chemical interaction with achiral reagents is also the same for both enantiomers. Only with reagents that are chiral themselves, enantiomers can show quite different interactions. This may be the reason that the chemical implications of chirality often have been neglected in the past, although the concept of chirality has been known for a long time. Various nomenclature systems for enantiomers exist. The Cahn-Ingold-Prelog convention is a systematic system, using R and S for designating the three-dimensional structure on each asymmetric carbon in the molecule. The (+) and (-) nomenclature is based on the rotation direction of polarised light. Furthermore, for biological systems the D and L signs are used to distinguish between enantiomers; the designation L or D is based on the structural similarity of the molecule with D-(+)-glyceraldehyde, which serves as a ‘benchmark’ molecule. For molecules with other types of chirality, other nomenclature systems are in use: helicity and planar chirality is described by P (plus = clockwise) or M (minus = anticlockwise); molecules with axial chirality are also named P and M or Ra and Sa.2
1.2 Implications of chirality for the chemical and pharmaceutical industry Chirality plays an important role in biological systems. For instance, enzymes are chiral biological polymers consisting of solely L-amino acids. They are highly structured compounds: their secondary and tertiary structure is determined by the amino acid constituents. Enzymes function as molecular receptors by binding selectively to specific molecules. As enzymes are chiral, they commonly interact much stronger with one enantiomer of the ‘target’ molecule: a form of chiral recognition. Enzyme selectivity was explained already in 1894 by Fischer with the ‘lock-and-key’ concept: one enantiomer ‘fits’ in the enzyme cavity, the other enantiomer does not (figure 3). The lock-and-key concept was reformulated later as the three-point rule (Easson & Steadman, 1933) and its variations. This rule states that at least three non-coplanar interactions are required for chiral recognition: then all three interactions are present between the ‘best-fitting’ enantiomer and the receptor, but with the other enantiomer only two interactions are possible. Variations and refinements to this rule have been reported. The most important one is that the interactions may be attractive or repulsive: steric hindrance often plays an important role in chiral recognition.

Chapter 1
3
Figure 3: Lock-and-key concept
The therapeutic effect of a pharmaceutical substance is often based on binding with molecular receptors, usually in competition with the ‘original’ target molecule. Because of the chirality of the molecular receptor, the two enantiomers of a pharmaceutical substance may have a completely different effect. Often, one of the enantiomers is much more active than the other. Moreover, the enantiomers may have effects that oppose each other, or that complement each other. In some cases one of the enantiomers causes serious side effects, all because of the differences in interaction with the molecular receptors. Therefore, it seems logical to study the effects of the enantiomers separately and as a mixture, and to administer only the effective enantiomer, unless there are good reasons to administer the racemate. A dramatic example of different behaviour of enantiomers from the past is thalidomide (figure 4a). This substance was marketed as Softenon in the 1960s and was administered as a racemate. The S-enantiomer proved to be highly teratogenic, whereas the R-enantiomer was the active ingredient. It is believed nowadays that administering thalidomide as single isomer would not have prevented the problems, because thalidomide is easily racemised within the human body. Nevertheless, a more detailed study of the effect of each enantiomer could have prevented much harm.
NNH
H
O
O
O
O
O NHH OH
NHH OH
OH
OH
Figure 4: (a) S-thalidomide (b) S-propranolol (c) noradrenaline
Furthermore, it is known that for most beta-blockers the S-enantiomer is the most active enantiomer. The S-enantiomer has the same threedimensional structure as the adrenergic hormone noradrenaline (figure 4b+c). The R-enantiomer of the betablocker does not give serious side-effects, but it does not add to the pharmacological effect either, so it can be considered as ‘isomeric ballast’. The most sold beta-blockers (propranolol, atenolol, metoprolol) were developed in the 1970s and are still marketed as racemate. If these substances would have been developed today, it can be expected that they would have been introduced as single enantiomers.
Introduction
4
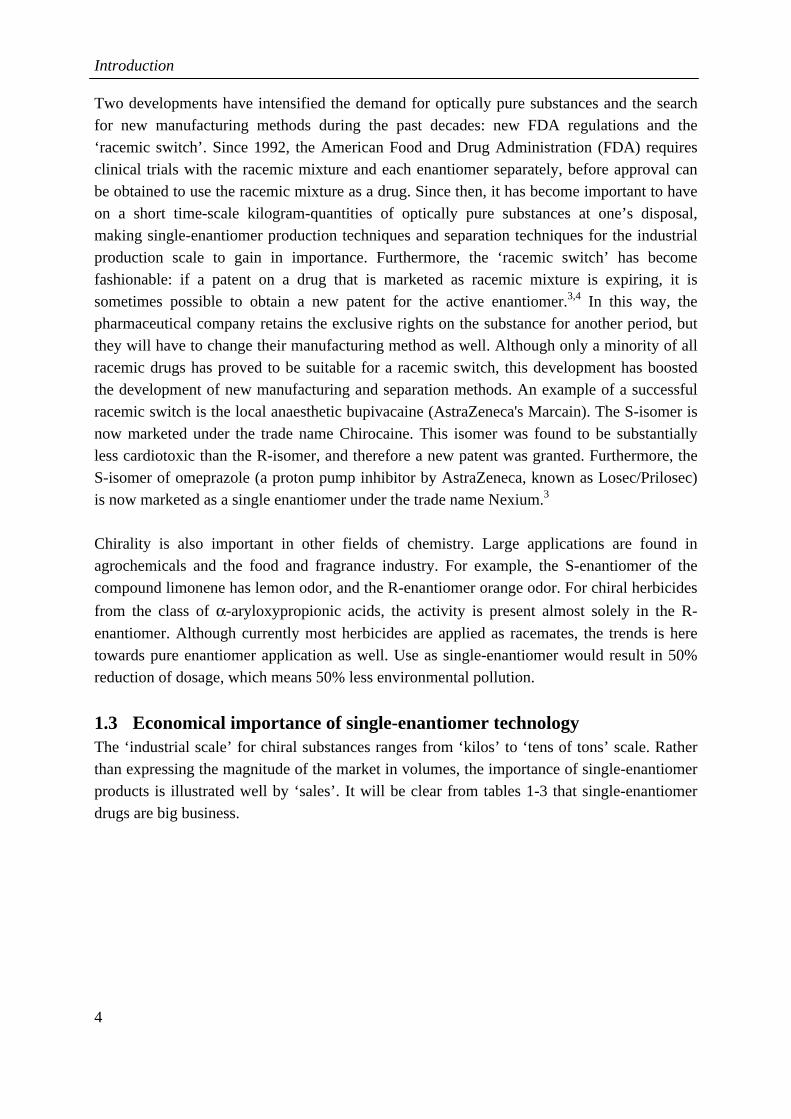
Two developments have intensified the demand for optically pure substances and the search for new manufacturing methods during the past decades: new FDA regulations and the ‘racemic switch’. Since 1992, the American Food and Drug Administration (FDA) requires clinical trials with the racemic mixture and each enantiomer separately, before approval can be obtained to use the racemic mixture as a drug. Since then, it has become important to have on a short time-scale kilogram-quantities of optically pure substances at one’s disposal, making single-enantiomer production techniques and separation techniques for the industrial production scale to gain in importance. Furthermore, the ‘racemic switch’ has become fashionable: if a patent on a drug that is marketed as racemic mixture is expiring, it is sometimes possible to obtain a new patent for the active enantiomer.3,4 In this way, the pharmaceutical company retains the exclusive rights on the substance for another period, but they will have to change their manufacturing method as well. Although only a minority of all racemic drugs has proved to be suitable for a racemic switch, this development has boosted the development of new manufacturing and separation methods. An example of a successful racemic switch is the local anaesthetic bupivacaine (AstraZeneca's Marcain). The S-isomer is now marketed under the trade name Chirocaine. This isomer was found to be substantially less cardiotoxic than the R-isomer, and therefore a new patent was granted. Furthermore, the S-isomer of omeprazole (a proton pump inhibitor by AstraZeneca, known as Losec/Prilosec) is now marketed as a single enantiomer under the trade name Nexium.3 Chirality is also important in other fields of chemistry. Large applications are found in agrochemicals and the food and fragrance industry. For example, the S-enantiomer of the compound limonene has lemon odor, and the R-enantiomer orange odor. For chiral herbicides
from the class of α-aryloxypropionic acids, the activity is present almost solely in the R-
enantiomer. Although currently most herbicides are applied as racemates, the trends is here towards pure enantiomer application as well. Use as single-enantiomer would result in 50% reduction of dosage, which means 50% less environmental pollution.
1.3 Economical importance of single-enantiomer technology The ‘industrial scale’ for chiral substances ranges from ‘kilos’ to ‘tens of tons’ scale. Rather than expressing the magnitude of the market in volumes, the importance of single-enantiomer products is illustrated well by ‘sales’. It will be clear from tables 1-3 that single-enantiomer drugs are big business.

Chapter 1
5
Table 1: Growth: revenues from chiral technology will near $ 15 billion by 20095
Revenue ($ billions) Annual growth
1999 4.80 2000 5.40 12.5 % 2001 6.10 13.0 2002 7.00 14.8 2003 7.74 10.6 2004 8.57 10.8 2005 9.53 11.1 2006 10.61 11.3 2007 11.85 11.7 2008 13.28 12.1 2009 14.94 12.5
Source: Frost & Sullivan
Table 2: Steady share: worldwide sales of single-enantiomer pharmaceutical products
approach $ 160 billion5
2001 2002a single-enantiomer single-enantiomer
$ billions total market
sales market share
total market
sales market share
Cancer 17.0 13.8 81% 18.7 16.8 90% Antibiotics/antifungal 33.0 26.9 82 33.7 26.8 80 Hematology 16.5 10.7 65 17.8 13.8 78 Hormones/endocrinology 26 18.8 72 29.9 19.4 65 Cardiovascular 50.0 30.0 60 52.5 30.4 58 Vaccines 8.5 4.3 51 9.2 4.5 49 Antiviral 20.0 6.1 31 21.0 6.7 32 Ophtalmic 8.0 2.5 31 8.5 2.7 32 Central nervous system 55.0 10.5 19 56.6 12.0 21 Respiratory 42.0 7.9 19 43.5 9.3 21 Gastrointestinal 50.0 5.4 11 53.0 7.2 14 Dermatology 18.5 1.2 6 18.6 1.1 6 Analgesics 23.5 1.2 5 24.0 1.2 5 Others 42.0 6.8 16 42.2 7.2 17
TOTAL 368.0 139.3 36% 387.0 151.9 37% a primary estimates. Source: Technology Catalysts International

Introduction
6
Table 3: Blockbusters: top 10 single-enantiomer products belong to billion-dollar club5
Brand name Marketer Therapeutic area 2002 sales ($ billions)
Lipitor Pfizer Cardiovascular 8.0 Zocor Merck Cardiovascular 5.6 Pravachol, Mevalotin Bristol-Myers Squibb
and Sankyo Cardiovascular 4.0
Paxil GlaxoSmithKline Central nervous system 3.1 Plavix Sanofi Synthelabo and
Bristol-Myers Squibb Hematology 2.9
Zoloft Pfizer Central nervous system 2.7 Advair, Seretide GlaxoSmithKline Respiratory 2.4 Nexium AstraZeneca Gastrointestinal 2.0 Augmentin GlaxoSmithKline Antibiotic 1.8 Diovan Novartis Cardiovascular 1.7
Total 34.2
Source: Technology Catalysts International
1.4 Sources of enantiopure substances In general, there are three ways to obtain optically pure substances (figure 5):
• from natural sources
• by selective synthesis of the desired enantiomer
• by separation of a racemic mixture
natural sources'chiral pool'
selective synthesis
separation'resolution'
agriculture
separationmethods
kinematicresolution
asymmetricsynthesis &
catalysis
fermentation
chiral reagents
biocatalysis
chromatography
crystallisation
novel methods
chiral catalysts
Figure 5: Scheme of most important methods to obtain optically pure substances
Natural sources are often referred to as the ‘chiral pool’. The most important classes of chiral pool substances are amino acids, carbohydrates, hydroxy acids, terpenes and alkaloids.6

Chapter 1
7
Examples of applications are found in the fine chemical and pharmaceutical industry. For instance, L-proline is used as key raw material for various ACE-inhibitors, inclusing Captopril, Enalapril and Lisinopril. Terpenes such as pinene, menthol and camphor are used primarily as (raw materials for) chiral auxiliaries, such as resolving agents and chiral ligands for asymmetric catalysis. Many selective or ‘asymmetric’ synthesis routes have been developed that yield an enantiopure or an enantio-enriched product.7,8 In these methods, chirality has to be transferred to the product molecule in one way or another. This can be achieved by using a chiral reagent, yielding a chiral product; the chiral reagent is consumed in the reaction or used catalytically. In these syntheses, a very low reaction temperature (-100 °C) is commonly required, which brings about scale-up problems.9 Asymmetric synthesis can also be carried out by using a chiral catalyst. For example, catalytic asymmetric hydrogenation can be carried out with a rhodium complex of a monodentate chiral ligands.7 A variety of chiral ligands is available. A well-tuned reaction may yield an e.e. of > 90%, but 100% conversion and 100% e.e. cannot be obtained. The technique of fermentation1 can be classified both under ‘natural sources’ and ‘selective synthesis’. In fermentation, micro-organisms (yeasts, fungi, bacteria) produce optically pure substances usually as a metabolite. Originally, the range of products was restricted to compounds that are produced naturally by various micro-organisms. Nowadays, micro-organisms are also producing a variety of non-natural chemicals, partly after spontaneous mutations, and partly after genetic engineering. Fermentation as production technique has gained importance due to advances in genetics on one hand, and in biochemical engineering on the other hand (micro-organism immobilisation, in situ product removal, use of non-aqueous solvents, etc). Instead of using a complete micro-organism, the active enzyme can also be isolated and used in selective synthesis of compounds. Using such enzymes is sometimes referred to as ‘biocatalysis’, and this technique may be classified under ‘selective synthesis’ as well. For example, since 2001 BASF has been operating two plants that produce chiral intermediates such as phenylethylamine under the trademark: ChiPros with a selective lipase.10 Separation or resolution of a racemic mixture is the third main technique to obtain enantiopure substances. In direct chiral separations, there is no difference in physical properties and the interaction with a chiral separating agent or ‘chiral selector’ is required to achieve the separation. The exception to this rule is the separation by crystallisation of so-called conglomerates, which are compounds that form single-enantiomer crystals; 5-10 % of all solids are estimated to be conglomerates. An important class of separation techniques are diastereomer separations; here the enantiomers are first reacted with an optically pure reagent to yield diastereomers, which differ in physical properties and can be separated in various ways.

Introduction
8
For direct analytical-scale separations many chromatographic techniques are in use, such as HPLC,11 GC,12 TLC and electrophoresis.13 The chiral selector is either attached to the solid phase or used as additive in the mobile phase. For lab-scale preparative separations, crystallisation and HPLC/liquid chromatography are the main techniques. The majority of industrial-scale separations is carried out by (diastereomer) crystallisation,14 but simulated moving bed (SMB) chromatography is rapidly advancing.15 One of the largest applications of SMB is the resolution of the antidepressive agent Celexa (citalopram) by Forest Laboratories, with a capacity of about 50 ton/year (2002). Several other preparative separation techniques are under development. Examples are reactive extraction,16,17 liquid membrane18,19 and solid membrane separations,20,21,22 and various separations of diastereomeric mixtures, for instance by supercritical extraction23,24 or by distillation25. For these techniques, much lab-scale work but no full-scale applications were reported so far. An overview of separation methods is given in figure 6.
chiralseparation
crystallisation
reactive extraction
membrane technology
chromatography
diastereomer sepn. bydistillation, extraction, ..
direct separationof enantiomers
separation ofdiastereomers orother derivatives
analysis lab-prep industrial
x
x x
x x
x x x
x x
Figure 6: main chiral separation methods and current fields of application
1.5 Importance of chiral separation technology It should be discussed which of the many routes to obtain optically pure sustances should be selected. If a ‘chiral pool’ route to enantiopure substances is applicable, this is to be preferred, as these are the most straightforward routes. But, the amount of end products thus obtainable is limited: not each desired compound can be won from natural sources or produced by fermentation. Secondly, if the optical purity is not high enough, a subsequent separation or purification step is still needed. If the compound cannot be taken from the chiral pool or produced from a chiral pool material, direct production of the desired enantiomer may seem the most attractive. Asymmetric synthesis promises to yield only the desired enantiomer, so there is less waste than in synthesis of a racemic mixture followed by resolution. However, even if an asymmetric synthesis route would be available for each desired compound, there would still be a need for chiral separation methods. First of all, asymmetric synthesis routes often lead to a enantio-

Chapter 1
9
enriched product, which has to be purified further to obtain the desired optical purity: so there is a need for separation. Here a parallel can be seen with non-chiral chemistry: in most processes about 70% of the investment is spent on separations because 100% selectivity and 100% conversion cannot be obtained in the reactor. So, it is important to have chiral separation methods for the final purification step in order to provide the desired product quality to the customer. Secondly, when considering the ‘waste’ issue the complete processes should be compared. Asymmetric synthesis routes tend to be complicated, with very expensive catalysts, and often consist of multiple steps. If a compound A can be produced as a racemic mixture in a two-step synthesis, and then resolved into its enantiomers, this is probably preferable to an asymmetric synthesis of the desired enantiomer of A in a seven-step selective route, both for environmental reasons and economical reasons. This is even more true if an easy way to racemise to unwanted enantiomer is available. The production of single-enantiomer verapamil (Celltech-Chiroscience) may serve as an example.5,26 The S and the R-enantiomer of this substance are both interesting, as they can be used to treat hypertension and angina, respectively. The lab-scale asymmetric synthesis routes were complex and therefore impractical for a larger scale synthesis. It was found that verapamilic acid, a precursor of the
drug, could be resolved cost-effectively by diastereomer crystallisation using α-
methylbenzylamine as resolving agent. As the demand for the S-enantiomer is larger than for the R-enantiomer, the company is currently studying a racemisation method. It is clear that separation methods are and will remain important.27 For the industrial scale, only two techniques seem to be used widely at this moment. The majority of large-scale separations is done by diastereomeric crystallisation; the enantiomers first react with an optically pure material, and the resulting diastereomers are separated by crystallisation. If the substance forms conglomerates, direct crystallisation can be used. The major drawbacks of the diastereomer crystallisation method are the need for solid-phase handling and its inflexibility: for each new racemic mixture, a new resolving agent and resolution method has to be devised. Although screening can be speeded up by applying ‘Dutch Resolution’,28,29
, there is quite some development time needed for each new compound. This is a large disadvantage in the pharmaceutical industry: a company has to sell as much of a new product as possible before the patents expire, so a fast time-to-market is often more important than cost reductions in the production. The second drawback is inherent to crystallisation: the process is relatively slow, difficult to control, and the handling of solids/ slurries is more complicated than the handling of liquids. Finally, in diastereomeric crystallisations a stoichiometric amount of enantiopure reagent is needed, two additional process steps are required, namely derivatization and product recovery, and the enantiopure reagent is either consumed or has to be recovered as well. A large-scale technique that is gaining importance steadily is simulated moving bed chromatography (SMB), an efficient method to carry out HPLC separation continuously. The separating agent is immobilised as the chiral stationary phase. Simulated moving bed

Introduction
10
chromatography is more flexible than crystallisation: only a relatively low selectivity is required because a large number of theoretical stages is present, and therefore the same column material can be used to separate several enantiomers. The chiral separating agent is not consumed. These seem to be the main reasons why SMB is gaining importance over crystallisation. The main drawbacks of SMB are the extremely high cost of the chiral solid phases, and the low productivity per gram of phase per day: the solid phase is easily overloaded. Furthermore, the product streams are diluted considerably in the process because separation and recovery have to be carried out under similar process conditions. Therefore, an alternative separation process for direct separation of enantiomers should be flexible and suitable for the commercial production scale; the development time for each new pair enantiomers to-be-separated should be lower than in crystallisation, and solid-phase handling should be avoided. Furthermore, the cost of the technique should be lower and the dilution of the products should be less than in SMB.
1.6 Fractional reactive extraction Fractional reactive extraction is proposed as alternative for diastereomer crystallisation and SMB chromatography. In this method, the well-known conventional liquid-liquid extraction process30,31 is combined with a reversible enantioselective complexation reaction (figure 7a). To obtain both enantiomers in the desired purity, the fractional extraction scheme is proposed (figure 7b): an additional wash stream will remove the co-extracted undesired enantiomer from the extract.32,33
R R + C RC
S S + C SC
aq orgKR
KS
P
P
FEEDR,S
WASH
RAFFINATES
SOLVENTC
EXTRACTR, C
Figure 7: (a) single extraction stage: example of equilibria between enantiomers ‘R’ and ‘S’
and enantioselective extractant ‘C’ (b) fractional extraction scheme, assuming that R is
preferentially extracted (KR > KS)
It is expected that some of the drawbacks encountered in crystallisation and SMB technology may be overcome, or at least reduced by using fractional reactive extraction.34,35 In extraction, no solid phase handling is involved; the chiral selector (extractant) is not consumed; if a versatile selector is used (i.e. a selector that is selective for various compounds from the same chemical class), the process will be flexible. In comparison with SMB, it is expected that a selector in free solution can be present at larger concentrations than on a surface, resulting in a higher loadability of the selector phase. Because of the higher loadability, the volumetric

Chapter 1
11
capacity of reactive extraction will be higher than in SMB, so the process equipment will be smaller, and a more concentrated feed stream can be handled. A selector in free solution will also be much cheaper than a selector on a support, if the ‘price per active site’ is compared. Finally, as the ‘separation’ and ‘product recovery’ steps do not have to be carried out under the same conditions (in terms of temperature and pH), product recovery is expected to be easier and thus cheaper in reactive extraction, and the dilution of the feed is also expected to be lower, resulting in a better ‘product quality’. To reach these improvements over the existing separation techniques, the following characteristics of the enantioselective extractant can already be stated:
• selectivity should be sufficient
• versatility: the selector should be selective for a number of compounds from the same chemical class; it should preferably be selective for underivatised substances
• reversibility: the complexation reaction should be reversed easily, in order to obtain the product and to recover the extractant for re-use.
• solubility: the selector should be well soluble in one phase (for a high volumetric capacity) and not soluble in the other liquid phase (to avoid losses by leaching)
• other demands, such as acceptable chemical stability, acceptable cost, low toxicity. Fractional reactive extraction for chiral separations is not new. The process has been demonstrated on lab-scale for various enantiomer separations. Furthermore processes are reported in literature that are essentially fractional liquid-liquid extraction processes, but that appear under other nomenclature. Examples of such related processes are ‘counter-current distribution’ or ‘countercurrent chromatography’,36 ‘centrifugal partition chromatography’,37 ‘Craig extraction’38 and ‘counter-current droplet chromatography’39. A rather large amount of literature is available on single-stage liquid extraction (named ‘batch-wise equilibration’, ‘partitioning experiments’ ‘distribution’, etc) for partial chiral separation.40,41 Extraction is often used to evaluate new chiral selectors, but most of these references do not consider reactive extraction as preparative separation technique, nor contain information that can be used directly for an extraction process design. Literature references on FREX for chiral separation go back to the 1960’s. Romano et al.42 report the synthesis of ‘liquid ion exchangers’ based on methylbenzylamine as selectors for chiral separation of sodium mandelate and sodium-N-acetyl-alanate. The selectors were evaluated by batch extraction and by counter-current extraction in a Craig apparatus. Bauer et
al.43 report optical enrichment of chiral ferrocene derivates by ‘counter-current distribution’, employing (+)-diethyltartrate as chiral selector. Bowman et al.44 studied partitioning of racemates between an aqueous phase and a tartaric acid ester phase. A widely studied, versatile extractant system is based on alkyl derivatives of L-proline or L-hydroxyproline with Cu2+ ion. A 1:2 copper-ligand complex is formed in the organic phase, in

Introduction
12
which one of the ligands can be exchanged selectively for an amino acid enantiomer. The ligand system originates from chromatography45,46 and was introduced as enantioselective extractant by Takeuchi et al.47 A number of amino acids and mandelic acid48 were resolved with this system, with single-stage selectivity ranging from 1.4 to 3. Various lab-scale equipment designs employing the fractional extraction scheme were reported, usually consisting of two separate units representing the wash and strip section. Takeuchi et al.49 use a set-up based on two rotating glass columns to separate DL-valine. The liquid phases are contacted counter-currently and the feed is entered in between (figure 8). The same set-up was also applied for separation of lanthanides with D2EHPA in hexane.50 Nishizawa et al.48 use a related design called a ‘liquid particle extractor’ to separate mandelic acid with N-dodecyl-L-proline Cu(II) complex. Ding et al.51 use two hollow fiber membrane modules for separation of leucine. Yokouchi et al.52 carried out fractional reactive extraction in a cascade of small-scale mixer-settlers. All these designs have in common a small scale, a large amount of theoretical stages and long residence times (2-24 hr), resulting in very pure products streams but a low productivity (1-10 mg/hr range).
Figure 8: ‘Takeuchi’ fractional extractor consisting of rotating glass columns49
A ‘proof-of-principle’ of fractional reactive extraction for chiral separation is therefore available, but despite its potential advantages over the other chiral separation techniques, the process has not become common practice in industrial chiral separation. Two main reasons seem to be responsible for this. Firstly, it is difficult to identify enantioselective extractants that fulfil all requirements listed, especially sufficient selectivity, capacity and versatility, and that can still be used economically. Till now, only for separation of amino acids a significant amount of research on extractants is reported.47 For introduction of FREX as all-round chiral separation technique, enantioselective extractants need to be available for all major classes of chiral

Chapter 1
13
compounds. For this study, the class of amines and amino-alcohols was selected because many optically pure amines and amino-alcohols are important chiral intermediates.1 The component phenylglycinol was chosen as archetype model enantiomer. To study the influence of molecular structure, the following model enantiomers were included in the set of model enantiomers (figure 9): phenylglycinol archetype 2-amino-1-phenylethanol phenyl group and chiral centre shifted; ‘2a1pe’ 2-aminobutanol aliphatic instead of aromatic compound norephedrine as 2a1pe, with introduction of second chiral centre ephedrine as norephedrine, but secondary amine
phenylethylamine no hydroxy group. ‘α-methylbenzylamine’ or ‘PEA’
2-aminopentane aliphatic amine All studied amino-alcohols have the hydroxyl group and amino group on neighbouring carbon atoms, and all components are primary amines except for ephedrine.
OH
NH2
*
NH2
OH
*
OH
NH2
*
NH2
CH3
OH
* *
(a) phenylglycinol (b) 2-amino-1-
phenylethanol (c) 2-aminobutanol (d) norephedrine
NH
CH3
CH3
OH
* *
NH2
*
NH2
*
(e) ephedrine (f) phenylethylamine (g) 2-aminopentane
Figure 9: Structure of amino-alcohols and amines studied. * indicates a chiral centre
No feasible enantioselective extractant system is available for these substances. One versatile extractant system was developed by Prelog and coworkers,16 but the selectivity and capacity of this system are too low for commercial application. Secondly, the productivity was very low in all of the systems as tested in lab-scale / pilot equipment, probably because the emphasis has been on the maximisation of the selectivity and on the design of pilot equipment. Therefore, an economic evaluation study based on these papers will not be positive. A key subject for this thesis is therefore increase of productivity and further development of fractional reactive extraction technology.

Introduction
14
1.7 Outline of the thesis In this first chapter, the importance of industrial chiral separation has been shown, and the disadvantages of current chiral separation processes for the commercial production scale have been listed. The aim of this thesis is to study fractional reactive extraction (FREX) as alternative chiral separation technique for the commercial production scale. Amines and amino-alcohols were selected as model enantiomers. Two main issues were identified that need to be resolved for a successful introduction of fractional reactive extraction:
• identification of enantioselective extractants
• improvement of productivity / technology development In the second chapter the potential of fractional reactive extraction will be demonstrated in more detail by studying the obtainable productivity increase for leucine separation with N-dodecyl-L-hydroxyproline Cu(II) complex, a reactive extraction system for amino acid separation that has been described in literature by various authors. The high versatility and selectivity of this system are already known. The third chapter of this thesis will focus on the identification of enantioselective extractant systems. For this purpose, the set of model enantiomers is used containing amino-alcohols and amines with structural variation. It is attempted to exploit the vast amount of analytical and chemical literature on chiral recognition rather than developing new chiral selectors. Chiral recognition is discussed in much chemical literature as a phenomenon in itself,53 and it is applied in various analytical techniques for a range of chiral substances. It is expected that some of these cases of chiral recognition will provide leads to new enantioselective extractants. An approach for transfer of chiral selectors from other techniques to extraction will be proposed and evaluated. After that, the selectivity and capacity of the best enantioselective extractant system identified in chapter 3 are experimentally characterised in chapter 4. The influence of process parameters such as pH, temperature and concentrations are studied, as they are expected to have a large influence on the capacity and selectivity. Product and extractant recovery is studied experimentally as well, because efficient product recovery and re-use of the extractant is a prerequisite for an economically feasible process. Along with the experiments, a predictive single-stage model based on the chemical and physical equilibria is developed and validated. The kinetics of extraction have to be sufficiently fast for an economically feasible process and are therefore discussed in chapter 5. In a reactive extraction system, both the mass transfer and the reaction kinetics may be rate-determining. Therefore, the mass transfer rate and reaction kinetics are studied in the modified Lewis cell for the reactive extraction system from chapter 3/4 and for the C12Hyp-Cu(II) system from chapter 2. The applicability of kinetic models and regime analysis for measuring reaction kinetics in reactive extraction is discussed.

Chapter 1
15
In chapter 6, the single-stage equilibrium model from chapter 4 is expanded to a multistage fractional extractor model, and the influence of changes in flow rates and other process parameters on the selectivity and capacity of the separation is studied by model simulation. The options of recovery of enantiomers and extractant are studied as well. The consequences for conceptual design of a fractional extractor are discussed qualitatively. In chapter 7, pilot plant tests in a hollow fiber membrane module set-up to test the multistage model predictions are reported. The thesis is concluded with conclusions and outlook in chapter 8.
References 1 Sheldon RA. Chirotechnology, Industrial synthesis of optically active compounds. Marcel Dekker Inc.;1993. 2 Eliel EL, Wilen SH, Doyle MP. Basic organic stereochemistry. Wiley-Interscience;2001:608-611 3 Houlton S. Chiral switches lead to blockbuster drugs. Manufacturing Chemist 2002;73(1):28-30 4 Rouhi AM. Chirality at work. Chem & Eng News 2003;May 5:56-61 5 Rouhi AM. Chiral business. Chem & Eng News 2003;May 5:45-55 6 Ager DJ, editor. Handbook of Chiral chemicals. New York:Marcel Dekker; 1999. p. 49-102. 7 Morrison JD, editor. Asymmetric Synthesis, vol. 1, Analytical methods. New York:Academic Press;1983 8 Gawley RE, Aubé J. Principles of asymmetric synthesis. In: Tetrahedron organic chemistry series, vol. 14. Elsevier Science Ltd;1996 9 Ager DJ, editor. Handbook of Chiral chemicals. New York:Marcel Dekker; 1999. p. 5 10 Rouhi AM. Chiral Chemistry. Chem Eng News 2004;82(24):47-62 11 Beesley TE, Scott RPW. Chiral chromatography. John Wiley & Sons (Separation Science Series);1998 12 Schurig V. Chiral separations using gas chromatography. Trends Anal Chem 2002;21(9+10):647-661 13 Gübitz G, Schmid MG. Chiral separation principles in capillary electrophoresis (review). J Chromat A 1997;792:179-225 14 Wood WML. Crystal science techniques in the manufacture of chiral compounds. In: Collins AN, Sheldrake GN, Crosby J, editors. Chirality in Industry II. John Wiley & Sons;1997. Chapter 7. 15 Schulte M, Strube J. Preparative enantioseparation by simulated moving bed chromatography (review). J Chromat A 2001;906:399-416 16 Prelog V, Stojanac Z, Kovacevic K, Über die Enantiomerentrennung durch Verteilung zwischen flüssigen Phasen. Helv Chim Acta 1982;65(1):377-384 17 Abe Y, Shoji T, Fukui S, Sasamoto M, Nishizawa H. Enantioseparation by dual-flow countercurrent extraction: its application to the enantioseparation of (±)propanolol. Chem Pharm Bull 1996;44(8):1521-1524

Introduction
16
18 Shinbo T, Yamaguchi T, Yanagishita H, Sakaki K, Kitamoto D, Sugiura M. Supported liquid membranes for enantioselective transport of amino acid mediated by chiral crown ether-effect of membrane solvent on transport rate and membrane stability. J Membr Sci 1993;84:241-248 19 Newcomb M, Helgeson RC, Cram DJ. Enantiomer differentiation in transport through bulk liquid membranes. J Am Chem Soc 1974;96:7367-7369 20 Keurentjes JTF, Voermans FJM. Membrane separations in the production of optically pure compounds. In: Collins AN, Sheldrake GN, Crosby J, editors. Chirality in Industry II. John Wiley & Sons;1997. p. 157-180. 21 Ent EM van der, Thielen TPM, Cohen Stuart MA, Padt A van der, Keurentjes JTF. Electrodialysis system for large-scale enantiomer separation. Ind Eng Chem Res 2001;40:6021-6027 22 Overdevest PEM, Padt A.van der. Optically pure compounds from ultrafiltration. ChemTech 1999;29(12):17-22 23 Bauza R, Rios A, Valcarcel M. Enantioselective supercritical fluid extraction from racemic mixtures by use of chiral selectors. Sep Sci Tech 2004;39(2):459-478 24 Simandi B, Keszei S, Fogassy E, Sawinsky J. Supercritical fluid extraction, a novel method for production of enantiomers. J Org Chem 1997;62:4390-4394 25 Kozma D, Fogassy E. Solvent-free optical resolution of N-methylamphetamine by distillation after partial diastereomeric salt formation. Chirality 2001;13:428-430 26 Houlton S. Resolution and racemisation of chiral drugs. Manufacturing Chemist 2001;January:16-17 27 Maier NM, Franco P, Lindner W. Separation of enantiomers: needs, challenges, perspectives (review). J Chromat A 2001;906:3-33 28 Vries T, Wynberg H, Van Echten E, Koek J, Ten Hoeve W, Kellogg RM, Broxterman QB, Minnaard A, Kaptein B, Van der Sluis S, Hulshof L, Kooistra J. The family approach to the resolution of racemates. Angew Chem Int Ed 1998;37(17):2349-2354 29 Kellogg RM, Nieuwenhuijzen JW, Pouwer K, Vries TR, Broxtermann QB, Grimbergen RFP, Kaptein B, La Crois RM, Wever E de, Zwaagstra K, Laan AC van der. Dutch Resolution: separation of enantiomers with families of resolving agents. A status report. Synthesis 2003;10:1626-1638 30 Lo TC, Baird MHI, Hanson C, editors. Handbook of solvent extraction. Wiley-Interscience;1983 31 Cusack RW, Fremeaux P, (a) Glatz D. A fresh look at liquid-liquid extraction; part 1: extraction systems. Chem Eng 1991;February:66-67 (b) Glatz D. A fresh look at liquid-liquid extraction; part 2: inside the extractor. Chem Eng 1991;March:132-138 (c) Karr A. A fresh look at liquid-liquid extraction; part 3: extractor design and specification. Chem Eng 1991;April:112-120 32 Robbins LA. Liquid-liquid extraction. In: Schweitzer PA, editor. Handbook of separation technology for chemical engineers, 3rd edition. McGraw-Hill;1997. p. 1-419/1-447 33 Perry RH, Green DW, Maloney JO, editors. Perry’s Chemical Engineers’ Handbook, 7th edition. New York:McGraw-Hill chemical engineering series;1997 34 Haan AB de, Kuipers NJM, Steensma M. Opportunities for extraction technology in chiral separations. Proc. of International Solvent Extraction Conference ISEC 2002, Cape Town, South Africa, 2002;589-596 35 Haan AB de, Simandi B. Extraction technology for the separation of optical isomers. Ion Exchange Solvent Extraction 2002;15:255-294

Chapter 1
17
36 Franco P, Blanc J, Oberleitner WR, Maier NM, Lindner W, Minguillon C. Enantiomer separation by countercurrent chromatography using cinchona alkaloid derivatives as chiral selectors. Anal Chem 2002;74:4175-4183 37 Foucault AP. Enantioseparations in counter-current chromatography and centrifugal partition chromatography (review). J Chromat A 2001;906:365-378 38 Belter PA, Cussler EL, Hu W-S. Bioseparations, downstream processing for biotechnology. New York: Wiley-interscience; 1988. p. 128 39 Oya S, Snyder JK. Chiral resolution of a carboxylic acid using droplet countercurrent chromatography. J Chromat 1986;370:333-338 40 Pietrasckiewicz M, Kozbial M, Pietraszkiewicz O. Chiral discrimination of amino acids and their potassium or sodium salts by optically active crown ether derived from D-mannose. J Membr Sci 1998;138:109-113 41 Tsukube H, Shinoda S, Uenishi J, Kanatani T, Itoh H, Shiode M, Iwachido T, Yonemitsu O. Molecular recognition with Lanthanide(III) Tris (β-diketonate) complexes: extraction, transport and chiral recognition of unprotected amino acids. Inorg Chem 1998;37:1585-1591 42 Romano SJ, Wells KH, Rothbart HL, Rieman III W. Resolution of racemic substances by liquid ion-exchange. Talanta 1969;16:581-590 43 Bauer K, Falk H, Schloegl K. Racematspaltung von chiralen Ferrocenderivaten durch gegenstromverteilung. Monatshefte fuer Chemie 1968;99:2186-2194 44 Bowman NS, McCloud GT, Schweitzer GK. Partial resolution of some organic racemates by solvent extraction. J Am Chem Soc 1968;90(14):3848-3852 45 Gil-Av E, Tishbee A, Hare PE. Resolution of underivatized amino acids by reversed-phase chromatography. J Am Chem Soc 1980;102:5115-5117 46 Davankov A, Bochkov AS, Kurganov AA. Separation of unmodified α-amino acid enantiomers by reverse phase HPLC. Chromatographia 1980;13(11):677-685 47 Takeuchi T, Horikawa R, Tanimura T. Enantioselective solvent extraction of neutral DL-amino acids in two-phase systems containing N-n-alkyl-L-proline derivatives and copper(II) ion. Anal Chem 1984;56:1152-1155 48 Nishizawa H, Tahara K, Hayashida A, Abe Y. Continuous separation method with liquid particle extractor: enantioseparation of (±)-mandelic acid. Anal Sci 1993;9:611-615 49 Takeuchi T, Horikawa R, Tanimura T, Kabasawa Y. Resolution of DL-valine by countercurrent solvent extraction with continuous sample feeding. Sep Sci Tech 1990;25(7&8): 941-951 50 Takeuchi T, Kabasawa Y, Tanimura T. Continuous separation of lanthanides by counter-current fractional extraction. J Chromat 1991;538:125-131 51 Ding HB, Carr PW, Cussler EW. Racemic leucine separation by hollow-fiber extraction. AIChE J 1992;38(10):1493-1498 52 Yokouchi Y, Ohno Y, Nakagomi K, Tanimura T, Kabasawa Y. A device for countercurrent fractional extraction and its application to continuous resolution of D,L-isoleucine. Chromatography 1998;19(4):374-375, in japanese 53 Webb TH, Wilcox CS. Enantioselective and diastereoselective molecular recognition of neutral molecules. Chem Soc Rev 1993:383-395

Introduction
18

Chapter 2
19
2 Feasibility of fractional reactive extraction as chiral separation technique: improved productivity in the chiral separation of DL-leucine
2.1 Introduction The concept of fractional reactive extraction has been proposed in chapter 1 as alternative for current large-scale chiral separation techniques. It was stated there that the feasibility of this concept so far is not very promising because of two reasons: the productivity that can be calculated for amino acid separation based on original research papers is very low, and there are no suitable versatile enantioselective extractants to separate components other than amino acids. To justify any further work on fractional reactive extraction for chiral separation, this chapter is concerned with improvement of productivity.
FEED F(A,B)
WASHW
RAFFINATE(B)
SOLVENT S
EXTRACT(A)
Figure 1: Scheme of FREX, with wash section (upper part) and strip section (lower part); the
feed F is introduced in between.
A scheme of the fractional extraction process is given in figure 1. The enantioselective extractant is in general present in the organic solvent (see chapter 1) because chiral recognition tends to be more selective in a hydrophobic environment1,2. The enantiomer that complexes most strongly with the extractant is recovered from the extract, and the other enantiomer ends up in the raffinate. The optical purity in a stream is usually expressed as enantiomeric excess3 (e.e.). For a stream in which enantiomer A is present in the highest concentration, the e.e. is defined in equation 1. If enantiomer B dominates, the e.e. is given in equation 2.
][][
][][..
BA
BAee
+−= (1)
][][
][][..
BA
ABee
+−= (2)

DL-leucine separation
20
The yield in a stream is defined as the fraction of the enantiomer in the feed that is present in that stream. For instance, the yield of enantiomer A in the extract is given in equation 3. Similarly, the yield are defined for the other enantiomer and the raffinate.
in
outEXTRACTA AF
AS
feedAtotal
extractAtotalyield
][
][, ⋅
⋅== (3)
Initial calculations for the fractional extraction process were carried out in two ways, with the
Fenske equation and the Kremser equation4. In both equations, a single-stage selectivity α is
required as input to calculate the number of stages. The Kremser equation also needs an extraction factor (E) containing the distribution ratio D and the phase ratio. The distribution ratio D represents the capacity in a single stage, and the operational selectivity in a single stage is calculated from the distribution ratios for each enantiomer:
allformsaq
allformsorgA A
AD
,
,
][
][= (4)
allformsaq
allformsorgB B
BD
,
,
][
][= (5)
B
Aop D
D=α (6)
The Fenske equation (eq. 7), which originates from the distillation literature, can be used for a
first estimate of the required number of stages Nmin at a given selectivity (αop) and purity
demand for a binary separation. xbottom and xtop are mole fractions in bottom product and top product. The minimum number of stages is reached at full reflux, so there is no actual product stream.
op
bottom
bottom
top
top
x
x
x
x
Nαln
1/
1ln
min
⎥⎥⎦
⎤
⎢⎢⎣
⎡
−−= (7)
The Kremser equation (eq. 8) is valid for dilute systems with a constant distribution ratio over the extractor and constant flow rates. The value of the extraction factor E determines the direction of mass transfer.
E
EEDyx
Dyx
Ninout
inin
ln
111
/
/ln ⎥
⎦
⎤⎢⎣
⎡+⎟
⎠
⎞⎜⎝
⎛ −⎟⎟⎠
⎞⎜⎜⎝
⎛
−−
= (8) with F
SDE ⋅= (9)
For a reactive system, all information on the reaction can be lumped into an effective
distribution ratio D for each substance (DA ≠ DB). If available, experimental values for D can
be introduced. To model the fractional extraction scheme (figure 1), the two extraction

Chapter 2
21
sections are each described by a separate Kremser equation5. The feed is introduced in between, where it is mixed with the outlet of the wash section.
2.1.1 Selectivity versus number of stages Both the Fenske equation and the Kremser equation (for fractional scheme) were applied to estimate the number of stages to reach a specified product purity, 98 % e.e. in both raffinate and extract. The results are presented in figure 2. To identify the lowest possible N with the Kremser equation, the simulations had to be done assuming a large solvent-to-feed ratio (S/F=10) and sufficiently large distribution ratios DA and DB. (See also figure 3b). The required number of stages calculated with the Kremser equation is a factor 2-2.5 higher than the number calculated with the Fenske equation, because there is a product stream. It can be seen that the number of stages is excessively high if the selectivity is close to 1. For a larger selectivity the amount of stages decreases, and at a selectivity > 2 a small rise in selectivity does not have much effect on the number of stages anymore. The ‘minimum’ selectivity cannot be determined from this picture, but depends on the overall economics of the process. A value of 1.5 will be used as the minimum value for the time being.
0
20
40
60
80
1 1.5 2 2.5 3
α op [-]
stag
es N
Kremser
Fenske
Figure 2: Stages requirement for a product purity (e.e.) of 0.98 in extract and raffinate at a
given selectivity (αop) in one stage. Data ‘Fenske’ with Fenske equation (7). Data ‘Kremser’:
F=1, S=10, W adapted to reach equal e.e. of 0.98, DB = 3, DA = αop⋅DB.
2.1.2 Flow rates and distribution ratio The model of a fractional extractor based on the Kremser equation was used to study the relation between the flow rate ratios, the distribution ratios and the number of stages. The distribution ratios are assumed to be constant over the extractor. The effect of the wash flow rate W on the extraction is given in figure 3a, for constant feed flow F, solvent flow S and distribution ratios D.

DL-leucine separation
22
0
0.2
0.4
0.6
0.8
1
0 1 2 3W/S
e.e.
raffinate
extract
0
0.2
0.4
0.6
0.8
1
0 5 10
S/F
e.e.
0
0.5
1
1.5
2
2.5
W/S
e.e.
W/S
(a) (b)
Figure 3: (a) Influence wash-to-solvent ratio (W/S) on product purity e.e., S/F=2, N=20,
DA=3 and DB=2 (αop =1.5) (b): Influence of solvent-to-feed ratio (S/F), DA=3 and DB=2 (αop
=1.5), N=20, W/S adapted to find point with equal e.e. in extract and raffinate.
The behaviour in figure 3a is typical for fractional extraction: a small wash flow results in a pure raffinate, and a large wash stream in a pure extract. At one specific W/S ratio, the e.e. in both streams is equal. The influence of solvent flow rate is given in figure 3b. For each value of S, W was adapted to reach equal e.e. in extract and raffinate. It can be seen that at a fixed number of stages and fixed selectivity per stage, the product purity can be improved up to certain limits by increasing S; then also a higher wash stream is required. From a certain S/F, the product purity does not increase anymore and the wash stream requirement increases linearly with S (=W/S constant). There is a trade-off here between product purity (stages requirement) and size of equipment. The economical optimum cannot be found from this plot alone. The role of ‘capacity of extraction’ was studied by calculating the solvent requirement to reach a certain product purity, assuming an increase in distribution ratios for both enantiomers, keeping the selectivity constant (table 1). Table 1: Influence of magnitude of distribution ratios at constant selectivity on flow rates;
constant product purity requirement (e.e. = 0.98), 30 stages. Variable S/F, W adapted to
reach equal e.e. in extract and raffinate.
DA DB S/F W/F W/S
1 0.5 10 6.5 0.65 2 1 5 6.5 1.3 4 2 2.5 6.5 2.6 8 4 1.25 6.5 5.2

Chapter 2
23
It can be seen in table 1 that the requirement for the solvent flow rate decreases proportionally with an increase in distribution ratios. Interestingly, the wash stream requirement (W/F) is constant (so W/S increases). With an increase in distribution ratios, the separation can be done with less solvent, but W/S increases, which may pose a hydrodynamical limit in certain extraction equipment. From these preliminary calculations it is clear that both single stage parameters (distribution
ratio D and selectivity α) determine largely the behaviour in the extractor. In literature on
FREX at pilot scale6,7,8,9, the authors all used very small enantiomer concentrations and a very
large extractant excess to maximise αop. There seems to be no interest in the role of the
distribution ratios, and no attempts to optimise D are reported. This does not seem the optimal approach: the value of D determines the capacity of the extractor and has a substantial influence on the product purity, whereas it follows from figure 2 that a small increase of
selectivity αop does not result in a substantial decrease in N. Furthermore, a strongly
complexing system would result in strong extraction of both enantiomers (large D’s). Theoretically, this can be counteracted by increasing W/S, but in practice there is a hydrodynamical limit. Therefore, the D’s should have certain optimal values, and both D and
αop need to be studied for a real system in a single extraction stage to see to what extent they
can be adapted. Furthermore, the overal concentration level directly influences the volumetric capacity of an extractor. If the process is operated at 10 times larger concentrations for all components, the volumetric capacity increase will be 10 if the distribution ratios are constant; the distribution ratios may change at this different concentration level as well. The aim of this chapter is to study experimentally the influence of process parameters (concentrations, T, pH, solvent) on the capacity and selectivity in the single stage for a real reactive extraction system: separation of DL-leucine with the copper(II) complex of N-dodecyl-L-hydroxyproline, in short Cu(II)-C12Hyp (figure 4a), in water/butanol. Simultaneously, the single stage will be modelled based on chemical and physical equilibria in order to improve understanding. The consequences for the productivity of the proposed process parameter changes are discussed in the last paragraph. The complex Cu(II)-C12Hyp is a versatile enantioselective extractant for chiral separation of amino acids. It was selected for this study because the enantioselectivity and the versatility of this system were already demonstrated10,11 by several research groups. The two neutral enantiomers of leucine will be referred to as ‘HL’ and ‘HD’ in the reaction schemes. The chiral ligand N-dodecyl-L-hydroxyproline is abbreviated as ‘HLi’ (for ‘ligand’) in the reaction schemes and figures, and as CxHyp or C12Hyp if the chemical structure is discussed. The copper(II) complex of the chiral ligand is abbreviated as CuLi2 in the reaction schemes and as C12Hyp-Cu(II) in the discussion of the chemistry.

DL-leucine separation
24
O
O
C12H25
N
OH
O
Cu
O
C12H25
N
OH
HD HD + CuLi2 DCuLi +HLi
HL HL + CuLi2 LCuLi +HLi
aq org
P
P KL
KD
Cu2+
CuLi2
2 HLi2 H+
KCu
(a) (b) Figure 4: (a) Chemical structure of 1:2 Cu(II) complex of N-dodecyl-L-hydroxyproline
(‘CuLi2’) (b) Main equilibria in separation of amino acids enantiomers HD and HL. Top
part: formation of 1:2 Cu(II)-C12Hyp complex ‘CuLi2’, bottom part: ligand exchange of
ligand ‘HLi’ for neutral enantiomer ‘HD’ and ‘HL’ with proton (H+) transfer.
2.1.3 Chemistry of C12Hyp-Cu(II) extractant The chiral ligand CxHyp in combination with Cu2+ ion originates from HPLC separation. C-
12Hyp-Cu(II) was applied as chiral stationary phase for separation of amino acids 10 and aromatic amino-alcohols12. The related ligand proline was used as chiral mobile phase13 to separate amino acids. CxHyp-Cu(II) complex was introduced as enantioselective extractant by Takeuchi11. Takeuchi and coworkers demonstrated that when CxHyp is present in a water-butanol system, Cu2+ ion is extracted to the organic phase by the CxHyp, and that subsequently enantioselective extraction of amino acid enantiomers can be carried out. They also found that the CxHyp selector remains in the organic phase if the alkyl tail on the CxHyp-molecule is larger than octyl (C8), and they measured the equilibrium constants of the ligand-exchange reaction. The selectivity differs for each amino acid. The C12Hyp-Cu(II) system was applied in a fractional extraction set-up for preparative separation of DL-valine6. Several other authors have also used this chemical system to demonstrate fractional reactive extraction for chiral separation of amino acids on preparative scale. Ding et al.9 used two membrane modules as extractor, and Yokouchi et al.8 applied the system in a series of mixer-settlers. The subject of these papers was either maximising the selectivity, or equipment design for lab-scale fractional extraction. A scheme of the main complexation reactions is given in figure 4b. Cu(II) ion is extracted to the organic phase by two molecules of C12Hyp, releasing two H+ ions. They form a 1:2 copper-ligand complex ‘CuLi2’ in the organic phase. Then, one of the two chiral ligands can be exchanged for an amino acid enantiomer from the aqueous phase. A mixed-ligand complex is formed and the free chiral ligand remains in the organic phase, as the ligand is not soluble
in the aqueous phase. The ligand-exchange reaction is enantioselective if KD ≠ KL. Then, one

Chapter 2
25
enantiomer is extracted to a larger extent, and the overall result is a partial chiral separation in one equilibrium stage. The copper-ligand equilibrium constant KCu is defined as:
22
22
]][[
]][[
HLiCu
HCuLiKCu +
+
= (10)
An overbar indicated a species in the organic phase. The ligand-exchange equilibrium for enantiomer D is defined in equation 11 (as imilar equation can be given for enantiomer L), and the partitioning ratio P is defined in equation 12. Note that only the neutral amino acid (‘HD’ or ‘HL’) partitions between the aqueous and organic phase.
]][[
]][[
2CuLiHD
HLiDCuLiKD = (11)
][
][
][
][
HL
HL
HD
HDP == (12)
Next to these reactions, complexations take place in the aqueous phase between Cu2+ ion, acetate (buffer) ions and the cation, anion and/or zwitterions of the amino acids. Koska and Haynes14 reported an elaborate set of complexation equilibria, for three different amino acids in water/octanol (figure 5). An attempt to measure reaction kinetics was made by Pickering and Chaudhuri15. These authors reported the overall extraction rate, which is a function of reaction kinetics and mass transfer rate, so these results are only useful for the specific contactor they used (a Lewis cell), but cannot be used for scale-up to industrial contactors.
H2L+ H++HL 2 H++L-
Cu2++L- CuL+
Cu2++2 L- CuL2Cu2++Ac- CuAc+
Cu2++2 Ac- CuAc2 Figure 5: Additional equilibria in aqueous phase for Cu(II)-C12Hyp-leucine system. HL is the
neutral L-enantiomer of the amino acid; H2L+ cation, L- anion. Ac- = acetate ion. All
equilibria involving enantiomer ‘L’ are present for enantiomer ‘D’ as well.
2.2 Experimental 2.2.1 Materials L-hydroxyproline (99%) and DL-leucine were obtained from Fluka (Buchs, Switzerland). Octanal (99%) was obtained from Acros. Dodecanal (99%), copper(II) acetate, sodium acetate, butanol and hexane (all analytical grade) were obtained from Merck (Darmstadt,

DL-leucine separation
26
Germany). The chiral ligands N-dodecyl-L-hydroxyproline (C12Hyp) and N-octyl-L-hydroxyproline (C8Hyp) were synthesised from dodecanal resp. octanal and L-hydroxyproline according to a slightly adapted method from Takeuchi et al.11 Throughout the study, milli-Q filtered water was used (Millipore, Billerica, MA, USA).
2.2.2 Extraction experiments Distribution ratios were determined from batch extraction measurements. The aqueous solution was prepared by dissolving copper(II) acetate (CuAc2), sodium acetate (NaAc) and DL-leucine in Q2-filtered water (Millipore) that was presaturated with the organic solvent to obtain a 0.2 M Ac- solution with [Cu2+]ini ranging from 2.5-50 mM and initial DL-leucine concentrations from 0-10 mM. The organic phase was prepared by dissolving the chiral ligand C12Hyp (0-100 mM) in the appropriate organic solvent, butanol or butanol/hexane, presaturated with water. The batch extractions were carried out in jacketed 25-ml vessels at a constant temperature. 10 ml of both phases were mixed for 1-3 hrs with a magnetic stirrer to reach equilibrium and then allowed to settle. After that, samples were taken from the aqueous phase with a syringe via a septum and analysed by HPLC. In initial experiments, it was confirmed that the mass balance holds within 5 %. The HPLC set-up consisted of a Crownpak (+) chiral column (Daicel, Japan), post-column derivatisation with OPA/MCE reagent and fluorescence detection according to Duchateau et al.16 The Cu(II) concentrations in some of the aqueous samples were determined by AAS (Solaar 939, Unicam, and SpectrAA110, Varian). The pH of the aqueous phase was determined at equilibrium (Inolab pH level 1, WTW) and was between 5.5 and 6, unless stated otherwise.
2.2.3 Determination of copper-ligand equilibrium constant Rearranging formula 10 yields14:
])log[(2loglog][
][log
22 HLipHKD
Cu
CuLiCuCu +⋅+==+ (13)
The ratio [CuLi2]/[Cu2+] is the distribution ratio for copper ion DCu. Therefore, a graph of log DCu as a function of log[HLi] + pH should have 2 as slope and log KCu as intercept. The aqueous and organic Cu2+ concentrations can be determined by AAS. The actual ligand [HLi]
concentration is calculated from the mass balance as [HLi]ini-2⋅[CuLi2]. The pH is measured
with the pH meter.
2.2.4 Determination of ligand exchange equilibrium constant The equilibrium constants for the enantioselective ligand-exchange reaction were determined11 from a series of extraction experiments with a varying concentration of Cu(II) ion. Using an additional variable R (equation 14), the observed distribution ratio for the amino acid enantiomer can be expressed by equation 15.

Chapter 2
27
total
total
CuHLi
CuR
][2][
][
0 −= (14) )1(
][
][][LL KRP
HL
LCuLiHLD ⋅+=+= (15)
[Cu]total denotes the total copper concentration in all forms (overbar: organic phase) and is determined by AAS. The value of the complexation constant KL can be obtained from a plot of DL versus R (R < 0.5), using a series of extraction experiments with increasing copper concentration. The determination of KL and KD has to be done separately with the pure enantiomers.
2.3 Single stage equilibrium model In a real reactive extraction system, the distribution ratio is a function of the local concentrations. A non-constant distribution ratio can be described by a model of a single equilibrium stage incorporating all relevant physical and chemical equilibria. The performance of such a model is very dependent on the quality of the input data and on the incorporation of all important chemical information. The model is also numerically more complex. The computer program Mathcad (MathSoft, Inc) was found to be a suitable tool to solve the system of non-linear algebraic equations that described the single stage. Initially, it was attempted to construct a single stage equilibrium model based only on the extraction of Cu2+ ion by the chiral ligand and the enantioselective ligand-exchange reactions (reactions in figure 4b). Although this model can be solved easily, the results could not be used to describe or clarify the experimental trends. Apparently, the other complexation reactions in the aqueous phase (figure 5) are essential for a good model prediction, and need to be included. This elaborate model for the closely related system C12Hyp-Cu(II)-phenylalanine-octanol was reported by Koska & Haynes14. The formation constants of the aqueous-phase complexes were obtained from literature or measured in titration experiments. The formation constants of the ternary complexes of phenylalanine, leucine and valine were derived from batch extraction data, obtained in the system water/octanol at a pH between 4 and 6. In this way, an equilibrium stage model was constructed which was ‘in good agreement with experimental results’. The model by Koska & Haynes is reported for phenylalanine/water/octanol and was stepwise adapted to the leucine/water/butanol system. First, the model was implemented in Mathcad and run with the parameters for phenylalanine separation in water/octanol and compared with the data of Koska & Haynes to confirm numerical correctness. Koska & Haynes did not report their experimental data for leucine, but they stated that the model was a good description for their data. Additional extraction experiments for leucine separation in water/octanol were carried out. Our experimental data and the model description with leucine parameters show reasonable agreement between pH 4 and 6 (figure 6). As the formation constants were obtained by regression of data in the pH 4-6 range, it is not surprising that extrapolation above

DL-leucine separation
28
pH 6 does not give a good result. The deviation may be caused by precipitation of Cu(OH)2 or by partitioning of leucine to octanol. It was also found that the extraction data obtained by Ding, Carr & Cussler9 for this system do not agree with our experimental data and the model by Koska & Haynes. The data by Ding et al. seem to be incorrect. It may be that equilibrium was not reached in their experiments due to insufficient mixing.
0
1
2
3
4
5
6
3 5 7pHeq
D [-
]D, model
L, model
D, exp
L, exp
D, Ding
L, Ding
Figure 6: Experimental data (this work and Ding et al.9) and model predictions for extraction
of 0.9 mM DL-leucine with C12Hyp/Cu(II) complex ([CuLi2]ini = 10 mM) in octanol, 25 °C.
After converting from phenylalanine to leucine, the model was converted from octanol to butanol. The relevant aqueous-phase complexation constants were taken from literature15,17. The equilibrium constant for the extraction of Cu(II) with C12Hyp in butanol, KCu, was determined experimentally, to be 10-3.64 [-]. The formation constant of the ternary complexes are assumed to be the same in butanol and octanol. This assumption was done to avoid additional experimental work, although we are aware of the fact that the solvent can have a large influence on equilibria. Because octanol and butanol are related solvents, it was assumed that the selectivity would be similar in both solvents, and that the strength of complexation may be different. Optionally, an electroneutrality condition can be included in the model, in order to account for the pH decrease after extraction of Cu2+. The model predictions for leucine in water/butanol will be discussed along with the experimental results.
2.4 Results In this part, the influence of process parameters on the single stage extraction is studied experimentally and compared with the single stage model predictions.
2.4.1 Influence of copper-ligand ratio From the copper-ligand reaction combined with the ligand-exchange reaction, one may expect that an excess of copper ([Cu2+]ini > 0.5 [HLi]ini) will result in a very low free ligand

Chapter 2
29
concentration [HLi]. Thus, the enantioselective equilibria are shifted to the right, resulting in formation of more mixed-ligand complexes. However, Takeuchi6 showed for valine extraction that the optimum copper concentration is [Cu2+]ini = 0.5 [HL]ini. From the experimental results in figure 7, the same conclusion is obtained for DL-leucine: an excess of copper (copper present in the aqueous phase) causes a decrease in the distribution ratios and the selectivity for leucine. Therefore, all further extraction experiments were carried out at the ‘stoichiometric’ copper concentration, and the extractant concentration is given as [CuLi2].
model pH 5.5
0
1
2
3
4
5
0 0.5 1 1.5 22[Cu2+]ini/[HLi]ini
D [-
]
model pH 6.0
0
1
2
3
4
5
0 0.5 1 1.5 22[Cu2+]ini/[HLi]ini
D [-
]
(a) (b)
model pH variable
0
1
2
3
4
5
0 0.5 1 1.5 22[Cu2+]ini/[HLi]ini
D [-
]
1
1.5
2
2.5
0 0.5 1 1.5 22[Cu2+]ini/[HLi]ini
αo
p [-
]
pH 5.5
pH 6.0
pH var
(c) (d)
Figure 7. (a-c) DL-leucine separation, influence of Cu2+-ligand ratio on distribution ratio;
experimental data (squares: L-leucine, triangles: D-leucine) with (a) model prediction with
fixed pH=5.5 (b) model with fixed pH = 6.0 (c) model with variable pH as output; (d)
experimental data and model predictions for αop. Water/butanol equal volumes, 25°C, [HLi]
= 30 mM, [DL-leucine] = 1 mM, [Cu2+] = 2.5-20 mM.

DL-leucine separation
30
No simple explanation for the optimal extraction at stoichiometric copper-ligand ratio can be given. The equilibrium stage model is able to reproduce the shape of the curves in figure 7 with reasonably accurate numerical values. Unfortunately, not all pH values in the experiments were recorded exactly; they were all roughly between 5.5 and 6, which was thought to be sufficiently constant at the time. To show the sensitivity of the results for the pH, the experimental data are given with the model predictions at fixed pH 5.5 (figure 7a) and pH 6.0 (figure 7b). Qualitatively, the influence of copper/ligand ratio is represented correctly. The model with variable pH gave somewhat better predictions (fig. 7c), but the experimental values are still not reproduced quantitatively. Finally, all models give very similar predictions for the operational selectivity (fig. 7d). It can be seen that the selectivity at sub-stoichiometric copper-ligand ratio as well as the location of the optimal copper-ligand ratio are predicted correctly, but the selectivity decrease at an excess of copper is only described qualitatively.
2.4.2 Influence of extractant excess To study the influence of extractant excess, a series of experiments was carried out at constant enantiomer concentration and increasing ‘CuLi2’ concentration, with [Cu2+]ini = 0.5 [HL]ini. ‘Extractant excess’ is defined in equation 16. Note that in the present experiments Vaq is taken equal to Vorg.
iniaq
iniorg
leucineV
CuLiVttanextracexcess
][
][ 2
⋅⋅
= (16)
Figure 8 and 9 show that there is no large increase in D or α once the excess extractant is
large enough, i.e. [CuLi2]ini/[leucine]ini > 3. Therefore, the large excess of extractant (10-50) used by a number of authors9,11 is not necessary under the circumstances studied here. It must be noted that a part of the effect on D is caused by the pH decrease during extraction. The more extractant and copper is used, the more H+ is generated. The pH drop results in a lower extent of extraction. The model predictions of the effect of excess of extractant demonstrate this clearly. If the equilibrium pH is assumed to be constant (model with fixed pH, figure 8a), the model predicts that the distribution ratios keep rising with excess selector. The trend from the model with variable pH (figure 8b) is much closer to the experimental result. The numerical values for the distribution ratios are too low, probably because of inaccuracy in formation constants of ternary complexes (which were measured in octanol, not butanol) or in the physical partitioning ratio of leucine. Similarly, the trend for operational selectivity is best represented by the model with variable pH. The actual value of the selectivity is slightly overestimated.

Chapter 2
31
model pH 6.0
0
2
4
6
0 10 20Extractant excess
D [-
]
model pH variable
0
2
4
6
0 10 20Extractant excess
D [-
]
(a) (b)
Figure 8: Influence of excess extractant on distribution ratio at 25 °C; water/butanol, [DL-
leucine] = 1 mM, [CuLi2] = 0-15 mM. Solid lines calculated with model ‘fixed pH’ pH=6 (a)
and ‘variable pH’ (b). Squares: L-leucine, triangles: D-leucine (experimental)
1
1.5
2
2.5
0 10 20
Extractant excess [-]
αo
p [-
]
pH eq 6
pH eq 5.5
pH var
Figure 9: Influence of excess extractant on operational selectivity α at 25 °C; water/butanol,
[DL-leucine] = 1 mM, [CuLi2] = 0-15 mM. Dots: experimental, lines: model prediction.
2.4.3 Influence of concentration level Some of the studies reported in literature were carried out at very low enantiomer concentrations (down to 0.1 mM). Higher concentrations of all components will increase the volumetric process capacity. The concentrations are limited by the solubility. In our system, the leucine solubility decreases from > 50 mM in water to about 10 mM in 0.1 M Cu(Ac)2. Using less concentrated buffer solutions may partially prevent this; pre-extraction of copper(II) to the organic phase also results in a higher leucine solubility. The CxHyp ligand solubility varies with the solvent and the nature of the organic tail. In butanol, the solubility at 25 °C is about 0.1 M for C12Hyp and 0.5 M for C8Hyp. It can be concluded from the

DL-leucine separation
32
experimental data in table 2 that a higher absolute concentration results in an almost unchanged selectivity but higher distribution ratios. Thus, a concentration level 10 times higher results in a 13-14 times higher capacity for forward extraction. The model prediction gives qualitatively the same result, although the actual numbers are not very accurate. Table 2. Influence of absolute concentrations on extraction, constant concentration ratios, 25
°C, water/butanol/leucine (experimental results)
[DL-leucine] [mM]
[CuLi2] [mM]
DD [-] DL [-] αop [-]
1 5 3.6 1.9 1.9 5 25 4.4 2.3 1.9 10 50 5.2 2.7 1.95
2.4.4 Influence of temperature For chiral recognition systems, the enantioselectivity often increases with decreasing
temperature18,19. To study the effect of temperature on the separation of leucine, D and αop
were determined at four temperatures using fixed concentrations (table 3). Secondly, the equilibrium constants K and the physical partitioning ratio P were determined at 5 °C. At higher temperature, both equilibrium constants become higher. This is rather unusual
behaviour indicating an endothermic reaction. The intrinsic selectivity αint is slightly higher at
the lower temperature. The influence on P is not very clear. In the extraction experiments, it is seen that the distribution ratios for both enantiomers increase with an increase in temperature, whereas the operational selectivity is practically unaffected. Table 3. Influence of temperature on leucine separation, water /butanol.
D and α: [DL-leucine] = 1 mM, [CuLi2] = 15 mM
K and P: [DL-leucine] = 1 mM, [Cu2+] = 0-8 mM, [HLi] = 30 mM
DD [-] DL [-] αop [-] KD [-] KL [-] αint=KD/KL [-] P [-]
5 °C 2.6 1.2 2.1 7.9 3.3 2.35 0.17 25 °C 4.3 2.1 2.1 16.2 7.5 2.17 0.15 25 °C 11 10.1 4.0 2.5 0.21
35 °C 5.0 2.5 2.0 45 °C 5.9 2.9 2.0
The influence of the operation temperature on the system can be described by the single stage model, although there are many unknown parameters. The temperature may have an influence on the following equilibrium properties:
• the absolute value of the equilibrium constants K in the system, and their ratio
• the partitioning ratio P
• the mutual solubility of the solvents

Chapter 2
33
For leucine in water/butanol, it was found that at 5 °C the values for KL and KD are smaller (the reactions are weaker) than at 25 °C and the reaction has a slightly higher intrinsic selectivity; the value for P is hardly affected. A weaker reaction results in smaller distribution ratios (if the partitioning is constant), and this is seen clearly in the experiments. A weaker reaction also results in less formation of ternary complexes, and thus in a lower operational selectivity. On the other hand the intrinsic selectivity is slightly larger at 5 °C, which may result in a larger operational selectivity. So, there are two counter-acting effects on the selectivity, and it is indeed seen in the experiment that the operational selectivity is only slightly affected by T. Abe18 reports for a different extractant system (extraction of beta-blockers with boric acid/didodecyl-L-tartrate in chloroform/water) a decrease in D with increasing temperature. This is in contrast with the trend in the above results, and may have two causes: P may become lower with increasing T in that system, or more likely, the absolute values of K may become smaller with increasing T (exothermic reaction). Concluding, no general rule can be given about the effect of temperature on capacity and selectivity.
2.4.5 Influence of pH The pH has a complex influence on the performance of this process. From literature15, it can be concluded that copper extraction by ligand L is favoured by a higher pH (> 5.5) and that the distribution ratios increase about five times when the pH increases from 4 to 6. The
operational selectivity αop is not severely affected6,9. If the pH becomes too high, precipitation
of Cu(OH)2 may become prohibitive. Therefore, all experiments were carried out at pH=5.5-6. No further experiments to study the influence of pH were performed at this stage.
2.4.6 Influence of the solvent So far, all reported results were obtained with water/butanol as solvents. In the literature, several organic solvents and solvent mixtures have been applied. The solvent influences the solubility of all solutes, the partition ratios and possibly the reaction by acting as a ligand itself. As an illustration of the importance of the solvent, experimental results with two solvent mixtures are represented in figure 10. It can be seen that the operational selectivity (figure 10b) is similar, but that the distribution ratio is lowered considerably in a less polar solvent mixture (figure 10a). From these data alone, it cannot be concluded if the difference is caused by a difference in magnitude of complexation constants, a difference in partitioning ratio, or a combination.

DL-leucine separation
34
0
1
2
3
4
5
0 10 20
[CuLi2] mM
DD [-
]
0
0.5
1
1.5
2
2.5
0 10 20
[CuLi2] mM
αo
p [-
]
(a) (b)
Figure 10: Influence of solvent on (a) distribution ratio for D-enantiomer and (b) selectivity
of leucine extraction. Open symbols: butanol, closed symbols: butanol/hexane 4:1 v/v. [DL-
leucine]=1 mM, 25 °C
As a further illustration of the influence of the solvent on equilibrum constants, the equilibrium constant KCu (equation 10) of copper extraction by C12Hyp in various solvents are listed in table 4. The trend in these data seems to be that the equilibrium constant is higher (so the complex is more stable) if the solvent (mixture) is less polar. Table 4: Solvent influence on the equilibrium constant for extraction of Cu(II) by C12Hyp
solvent KCu, 25 °C [-] source
butanol 2.29⋅10-4 this work
hexanol 7.08⋅10-4 14
octanol 7.76⋅10-4 14
decane/hexanol 1:1 3.09⋅10-3 15
2.4.7 Influence of volume ratio If in physical extraction the volume ratio S/F is doubled, the distribution ratio is approximately constant, so the capacity of the process roughly doubles due to doubling of the extraction factor. Similarly, with a double distribution ratio and constant S/F the extraction factor also doubles. We wondered if a similar situation exists in reactive extraction. A series of experiments was carried out in which the effect of a variable aqueous /organic phase volume ratio was evaluated. If these experiments are done at constant concentrations, the excess of extractant (equation 16) changes as well; therefore also experiments at different extractant concentrations were included, to study the effect of volume ratio at constant extractant excess. To ensure the optimum copper/ligand ratio of 1:2, the copper was pre-extracted by the ligand; then a fresh aqueous phase containing the amino acid was contacted with the pre-extracted organic phase. In this way, the equilibrium pH was slightly higher than

Chapter 2
35
in the experiments described previously, between 6 and 7. The aqueous/organic ratio was varied between 0.33 and 3. No simple ‘rules’, (such as ‘doubling the volume at constant concentration results in double capacity or double distribution ratio’) could be deduced from the results. It is clear that increasing the amount of solvent (with the same concentration of extractant) results in a higher extracted fraction of amino acid (per volume of aqueous phase), but it is difficult to formulate simple heuristics, because the relations are strongly non-linear. On the other hand, the complete model gives a rather good description of the effect of volume ratio, probably because all reaction equilibria are taken into account. The experimental data and the model results are represented in figure 11 as a parity plot. It can be seen that the fit is rather good.
0
1
2
3
4
5
6
0 1 2 3 4 5 6
experimental value
mo
del
pre
dic
tion
D(D)D(L)selectivityy=x
Figure 11: Parity plot for model predictions and experimental data for various DL-leucine
extraction experiments, water/butanol, 25 °C, [DL-leucine]= 1 or 2 mM, [CuLi2] = 5 or 10
mM, volume ratio between 0.33 and 3.
As an illustration of the influence of volume ratio in a reactive system, some model results have been compiled in table 5. The results can be compared by ‘same concentrations’ or ‘same extractant excess’. It can be seen that the distribution ratios or yields do not remain constant at constant excess or constant concentrations. To minimise the amount of expensive extractant, a large solvent volume should be used with a low concentration, to reach the largest overall extraction capacity for the amino acid; but to minimise the solvent volume (and thus the equipment size), a high extractant concentration should be used, accepting that the loading of the extractant (effective use) will be lower.
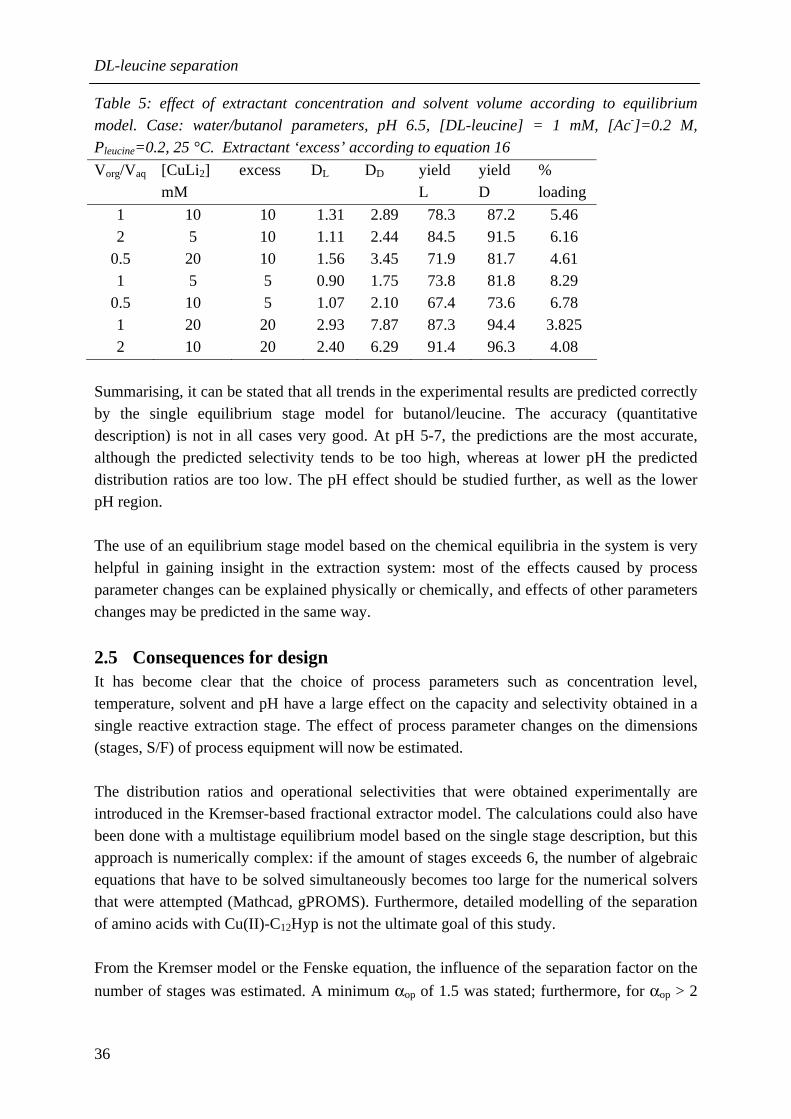
DL-leucine separation
36
Table 5: effect of extractant concentration and solvent volume according to equilibrium
model. Case: water/butanol parameters, pH 6.5, [DL-leucine] = 1 mM, [Ac-]=0.2 M,
Pleucine=0.2, 25 °C. Extractant ‘excess’ according to equation 16
Vorg/Vaq [CuLi2] mM
excess DL DD yield L
yield D
% loading
1 10 10 1.31 2.89 78.3 87.2 5.46 2 5 10 1.11 2.44 84.5 91.5 6.16
0.5 20 10 1.56 3.45 71.9 81.7 4.61 1 5 5 0.90 1.75 73.8 81.8 8.29
0.5 10 5 1.07 2.10 67.4 73.6 6.78 1 20 20 2.93 7.87 87.3 94.4 3.825 2 10 20 2.40 6.29 91.4 96.3 4.08
Summarising, it can be stated that all trends in the experimental results are predicted correctly by the single equilibrium stage model for butanol/leucine. The accuracy (quantitative description) is not in all cases very good. At pH 5-7, the predictions are the most accurate, although the predicted selectivity tends to be too high, whereas at lower pH the predicted distribution ratios are too low. The pH effect should be studied further, as well as the lower pH region. The use of an equilibrium stage model based on the chemical equilibria in the system is very helpful in gaining insight in the extraction system: most of the effects caused by process parameter changes can be explained physically or chemically, and effects of other parameters changes may be predicted in the same way.
2.5 Consequences for design It has become clear that the choice of process parameters such as concentration level, temperature, solvent and pH have a large effect on the capacity and selectivity obtained in a single reactive extraction stage. The effect of process parameter changes on the dimensions (stages, S/F) of process equipment will now be estimated. The distribution ratios and operational selectivities that were obtained experimentally are introduced in the Kremser-based fractional extractor model. The calculations could also have been done with a multistage equilibrium model based on the single stage description, but this approach is numerically complex: if the amount of stages exceeds 6, the number of algebraic equations that have to be solved simultaneously becomes too large for the numerical solvers that were attempted (Mathcad, gPROMS). Furthermore, detailed modelling of the separation of amino acids with Cu(II)-C12Hyp is not the ultimate goal of this study. From the Kremser model or the Fenske equation, the influence of the separation factor on the
number of stages was estimated. A minimum αop of 1.5 was stated; furthermore, for αop > 2

Chapter 2
37
small changes in αop have a much smaller effect on the number of stages than if αop < 2. So, it
is unwise to spend much effort on raising αop slightly if αop is already larger than 2. For the
separation of leucine at 25 °C, it can be concluded from figure 8 and 9 that using an excess extractant (eq. 16) larger than 3 is not justified. Accordingly, the process should not be carried out at 5 °C but at 25° C or higher temperatures because the larger distribution ratios and the faster extraction kinetics at 25 °C more than compensate for the slightly higher separation factor at 5 °C. However, a too large temperature may cause other problems, such as extractant losses. The process capacity increases proportionally with the enantiomer concentration and the absolute value of the distribution ratio. Therefore, the process should be carried out at the highest concentrations possible. For the model system, the leucine solubility is limiting (<10 mM at 0.1 M Cu(Ac)2). The solubility of the extractant is in the range of 0.1-0.5 M, which is much higher than applied in lab-scale experiments so far, and non-limiting given the low solubility of leucine. In most of the chiral fractional extraction studies, large wash–to-feed and solvent-to-feed ratios have been applied. This practice has several drawbacks: dilution of the feed stream results in lower distribution ratios (table 1) and a large solvent flow causes much coextraction of the undesired enantiomer, thus requiring also a large wash stream. For two representative literature cases, the effects of parameter changes on the number of theoretical stages (N), the volumetric flow rate of feed (F), solvent (S) and wash fluid (W) and on the extractant inventory (C) have been estimated for a given capacity (kg/hr DL-leucine, product purity 99%) with the Kremser model, using the experimental results from this study (table 6). It can be seen that both the total liquid volume (thus the extractor volume) and the extractant requirements can be decreased considerably at the expense of a small increase in N. Table 6: Effect of process condition changes for two literature cases Case Proposed changes N/N0 F/F0 S/S0 W/W0 C/C0 VR1
[valine]0 2.4 � 24 mM [C12Hyp] 10 � 100 mM
1
0.1
0.07
0.1
0.7
4* smaller S (adjust W) 1.15 1 0.25 0.2 0.25
Takeuchi6:
butanol, pH 6 F0 = 1, S0 = 10, W0 = 10 Overall effect 1.15 F=0.1 S=0.18 W=0.2 0.18 38
[leucine]0 4.9 � 9.8 mM [C12Hyp ] 20 � 40 mM
1
0.5
0.5
0.5
1
pH �6, switch to butanol 1.05 1 0.09 1 0.09
3* smaller S (adjust W) 1.15 1 0.333 0.25 0.33
Ding9:
octanol, pH 4 F0 = 1 S0 = 40 W0 = 10 Overall effect 1.2 F=0.5 S=0.61 W=1.25 0.03 18 1)VR= total extractor Volume Reduction = [m3
liquid hr-1]0·N0 / [m3
liquid hr-1]new·N
Concluding, fractional extraction of chiral components with copper-based extractants can be made much more efficient by working with high concentrations of enantiomers, using a stoichiometric amount of copper, working with a slight excess of extractant in a polar solvent,

DL-leucine separation
38
at a sufficiently high temperature and pH. Compared with literature results reported so far, an extractor volume reduction of 10-50 times maintaining the same productivity can be obtained without changing existing chemistry.
2.6 Conclusion Process parameters such as concentrations, temperature, solvent and pH have a large influence on the capacity and operational selectivity in reactive extraction, by influencing both the chemistry and the physical properties in the system. It has been demonstrated that for the reactive extraction system based on Cu(II)-C12Hyp the projected productivity can be increased by a factor 10-50 by optimising the process parameters. Study of the influence of process parameters on extraction performance by a combination of experimental work and equilibrium modelling is a good tool to identify the appropriate changes. With this demonstration, the large potential of the FREX concept for chiral separation has been indicated. In further development of the technique for other classes of enantiomers than amino acids, the identification of suitable enantioselective extractants has the highest priority.
References 1 Webb TH, Wilcox CS. Enantioselective and diastereoselective molecular recognition of neutral molecules. Chem Soc Rev 1993:383-395 2 Kano K. Mechanisms for chiral recognition by cyclodextrins (review commentary). J Phys Org Chem 1997;10:286-291 3 Sheldon RA. Chirotechnology, Industrial synthesis of optically active compounds. Marcel Dekker Inc.; 1993. 4 Perry RH, Green DW, Maloney JO, editors. Perry’s Chemical Engineers’ Handbook, 7th edition. New York:McGraw-Hill chemical engineering series;1997 5 Bohara A. Unpublished results. 6 Takeuchi T, Horikawa R, Tanimura T, Kabasawa Y. Resolution of DL-valine by countercurrent solvent extraction with continuous sample feeding. Sep Sci Tech 1990;25(7&8): 941-951 7 Nishizawa H, Tahara K, Hayashida A, Abe Y. Continuous separation method with liquid particle extractor: enantioseparation of (±)-mandelic acid. Anal Sci 1993; 9:611-615 8 Yokouchi Y, Ohno Y, Nakagomi K, Tanimura T, Kabasawa Y. A device for countercurrent fractional extraction and its application to continuous resolution of D,L-isoleucine. Chromatography 1998;19(4):374-375, in japanese 9 Ding HB, Carr PW, Cussler EW. Racemic leucine separation by hollow-fiber extraction. AIChE J 1992;38(10):1493-1498 10 Davankov A, Bochkov AS, Kurganov AA. Separation of unmodified α-amino acid enantiomers by reverse phase HPLC. Chromatographia 1980;13(11):677-685 11 Takeuchi T, Horikawa R, Tanimura T. Enantioselective solvent extraction of neutral DL-amino acids in two-phase systems containing N-n-alkyl-L-proline derivatives and copper(II) ion. Anal Chem 1984;56:1152-1155

Chapter 2
39
12 Yamazaki S, Takeuchi T, Tanimura T. Direct enantiomeric separation of norephedrine and its analogues by high-performance liquid chromatography. J Liq Chromat 1989;12(12):2239-2248 13 Gil-Av E, Tishbee A, Hare PE. Resolution of underivatized amino acids by reversed-phase chromatography. J Am Chem Soc 1980;102:5115-5117 14 Koska J, Haynes CA. Modelling multiple chemical equilibria in chiral partition systems. Chem Eng Sci 2001;56:5853-5864 15 Pickering PJ, Chaudhuri JB. Equilibrium and kinetic studies of the enantioselective complexation of (D/L)-phenylalanine with copper(II) N-decyl (L) hydroxyproline. Chem Eng Sci 1997;52(3):377-386 16 Duchateau ALL, Hillemans MG, Hindrikx I. Enantiomeric separation of primary alkylamines; a comparison of direct and indirect HPLC methods. Enantiomer 1997;2:61-67 17 Gmelin L. Handbook of inorganic chemistry, 8th edition, vol 60 (Cu), Berlin:Springer-Verlag;1975 18 Abe Y, Shoji T, Fukui S, Sasamoto M, Nishizawa H. Enantioseparation by dual-flow countercurrent extraction: its application to the enantioseparation of (±)propanolol. Chem Pharm Bull 1996;44(8):1521-1524 19 Prelog V, Stojanac Z, Kovacevic K. Über die Enantiomerentrennung durch Verteilung zwischen flüssigen Phasen. Helv Chim Acta 1982;65(1):377-384

DL-leucine separation
40

Chapter 3
41
3 Identification of enantioselective extractants for chiral separation of amines and amino-alcohols
3.1 Introduction Amines and amino-alcohols are important chiral intermediates. The main goal of this chapter is the identification of versatile enantioselective extractants that can be used for chiral separation of a number of chemically related amino-alcohols and amines by reactive extraction. In addition, the influence of the amino-alcohol structure on the extraction behaviour will be studied. To identify enantioselective extractants, a rational approach will be proposed and tested. The component phenylglycinol has been chosen as archetype model enantiomer for this study. To study the influence of molecular structure, six other model enantiomers were included (figure 1). All studied amino-alcohols have the hydroxyl group and amino group on neighbouring carbon atoms, and all components are primary amines except for ephedrine.
OH
NH2
*
NH2
OH
*
OH
NH2
*
NH2
CH3
OH
* *
(a) phenylglycinol (b) 2a1pe = 2-amino-
1-phenylethanol (c) 2-aminobutanol (d) norephedrine
NH
CH3
CH3
OH
* *
NH2
*
NH2
*
(e) ephedrine (f) phenylethylamine (g) 2-aminopentane Figure 1: Structure of amino-alcohols and amines studied. * indicates a chiral centre
In the literature, quite some work has been reported on the chiral separation of amino acids by reactive extraction and closely related techniques1,2,3,4,5,6,7. Much less attention has been paid to the separation of amino-alcohols and amines by reactive extraction, in particular not to substances with the chiral center next to the amine moiety. Didodecyl-L-tartate with boric acid acted as extractant for four different beta-blockers in a chloroform-water system8,9. The selectivity was between 1.5 and 2.9. Beta-blockers belong to a class of amino-alcohols containing a secondary amine group and several other functionalities, with the chiral centre next to the alcohol moiety. A versatile extraction system for chiral separation of amino-alcohols and amines was presented by Prelog10,11,12. Various dialkyltartrates and tartrates of bulky alcohols such as menthol were used as extractant at a high concentration in chloroform, typically 1 M. This separation system gave in general somewhat better results for the amino-alcohols with the chiral centre next to the alcohol moiety, but it can also be used for amino-

Extractant identification
42
alcohols with the chiral center next to the amine moiety. Although the versatility of this system is good, the selectivities for most of the tested enantiomers seem too low (1.2-1.6) for commercial application. A second drawback is the need to co-extract a lipophilic counter-ion such as PF6
-. There are several strategies to identify potential enantioselective extractants, such as: 1. Design and synthesis of ‘new’ selectors, usually based on former experience or as a
variation on an existing selector. Molecular imprinting13 or combinatorial chemistry14 may be used.
2. Molecular modelling can be used as a tool to identify new selectors, or to optimise existing selectors15.
3. Transferring promising selectors from other separation techniques or ligands from enantioselective catalysis16 to extraction.
The third method has been selected for this study, because in the chemical and analytical literature a large amount of information on chiral recognition of amino-alcohols and amines is available, and most of this knowledge has not been exploited to develop enantioselective extractants. Examples are analytical techniques for determination of optical purity such as chromatography and electrophoresis, membrane separations and separation by diastereomeric crystallisation. Chiral recognition in liquid systems has also been described. We have restricted ourselves to chiral selectors used in analytical techniques and separation techniques, excluding the ligands used in asymmetric catalysis. This was done for various reasons: the analytical and separation literature already provides a very large number of potential extractants; secondly, the activity as extractant seems more difficult to predict for ligands from enantioselective catalysts than for selectors from analytical or separation techniques; the catalyst ligands are in general difficult to synthesise, and many enantioselective catalyst ligands are proprietary. However, the literature on enantioselective catalysis ligands may become an additional valuable source for enantioselective extractants besides the analytical chiral separation literature. To gain more insight in how enantioselective extractants can be selected or adapted from chiral selectors available in other separation techniques, we start with a discussion of the separation mechanism of reactive extraction. Subsequently, the separation mechanisms in the other chiral separation techniques are evaluated to obtain knowledge on the possible transfer of chiral selectors by comparing the similarities and differences with reactive extraction. A literature study will be presented listing many selector systems and results for various analytical separation techniques, featuring mainly selectors for amino-alcohols and amines that can be envisaged as extractants. From this list, a number of the potential extractant systems are selected for experimental evaluation, to test if: (1) the selector can be kept in one phase (no partitioning/leaching)

Chapter 3
43
(2) the selector is enantioselective for one of the enantiomers (selectivity of extraction) (3) the enantiomers can be extracted to a sufficient extent (capacity of extraction). When appropriate, the effect of extraction conditions such as pH, temperature and solvent is determined. The experimental results will be discussed in view of whether chiral selectors show sufficient selectivity and capacity in extraction. Finally, conclusions will be drawn about the suitability of the literature sources to identify enantioselective extractants.
3.2 Theory
3.2.1 Chiral recognition In molecular recognition, selectors preferentially complex with certain guest molecules. A variety of intermolecular forces can play a role in this process of recognition. The main interactions are dipole-dipole interactions, dipole-induced-dipole interactions, hydrogen
bonding, London dispersion forces, π stacking interactions, charge transfer interactions,
hydrophobic or solvophobic effects and ionic interactions17. In chiral recognition, one of the enantiomers in a racemic mixture is preferred over the other by a selector which has to be chiral itself. For chiral discrimination, in general three bonding sites are required; one of the two enantiomers can coordinate with all three sites, the other enantiomer with only two sites18. Alternatively, a combination of two bonding sites and bulky side groups is encountered; one of the two enantiomers cannot coordinate with both bonding sites due to steric hindrance19. In principle, all intermolecular forces given above may play a role in chiral recognition17.
In this chapter, the intrinsic selectivity αint is defined as the ratio of complexation constants:
KR/KS. The operational selectivity αop is defined in a different way for each technique and can
therefore not be compared directly with the operational selectivity in extraction.
3.2.2 Separation mechanism in reactive extraction A schematic picture of the equilibria important in reactive extraction is given in figure 7a in chapter 1. The most important effects are the complexation reactions between the enantiomers R and S and the extractant C, characterised by equilibrium constants KR and KS, and the physical partitioning ratio (P) of the enantiomers and extractant. If extractant C favours complexation with R over S (KR > KS), more RC than SC is formed, the overall distribution ratio of enantiomer R is larger and a partial separation in one stage is reached. Thus, the complexation reaction in the liquid has to be enantioselective to obtain operational selectivity. Physical partitioning of C will spoil the operational selectivity of the separation4, because it results in a lower effective concentration of C in the reaction phase and probably also in counter-productive enantioselective complexation in the other phase. Furthermore, physical

Extractant identification
44
partitioning of R and S and the occurence of other complexation reactions such as acid-base disscociation may influence the selectivity and capacity as well. The operational selectivity, which equals the ratio of distribution ratios D for the two enantiomers, is therefore a function of the liquid-phase complexation constants KR and KS and the physical partitioning ratio P of enantiomers and selector. For an extraction system in R and S are bases, it can be deduced that:
aqaq
orgorg
allformsaq
allformsorgR HRR
RCR
R
RD
][][
][][
][
][
,
,
+++
== (1)
aqaq
orgorg
allformsaq
allformsorgS HSS
SCS
S
SD
][][
][][
][
][
,
,
+++
== (2)
][1
][1
CK
CK
D
D
S
R
S
Rop ⋅+
⋅+==α (3)
All concentrations are equilibrium concentrations, which need to be solved from the mass balance. The above also shows that the maximum operational selectivity that can be achieved equals the intrinsic selectivity KR/KS, which should exceed 1.5.
3.2.3 Separation mechanisms in other chiral separations From the above, it seems likely to expect that when the operational selectivity in other chiral separation techniques is also determined by the ratio of the complexation constants in solution (KR/KS), that this enantioselectivity can be transferred to extraction. Therefore, we will now discuss how the operational selectivity in other chiral (analytical) separation techniques is obtained. Analytical chiral separations: chromatography and electrophoresis Direct chiral separation by HPLC can be carried out in two ways: with the chiral selector bound to the column material (chiral stationary phase, CSP) or by adding a chiral selector to the mobile phase (chiral mobile phase, CMP). When a CSP is used, the enantiomers interact with the selector on the solid support and two different diastereomeric complexes are formed. The operational selectivity in the column is given by20:
][1
][1s
SS
sR
S
op CK
CK
++=α (4)
The concentration [CS] is the ‘free selector concentration’ at the surface. The selectivity originates from the difference in complexation constants for the reaction on the solid support (superscript S) and has a maximum value KS
R/KSS. The solid support often has a large
influence on the extent of complexation and also on the selectivity (by supplying the ‘third

Chapter 3
45
interaction’ as steric hindrance, or by blocking access to binding sites). As a result, the ratio KS
R/KSS is often very different from the ratio KR/KS for the same selector in solution.
Therefore, selectivity obtained with a CSP does not necessarily result in the same selectivity in extraction with the same selector molecule. In CMP mode, complexation between the chiral selector and enantiomers takes place in the mobile phase. In the ideal case, only the enantiomers partition between mobile phase and stationary (solid) phase, so the chiral selector and the complexes remain in the mobile phase. Then, the selectivity is determined by the complexation in the liquid:
][1
][1
CK
CK
S
Rop +
+=α (5)
C is the selector concentration in solution; the complexation constants refer to complexation in solution. In this case, the operational selectivity obtained in the HPLC/CMP separation is a direct predictor of selectivity in extraction. However, this case is very rare. It is much more common that the selector and complexes also partition between mobile and solid (stationary) phase, making the formula for the operational selectivity much more complicated20. Moreover, the reactions at the surface and in the eluent may be counterproductive. Therefore, enantioselectivity obtained in a CMP separation may not be a very reliable indicator for selectivity in reactive extraction, although it still seems a better indicator than a CSP separation. For several other chromatographic techniques (GC, SMB, TLC), the same rationale can be applied, since they can be applied in CMP and/or CSP mode. Capillary electrophoresis is related to chromatography. It is based on differences in solute
mobilities µ when a strong electric field E is applied across a separation buffer21:
EEf
qv RR ⋅=⋅= µ (6)
Gübitz and Schmid22 reviewed many electrophoretic chiral separations. A chiral separation is usually achieved by adding a chiral selector to the electrolyte solution. The resulting diastereomeric complexes have different mobilities in the buffer phase than the original enantiomers due to mass, shape and/or charge differences23:
][1
][
][1
][
CK
CK
CK
CK
S
SSCf
R
RRCfSR +
+−
++
=−=∆µµµµ
µµµ (7)
In this formula, [C] is the selector concentration in solution, µR and µS are the ‘overall’
resulting mobilities for enantiomers R and S; µf is the mobility of the free enantiomer (equal
for R and S), and µRC (µSC) refers to the mobility of the RC (SC) complex. The difference in
complexation constants KR/KS in solution is the main origin of enantioselectivity24. However, the operational selectivity is also influenced by the mobilities of all components, the electric

Extractant identification
46
field, possible partitioning of the complexes to the capillary surface, and so on. The mobilities
of the two diastereomeric complexes may also differ from each other (then µRC ≠ µSC). In
contrast with chromatography and extraction, the operational selectivity can become even larger than the intrinsic selectivity23. As the ratio KR/KS is the main origin of enantioselectivity in solution, enantioselectivity obtained in CE is a promising indicator for enantioselectivity in extraction. However, because of the kinetic influences on the operational selectivity, a CE chiral separation is not a direct predictor of success in extraction. Spectroscopic techniques Spectroscopic techniques can be used for different purposes. Determination of complexation constants between enantiomers and a chiral complexing agent in solution can be carried out by a titration, using UV-vis spectroscopy, fluorescence or NMR25,26. The obtained information on complexation constants between enantiomers and a chiral selector in a certain solvent is of high value, because it means that the intrinsic selectivity of this selector as enantioselective extractant is known. If the partitioning of the substance to the aqueous phase is negligible, the selector can be transferred directly to extraction. NMR, CD or polarimetry18 can also be applied for determination of the optical purity (e.e.) of a sample in a single measurement. This type of measurement usually does not provide suitable information on potential selectors, even if a chiral additive is used. For instance, chiral lanthanide shift reagents (LSR) can be applied in NMR to form two diastereomeric complexes that display different chemical shifts. A difference in complexation constants KR/KS is not required for the NMR analysis, and therefore NMR shift reagents are not necessarily successful as enantioselective extractants. Nevertheless, the selective extraction system for amino acids reported by Tsukube5 employs as extractant lanthanide selectors that are similar to the NMR shift reagents. Laboratory preparative separation techniques Bulk liquid membranes or U-tubes are sometimes used to evaluate complexing agents for reactive extraction. The complexing agent /chiral selector is usually added as carrier to the liquid membrane phase. The operational enantioselectivity is defined as the relative transport rates of the two enantiomers. The transport rate is influenced by the solubility of the enantiomer in the carrier phase (determined by the interaction with the selector, thus eventually by the ratio KR/KS in solution), but also by the transport rate through the liquid membrane27, the decomplexation rate, etc. The selectivity therefore originates from the ratio KR/KS, but there may be a kinetic contribution. If the enantioselectivity is mainly caused by the KR/KS ratio, the chiral selector can probably be successfully transferred to reactive extraction. Crystallisation is a widely used chiral separation technique, both in the laboratory and at industrial scale. Therefore is it important to study if it can be exploited as a source for

Chapter 3
47
enantioselective extractants. Because 90 % of all chiral substances cannot be separated in their enantiomers by direct crystallisation, diastereomeric crystallisation is a commonly used option. In this case enantioselectivity is obtained by a solubility/melting point difference and/or crystallisation rate difference between the formed diastereomers18. Although there may be a difference in formation constants of the diastereomers, this does not need to be a large difference. Secondly, enantioselectivity does not originate from a difference in formation constants, but from the difference in physical properties of the resulting diastereomers. Therefore, chiral selectors used in crystallisation are not expected to be successfully transferable to reactive extraction.
3.2.4 Summary Based on the analysis of separation mechanisms, we expect that selectors used in HPLC/CMP, liquid membranes, electrophoresis, extraction, or selectors from which the complexation constants in solution have been published are the most likely to be selective in extraction as well. In some of these separations, a kinetic effect may be present, and if this effect is dominant, the selectivity may be reduced in extraction. It is expected that selectors from a CSP are more difficult to transfer: because the selector is immobilised onto a solid phase, the enantioselectivity may be decreased or enhanced compared to free solution. Finally, diastereomeric crystallisation and other diastereomeric separations are not expected to have much predictive value, because the origin of enantioselectivity in these separations is not a stability difference in complexation constants.
3.3 Selection of candidate enantioselective extractants for amines and amino-alcohols
In tables 1a-d, the encountered chiral selectors for amino acids, amines and amino-alcohols have been compiled, as applied in various separations and analytical techniques. In table 1a, selectors used in extraction and closely related techniques are included. Table 1b lists selectors applied in chromatography and electrophoresis; table 1c lists selectors for which the complexation constants are reported, and in table 1d selectors are given that have been applied in preparative techniques other than extraction. Various selectors for amino acids are included in the tables to test if they are applicable for separation of amino-alcohols and amines as well.

Extractant identification
48
Table 1a: chiral selectors for amines, amino-alcohols and amino acids used in extraction Selector
analyte technique operational selectivity
ref cr1 cr2 cr3 cr4
Carbamoylated quinine derivative
DNB-leucine, DNB-amino acids
extraction very high, est. 50
28 2 1 2 0
Cichona alkaloid derivative DNB-leucine, protected amino acids
extraction, CPC
2-7 29 2 1 2 0
Crown ether, methyl-D-mannopyranoside, naphtyl unit
amino acids and -salts
extraction 2-7 (very low D's)
6 2 2 2 0
Crown ether, methyl-D-mannopyranoside, naphtyl unit
amino acids, aromatic
extraction 1.2-2 30
2 2 2 0
Dialkyltartrate with PF6- amino-alcohols (as salts)
extraction 1.2-1.6 up to 2.2
10,11,
12 2 2 2 1
Didodecyltartrate with boric acid β-blockers extraction 1.5-2.9 8,9 2 2 2 1
Lanthanide tris(β-diketonate)
complexes
amino acids extraction 2-3 5,31 2 2 2 0
N-(1-naphtyl)leucine, octadecyl ester
DNB-leucine extraction, HF membrane
> 10 32 2 0 2 0
N-dodecyl-L-hydroxyproline Cu(II)
amino acids extraction 1.5-3 1,4 2 2 2 1
N-dodecyl-L-hydroxyproline Cu(II)
leucine extraction, HF membrane
~ 2 2 2 0 2 1
N-dodecyl-L-proline Cu(II) mandelic acid extraction ~1.6 33 1 0 2 1
N-naphtyl-methyl-α-
methylbenzylamine and
N=octadecyl-α-
methylbenzylamine
sodium mandelate and sodium-N-acetyl-alanate
extraction: liquid ion exchanger
1.2-1.4 34 0 1 2 0
R-2-aminobutanol bicyclo[2.2.1]hept-5-ene-2-carboxylic acids
CCC est. 1.3 35 1 1 2 2
abbreviations: DNB dinitrobenzoyl, CCC counter-current chromatography36, CPC centrifugal partition chromatography37, HF hollow fiber, est. estimated cr1, cr2, cr3, cr4 are the scores on criteria for choice of selectors for experimental screening, as explained in the next paragraph and in table 2: cr1 good operational selectivity cr2 high versatility cr3 selector originates from favourable technique cr4 good availability of selector

Chapter 3
49
Table 1b: chiral selectors used in chromatography and electrophoresis Selector analyte technique operational
selectivity ref cr1 cr2 cr3 cr4
Amino acid amides Cu(II) (valine, phenylalanine)
amino acids HPLC/CMP most < 1.8, proline up to 5
38 1 2 1 1
Amino alcohol Schiff base Cu(II)
amino-alcohols, amino acids
HPLC/CSP most > 2, some higher
39 2 2 0 1
Amylose esters and phenylcarbamates
various HPLC/CSP various 40 2 2 0 0
Aspartame Cu(II) α-hydroxy acids,
amino acids
CE 1.3 est (R up to 5)
41 1 2 1 2
Aspartame Cu(II) amino acids (DNS)
CE 1.02-1.1 42 0 1 1 2
Aspartame Cu(II) valine HPLC/CMP up to 1.4 43 1 0 1 2 C12CSP based on phenylethylamine with 2-aminopropanol, Cu(II)
amino acids HPLC/CSP up to 5.5, many > 2
44 2 2 0 0
Calix[4]arene, S-di-naphtylprolinol-
phenylglycinol, phenylethylamine, norephedrine
CE 'CSP', fluorescence
1.8-2.5 'Stern-Volmer constants'
45 2 2 0 1
Camphorsulfonate β-blockers HPLC/CMP ~ 1.1 46 0 2 1 2
Camphorsulfonate β-blockers TLC/CMP 1.3-2.0 47 2 2 1 2
Camphorsulfonate Cisapride, β-
amino-alcohols
CE, non-aqueous
1.1 est. 48 0 1 1 2
Cellulose esters and phenylcarbamates
various HPLC/CSP various. 40 2 2 0 1
Cinchona carbamate calix(4)arene (based on quinine and epiquinine)
N-acetylated amino acids
HPLC/CSP 1.5-2.6 49 2 1 0 0
Crown ether 1,1-binapthyl amino alcohols, amines
HPLC/CSP 1.1-2, some up to 3
50 2 2 0 0
Crown ether Daicel (proprietary, in CROWNPAK CR)
amines, amino-alcohols, amino acids
HPLC/CSP 1.1-1.8 51 2 2 0 0
Crown ether, pseudo-18C6 phenylglycinol, phenylethylamine, naphtylethylamine
HPLC/CSP 2-5 52 2 2 0 0
Crown ether tetracarboxylic acid 18C6
amino alcohols, amines
HPLC/CSP 1.2-1.8 up to 3.5
53 2 2 0 0
Crown ether tetracarboxylic acid 18C6
amino-alcohols CE < 1.2 54 0 2 1 0
Cyclodextrin, α, β various GC usually < 1.1 55 0 2 0 2

Extractant identification
50
Table 1b, continued
Cyclodextrin, α, β-, various
derivatives
amines, amino-alcohols, amino acids, etc, free or as -COCF3 derivatives
GC 1.02-1.08 up to 1.15
56 0 2 0 2
Cyclodextrin, α-, 2,3,6-O-methyl β-blockers,
pharmaceuticals
CE ~ 1.05 57 0 2 1 1
Cyclodextrin, β- β-blockers,
pharmaceuticals
HPLC/CSP 1.05-1.4, up to 1.7
58 1 2 0 2
Cyclodextrin, β- with 18C6
crown ether (non chiral)
primary amino compounds
CE 1.02-1.1 59 0 2 1 0
Cyclodextrin, β-, (1-naphtyl)-
ethylcarbamate derivative
amines, amino acids, alcohols, carboxylic acids, as 3,5-DNB derivatives
HPLC/CSP 1.1-2, up to 4.3
60 2 2 0 0
Cyclodextrin, β-, 2-O-methyl-
3,6-di-O-sulfo
2-amino-1-phenylethanol
CE 1.6 61 1 0 1 1
Cyclodextrin, β-, carboxymethyl ephedrine, phenylalanine, propranolol
CE < 1.1 est. 62 0 1 1 2
Cyclodextrin, β-, carboxymethyl ephedrines HPLC/CMP 1.07-1.35 63 0 1 1 2
Cyclodextrin, β-, carboxymethyl pharmaceuticals (prim./tert. amine)
CE ~ 1.1 up to 1.3
64 0 2 1 2
Dextran pharmaceuticals CE up to 1.1 65 0 2 1 2 Dextrin pharmaceuticals CE 1.2-1.6 65 1 2 1 2 Dibutyltartrate with PF6- (nor)ephedrine, β-
blockers, as salts
HPLC/CMP and CSP
1.05-1.25 66 0 2 1 2
Dodecoxycarbonyl-L-leucine and other amino acid carbamates
β-blockers and
pharmaceuticals
CE < 1.06 67 0 2 1 1
Hydroxyproline Cu(II) α-hydroxy acids CE 1.3 est 41 0 2 1 2
Hydroxyproline/ Cu(II) amino acids CE < 1.05 68 0 2 1 2 maltodextrin pharmaceuticals
(acids and bases) CE 1.1 est 69 0 2 1 2
Mandelic acid with Cu(II) amino acids, tertiary amine der.
HPLC/CMP 1.2-2.1 70 2 2 1 2
Mandelic acid with Cu(II) amino-alcohols HPLC/CMP 1.1-1.2 70 0 2 1 2 N,N-dibenzyl-1,2-propanediamine Cu(II)
amino acids (19) HPLC/CSP up to 3.2, many > 2
71 2 2 0 2
N,S-dioctylpenicillamine, (R,R)-tartaric acid mono-(R)-1-(?-naphtylethyl)-ethyl amide
acids, amines HPLC/CSP up to 1.2-1.3 72 0 2 0 0

Chapter 3
51
Table 1b, continued
N-(2-hydroxy)-dodecyl-L-4-hydroxyproline Cu(II)
amino-alcohols: norephedrine,
HPLC/CSP 1.5-2.1 73 2 2 0 1
N-(2-hydroxy)-octyl-L-4-hydroxyproline Cu(II)
amino acids, DOPA
CE 1.3-2.8 74 2 2 1 1
N-(2-hydroxy)-octyl-L-4-hydroxyproline Cu(II)
β-blockers, α-
hydroxy acids
CE most < 1.2, up to 3.1
75 1 2 1 1
N-(2-hydroxy)-octyl-L-4-hydroxyproline Cu(II)
norephedrine, sym pathomimetics
CE 1.05/1.8 76 2 2 1 1
N-dodecyl-L-hydroxyproline Cu(II)
amino acids (various)
HPLC/CSP 1.2-6 many > 2
77 2 2 0 1
N-dodecyl-L-hydroxyproline Cu(II)
norephedrine, 2a1pe, analogues
HPLC/CSP 1.1-1.9; nor=1.77, 2a1pe=1.64
78 2 1 0 1
N-dodecyl-L-hydroxyproline Cu(II)
phenylglycinol, 2a1pe
HPLC/CSP phgly 1.13, 2a1pe 1.98
79 1 1 0 1
N-dodecyl-L-hydroxyproline Cu(II) with barbital
amino-alcohols type 1-amino-2-ol, aliphatic
HPLC/CSP 1.2-1.4 80 0 2 0 1
N-dodecyl-L-phenylglycinol Cu(II)
amino acids HPLC/CSP 1.2 est 81 1 2 0 1
N-undecyl-L-proline with Cu(II) (Schiff base of) amino-alcohols
HPLC/CSP 1.2-1.4, highest 2.0
82,83 1 2 0 1
Ni(II) complex 'Chirasil-Ni(II)' free alcohols GC 1.1 est 55 0 2 0 0 Ni(II) tetradentate Schiff base amines, aliphatic HPLC/CMP 1.6-2.3 for
best ligand
84 2 2 1 1
Ni(II) tetradentate Schiff base amino-alcohols (aromatic)
HPLC/CMP 1.3-1.5 73 1 2 1 1
‘Pirkle’ selectors, various beta-blockers, underivatised
HPLC/CSP 1.5-4 many > 2
85,86 2 2 0 0
Proline with Cu(II) (aromatic) β-
amino-alcohols
HPLC/CMP na 87 2 1 2
Proline, Cu(II) amino acids HPLC/CMP 1.3-4.8, many > 2
88 2 2 1 2
Proline, with barbital and Cu(II) amino-alcohols, primary and tertiary amine
HPLC/CMP primary amine < 1.2, tert. am ~ 4.1
89 0 2 1 2
R,R-tartaric acid, mono-amide derivatives of (with Cu(II) ion)
Der. of amino acids, amines, carboxylic acids and alcohols
HPLC/CSP many between 1.5 and 2.5, up to 3.9
90 2 2 0 1
Tartaric acid β-blockers and
related tertiary amines
SFC/CMP 1.1-1.2 91 0 2 1 2

Extractant identification
52
Table 1b, continued
Tartaric acid Cu(II) bonded to Kiesel gel
catecholamines, amino acids
HPLC/CSP 1.1-1.2 up to 2
92 0 2 0 1
ZGP (=N-benzoxycarbonylglycyl-L-proline)
β-blockers HPLC/CMP 1.2-1.4 93 1 2 1 2
ZGP (=N-benzoxycarbonylglycyl-L-proline)
pharmaceuticals, amine-containing
CE, non-aqueous
1.1 94 0 2 1 2
additional abbreviations: DNS dansyl, SFC supercritical fluid chromatography, 2a1pe 2-amino-1-phenylethanol, na not available. Criteria for choice of selectors for experimental screening as in table 1a.
Table 1c: chiral selectors of which complexation constants (K) have been determined by
spectroscopic or other methods Selector analyte technique to
determine K operational selectivity
ref cr1 cr2 cr3 cr4
Calix[4]arene binaphtyl derivative
phenylglycinol, phenylethylamine, phenylalaninol
UV abs. shift nd; selective for amino-alcohol only
95 1 1 0 0
Crown ether, azophenolic amines, amino-alcohols
UV 2-5 up to 12 96 2 2 2 0
Cyclodextrin, α- phenylalanine UF 2.6 (pH 3) 1.2 (pH 11)
97 2 0 2 2
Cyclodextrin, α- threonine UF 2.1 (pH 3), 1.3 (pH 11)
97 2 0 2 2
Cyclodextrin, β- phenylalanine UF 1.1 98 0 0 2 2
Cyclodextrin, β- phenylalanine UF 1.2 (pH 3) 2 (pH 11)
97 1 0 2 2
Cyclodextrin, β- threonine UF 1.3 (all pH) 97 0 0 2 2
Cyclodextrin, β-, copper-6A-(3-
aminopropylamino)-6A-deoxy
phenylalanine, tryptophan
pH titration 1.7 (Trp), 2 (Phe)
99 2 1 2 0
Cyclodextrin, β-, monomaltosyl phenylalanine UF 3.5 98 2 0 2 2
Cyclodextrin, β-, nickel-6A-(3-
aminopropylamino)-6A-deoxy
phenylalanine, tryptophan
pH titration 10 (Trp) 6.3 (Phe)
99 2 1 2 0
Cyclodextrin, β-hydroxypropyl,
n=4.6
phenylalanine UF 2.4 98 2 0 2 2
Sapphyrin-based selectors CBZ-glutamic acid and -aspartic acid
NMR 1.2-2.1, up to 4.5
100 2 1 1 0
additional abbreviations: nd not determined; PEA phenylethylamine, UF ultrafiltration, CBZ carbobenzyloxy. Criteria for choice of selectors for experimental screening as in table 1a.

Chapter 3
53
Table 1d: chiral selectors applied in preparative chiral separation techniques Selector analyte technique operational
selectivity ref cr1 cr2 cr3 cr4
BSA tryptophan UF ~20 101 2 0 1 2 BSA tryptophan UF ~10 102 2 0 1 2 Camphorsulfonic acid phenylethylamine,
α-p-hydroxy-
phenylethylamine
Crystallisation usually good 103 2 1 0 2
Cholesteryl-L-glutamate phenylalanine MEUF 1.9 104 2 0 1 0 Crown ether derivative phenylalanine SLM up to 8 105 2 0 1 0 Crown ether, 1 chiral binaphtyl group, 18C6
amino acid salts, amino ester salts
BLM many > 3, up to 20
106 2 2 1 0
Crown ether, two 1,1’-binaphtyl groups, 18C6
amino ester salts BLM 1.5; 2.2; 12; 18
107 2 2 1 0
Cyclodextrin, α- tryptophan electrodialysis/UF
1.08 108 0 0 1 2
Cyclodextrin, β- pharmaceuticals BLM ~ 109 1 2
Dihexyltartrate (with PF6-) amino-alcohols, amino acids
SLM < 1.1; norephedrine 1.5 (4°C)
110 0 2 1 1
Glutamic acid 2-aminobutanol Crystallisation yield 75% 103 2 0 0 2 Mandelic acid amino-alcohols,
amines Crystallisation usually good 103 2 1 0 2
N-3,5-dinitrobenzoyl-L-alanine octylester
alanine, lactic acid SLM 1.75 alanine 2 lactic acid
111 2 1 1 1
N-decyl-L-hydroxyproline Cu(II)
phenylalanine ELM 1.6 7 1 0 1 1
N-hexadecyl-L-hydroxyproline Cu(II)
propranolol, bupranolol
SLM 1.23 (pro) 1.46 (bup)
112 1 1 1 1
(S)-N-(1-naphtyl)leucine octadecyl ester
DNB-amino acid derivatives
BLM 2-7 113 2 2 1 0
Nopol amino acids, as hydrochloride
SLM ca. 1.2; up to 1.5
114 1 2 1 1
Poly lactic acid (PLA) norephedrine SLM 1.1 110 0 0 1 1 Sapphyrin-based selectors CBZ-glutamic acid
and -aspartic acid K-values (NMR), BLM
1.2-2.1, up to 4.5
100 2 1 1 0
Taddols amines, amino-alcohols, amino acids
Crystallisation (inclusion)
between 0.1 and 1 (yield*ee)
115,116
117 2 1 0 1
Tartaric acid 2-butylamine, 2-aminobutanol, PEA, other amines
Crystallisation usually good 103 2 1 0 2
additional abbreviations: MEUF micellar-enhanced ultrafiltration, SLM supported liquid membrane, BLM bulk liquid membrane, ELM emulsion liquid membrane, ee enantiomeric excess. Criteria for choice of selectors for experimental screening as in table 1a.

Extractant identification
54
When the literature data compiled in these tables are compared, the following conclusions can be drawn:
• Many chiral selectors exist, but usually the operational enantioselectivity is lower than 1.2.
• A selector that works well for one pair of enantiomers does not necessarily work (well) for a related compound: it is not trivial to find a versatile and highly selective selector. For instance, the dihexyltartrate/PF6
- selector as applied by Keurentjes et al110 in a supported liquid membrane system displayed an enantioselectivity of 1.5 for norephedrine, and < 1.1 for the other compounds tested (table 1d).
• There are several selectors that are both versatile and sufficiently selective, at least in the technique in which they were applied. Examples are the N-dodecyl-L-hydroxyproline/ Cu(II) system for chiral separation of amino acids1 (table 1a) and the azophenolic crown ether for chiral recognition of several amines and amino-alcohols in solution96 (table 1c).
• The same selector applied in different techniques for the same analyte often gives completely different results. More precisely, the differences between chromatography on one hand and ‘liquid’ techniques on the other hand are sometimes large. For example, N-(2-hydroxy)-alkyl-L-4-hydroxyproline Cu(II) has been applied in HPLC/CSP separations73 and in CE separations76 of amino-alcohols (table 1b). Certain components that were well resolved in the HPLC could not be separated well by CE. Secondly, the separation factors that are reported for the azophenolic crown ether system are very high in CHCl3 solution96 (table 1c), but they drop considerably when the crown ether is immobilised onto a solid support52 (table 1b). Thus, the enantioselectivity can become larger or smaller in solution. This corresponds well with the expectations presented in the previous paragraph.
• The same selectors applied for the same analytes in the same technique under different circumstances (solvent, pH, T) can give completely different results. For instance, the enantioselectivity reached in HPLC separation with the Crownpak (+) HPLC column (proprietary crown ether CSP) increases very much with decreasing temperature. In the TLC/CMP measurements by Huang et al47, using camphorsulphonate as chiral selector for beta-blockers, the temperature and the solvent composition were crucial to obtain chiral separation.
A selection was made from the literature table for experimental screening. In line with our expectations in the previous paragraph, a selector in the literature table is considered to be a promising enantioselective extractant if it scores well on the following criteria: a high reported enantioselectivity (1), a high versatility (2) and chiral recognition displayed in a ‘promising’ technique, i.e. chiral recognition in the liquid (3). An important practical point is the availability of selectors (4). In the literature tables 1a-1d, it has been indicated if a certain selector system satisfies one or more of these criteria (table 2):
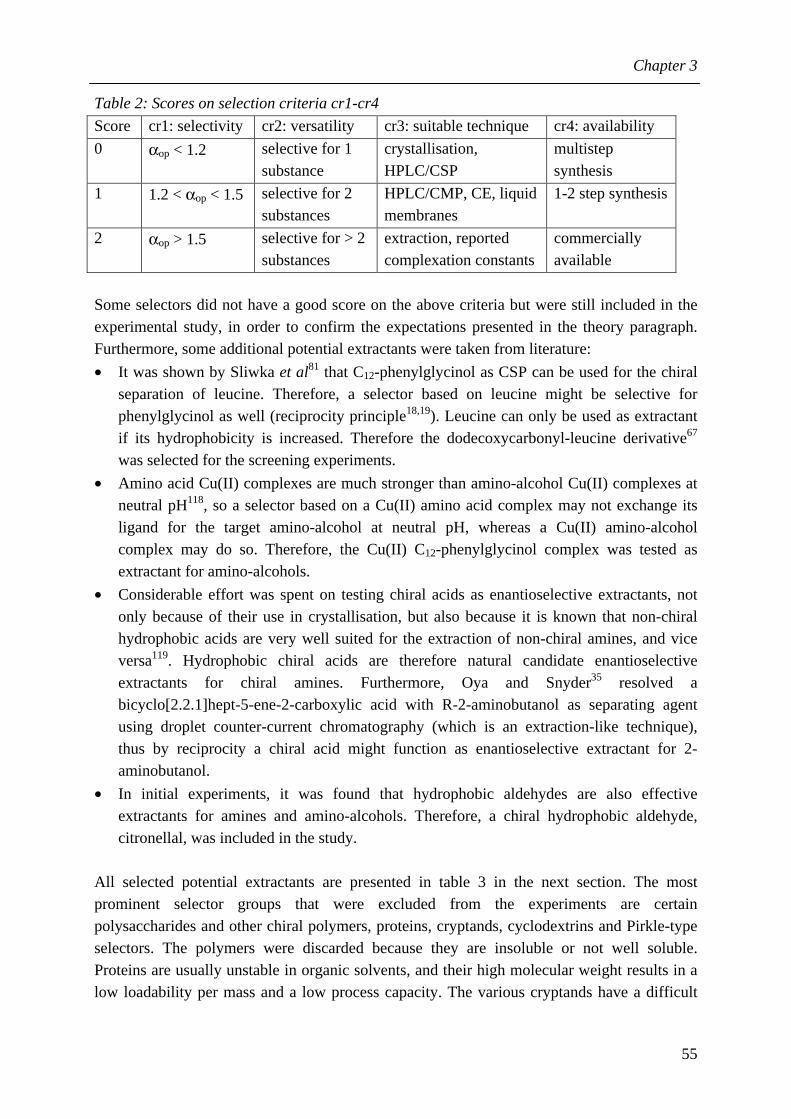
Chapter 3
55
Table 2: Scores on selection criteria cr1-cr4
Score cr1: selectivity cr2: versatility cr3: suitable technique cr4: availability
0 αop < 1.2 selective for 1 substance
crystallisation, HPLC/CSP
multistep synthesis
1 1.2 < αop < 1.5 selective for 2 substances
HPLC/CMP, CE, liquid membranes
1-2 step synthesis
2 αop > 1.5 selective for > 2 substances
extraction, reported complexation constants
commercially available
Some selectors did not have a good score on the above criteria but were still included in the experimental study, in order to confirm the expectations presented in the theory paragraph. Furthermore, some additional potential extractants were taken from literature:
• It was shown by Sliwka et al81 that C12-phenylglycinol as CSP can be used for the chiral separation of leucine. Therefore, a selector based on leucine might be selective for phenylglycinol as well (reciprocity principle18,19). Leucine can only be used as extractant if its hydrophobicity is increased. Therefore the dodecoxycarbonyl-leucine derivative67 was selected for the screening experiments.
• Amino acid Cu(II) complexes are much stronger than amino-alcohol Cu(II) complexes at neutral pH118, so a selector based on a Cu(II) amino acid complex may not exchange its ligand for the target amino-alcohol at neutral pH, whereas a Cu(II) amino-alcohol complex may do so. Therefore, the Cu(II) C12-phenylglycinol complex was tested as extractant for amino-alcohols.
• Considerable effort was spent on testing chiral acids as enantioselective extractants, not only because of their use in crystallisation, but also because it is known that non-chiral hydrophobic acids are very well suited for the extraction of non-chiral amines, and vice versa119. Hydrophobic chiral acids are therefore natural candidate enantioselective extractants for chiral amines. Furthermore, Oya and Snyder35 resolved a bicyclo[2.2.1]hept-5-ene-2-carboxylic acid with R-2-aminobutanol as separating agent using droplet counter-current chromatography (which is an extraction-like technique), thus by reciprocity a chiral acid might function as enantioselective extractant for 2-aminobutanol.
• In initial experiments, it was found that hydrophobic aldehydes are also effective extractants for amines and amino-alcohols. Therefore, a chiral hydrophobic aldehyde, citronellal, was included in the study.
All selected potential extractants are presented in table 3 in the next section. The most prominent selector groups that were excluded from the experiments are certain polysaccharides and other chiral polymers, proteins, cryptands, cyclodextrins and Pirkle-type selectors. The polymers were discarded because they are insoluble or not well soluble. Proteins are usually unstable in organic solvents, and their high molecular weight results in a low loadability per mass and a low process capacity. The various cryptands have a difficult

Extractant identification
56
synthesis in common, so they were excluded for practical reasons. Cyclodextrins are water-soluble selectors, in contrast with most other chiral selector systems in the list. In order to separate a hydrophilic substance by extraction, the cyclodextrin has to be combined with a hydrophobic non-chiral extractant. This more complicated operation will not be discussed further in this paper. Certain Pirkle-type selectors have already been applied as enantioselective extractant32 for separation of DNB-leucine, and other Pirkle-type selectors are probably applicable as enantioselective extractant as well, especially the selectors designed for direct separation of beta-blockers85,86. However, Pirkle selectors have not been included in our ‘to-be-screened’ list for synthesis constraints.
3.4 Materials and Methods
3.4.1 Chemicals R- and S-phenylglycinol (99%), R- and S-phenylethylamine (98%), R- and S-2-aminobutanol (97%), L-4-hydroxyproline (99%), 10% Pd on activated carbon 10% (puriss), (+)-camphoric acid, (+)-mandelic acid, citronellal (98%), di-o,o-p-toluyl-L-tartaric acid (98%), Dextran (Mw 500.000) and L-dibutyl-tartrate (98 %) were obtained from Fluka (Buchs, Switzerland). Dibutyl-L-tartrate was dissolved in CH2Cl2 and extracted four times with double distilled water prior to use to remove traces of acid. (+)-norephedrine (98%), (-)-norephedrine (99%), (+)-ephedrine hemihydrate (98%), (-)-ephedrine (99%), rac-2-amino-1-phenylethanol (98%), dodecylchloroformate (98%), 1R-(-)-10-camphorsulfonic acid (98%) and L-tartaric acid (99.5 %) were obtained from Aldrich (Milwaukee, Wisconsin, USA). Rac-2-pentylamine (98%) was obtained from Lancaster (Eastgate, England). HCl (32 %), NaOH pellets, dichloromethane, toluene, 1-butanol, methanol and n-hexane (all analytical grade), copper(II)acetate (99%), dodecanal (98%) and sodiumborohydride (96%) were obtained from Merck (Darmstadt, Germany). Methylisobutylketone (99.5 %) was obtained from Acros (Geel, Belgium). Throughout the study, milliQ-filtered water was used (Millipore, Billerica, MA, USA). 4-methylbenzylidene camphor sulfonic acid120 and anthracenyl camphor sulfonic acid were kindly donated by Dr. J. Nieuwenhuijzen, Syncom bv., Groningen, The Netherlands, as their sulfonate salts. They were converted to free acids by ion exchange over an Amberlite IR-120 (Fluka, Buchs, Switzerland) column with water/methanol 1:1 as eluent. Taddols ‘BX’ and ‘PX’117 were kindly donated by Dr. S. Müller, University of Nijmegen (KUN), The Netherlands. Aspartame was kindly donated by DSM Research, Geleen, The Netherlands. The azophenolic crown ether was synthesised by Syncom BV (Groningen, The Netherlands), in a custom synthesis96, estimated purity 90-99 % (HPLC). N-dodecyl-L-hydroxyproline was synthesised according to reference 4, purity > 95% (NMR). N-(2-hydroxydodecyl)-L-hydroxyproline was synthesised according to the method described by Busker et al121. N-dodecyl-R-phenylglycinol was synthesised according to reference 81. Dodecoxycarbonyl-L-leucine was synthesised according to reference 67.

Chapter 3
57
3.4.2 Extraction experiments and chemical analysis All extraction experiments were carried out in jacketed 25 mL glass vessels connected to a Julabo F-32 thermostat bath to enable temperature control. Experiments were carried out at 25 °C and/or 5 °C. Water and organic solvent were presaturated in each other. As solvents, butanol, hexane, butanol/hexane mixtures, toluene and in some cases CH2Cl2 were considered. If appropriate, the pH of the aqueous phase was controlled with NaOH, HCl or 0.1 M phosphate buffer solutions. In each experiment, 10 mL of aqueous phase containing the enantiomer (ususally as racemic mixture), and if applicable buffer salts or other additives, was mixed with 10 mL of organic phase containing the chiral selector. To determine the (physical) partitioning ratio P, the experiment is carried out without chiral selector present. After agitation for 2 hours, which was found to be sufficient to reach equilibrium, the phases were allowed to settle. Then, the pH of the aqueous phase was determined and a sample of the aqueous phase was taken for analysis by HPLC. The HPLC set-up consisted of a Varian 2510 pump, a Crownpak(+) chiral column (Daicel, Japan), a derivatization coil and a Jasco FP-2020 plus fluorescence detector. The eluent, 0.1 M perchloric acid in water, was filtered over
a 0.45 µm membrane before use (Millipore, Billerica, MA, USA). Post-column derivatisation
with phtalic dialdehyde / mercaptoethanol reagent was carried out according to Duchateau et
al122. Fluorescence detection was carried out at 325 nm excitation and 465 nm emission. In initial experiments, the mass balance was shown to hold within 5%. After that, the organic phase concentrations were calculated from the aqueous phase concentrations. The distribution
ratios (D) and operational selectivity (αop) are calculated from these concentrations. D values
between 0.2 and 5 are the most accurate because of their low relative error (5-10%). D values lower < 0.1 or > 10 must be judged with great care, because the relative error easily rises to > 30%. As the operational selectivity is calculated from the ratio of D’s, a selectivity lower than about 1.1 cannot be determined accurately by single extraction experiments.

Extractant identification
58
3.5 Results & Discussion
3.5.1 Extractant screening In table 3 the results of the screening experiments for the separation of rac-phenylglycinol have been summarised for 18 potential enantioselective extractants. In about 50 % of the cases some or all of the other model enantiomers were evaluated as well. All potential extractants were tested under various circumstances (pH, T, solvent). The highest enantioselectivity obtained for separation of phenylglycinol is reported for each selector. Although our aim is a minimal operational selectivity of 1.5 in extraction, all selectors with an enantioselectivity above the experimental error (enantioselectivity > 1.1 ) in the screening experiments were selected for further experimental study. This was done to test if an operational selectivity of > 1.5 can be reached under more suitable process conditions, and to study if the extractant is enantioselective for the other model enantiomers as well (versatility requirement). Only under the optimal process conditions, the operational selectivity in extraction will approach the intrinsic selectivity and the distribution ratios will be substantial (equation 1-3). For example, the concentrations of enantiomers and selector need to be high enough to obtain sufficient extent of complexation. For any selector in which the enantioselectivity in all experiments was lower than 1.1, ‘failure mechanisms’ are indicated. Various failure mechanisms can play a role. The selector may partition between the organic and the aqueous phase (1); no enhancement of extraction beyond physical partitioning was observed (2); enhanced extraction was observed, but there was no clear enantioselectivity (3); the selector proved to be chemically unstable (4); a stable emulsion was formed (5); or the enantiomer extracts the selector instead of the other way around (6). Despite the fact that each extractant was tested under various conditions, the possibility remains that enantioselectivity would have been obtained under different process conditions. However, time constraints did not allow further screening.
3.5.2 Performance of non-selective candidate extractant systems Table 3 shows that many of these selector systems are unable to function as enantioselective extractants, despite the fact that they demonstrated enantioselectivity in a different technique. These unsuccessful experiments may be categorised in three major groups by their failure mechanisms: I. no enhanced extraction above partitioning was obtained (either by 1, 2 or 6) II. practical problems, such as unstable compounds (4) or excessive emulsification (5). III. enhanced extraction, but no enantioselectivity (3) Failures in category I have two main causes. First, all chiral acid selectors partition between the phases, instead of remaining in one of the two liquid phases. As a result, no clear effect on

Chapter 3
59
Table 3: Results of screening experiments for selected potential extractants for chiral
separation of amino-alcohols and amines
Compound source table
operational selectivity phenylglycinol
failure mechanism
Organic acids and derivatives
L-tartaric acid 1d 1.0 1, 6 di-p-toluyl-tartaric acid A 1.0 (1), 3 camphorsulfonic acid 1d 1.0 1, 6 camphorsulfonate sodium salt 1d 1.0 2 4-methylbenzylidene camphorsulfonic acid
A 1.0 1, 3, 5
anthacenyl camphorsulfonic acid A 1.0 1, 3, 5 mandelic acid 1d 1.0 1, 6 camphoric acid 1d 1.0 1, 6 dibutyl-L-tartrate with boric acid 1a 1.3 ☺
Amino acids and derivatives, with Cu(II)
N-dodecyl-L-hydroxyproline Cu(II) complex
1a,1b 1.0 2
N-(2-hydroxydodecyl)-L-hydroxyproline Cu(II) complex
1b 1.2 ☺
N-dodecyl-R-phenylglycinol Cu(II) complex
1b 1.0 2, 5
dodecoxycarbonyl-L-leucine Cu(II) complex
A 1.0 1, 3
aspartame Cu(II) complex 1b 1.0 4
Saccharides dextran 1b 1.0 2
Crown ethers ‘Hirose’ crown ether 1c 5.0 ☺
Miscellaneous taddol 1d 1.0 2 citronellal (chiral aldehyde) A 1.0 3
Symbols: source 1a,1b,1c,1d refers to table 1a,1b,1c,1d, origin A refers to ‘included for
additional reasons’; ☺ enantioselectivity of extraction > 1.1. Failure mechanisms: see text.
amine/ amino-alcohol extraction can be observed. In some cases phenylglycinol extracts the selector to the aqueous phase instead of the other way around. To prevent this type of problems, adaptation of the structure of the selector can be attempted. For instance, Takeuchi

Extractant identification
60
et al4 connected a dodecyl (C12) tail to L-hydroxyproline to successfully prevent partitioning. Unfortunately, such structural modifications are not possible for all potential selectors in a simple way. In addition, changes in the selector structure may affect the chiral recognition process. Secondly, some of the potential selectors did not form complexes with the enantiomers in the solution to any appreciable extent. To identify and prevent such problems, it is crucial to study the chemistry of the complexation in solution under the experimental circumstances (pH, solvent, T). For instance, reactions between amines and aldehydes only take place at higher pH, because the uncharged amine group is involved, and the reaction does not take place with an amine present in its ammonium form. Furthermore, reactions between amino-alcohols and Cu(II) are much stronger at higher pH, so they hardly come to expression at neutral pH. In the case of taddols, it was found in literature117 that these compounds belong to a group of ‘inclusion compounds’ that only form inclusion complexes in the solid phase, so during crystallisation. Real inclusion complexes do not exist in the liquid, which explains why taddols do not function as extractants. The behaviour of aspartame is typical for category II. This compound is unstable under the required working conditions (pH neutral or basic). Another practical problem occurred with N-dodecyl-R-phenylglycinol Cu(II) complex and some chiral acids. They could not be studied further because a (fairly) stable emulsion was formed during extraction, which prevented chemical analysis. In category III, potential extractants are found that did display extraction, but only non-enantioselectively. The chiral acid selectors originate from literature on crystallisation. Their failure as enantioselective extractants is probably due to the need for chiral recognition in the liquid phase. Evidently, the selectors did not selectively form complexes with amino-alcohols in free solution despite the selectivity obtained for amino-alcohols in crystallisation. Another example is the dodecoxycarbonyl-L-leucine selector, which was not selective for phenylglycinol. In this case, we also tried to exploit the reciprocity principle: a CSP selector based on phenylglycinol can be used for separation of leucine81, so it may work the other way as well. The failure is probably caused here not because the reciprocity principle does not work, but also by a translation failure: a selector that displays an enantioselectivity of 1.2 for leucine as CSP is just not very likely to be a good selector for leucine in free solution. And the same holds for the ‘reverse’ selector system. In a few cases, candidate selectors were tested for which enantioselectivity towards amino-alcohols had not been described in literature, only enantioselectivity towards amino acids. Our experiments showed that these systems were unselective for our amino-alcohols: a good selector for amino acids is in many cases not a good selector for amino-alcohols. A good example from literature is C12Hyp/Cu(II) as CSP, which is a good selector for various amino-acids77, but which was much less selective for several amino-alcohols79. A similar effect has

Chapter 3
61
been reported by Yamazaki and coworkers70 for mandelic acid with Cu(II) as CMP in HPLC: separation factors of 1.2-2.0 were obtained for amino acids, but only separation factors of 1.1-1.2 were found for amino-alcohols (table 1b). Citronellal and dextran were included in the ’to-be-screened’ list although they had not shown a large selectivity for any compound in the literature, and none of them functioned as enantioselective extractant. It can be concluded that testing selectors for reactive extraction is rather pointless if there is no indication of sufficiently large enantioselectivity at all.
3.5.3 Performance of selective candidate extractant systems Table 3 shows that three systems were successful in the screening experiments, namely dibutyl-L-tartrate with boric acid, N-(2-hydroxydodecyl)-L-hydroxyproline Cu(II) complex and the azophenolic crown ether. With all these systems, enhanced extraction and an enantioselectivity larger than 1.1 were observed. Additional extraction experiments were carried out for these systems to test the versatility of the extractant, and to test if an operational selectivity > 1.5 can be reached by adaptation of the process conditions. Further characterisation, modelling of the extraction behaviour and tests on leaching of extractant and chemical stability are also very important for eventual industrial application, but will be carried out in a later stage of the research. Dibutyl-L-tartrate (DBT) with boric acid In all experiments with this system (table 4), equal volumes of water and CH2Cl2 phase were used. The concentration of racemic mixture was 2 mM, the initial aqueous boric acid concentration was 100 mM, the dibutyl-L-tartrate concentration in dichloromethane was also 100 mM, the temperature was 5 °C. No buffer salts or other additives were used, resulting in a pH at equilibrium of 6-7, depending on the extent of extraction. Table 4: Extraction of various amino-alcohols with dibutyl-L-tartrate (DBT) with boric acid.
D1 refers to the strongest extracted enantiomer, which may be S or R.
Chiral compound D1 [-] D2 [-] αop [-] strongest extracted enantiomer
norephedrine 0.43 0.33 1.3 (-) ephedrine 4.5 3.5 1.3 (-) 2-aminobutanol < 0.05 < 0.05 nd phenylglycinol 0.2 0.16 1.2 S 2-amino-1-phenylethanol 0.21 0.19 1.1 R
nd = not determined because of too low distribution ratio
The dibutyl-L-tartrate with boric acid system was originally developed for chiral separation of
β-blockers by reactive extraction, but it has been shown here that the system is also
moderately selective for certain other amino-alcohols. Comparison of the extraction of

Extractant identification
62
norephedrine and ephedrine results, including literature data, suggests that a secondary amine is more strongly complexed by the DBT system. Although the selector system is rather versatile, further development of this system for the target primary amines and amino-alcohols does not seem justified because of the too low enantioselectivities, namely < 1.3, and the low distribution ratios at high selector concentration (low capacity). N-(2-hydroxydodecyl)-L-hydroxyproline Cu(II) complex N-(2-hydroxyalkyl)-L-hydroxyproline Cu(II) complex has been used in CE76 and as CSP in HPLC73 for chiral separation of amino-alcohols. To the best of our knowledge, the component has not been used before as extractant for amino-alcohols. From previous work4,7, 123 with the related selector N-dodecyl-L-hydroxyproline (C12Hyp) for separation of amino acids by reactive extraction, it is known that C12Hyp forms a 2:1 complex with Cu(II) ion in the organic phase. Complexation of an amino acid enantiomer with this selector takes place by ligand-exchange, resulting in a ternary complex of C12Hyp, Cu(II) and amino acid. It is expected that N-(2-hydroxydodecyl)-L-hydroxyproline (OH-C12Hyp) will show similar complexation behaviour. Secondly, it is known118 that amino-alcohols only form complexes with Cu(II) ion at pH > 9. Therefore, the pH has to be high in order to extract amino-alcohols with this selector system. To prevent copper precipitation at high pH, the pH can be set conveniently by addition of 0.1 M ammonia76. It was found that OH-C12Hyp and C12Hyp can only be dissolved to a reasonable extent in an alcohol such as butanol or in a solvent mixture containing > 10 % alcohol; chlorinated solvents were not considered. In order to study the influence of the 2-hydroxyl group in the side chain on the selectivity, extraction experiments were carried out with both N-(2-hydroxydodecyl)-L-hydroxyproline (OH-C12Hyp) Cu(II) complex and N-dodecyl-L-hydroxyproline (C12Hyp) Cu(II) complex. Initial extraction experiments involved the separation of rac-norephedrine with 20 mM OH-C12Hyp / 10 mM Cu(II) in n-butanol. As expected, at low pH only physical partitioning was observed. At high pH the distribution ratios for both enantiomers were very high because of the complexation reaction in combination with the high polarity of the solvent, but the enantioselectivity was only moderate. As a next step, less polar butanol/hexane mixtures were tested as solvent. The extraction results are given in figure 2a and b for chiral separation of rac-norephedrine. To demonstrate the influence of the solvent composition on the physical partitioning, the partitioning ratio P at pH 11 is presented as well. It can be seen that the solvent composition has a large influence on the extent of extraction and on the operational selectivity. A similar strong effect of the solvent on the operational selectivity was described by Huang et al47 for a TLC/CMP separation. Other model enantiomers were tested with both OH-C12Hyp/Cu(II) and C12Hyp/Cu(II) using butanol/hexane solvent mixtures with high hexane content (75 or 83 vol%), under the same circumstances as for the norephedrine separation. The results are given in table 5.

Chapter 3
63
0
2
4
6
8
10
12
0 50 100vol% hexane in butanol
dis
trib
utio
n r
atio
[-] P
D(-)
D(+)
1
1.2
1.4
1.6
1.8
2
0 50 100vol% hexane in butanol
sele
ctiv
ity [-
]
(a) (b)
Figure 2: Extraction of 2.3 mM rac-norephedrine as a function of solvent composition at 25
°C; extractant [OH-C12Hyp] =20 mM, [Cu(II)]=10 mM at pH ~ 9.7 (0.1 M NH3), equal
volumes aqueous phase/organic phase. Lines are trendlines. (a) P = partitioning ratio at pH
11 (NaOH), D = distribution ratios for extraction of norephedrine (b) Selectivity αop = D(-)/
D(+). Table 5: Extraction of various amino-alcohols (2 mM rac) at 25 °C from water to
butanol/hexane mixtures at pH ~ 9.7 (0.1 M NH3). Extractant: 20 mM C12Hyp or OH-C12Hyp,
with 10 mM Cu(II), equal volumes aqueous/organic phase. D1 refers to strongest extracted
enantiomer.
extractant amino-alcohol vol% hexane
D1 [-] D2 [-] αop [-] strongest extracted enantiomer
OH-C12Hyp norephedrine 75 4.1 2.3 1.8 (-) OH-C12Hyp 2-aminobutanol 75 0.5 0.45 1.1 R OH-C12Hyp phenylglycinol 83 1.9 1.6 1.2 R OH-C12Hyp 2-amino-1-
phenylethanol 83 1.7 1.45 1.2 R
C12Hyp norephedrine 75 1.6 1.1 1.5 (+) C12Hyp 2-aminobutanol 75 < 0.1 < 0.1 nd C12Hyp phenylglycinol 75 0.9 0.9 1.0 C12Hyp 2-amino-1-
phenylethanol 75 1.0 0.7 1.4 S
nd = not determined because of too low distribution ratio
Furthermore, it was observed for OH-C12Hyp that carrying out the extraction at 5 °C results in a similar enantioselectivity, but lower distribution ratios (table 6).

Extractant identification
64
Table 6: Temperature influence on extraction of rac-norephedrine; [nor]ini=2.3 mM, 10 mM
Cu(II)/20 mM OH-C12Hyp from water to butanol/hexane mixtures at pH ~ 9.7.
vol% hexane T (°C) D(-) D(+) α=D(-)/D(+)
75 5 1.9 1.1 1.7 75 25 4.1 2.3 1.8
83 5 1.72 0.95 1.8 83 25 2.0 1.2 1.7
The N-(2-hydroxydodecyl)-L-hydroxyproline (OH-C12Hyp) Cu(II) complex has demonstrated a good selectivity of 1.8 for norephedrine under very specific conditions, but only a modest
enantioselectivity (≤ 1.2) for other reference enantiomers. The system is therefore not
versatile enough to separate various enantiomers from the same chemical class. A further drawback of this system is the presence of ammonia and some Cu(II) in the aqueous phase, which has to be separated from the enantiomer product. Similarly, the C12Hyp/Cu(II) system demonstrates a modest enantioselectivity but in addition much lower distribution ratios. It is noteworthy that the OH-C12Hyp selector and the C12Hyp selector prefer the opposite enantiomers of norephedrine and 2-amino-1-phenylethanol. Apparently, the presence of the 2-hydroxyl group on the C12 side chain has a large effect on the chiral recognition process. N-(2-hydroxydodecyl)-L-hydroxyproline is in fact a mixture of two diastereomers itself; the 2-hydroxyl group on the dodecyl tail introduces a second chiral centre in the molecule. Separation of the two diastereomers of N-(2-hydroxydodecyl)-L-hydroxyproline may result in a pure selector that is more selective towards amino-alcohols than the diastereomeric mixture. However, it was decided not to carry out any further work for this system because of the favourable properties of the next extractant tested. Azophenolic crown ether The last selective system to be tested further is the azophenolic crown ether represented in figure 3, which was selected for its high reported enantioselectivity and high binding constants. This crown ether and a number of related crown ethers were developed by Naemura, Hirose and other workers for use in HPLC/CSP systems52. In the literature, complexation constants of these compounds with several amino-alcohols and amines in chloroform are reported96, with enantioselectivities of often > 2, up to 12. In contrast with most other crown ethers, the phenolic crown ethers form inclusion complexes with the neutral form of amines and amino-alcohols. Comparison of the enantioselectivities of the various crown ethers shows that the aryl groups on the crown ether ring are very important in the
chiral recognition process, by a combination of π-π-interaction, dispersion forces and steric
hindrance. If these groups are exchanged for methyl, tert-butyl or adamantyl124, or if the ring is made more rigid by connecting for instance cyclohexane rings to the sides of the main ring125, the enantioselectivity drops considerably. The electron-withdrawing 2,4-

Chapter 3
65
dinitrophenylazo group increases the complexation strength126 and is responsible for the clear colour change of the molecule upon complexation26.
O
O
O
O OOH
N N
O2N
NO2
Figure 3: Azophenolic crown ether96
Our initial experiments with the crown ether were carried out with CH2Cl2 as solvent. Equal volumes of aqueous phase and dichloromethane phase were used. The initial concentration of the racemic mixture in water and of the crown ether in dichloromethane were both 2 mM. The pH was not controlled by buffer salts. It was visually observed and confirmed by UV-Vis spectroscopy that physical partitioning of the crown ether to the aqueous phase is negligible. The extraction results are given in table 7:
Table 7: Chiral separation of various amino-alcohols and amines by reactive extraction with
2 mM azophenolic crown ether in dichloromethane. [rac]ini = 2 mM. D1 refers to strongest
extracted enantiomer.
enantiomer T [°C] pH D1 [-] D2 [-] αop [-] strongest extracted
enantiomer
phenylglycinol 25 9 4.0 0.8 5.0 R 2-amino-1-phenylethanol 5 10 5.6 4.2 1.3 R norephedrine 5 8.7 4.5 2.6 1.7 (+) 2-aminobutanol 5 9.9 1.9 0.6 3.2 R
phenylethylamine 5 9.2 20.4 9.9 2.1 S 2-aminopentane 5 9.9 6.2 6.0 1
The crown ether system shows a good enantioselectivity for 4 out of 6 model compounds, and a modest selectivity for 1 compound. It is therefore a versatile and also very selective extractant system. The distribution ratios are already high at relatively low extractant concentration, which indicates a promising process capacity. According to the literature, the influence of temperature on the complexation constants is high96 and deserves further study.

Extractant identification
66
By comparing the selectivities, it seems that the compounds bearing the amine group group next to the chiral centre can be separated with the highest enantioselectivity, with exception of 2-aminopentane. This effect seems logical, because the primary interaction between enantiomer and crown ether is inclusion of the (neutral) amine group in the crown ether ring. The difference in selectivity for phenylglycinol and 2-amino-1-phenylethanol (bearing the chiral centre next to the hydroxyl group) is striking. The structure around the chiral centre for the strongest bonded enantiomer is the same for phenylglycinol, phenylethylamine and 2-aminobutanol, despite the difference in R/S designation. This is caused by the priority in the nomenclature of the -C-OH group over the phenyl group in phenylglycinol, and the priority of the phenyl group over the methyl group in phenylethylamine. From the failure to separate 2-aminopentane, it seems that a second functional group is required for chiral recognition; this may be a phenyl group or a hydroxyl group, or possibly a different functionality. The selector may also be enantioselective for other enantiomers that are primary amines with at least one other functionality, such as amino acids, other amino-alcohols and aromatic amines.
3.5.4 Evaluation of the developed identification procedure In the theoretical part, several chiral separation techniques have been compared, which resulted in the expectation that systems in which the origin of enantioselectivity is the difference in complexation constants in solution, are the most likely to yield enantioselective extractants. When comparing the three successful systems listed above, it can be concluded that they indeed all originate from ‘liquid’ systems. OH-C8Hyp was tested as selector in capillary electrophoresis76, and proved to be slightly selective for a number of amino-alcohols, and much more selective for norephedrine and some analogues. The same selectivity pattern is found in extraction. OH-C12Hyp was also successfully applied as CSP, but these results73 are not so similar to the extraction results. The HPLC/CSP separation was carried out at pH 6, which proved to be an unsuitable pH for extraction, and the system was selective for different amino-alcohols. Thus, the results from the ‘liquid’ technique CE are more predictive of the reactive extraction results than the results from the ‘solid’ technique HPLC/CSP. The other two selective systems also originate from ‘liquid’ techniques. DBT was tested as extractant
before, for β-blockers. The complexation constants in solution for enantiomer-Hirose crown
ether were published, which is a direct indication for a successful transfer to extraction. If we look at the unsuccessful transfers listed in table 3, we find further confirmation for our expectations. The chiral acids that extracted the amine enantiomers unselectively (failure mechanism 3) originate from the crystallisation literature. According to the hypothesis, selectivity in crystallisation is not predictive for selectivity in extraction. In the literature, we can also find further support for our expectations, such as the azophenolic crown ether system: the separation factors are very high in CHCl3 solution96, but they drop considerably when the crown ether is immobilised onto a solid support52. This confirms that
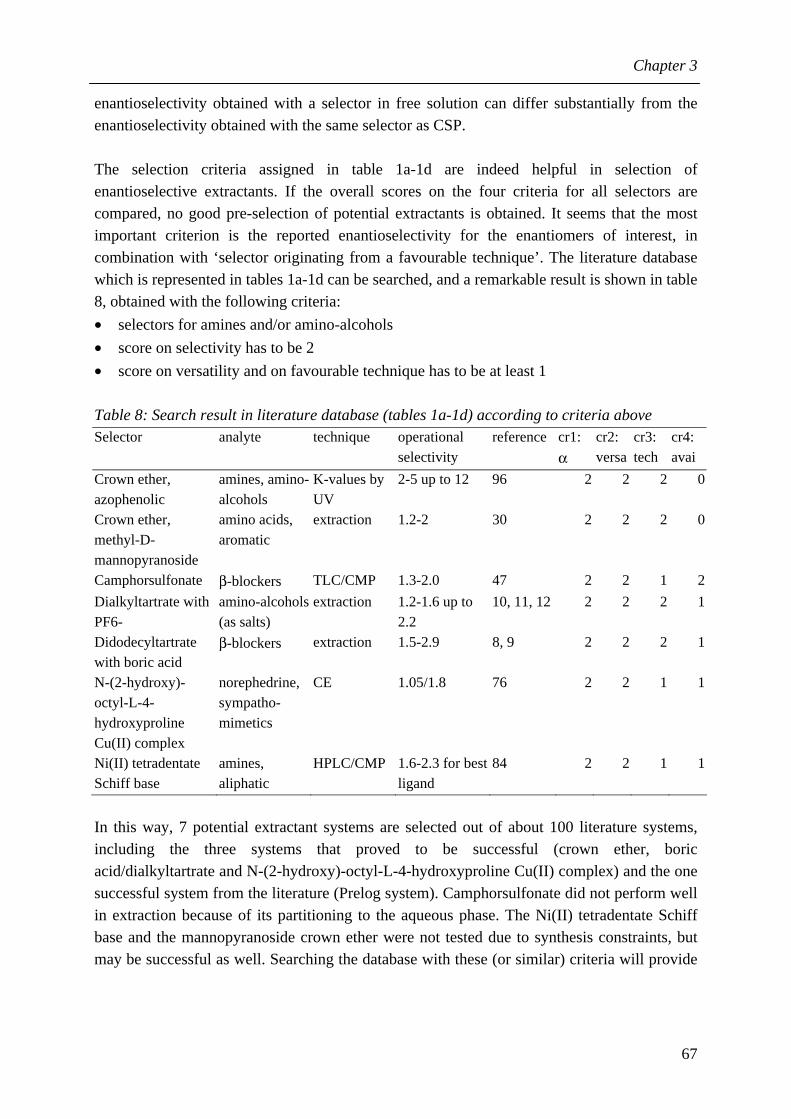
Chapter 3
67
enantioselectivity obtained with a selector in free solution can differ substantially from the enantioselectivity obtained with the same selector as CSP. The selection criteria assigned in table 1a-1d are indeed helpful in selection of enantioselective extractants. If the overall scores on the four criteria for all selectors are compared, no good pre-selection of potential extractants is obtained. It seems that the most important criterion is the reported enantioselectivity for the enantiomers of interest, in combination with ‘selector originating from a favourable technique’. The literature database which is represented in tables 1a-1d can be searched, and a remarkable result is shown in table 8, obtained with the following criteria:
• selectors for amines and/or amino-alcohols
• score on selectivity has to be 2
• score on versatility and on favourable technique has to be at least 1 Table 8: Search result in literature database (tables 1a-1d) according to criteria above Selector analyte technique operational
selectivity reference cr1:
α
cr2: versa
cr3: tech
cr4: avai
Crown ether, azophenolic
amines, amino-alcohols
K-values by UV
2-5 up to 12 96 2 2 2 0
Crown ether, methyl-D-mannopyranoside
amino acids, aromatic
extraction 1.2-2 30
2 2 2 0
Camphorsulfonate β-blockers TLC/CMP 1.3-2.0 47 2 2 1 2
Dialkyltartrate with PF6-
amino-alcohols (as salts)
extraction 1.2-1.6 up to 2.2
10, 11, 12 2 2 2 1
Didodecyltartrate with boric acid
β-blockers extraction 1.5-2.9 8, 9 2 2 2 1
N-(2-hydroxy)-octyl-L-4-hydroxyproline Cu(II) complex
norephedrine, sympatho-mimetics
CE 1.05/1.8 76 2 2 1 1
Ni(II) tetradentate Schiff base
amines, aliphatic
HPLC/CMP 1.6-2.3 for best ligand
84 2 2 1 1
In this way, 7 potential extractant systems are selected out of about 100 literature systems, including the three systems that proved to be successful (crown ether, boric acid/dialkyltartrate and N-(2-hydroxy)-octyl-L-4-hydroxyproline Cu(II) complex) and the one successful system from the literature (Prelog system). Camphorsulfonate did not perform well in extraction because of its partitioning to the aqueous phase. The Ni(II) tetradentate Schiff base and the mannopyranoside crown ether were not tested due to synthesis constraints, but may be successful as well. Searching the database with these (or similar) criteria will provide

Extractant identification
68
a good ‘priority-of-testing’ list, which decreases the amount of experimental work considerably. It is also noteworthy that only one commercially available system (score ‘2’ on availability) comes up. There is a evidently a trade-off between the performance of the selector system and its ease of availability (i.e. price). For the boric acid system, it was possible to use the commercially available dibutyl-L-tartrate instead of didodecyl-L-tartrate, but this may not be the tartrate that gives optimal selectivity. For the Prelog system, it is reported that tartrates containing more bulky alcohol residues such as menthol are more selective than the simple straight-chain alcohols12, but they will be more expensive as well.
3.6 Conclusion Four enantioselective extractant systems for separation of amino-alcohols and amines with the chiral center next to the amino group have been identified, namely dibutyl-L-tartrate with boric acid, N-(2-hydroxydodecyl)-L-hydroxyproline Cu(II) complex, N-dodecyl-L-hydroxyproline Cu(II) complex and azophenolic crown ether. The azophenolic crown ether system is particularly promising, as it displays both a high versatility and high enantioselectivity in extraction. In order to assess the technical and economical feasibility of this extractant, further study is desired to determine the effect of process parameters on selectivity and capacity of the system and to test if recovery of products and extractant is possible. Furthermore, an alternative for the dichloromethane solvent has to be identified. Secondly, we have proposed an approach to identify potential enantioselective extractants in the chiral recognition literature. For a successful transfer, a certain selector should display chiral recognition towards the components of interest in the liquid phase. Enantioselective extractants are most likely to be found among chiral selectors in the extraction, HPLC/CMP, electrophoresis and liquid membrane literature. Furthermore, the reported enantioselectivity should be large enough, at least 1.5. In this way, a pre-selection or a ‘priority-of-testing’ list can be made from a database containing chiral selectors from various techniques. Thus, the amount of required batch extraction experiments for identification of a new enantioselective extractant is likely to be reduced drastically. As the process conditions have a large effect on the selectivity and capacity of the extraction, it is important to select them carefully. We expect that this approach to identify enantioselective extractants in the chiral recognition literature can be applied for other classes of enantiomers as well. In this way, many selectors reported in the chiral recognition research may be transferred to new applications. Finally, the improved availability of enantioselective extractants is an essential step forward for the introduction of reactive extraction as an industrial chiral separation method.

Chapter 3
69
References 1 Takeuchi T, Horikawa R, Tanimura T, Kabasawa Y. Resolution of DL-valine by countercurrent solvent extraction with continuous sample feeding. Sep Sci Tech 1990;25(7&8):941-951 2 Ding HB, Carr PW, Cussler EW. Racemic leucine separation by hollow-fiber extraction. AIChE J 1992;38(10):1493-1498 3 Yokouchi Y, Ohno Y, Nakagomi K, Tanimura T, Kabasawa Y. A device for countercurrent fractional extraction and its application to continuous resolution of D,L-isoleucine. Chromatography 1998;19(4):374-375 In Japanese. 4 Takeuchi T, Horikawa R, Tanimura T. Enantioselective solvent extraction of neutral DL-amino acids in two-phase systems containing N-n-alkyl-L-proline derivatives and copper(II) ion. Anal Chem 1984;56:1152-1155. 5 Tsukube H, Uenishi J, Kanatani T, Itoh H, Yonemitsu O. Enantioselective binding and extraction of zwitterionic amino acids by chiral lanthanide complexes. Chem Comm 1996;4:477-478 6 Pietrasckiewicz M, Kozbial M, Pietraszkiewicz O. Chiral discrimination of amino acids and their potassium or sodium salts by optically active crown ether derived from D-mannose. J Membr Sci 1998;138:109-113 7 Pickering PJ, Chaudhuri JB. Equilibrium and kinetic studies of the enantioselective complexation of (D/L)-phenylalanine with copper(II) N-decyl (L) hydroxyproline. Chem Eng Sci 1997;52(3):377-386 8 Abe Y, Shoji T, Kobayashi M, Qing W, Asai N, Nishizawa H. Enantioselective distribution of amino-alcohols in a liquid-liquid two-phase system containing dialkyl L-tartrate and boric acid. Chem Pharm Bull 1995;43(2):262-265 9 Abe Y, Shoji T, Fukui S, Sasamoto M, Nishizawa H. Enantioseparation by dual-flow countercurrent extraction: its application to the enantioseparation of (±)propanolol. Chem Pharm Bull 1996;44(8):1521-1524 10 Prelog V, Stojanac Z, Kovacevic K, Über die Enantiomerentrennung durch Verteilung zwischen flüssigen Phasen. Helv Chim Acta 1982;65(1):377-384 11 Prelog V, Mutak S, Kovacevic K. Über die Enantiomerentrennung durch Verteilung zwischen flüssigen Phasen, 3. Mitteilung, Selektivität der lipophilen Weinsaüreester für chirale Ammonium-Salze verschiedener Konstitution und Konfiguration. Helv Chim Acta 1983;66(7):2279-2284 12 Prelog V, Kovacevic M, Egli M. Lipophilic tartaric acid esters as enantioselective ionophores. Angew Chem Int Ed 1989;28:1147-1152 13 Ramström O, Ansell RJ. Molecular imprinting technology: challenges and prospects for the future. Chirality 1998;10:195-209 14 Miertus S, Fassina G (editors). Combinatorial chemistry and technology. Principles, methods and applications. New York: Marcel Dekker Inc; 1999. 435 p. 15 Lipkowitz KB. Atomistic modeling of enantioselection in chromatography. J Chromat A 2001;906(1-2):417-442 16 Blaser HU, Spindler F, Studer M. Enantioselective catalysis in fine chemicals production. Applied Catalysis A: General 2001;221:119-143 17 Webb TH, Wilcox CS. Enantioselective and diastereoselective molecular recognition of neutral molecules. Chem Soc Rev 1993;383-395 18 Sheldon RA, Chirotechnology. Industrial synthesis of optically active compounds. Marcel Dekker Inc.; 1993.

Extractant identification
70
19 Pirkle WH, Pochapsky TC. Considerations of chiral recognition relevant to the liquid chromatographic separation of enantiomers. Chem Rev 1989;89:347-362 20 Davankov VA. Chiral selectors with chelating properties in liquid chromatography: fundamental reflections and selective review of recent developments (review). J Chromat A 1994;666:55-76 21 Copper CL. Capillary Electrophoresis Part 1. Theoretical and experimental background. J Chem Educ 1998;75(3):343-347 22 Gübitz G, Schmid MG. Chiral separation principles in capillary electrophoresis (review). J Chromat A 1997;792:179-225 23 Chankvetadze B, Blaschke, G. Enantioseparations in capillary electromigration techniques: recent developments and future trends (review). J Chromat A 2001;906:309-363 24 Kuhn R, Hoffstetter-Kuhn S. Chiral separation by capillary electrophoresis (review). Chromatographia 1992;34(9-10):505-512 25 Schneider H-J, Yatsimirsky A. Principles and methods in supramolecular chemistry. Chichester: John Wiley and Sons: 2000 CT 547 .7/.8 s 040 In this book: Section D; energetics of supramolecular complexes: experimental methods, p. 137-226 26 Hirose K. A practical guide for the determination of binding constants. J Incl Phen Macroc Chem 2001;39:193-209 27 Morin GT, Hughes MP, Paugam M-F, Smith BD. Transport of glycosides through liquid organic membranes mediated by reversible boronate formation is a diffusion-controlled process. J Am Chem Soc 1994;116:8895-8901 28 Kellner KH, Blasch A, Chmiel H, Lämmerhofer M, Lindner W. Enantioseparation of N-protected α-amino acid derivatives by liquid-liquid extraction technique employing stereoselective ion-pair formation with a carbamoylated quinine derivative. Chirality 1997;9:268-273 29 Franco P, Blanc J, Oberleitner WR, Maier NM, Lindner W, Minguillon C. Enantiomer separation by countercurrent chromatography using cinchona alkaloid derivatives as chiral selectors. Anal Chem 2002;74:4175-4183 30 Kozbial M, Pietraszkiewicz M, Pietraszkiewicz O. Chiral discrimination of amino acids by an optically active crown ether studied by HPLC, extraction and a liquid membrane transport experiments. J Incl Pheno Mol Rec Chem 1998;30:69-77 31 Tsukube H, Shinoda S, Uenishi J, Kanatani T, Itoh H, Shiode M, Iwachido T, Yonemitsu O. Molecular recognition with Lanthanide(III) Tris (β-diketonate) complexes: extraction, transport and chiral recognition of unprotected amino acids. Inorg Chem 1998;37:1585-1591 32 Pirkle WH, Bowen WE. Preparative separation of enantiomers using hollow-fiber membrane technology. Tetrahedron Asymmetry 1994;5(5):773-776 33 Nishizawa H, Tahara K, Hayashida A, Abe Y. Continuous separation method with liquid particle extractor: enantioseparation of (±)-mandelic acid. Anal Sci 1993;9:611-615 34 Romano SJ, Wells KH, Rothbart HL, Rieman III W. Resolution of racemic substances by liquid ion-exchange. Talanta 1969;16:581-590 35 Oya S, Snyder JK. Chiral resolution of a carboxylic acid using droplet countercurrent chromatography. J Chromat 1986;370:333-338 36 Conway WD. Countercurrent chromatography, apparatus, theory & applications. New York:VCH, 1990. 475 p. 37 Foucault AP. Enantioseparations in counter-current chromatography and centrifugal partition chromatography (review). J Chromat A 2001;906:365-378 38 Galaverna G, Corradini R, Munari E de, Dossena A, Marchelli R. Chiral separation of unmodified amino acids by ligand-exchange high-performance liquid chromatography using

Chapter 3
71
copper(II) complexes of L-amino acid amides as additives to the eluent. J Chromat A 1993;657:43-54 39 Oi N, Kitahara H, Aoki F. Enantiomer separation by HPLC on reversed phase silica gel coated with copper(II) complexes of (R,R)-tartaric acid mono-amide derivatives. J liq chrom 1993;16(4):893-901 40 Okamoto Y, Yashima E. Chromatographic enantiomer separation on chiral polymers. In: Jinno K., editor. Chromatographic separations based on molecular recognition. New York:Wiley-VCH;1997. p. 239-272 41 Desiderio C, Aturki Z, Fanali S. Separation of α-hydroxy acid enantiomers by high performance capillary electrophoresis using copper(II)-L-amino acid and copper(II)-aspartame complexes as chiral selectors in the background electrolyte. Electrophoresis 1994;15:864-869 42 Gozel P, Gassmann E, Michelsen H, Zare RN. Elektrokinetic resolution of amino acid enantiomers with copper(II)-aspartame support electrolyte. Anal Chem 1987;59:44-49 43 Broge JM, Leussing DL. Mechanism of the reversed-phase high-performance liquid chromatographic separation of D- and L-valine using copper(II) and L-aspartyl-L-phenylalanine methyl ester. Anal Chem 1986;58(11):2237-2241 44 Hyun MH, Yang DH, Kim HJ, Ryoo JJ. Mechanistic evaluation of the resolution of α-amino acids on dynamic chiral stationary phases derived from amino alcohols by ligand-exchange chromatography. J Chromat A 1994;684:189-200 45 Grady T, Joyce T, Smyth MR, Harris SJ, Diamond D. Chiral resolution of the enantiomers of phenylglycinol using (S)-di-naphtylprolinol calix[4]arene by capillary electrophoresis and fluorescence spectroscopy. Anal Comm 1998;35(4):123-125 46 Pettersson C, Schill G. Chiral resolution of aminoalcohols by ion-pair chromatography. Chromatographia 1982;16:192-197 47 Huang M-B, Li G-L, Yang G-S, Shi Y-H, Gao J-J, Liu X-D. Enantiomeric separation of aromatic amino alcohol drugs by chiral ion-pair chromatography on a silica gel plate. J liq chrom & rel technol 1997;20(10):1507-1514 48 Bjornsdottir I, Hansen SH, Terabe S. Chiral separation in non-aqueous media by capillary electrophoresis using the ion-pair principle. J Chromat A 1996;745:37-44 49 Krawinkler KH, Maier NM, Ungaro R, Sansone F, Casnati A, Lindner W. Novel cinchona carbamate selectors with complementary enantioseparation characteristics for N-acylated amino acids. Chirality 2003;15:S17-S29 50 Hyun MH, Han SC, Lipschutz BH, Shin Y-J, Welch CJ. Liquid chromatographic resolution of racemic amines, amino alcohols and related compounds on a chiral crown ether stationary phase. J Chromat A 2002;959:75-83 51 Daicel website http://www.daicel.co.jp/chiral/e/product/crownpak.html 52 Hirose K, Nakamura T, Nishioka R, Ueshige T, Tobe Y. Preparation and evaluation of novel chiral stationary phases covalently bound with chiral pseudo-18-crown-6 ethers. Tetrahedron Letters 2003a;44:1549-1551 53 Hyun MH, Jin JS, Koo HJ, Lee W. Liquid chromatographic separation of racemic amines and amino alcohols on a stationary phase derived from crown ether. J Chromat A 1999;837:75-82 54 Hoehne E, Krauss GJ, Guebitz G. Capillary zone electrophoresis of the enantiomers of amino alcohols based on host-guest complexation with a chiral crown ether. J high res chrom 1992;15(10):698-700 55 Schurig V. Chiral separations using gas chromatography. Trends Anal Chem 2002;21(9+10):647-661

Extractant identification
72
56 Supplier documentation and websites, for example Astec at http://www.astecusa.com, or Supelco at http://www.sigmaaldrich.com/Brands/Supelco_Home.html 57 Zhu X, Lin B, Jakob A, Wuerthner S, Koppenhoefer B. Separation of drugs by capillary electrophoresis, part. 10. Permethyl-alpha-cyclodextrin as chiral solvating agent. Electrophoresis 1999;20:1878-1889 58 Berthod A, Jin HL, Beesley TE, Duncan JD, Armstrong DW. Cyclodextrin chiral stationary phases for liquid chromatographic separations of drug stereoisomers. J Pharm Biomed Ana 1990;8(2):123-130 59 Huang WX, Xu H, Fazio SD, Vivilecchia RV. Chiral separation of primary amino compounds using a non-chiral crown ether with β-cyclodextrin by capillary electrophoresis. J Chromat B 1997;695:157-162 60 Stalcup AM, Chang S-C, Armstrong DW. Effect of the configuration of the substituents of derivatized β-cyclodextrin bonded phases on enantioselectivity in normal-phase liquid chromatography. J Chromat 1991;540:113-128 61 Kirby Maynard D, Vigh G. Heptakis(2-O-methyl-3,6-di-O-sulfo)-β-cyclodextrin: a single isomer, 14-sulfated β-cyclodextrin for use as a chiral resolving agent in capillary electrophoresis. Electrophoresis 2001;22:3152-3162 62 Maruszak W, Trojanowicz M, Margasinska M, Engelhardt H. Application of carboxymethyl-β-cyclodextrin as a chiral selector in capillary electrophoresis for enantiomer separation of selected neurotransmitters. J Chromat A 2001;926:327-336 63 Herraez-Hernandez R, Campins-Falco P. Chiral separation of ephedrines by liquid chromatography using β-cyclodextrins. Anal Chim Acta 2001;434:315-324 64 Zukowski J, Biasi V de, Berthod A. Chiral separation of basic drugs by capillary electrophoresis with carboxymethylcyclodextrins. J Chromat A 2002;948:331-342 65 Nishi H, Izumoto S, Nakamura K, Nakai H, Sato T. Dextran and dextrin as chiral selectors in capillary zone electrophoresis. Chromatographia 1996;42(11/12):617-630 66 Heldin E, Lindner K-J, Pettersson C, Lindner W, Rao R. Tartaric acid derivatives as chiral selectors in liquid chromatography. Chromatographia 1991;32(9/10):407-416 67 Ding W, Fritz JS. Carbamate chiral surfactants for capillary electrophoresis. J Chromat A 1999;831:311-320 68 Schmid MG, Guebitz G. Direct enantiomer separation of underivatized amino acids by capillary zone electrophoresis based on ligand exchange. Enantiomer 1996;1:23-27 69 d’Hulst A, Verbeke N. Carbohydrates as chiral selectors for capillary electrophoresis of racemic drugs. Enantiomer 1997; 2:69-79 70 Yamazaki S, Ozaki K, Saito K, Tanimura T. Enantiomeric separation of β-amino alcohols with a primary or tertiary amine moiety by reversed phase liquid chromatography with a chiral mobile phase containing copper(II) and R-mandelic acid. J high res chrom 1995;18:68-70 71 Davankov VA, Kurganov AA. High-performance liquid chromatography of α-amino acids on a polystyrene resin with fixed ligands of the type (R)-N’,N’-dibenzyl-1,2-propanediamine. Chromatographia 1980a;13(6):339-341 72 Oi N, Kitahara H, Aoki F. Direct separation of carboxylic acid and amine enantiomers by high-performance liquid chromatography on reversed-phase silica gels coated with chiral copper(II) complexes. J Chromat A 1995;707:380-383 73 Bazylak G. Chiral separation of some amino alcohols by addition of helical nickel(II) chelate to the mobile phase used in reversed-phase high-performance liquid chromatography. J Chromat A 1994;665:75-86

Chapter 3
73
74 Vegvari A, Schmid MG, Pilar F, Guebitz G. Chiral separation of α-amino acids by ligand-exchange capillary electrophoresis using N-(2-hydroxy-octyl)-L-4-hydroxyproline as a selector. Electrophoresis 1998;19:2109-2112 75 Schmid MG, Lecnik O, Sitte U, Guebitz G. Application of ligand-exchange capillary electrophoresis to the chiral separation of α-hydroxy acids and β-blockers. J Chromat A 2000;875:307-314 76 Schmid MG, Laffranchini M, Dreveny D, Guebitz G. Chiral separation of sympathomimetics by ligand exchange capillary electrophoresis. Electrophoresis 1999;20:2458-2461 77 Davankov A, Bochkov AS, Kurganov AA. Separation of unmodified α-amino acid enantiomers by reverse phase HPLC. Chromatographia 1980b;13(11):677-685 78 Yamazaki S, Takeuchi T, Tanimura T. Direct enantiomeric separation of norephedrine and its analogues by high-performance liquid chromatography. J Liq Chromat 1989;12(12):2239-2248 79 Yamazaki S, Takeuchi T, Tanimura T. Direct enantiomeric separation of β-amino acids and β-amino alcohols by ligand-exchange chromatography. J Chromat 1991;540:169-175 80 Yamazaki S, Nagaya S, Saito K, Tanimura T. Enantiomeric separation of underivatized aliphatic β-amino alcohols by ligand-exchange chromatography using barbital as an additive to the mobile phase. J Chromat A 1994a;662:219-225 81 Sliwka M, Slebioda M, Kolodziejczyk AM. Dynamic ligand-exchange chiral stationary phase derived from amino alcohol. Chem Anal (Warsaw) 1997;42:895-900 82 Gelber LR, Karger BL, Neumeyer JL, Feibush B. Ligand exchange chromatography of amino alcohols. Use of Schiff bases in enantiomer resolution. J Am Chem Soc 1984;106:7729-7734 83 Shieh CH, Karger BL, Gelber LR, Feibush B. Ligand exchange chromatography of amino alcohol enantiomers as Schiff bases. J Chromat 1987;406:343-352 84 Bazylak G. Helical nickel (II) complexes as mobile phase additives in the reverse-phase high-performance liquid chromatographic separation of alkylamine enantiomers. Analyst 1992;117(9):1429-1433 85 Pirkle WH, Burke JA. Chiral selector useful for separation of enantiomers of β-amino alcohol compounds. 1993: US patent 5,254,258 86 Pirkle WH, Lee W. Chiral selector useful for separation of enantiomers of β-amino alcohol compounds. 1996: US patent 5,578,212 87 Tanaka H, Nakogomi K, Tanimura T. Effect of barbiturates on enantiomeric separation by HPLC using copper-proline complex as mobile phase. Chromatography 1997;18(4):308-309 (in Japanese) 88 Gil-Av E, Tishbee A, Hare PE. Resolution of underivatized amino acids by reversed-phase chromatography. J Am Chem Soc 1980;102:5115-5117 89 Yamazaki S, Saito K, Tanimura T. Enantiomeric separation of underivatized aliphatic and aromatic β-amino alcohols by reversed-phase liquid chromatography with a chiral mobile phase. J Liq Chromat 1994b;17(12):2559-2567 90 Oi N, Kitahara H, Aoki F. Enantiomer separation by high-performance liquid chromatography with (R,R)-tartaric acid mono-amide derivatives as bifunctional chiral selectors. J Chromat A 1994;666:457-462 91 Gyllenhaal O, Karlsson A. Enantiomeric separations of amino alcohols by packed-column SFC on Hypercarb with L-(+)-tartaric acid as chiral selector. J Biochem Biophys Meth 2002;54:169-185

Extractant identification
74
92 Kicinski HG, Kettrup A. Determination of enantiomeric catecholamines by ligand-exchange chromatography using chemically modified L(+)-tartaric acid silica gel. Fresenius Z Anal Chem 1985;320:51-54 93 Pettersson C, Joseffson M. Chiral separation of aminoalcohols by ion-pair chromatography. Chromatographia 1986;21(6):321-326 94 Hedeland Y, Hedeland M, Bondesson U, Pettersson C. Chiral separation of amines with N-benzoxycarbonylglycyl-L-proline as selector in non-aqueous capillary electrophoresis using methanol and 1,2-dichloroethane in the background electrolyte. J Chromat A 2003;984:261-271 95 Kubo Y. Binaphtyl-appended chromogenic receptors: synthesis and application to their colorimetric recognition of amines. Synlett 1999;2:161-174 96 Naemura K, Nishioka K, Ogasahara K, Nishikawa Y, Hirose K, Tobe Y. Preparation and temperature-dependent enantioselectivities of homochiral phenolic crown ethers having aryl chiral barriers: thermodynamic parameters for enantioselective complexation with chiral amines. Tetrahedron: Asymmetry 1998;9:563-574 97 Kokugan T, Kaseno, Takada T, Shimizu M. Measurement of binding constant of cyclodextrin by ultrafiltration. J Chem Eng Japan 1995;28(3): 267-273 98 Yudiarto A, Dewi E, Kokugan T. Separation of isomers by ultrafiltration using modified cyclodextrins. Sep Purif Techn 2000;19:103-112 99 Brown SE, Haskard CA, Easton CJ, Lincoln SF. Complexation of phenylalanine and histidine by β-cyclodextrin, 6a-(3-aminopropylamino)-6A-deoxy-β-cyclodextrin and its metallodextrins in aqueous solution. J Chem Soc Faraday Trans 1995;91(6):1013-1018 100 Sessler JL, Andrievsky A, Kral V, Lynch V. Chiral recognition fo dicarboxylate anions by sapphyrin-based receptors. J Am Chem Soc 1997;119: 9385-9392 101 Romero J, Zydney AL. Staging of affinity ultrafiltration processes for chiral separations. J Membr Sci 2002;209:107-119 102 Randon J, Garnier F, Rocca JL, Maïsterrena B. Optimization of the enantiomeric separation of tryptophan analogs by membrane processes. J Membr Sci 2000;175:111-117 103 Newman P. Optical resolution procedures for chemical compounds, vol. 1: amines and related compounds. Riverdale, New York: Optical Resolution information center, Manhattan College; 1977. 616 p. 104 Overdevest PEM, Padt A.van der. Optically pure compounds from ultrafiltration. ChemTech 1999;29(12):17-22 105 Shinbo T, Yamaguchi T, Yanagishita H, Sakaki K, Kitamoto D, Sugiura M. Supported liquid membranes for enantioselective transport of amino acid mediated by chiral crown ether-effect of membrane solvent on transport rate and membrane stability. J Membr Sci 1993;84:241-248 106 Lingenfelter DS, Helgeson RC, Cram DJ. Host-guest complexation. 23. High chiral recognition of amino acid and ester guests by hosts containing one chiral element. J Org Chem 1981;46(2):393-406 107 Newcomb M, Helgeson RC, Cram DJ. Enantiomer differentiation in transport through bulk liquid membranes. J Am Chem Soc 1974;96:7367-7369 108 Ent EM van der, Thielen TPM, Cohen Stuart MA, Padt A van der, Keurentjes JTF. Electrodialysis system for large-scale enantiomer separation. Ind Eng Chem Res 2001;40:6021-6027 109 Armstrong DW, Jin HL. Enrichment of enantiomers and other isomers with aqueous liquid membranes containing cyclodextrin carriers. Anal Chem 1987;59:2237-2241

Chapter 3
75
110 Keurentjes JTF, Nabuurs LJWM, Vegter EA. Liquid membrane technology for the separation of racemic mixtures. J Membr Sci 1996;113:351-360 111 Hadik P, Szabo L-P, Nagy E. D,L-lactic acid and D,L-alanine enantioseparation by membrane process. Desalination 2002;148:193-198 112 Heard CM, Hadgraft J, Brain KR. Differential facilitated transfer across a solid-supported liquid membrane. Bioseparation 1994;4:111-116 113 Pirkle WH, Doherty EM. Enantioselective transport through a silicone-supported liquid membrane. J Am Chem Soc 1989;111:4113-4114 114 Bryjak M, Kozlowski J, Wieczorek P, Kafarski P. Enantioselective transport of amino acids through supported liquid membranes. J Membr Sci 1993;85:221-228 115 Seebach D, Beck AK, Heckel A. TADDOLs, their derivatives, and taddol analogues: versatile chiral auxiliaries. Angew Chem Int Ed 2001;40:92-138 116 Toda F, Tanaka K, Leung CW, Meetsma A, Feringa BL. Preparation of optically active 5-alkoxyfuran-2(5H)-ones and 5-methoxy-dihydrofuran-2(3H)-one by chiral inclusion complexation. J Chem Soc Chem Comm 1994:2371-2372 117 Müller S. Studies on inclusion resolution: gaining insight into chemical and physical properties. PhD thesis, KUN Nijmegen, The Netherlands, 2003. 143 p. 118 Braibanti A, Dallavalle F, Mori G. Complexing capacity scales and ‘energy-rich’ bonds. J Inorg Biochem 1979;10:263-273 119 Thornton JD (editor). Science and practice of liquid-liquid extraction Vol 2. Oxford: Clarendon Press; 1992. 436 pp. 120 Kellogg RM, Nieuwenhuijzen JW, Pouwer K, Vries TR, Broxtermann QB, Grimbergen RFP, Kaptein B, La Crois RM, Wever E de, Zwaagstra K, Laan AC van der. Dutch Resolution: separation of enantiomers with families of resolving agents. A status report. Synthesis 2003;10:1626-1638 121 Busker E, Martens J, Steigerwald R, Weigel H. Optically active proline derivative, process for its production and use. 1984:US patent 4,469,875 122 Duchateau ALL, Hillemans MG, Hindrikx I. Enantiomeric separation of primary alkylamines; a comparison of direct and indirect HPLC methods. Enantiomer 1997; 2:61-67 123 Steensma M, Kuipers NJM, Haan AB de, Kwant G. Optimisation of process conditions for industrial separation of amino acid enantiomers by fractional reactive extraction. Proc. of International Solvent Extraction Conference ISEC 2002, Cape Town, South Africa, Mar. 17-21, 2002, 620-625. 124 Hirose K, Fuji J, Kamada K, Tobe Y, Naemura K. Temperature dependent inversion of enantiomer selectivity in the complexation of optically active azophenolic crown ethers containing alkyl substituents as chiral barriers with chiral amines. J Chem Soc Perkin Trans 2 1997:1649-1657 125 Naemura K, Wakebe T, Hirose K, Tobe Y. Preparation of homochiral phenolic crown ether having chiral subunits derived from (1R,2S)-cis-1,2,3,4-tetrahydronaphtalene-1,2-diol: temperature-dependent enantioselectivity in complexations with neutral amines. Tetrahedron: Asymmetry 1997a;8(15):2585-2595 126 Naemura K, Nishikawa Y, Fuji J, Hirose K, Tobe Y. Preparation of homochiral phenolic crown ethers containing para-substituted phenol moiety and chiral subunits derived from (S)-1-phenylethane-1,2-diol: their chiral recognition behaviour in complexation with neutral amines. Tetrahedron: Asymmetry 1997b;8(6):873-882

Extractant identification
76

Chapter 4
77
4 Influence of process parameters on extraction equilibria for
the chiral separation of amines and amino-alcohols with a chiral crown ether
4.1 Introduction In the previous chapter, the identification of enantioselective extractants for amines/amino-alcohols was discussed. The set of target enantiomers is given in figure 1. The most promising extractant identified in the screening procedure was the azophenolic crown ether1,2 presented in figure 2, dissolved in dichloromethane. It could be used to separate 5 out of 7 model enantiomers with enantioselectivities 1.35 - 5.0. The obtained distribution ratios were rather high already at low extractant excess. Because of the structural variations within the group of test enantiomers, the extractant system is expected to be selective for other enantiomers containing primary amine groups as well. Based on the fact that the enantioselectivity of many other chiral crown ethers was determined in extraction experiments, we expect that more chiral crown ethers can be successfully applied as enantioselective extractants in reactive extraction.
OH
NH2
*
NH2
OH
*
OH
NH2
*
NH2
CH3
OH
* *
(a) phenylglycinol (b) 2-amino-1-
phenylethanol (c) 2-aminobutanol (d) norephedrine
NH
CH3
CH3
OH
* *
NH2
*
NH2
*
(e) ephedrine (f) phenylethylamine (g) 2-aminopentane Figure 1: Structure of amino-alcohols and amines studied. * indicates a chiral centre

Single stage
78
O
O
O
O OOH
N N
O2N
NO2
Figure 2: Azophenolic crown ether1, the enantioselective extractant used in this study The second obstacle for introduction of FREX is the low process capacity that can be calculated based on the original research papers. This low volumetric productivity seems to be caused by the combination of high excess of chiral selector, very low enantiomer concentrations and by selection of equipment with slow mass transfer characteristics for the laboratory proof-of-principle. To increase the productivity, the required excess of extractant and the role of concentrations and other parameters should be studied, for instance with an equilibrium model of a single extraction stage; for selection and design of equipment, a multistage-stage model and information on the reaction kinetics is required. The final goal of the development procedure is a working extraction system containing the identified versatile enantioselective extractant, which can be used at the commercial production scale and that delivers each enantiomer at the desired purity despite the fact that the enantioselectivity of the crown ether is different for each pair of enantiomers. The aim of this chapter is to understand and model the behaviour of azophenolic crown ether extraction system in a single equilibrium stage. Firstly, solvent screening experiments will be carried out to identify an environmentally acceptable alternative for dichloromethane, the solvent that was used in all initial experiments. Secondly, the relation between the various process conditions and the capacity and selectivity of the extraction in one stage will be studied experimentally. Process parameters of interest are extractant concentration, extractant excess, temperature and pH. These parameters influence the extent of complexation and the partitioning, and thus the overall extent of extraction and the enantioselectivity. Along with the experimental work, a predictive equilibrium model of the extraction performance in one equilibrium stage will be constructed, based on the chemistry of the system, and validated. The purpose of the model is to improve understanding of the behaviour of the extraction system, to allow extractor modelling and conceptual process design and to study various options for improved productivity of the system. Finally, the recovery of enantiomers and extractant after extraction will be studied by back-extraction experiments and modelling.

Chapter 4
79
4.2 Model description The azophenolic crown ether is a new enantioselective extractant. Other reactive extraction systems in literature have been modelled successfully by solving equilibrium relations and mass balances simultaneously. Schlichting et al3 reported an equilibrium model for the reactive extraction of salicylic acid and phenylalanine with a secondary and quaternary amine extractant, respectively. The model takes into account acid-base dissociation of the solute in the aqueous phase, physical partitioning and the reaction between target acid and amine extractant in the organic phase. A similar model was reported for extraction of 6-aminopenicillanic acid with a tertiary amine by Bora et al.4 Both authors fitted their model parameters from extraction experiments. The only chiral separation by reactive extraction that was modelled in detail is the separation of DL-phenylalanine, DL-leucine and DL-valine with N-dodecyl-L-hydroxyproline (C12Hyp) Cu2+ complex in a water/octanol extraction system, reported by Koska & Haynes.5 This system functions by a ligand-exchange mechanism. For a good description, a large number of aqueous phase and two-phase complexation reactions had to be included in the model, which resulted in a large set of model equations. Koska & Haynes obtained most of the complexation constants from independent measurements and fitting the remaining complexation constants from extraction data. According to the literature, the azophenolic crown ether forms 1:1 adducts with amines and amino-alcohols in organic solutions. The complexation constants of the azophenolic crown ether with various amines and amino-alcohols in chloroform were reported.1 A scheme of this reaction and the other equilibria that play a role in the extraction system is represented in figure 3.
aq org
HR+ H+ + R R + C RCKRPpK
HS+ H+ + S S + C SCKSPpK
Figure 3: Scheme of equilibria in the reactive extraction system. R,S represent the two
enantiomers of the amino-alcohol or amine of interest; HS+, HR+: conjugated acid
(ammonium form) of this amino-alcohol or amine; C: enantioselective extractant i.e.
azophenolic crown ether; SC, RC: diastereomeric complexes of enantiomer and extractant.
Based on this scheme, the behaviour of the extraction system is modelled by combining the following equilibrium conditions and mass balances:

Single stage
80
• Acid-base equilibrium in the aqueous phase (neutral amine/ammonium); acid-base dissociation constant KA is the same for both enantiomers.
• Physical partitioning of the neutral form of the enantiomers between the phases, characterised by partitioning ratio P, which is also the same for both enantiomers.
• Reversible 1:1 complex formation1 between the crown ether and the neutral amine form of the enantiomers in the organic phase; characterised for the S enantiomer by complexation constant KS and for the R enantiomer by KR.
• Mass balances for each enantiomer and for the crown ether to complete the model.
• The resulting pH can be calculated by including an electroneutrality condition in the model. Alternatively, the pH at equilibrium can be used as input parameter.
The physical and chemical equilibria are defined as:
aq
org
R
RP
][
][= (1)
orgorg
orgR CR
RCK
][][
][
⋅= (2) and
aq
aqaqA HR
HRK
][
][][+
+⋅= (3)
The formulas are similar for the S-enantiomer. In these formulas, C is the crown ether, R is the uncharged enantiomer, HR+ is the ammonium form of the enantiomer and RC is the complex between R-enantiomer and crown ether; ‘org’ refers to the organic phase and ‘aq’ to the aqueous phase. The distribution ratios DR and DS are defined as:
P
KH
CK
HRR
RCR
R
RD
A
orgR
aqaq
orgorg
allformsaq
allformsorgR ⋅
+
⋅+=
++
== ++ ][1
][1
][][
][][
][
][
,
, (4)
P
KH
CK
HSS
SCS
S
SD
A
orgS
aqaq
orgorg
allformsaq
allformsorgS ⋅
+
⋅+=
++
== ++ ][1
][1
][][
][][
][
][
,
, (5)
The operational selectivity αop is defined as the ratio of distribution ratios. It can be deduced
from the above that (assuming KR > KS):
orgS
orgR
S
Rop CK
CK
D
D
][1
][1
⋅+⋅+
==α (6)
All concentrations in equations 1-6 are equilibrium concentrations, which have to be solved using the mass balances. It can be seen that the distribution ratios D are a strong function of the physical partitioning ratio P, the pH and other parameters of the system. The selectivity reaches an asymptotic value when the product of complexation constant and extractant concentration is large
enough. This asymptote is the ratio of the complexation constants, the intrinsic selectivity αint:

Chapter 4
81
S
R
K
K=intα (7)
The most important parameters in this model are the complexation constants for the complexation between crown ether and enantiomers (KR and KS), the physical partitioning ratio (P) and the acid dissociation constant of the amine (KA). All these parameters can be obtained from independent experiments or from literature. In this way, a predictive model can be constructed. For our model, KR, KS and P were determined experimentally by UV-titration and partitioning experiments, respectively. Acid dissociation constants were taken from the literature6,7,8 (table 1). Through equations 4-6, the model predictions can be compared with
the experimental results in extraction in terms of DR, DS and αop.
Table 1. Literature data for pKA. NR = not reported
substance temperature (°C) pKA ref.
2-amino-1-phenylethanol 20 9.0 6 phenylglycinol 20 8.5 7 norephedrine 20 9.4 6 ephedrine 20 9.5 6 2-aminobutanol NR 9.5 6
phenylethylamine 25 9.4 8 2-pentylamine NR 10.6 6

Single stage
82
4.3 Materials & Methods 4.3.1 Materials R- and S-phenylglycinol (99%), R- and S-phenylethylamine (98%) and R- and S-2-aminobutanol (97%) were obtained from Fluka (Buchs, Switzerland). (+)-norephedrine (98%), (-)-norephedrine (99%), (+)-ephedrine hemihydrate (98%, (-)-ephedrine (99%) and rac-2-amino-1-phenylethanol (98%) were obtained from Aldrich (Milwaukee, Wisconsin, USA). Rac-2-pentylamine (98%) was obtained from Lancaster (Eastgate, England). HCl (32%), NaOH pellets, dichloromethane, toluene, 1-octanol and n-hexane (all analytical grade) were obtained from Merck (Darmstadt, Germany). Methylisobutylketone (99.5%) was obtained from Acros (Geel, Belgium). The azophenolic crown ether was synthesised by Syncom BV (Groningen, The Netherlands), in a custom synthesis.1 Throughout the study, milliQ-filtered water was used (Millipore, Billerica, MA, USA).
4.3.2 Determination of complexation constants KR and KS Complexation constants between crown ether and enantiomers in a solvent are determined by UV-vis titration.9,10 The uncomplexed crown ether exhibits an absorption peak at 400 nm, whereas the complex between crown ether and amine or amino-alcohol shows a peak between 540 and 575 nm, depending on the nature of the amine and the solvent. For each titration experiment, a series of samples is prepared containing a constant concentration of crown ether, typically 0.02 mM, and a varying concentration of one enantiomer of the substance of interest in the solvent, typically between 0.04 and 15 mM. The UV-vis spectrometer is kept at the desired temperature with a Julabo F-25 thermostat bath. All samples are allowed to reach thermal and chemical equilibrium in the spectrometer before the spectrum is recorded. At least six data points were used for each determination; these points were chosen in such a way that they span the 20 % complexation to 80 % complexation range.10 Naemura et al1 report a 1:1 stoichiometry for complexation of the crown ether with various amines and amino-alcohols in organic solution. This stoichiometry was confirmed by the presence of the characteristic crossing point9 in the UV titration plots. Data treatment is done with the Scott plot;11 this is a straight-line method that gives reliable results if the excess of enantiomer is sufficient (to assume a constant enantiomer concentration) and if a wavelength can be found at which only the complex and the crown ether show absorption of light, and not the enantiomers. The majority of our data could be treated in this way. In a few cases, the K values were so high that a ‘too low’ enantiomer concentration had to be used to be able to span the 20-80% complexation range. As the excess of enantiomer was insufficient to allow the use of straight-line data treatment methods, the more versatile (but more elaborate) Rose-Drago method or a non-linear fitting method was used in these cases10. Based on the propagation of experimental error, the accuracy in the obtained K-value is estimated to be 10-20 %. The experimental method was validated by
measuring the complexation constant between phenolphtalein and β-cyclodextrin in 0.02 M

Chapter 4
83
Na2CO3 buffer at 25°C. The result was 2.3⋅104 M-1, which is consistent with values reported
in literature11,12,13,14: these values range from 2.0⋅104 M-1 to 2.9⋅104 M-1 for this buffer
composition (not all measurements were performed at isothermal conditions).
4.3.3 Partition and extraction experiments All partition and extraction experiments were carried out in jacketed 25 mL glass vessels connected to a Julabo F-32 thermostat bath to enable temperature control. In each experiment, 10 mL of aqueous phase containing the enantiomer as racemic mixture, typically at a concentration of 2 mM (rac), and dilute HCl or NaOH if the pH needed to be set, was mixed with 10 mL of organic solvent containing the chiral crown ether as extractant, typically at a concentration of 1-10 mM. To determine the (physical) partitioning ratio P, the experiment is carried out at higher pH (pH 11-12, NaOH) without crown ether present. In the ‘base case’ extraction experiment 2 mM crown ether and 2 mM rac-enantiomer is used, without addition of acid, base or buffer. After agitation for 2 hours, which was found to be sufficient to reach equilibrium, the phases were allowed to settle. Then, the pH of the aqueous phase was determined and a sample of the aqueous phase was taken for analysis by HPLC. The HPLC set-up consisted of a Varian 2510 pump, a Crownpak(+) chiral column (Daicel), a derivatisation coil and a Jasco FP-2020 plus fluorescence detector. Post-column derivatisation with phtalic dialdehyde / mercaptoethanol reagent was carried out according to Duchateau et
al.15 Fluorescence detection of the fluorescent derivative was performed at 325 nm excitation and 465 nm emission. From repeated analyses of the same sample, the error in the HPLC
concentration determination was found to be ± 3%.
In initial experiments, the mass balance was found to hold within the error of the HPLC determination. After that, the organic phase concentrations were calculated from the aqueous
phase concentrations. The distribution ratios (D) and operational selectivity (αop) are
calculated from these concentrations, so the error in the concentration propagates in the D and
αop values. For D values between 0.2 and 5, the resulting relative error is only slightly higher
than the error in the concentrations, 5 - 10%. If the concentration in one of the two phases is very low, the relative error in D easily rises to > 30%, therefore extreme D values (< 0.1 or > 10) must be judged with great care. As the operational selectivity is calculated from the ratio of D’s, a selectivity lower than about 1.1 cannot be determined accurately by single extraction experiments.
4.3.4 Experimental approach For the solvent screening experiments, extraction experiments were carried out as described above, with 2 mM rac-phenylglycinol and 4 mM crown ether dissolved in the solvent under study at 25 °C. After selection of the alternative solvent, the model parameters were obtained and ‘base case’ extraction experiments were carried out for all test enantiomers. To study the effects of pH, T and concentrations further, additional experiments were carried out with one or two of the test enantiomers.

Single stage
84
4.4 Results and discussion: model parameters In the initial solvent screening experiments that are discussed in the next paragraph, toluene was identified as most promising alternative for dichloromethane. Therefore, all relevant model parameters were obtained with toluene as solvent. For comparison, most of the data were obtained with dichloromethane as well. The influence of temperature, solvent and other process conditions on the model parameters is discussed.
4.4.1 Partitioning ratios In figure 4, the experimental partitioning ratio P is shown as a function of pH for phenylglycinol in dichloromethane. Similar plots were obtained for other solvent-amine (amino-alcohol) combinations. At low pH, the amino group is charged (ammonium form) and the partitioning to the organic phase is much lower than at high pH. The resulting partitioning ratio (Peff) can be described as a linear combination of contributions of the amine in neutral form (Pamine) and charged form (Pammonium):
eaeaammoammo PxPxP minminexp ⋅+⋅= (8)
The mole fractions x (xammo + xamine = 1) of amine and ammonium are governed by the pH of the system and the pKA of the amine. If the partitioning of the ammonium-form can be neglected (set to zero), the Henderson-Hasselbach equation3 for amines can be used to describe the resulting effective partitioning Peff as a function of pH:
)101
11(0 minminmin pKpHeaeaeaeffamm PPxPxPP −+
−⋅=⋅≡⋅=⇒= (9)
00.1
0.20.3
0.40.5
0.60.7
0 5 10
pH [-]
P [-
]
Figure 4: Influence of pH of aqueous phase on partitioning of phenylglycinol into
dichloromethane. [PG] = 2 mM, 25 °C. Solid line according to eq. 9 with P= 0.65 and pKA
=8.5.

Chapter 4
85
The partitioning ratio of the ammonium form Pammo is in general very low and will be considered as zero in this work. The value of Pamine can be measured at a pH value 2 units higher than pKA. In the remainder of this chapter, the model parameter ‘partitioning ratio P’ refers to the value of Pamine. It can be seen in table 2 that in general, the partitioning of the enantiomers is higher in CH2Cl2 than in toluene. Apparently the amines and amino-alcohols are solvated better in CH2Cl2. Comparison of the amines with the amino-alcohols shows that the presence of the hydroxyl group in the amino-alcohols increases the hydrophilicity of the substances, and thus reduces their partitioning to the organic phase. If the P could not be determined accurately because of the low value, it is denoted as P < x. Table 2: Partitioning ratios P for CH2Cl2 and toluene at two temperatures. [racemic mixture]
= 2 mM in all cases. pH set with dilute NaOH.
enantiomer solvent T [°C] P [-] at pH 11-12
2-amino-1-phenylethanol CH2Cl2 25 0.7-0.8 2-amino-1-phenylethanol toluene 25 < 0.1
2-aminobutanol CH2Cl2 25 < 0.1 2-aminobutanol toluene 5 < 0.05
2-pentylamine CH2Cl2 5 6.4 2-pentylamine CH2Cl2 25 6.7 2-pentylamine toluene 5 1.4
norephedrine toluene 5 <0.05 norephedrine CH2Cl2 5 norephedrine CH2Cl2 25 1.7
phenylethylamine CH2Cl2 5 > 10 phenylethylamine CH2Cl2 25 > 10 phenylethylamine toluene 5 5-6 phenylethylamine toluene 25 8-9
phenylglycinol CH2Cl2 25 0.6 phenylglycinol toluene 25 < 0.1
To study the influence of temperature and solute concentration on the partitioning ratio in more detail, additional partitioning data were collected for phenylethylamine (PEA). In figure 5a, the results for P at three different temperatures are given. In figure 5b, the variation of P with the PEA concentration at 5 °C is presented. It can be concluded that P increases with increasing temperature, and P also seems to increase slightly with increasing [PEA]. P is probably also temperature dependent for the other amines and amino-alcohols in this study, but accurate experimental determination is more difficult because of the low values of P, and was not attempted. From simulations, it has become clear that it is important to incorporate

Single stage
86
the temperature effect on P in the model. The concentration effect is less pronounced and it has less influence on the model results, so P will be considered as independent of amine/amino-alcohol concentration at a given temperature.
0
2
4
6
8
10
12
0 20 40
T [°C]
P [-
]
0
2
4
6
8
1.00E-06 1.00E-04 1.00E-02
[PEA], [M]
P [-
]
(a) (b) Figure 5: Physical partitioning ratio P of phenyletylamine (PEA) in toluene. (a) temperature
dependency; [PEA] = 2 mM. (b) concentration dependency; T = 5 °C.
4.4.2 Complexation constants A typical example of a UV/Vis titration experiment to determine a complexation constant is represented in figure 6. The colour change upon complexation can be seen clearly: the uncomplexed crown ether is orange-red (peak at 400 nm), and the enantiomer-crown ether complex is purple (peak at ~ 560 nm). The characteristic crossing point present at about 450 nm confirms that the stoichiometry of complexation is 1:1.9
00.10.20.30.40.50.60.70.8
300 400 500 600 700 800wavelength [nm]
abso
rptio
n [-
]
a
b
h
c
Figure 6: UV-vis titration experiment to the determine complexation constant between crown
ether extractant and S-2-aminobutanol in toluene at 25 °C; all samples: [CE] = 0.02 mM,
varying amount of S-2-aminobutanol : (a) 0 mM (b) 0.05 mM (c) 0.09 mM (d) 0.18 mM (e)
0.30 mM (f) 0.60 mM (g) 1.43 mM (h) 2.98 mM

Chapter 4
87
The other complexation constants were determined in the same way (table 3). Table 3: Complexation constants for azophenolic crown ether with amines and amino-alcohol
enantiomers, determined by UV-vis titration
enantiomer solvent T (°C) K1 [l mol-1] K2 [l mol-1] intrinsic selectivity
αint
strongest binding enantiomer
2-aminobutanol toluene 5 50.000 22.000 2.3 R toluene 25 9200 4000 2.3 R
ephedrine CH2Cl2 5 350 300 1.2 (+)
norephedrine CH2Cl2 5 60.000 33.000 1.8 (+) CH2Cl2 25 9000 5000 1.8 (+) toluene 5 37.000 29.000 1.3 (+) toluene 25 6000 4400 1.4 (+)
phenylethylamine CHCl3 25 2390 764 3.1 S toluene 5 6000 1850 3.2 S toluene 25 900 330 2.7 S toluene 35 375 180 2.1 S
phenylglycinol CH2Cl2 5 150.0001 15.000 10 R CH2Cl2 25 15.000 1500 10 R CHCl3 25 17.400 1410 12 R toluene 5 80.0001 8200 10 R toluene 25 12.000 1200 10 R 1 value is minimum value; experimental method does not permit more accurate determination.
It can be seen in table 3 that the chemical structure of the amine or amino-alcohol has a large influence on the selectivity of the separation. The compounds that bear the chiral centre next to the amine moiety (2-aminobutanol, phenylethylamine and phenylglycinol) are complexed with higher selectivity than the compounds in which the chiral centre is located next to the alcohol moiety (norephedrine, ephedrine). This may be explained by the primary interaction between crown ether and amine: the inclusion of the amine group in the crown ether ring. Secondly, the presence of at least one more functional group next to the amine group seems to be required for chiral recognition, such as a hydroxyl group or a phenyl group. Finally, ephedrine forms a much weaker complex with the crown ether than norephedrine, probably because ephedrine is a secondary amine which does not ‘fit’ very well in the crown ether ring. It is also clear from table 3 that the solvent has a large influence on the complexation constants and on the intrinsic selectivity. Solvent molecules play an important role in the complexation process, for instance by desolvation of the enantiomers and extractant, solvation of the complex and possibly by acting as a ligand. However, the exact role of the solvent in enantioselective complexation is poorly understood.

Single stage
88
The strong influence of temperature on the complexation constants of this extractant that can be observed in table 3 has also been reported in the literature on this crown ether in CHCl3.
1 The temperature dependency of the complexation constants arises from the enthalpy of complexation. For all crown ether-enantiomer combinations tested here, the complexation constant decreases with increasing temperature, which indicates an exothermic reaction. If
equilibrium values for at least two temperatures are known, the thermodynamic quantities ∆H
and ∆S of complexation can be calculated with the Van ‘t Hoff equation:16
SR
HRT
K ∆+∆−= 11)ln( (10)
In this way, the thermodynamic quantities ∆H and ∆S can be obtained, and complexation constants at intermediate temperatures can be estimated by interpolation. The Van ‘t Hoff plot for phenylethylamine is shown in figure 7, with experimental data for toluene and literature
data for CHCl3. Calculated thermodynamic quantities ∆H and ∆S are reported in table 4.
4
5
6
7
8
9
0.0031 0.0033 0.0035 0.0037
1/T [1/K]
ln(K
)
Figure 7: Van ‘t Hoff plot for complexation constants between crown ether and
phenylethylamine in two solvents. Toluene data (open symbols) from table 3. Chloroform data
(closed symbols) from reference 10; triangles: S-enantiomer, squares: R-enantiomer.
Table 4: Thermodynamic quantities for complexation of crown ether with model enantiomers,
derived from Van ‘t Hoff plot (figure 7). ‘strong’ refers to compound that complexes more
strongly with CE; ∆∆H and ∆∆S as ‘strong’ minus ‘weak’.
substance solvent ∆H
(strong) kJ/mol
∆H
(weak) kJ/mol
∆∆H
kJ/mol
∆S
(strong) J/mol/K
∆S
(weak) J/mol/K
∆∆S
J/mol/K
PEA CHCl3 -71.7 -60.5 -11.2 -177.3 -149.1 -28.2 PEA toluene -65.8 -56.0 -9.8 -164.2 -139.1 -25.1 Noreph. toluene -62.6 -64.9 2.7 -137.9 -148.2 10.3 PG toluene -66.2 -66.2 0 -144.0 -163.1 19.1

Chapter 4
89
It is clear from table 4 that the differences between the R and S enantiomer in enthalpy (∆∆H)
and entropy (∆∆S) of complexation with the crown ether are rather small, but this small effect
is responsible for the observed enantioselectivity. As can be seen in table 3 and 4, with an increase in temperature the enantioselectivity may decrease (i.e. PEA/toluene), increase (norephedrine/toluene) or remain the same (phenylglycinol/ toluene). This behaviour is
reflected in the sign and the value of ∆∆H. The entropy effect ∆∆S is important for all
combinations. Naemura et al reported similar effects for complexation of related crown ether dissolved in chloroform. In general, intrinsic enantioselectivity in reactive extraction is
determined by the difference in Gibbs free energy (∆∆G) of complexation between the
enantiomers. The order of magnitude for the required ∆∆G for separation in reactive
extraction is only 1-6 kJ/mol, which corresponds with an intrinsic selectivity range of 1.5 to 11.
4.5 Results and discussion: extraction 4.5.1 Influence of solvent To identify an alternative solvent for CH2Cl2, preliminary screening experiments with several solvents were carried out for separation of phenylglycinol. The screening results can be summarised as follows:
• With toluene as solvent, the enantioselectivity and distribution ratios are rather similar, or slighly lower than in dichloromethane.
• Extraction with methylisobutylketone (MIBK) is selective at 25 °C, but the obtained enantioselectivity is lower than with toluene.
• Extraction with 1–octanol as solvent is also effective; the enantioselectivity is again lower
than with toluene, but still considerably high (αop ~ 4.2, for 4 mM of crown ether and 2
mM of phenylglycinol at 5 °C). The high viscosity of octanol and the associated slow phase settling is a drawback of this solvent.
• The crown ether cannot be dissolved well in hexane, and the crown ether/amine complex is even less soluble and precipitates. Hexane can therefore not be used as extraction solvent.
The solvent has a clear influence on the enantioselectivity. It takes an active part in the complexation process by solvation/desolvation of the constituents and the complex, and possibly by acting as a ligand. It may be that the more polar solvents (MIBK and 1-octanol) form hydrogen bonds and thus disturb the intermolecular forces that are responsible for the selective complexation between crown ether and phenylglycinol.

Single stage
90
Based on this screening, toluene was selected as alternative to dichloromethane. For comparison, both solvents were studied in more detail. In table 5, the results of ‘base case’ extraction experiments are reported. Table 5: Base case extraction experiments; [racemic mixture] = 2 mM, no pH buffers. nd =
not determined because of too low distribution ratios.
enantiomer solvent T pHeq [CE]ini mM
D1 [-] D2 [-] αop [-]
phenylglycinol CH2Cl2 25 ~ 9 2 0.8 3.9 4.9 phenylglycinol toluene 5 9.3 2 0.3 2.74 9.1 phenylglycinol toluene 25 9.2 2 0.2 1.14 5.7
2-amino-1-phenylethanol CH2Cl2 5 10 2 5.6 4.2 1.35 2-amino-1-phenylethanol toluene 5 10 2 1.1 0.7 1.5 2-amino-1-phenylethanol toluene 25 9.8 2 0.51 0.35 1.5
norephedrine CH2Cl2 5 8.7 2 2.6 4.5 1.7 norephedrine toluene 5 ~9 2 1.1 1.6 1.45
2-aminobutanol CH2Cl2 5 9.9 2 0.6 1.9 3.2 2-aminobutanol toluene 5 10.9 2 < 0.1 <0.1 nd 2-aminobutanol toluene 25 ~ 10 4 0.12 0.19 1.6
phenylethylamine CH2Cl2 5 9.2 2 20.4 9.9 2.1 phenylethylamine CH2Cl2 25 8.3 2 14.2 9.8 1.5 phenylethylamine toluene 5 9.7 1.5 7.5 4.0 1.9 phenylethylamine toluene 25 9.1 1.9 5.9 4.1 1.45
2-aminopentane CH2Cl2 5 9.9 1.9 6.2 6.0 1 2-aminopentane toluene 5 10.8 1.9 3.0 3.0 1
It was already observed in table 2 and 3 that for most compounds both P and most complexation constants are lower in toluene than in dichloromethane. The intrinsic selectivity is for some of the components lower in toluene than in CH2Cl2. This solvent influence on the parameters is reflected in the extraction results (table 5). For all enantiomers, the distribution ratios (D’s) are lower in toluene. For norephedrine and 2-aminobutanol, the operational selectivity is lower in toluene, whereas the selectivity seems slightly higher in toluene for 2-amino-1-phenylethanol. For application of toluene instead of dichloromethane as extraction solvent, a loss in operational selectivity seems to be the largest problem. However, it can be seen that the operational selectivity in toluene is still quite good for most of the test enantiomers, and for separation of 2-amino-1-phenylethanol, toluene is even a better solvent. Furthermore, the distribution ratios are lower in toluene. This is not necessarily disadvantageous in fractional extraction:17 lower distribution ratios lead to higher solvent flow rates but a lower wash flow rate. Furthermore, the distribution ratios in toluene are not extremely low for most

Chapter 4
91
enantiomers, and it is not expected that the operation will be unfeasible. An exception is the separation of 2-aminobutanol. For this substance, the physical partitioning in toluene is so low that the resulting distribution ratios are too low for accurate determination of selectivity, despite the high complexation constants and intrinsic selectivity (see table 3). We expect these D’s to be too low for industrial application as well: a very large extractor would be required. This problem may be less pronounced if the extraction process is carried out at higher concentrations, but the 2-aminobutanol separation is much easier in CH2Cl2. A similar large influence of the solvent on the extent of extraction has been reported for other reactive extractions by other authors, for instance for the reactive extraction of acetic acid with TOPO described by Ricker et al.18 However, it is not clear from this paper if the effect is mainly caused by a difference in physical partitioning or in the complexation constant.
4.5.2 Influence of extractant concentration The influence of crown ether concentration on the extraction performance has been studied in toluene for two enantiomers, phenylglycinol and phenylethylamine. No buffer salts were
used. In figure 8a and b, the observed distribution ratios D and the operational selectivity αop
are given for phenylglycinol separation at 25 °C. The model predictions have been presented as solid lines. In figure 9a and b, similar graphs are presented for separation of phenylethylamine at 5 °C in toluene.
0
2
4
6
8
0 5 10 15
[CE], mM
D [-
]
0
2
4
6
8
10
0 5 10 15
[CE], mM
αo
p [-
]
(a) (b)
Figure 8: Influence of extractant concentration on extraction of phenylglycinol. [PG] = 2
mM, T = 25°C, solvent: toluene. pH not set, resulting pH 9.0-9.8. Solid lines: model
predictions. (a) distribution ratios; triangles: S-enantiomer, squares: R-enantiomer (b)
operational selectivity

Single stage
92
0
5
10
15
20
25
30
0 5 10[CE], mM
D [-
]
0
0.5
1
1.5
2
2.5
3
3.5
0 5 10[CE], mM
αo
p [-
]
(a) (b)
Figure 9: Influence of extractant concentration on extraction of phenylethylamine, [PEA] = 2
mM, T = 5°C, solvent: toluene. pH not set, resulting pH 9.2-9.9. Lines: model predictions. (a)
distribution ratios, triangles/solid line: S-enantiomer, squares/dotted line: R-enantiomer (b)
operational selectivity
It can be seen that a very good operational selectivity is reached for both enantiomers with a relatively low extractant concentration (~ 4 mM) and low extractant excess ([CE]/[rac] ~2-3). The operational selectivity is predicted quite well by the model. This can be explained from
equation (6): αop is strongly influenced by the value of K’s and the concentration of
extractant, and it is only slightly influenced by the partitioning ratio and the acid dissociation constant; therefore small changes in pH or uncertainties in P or pKA do not have much influence on the predicted operational selectivity. For both enantiomers, the operational selectivity reaches a plateau value if the extractant concentration is sufficient: the intrinsic
selectivity αint. At this plateau, the condition holds that K⋅[CE] >> 1 (equation 6 and 7). If the
extractant is present in excess, the minimum concentration of extractant to approach the
intrinsic selectivity can be estimated from the condition: K⋅([CE]ini-[rac]ini) >10.
For both enantiomers, the distribution ratios increase steadily with increasing extractant concentration. It can be seen that the correct trend is described by the model, but the prediction of the absolute value of D is too high, especially for PEA. For phenylglycinol, it is difficult to obtain experimentally a correct value for P, because P is quite low. In case of a very low P value, it may be better to fit the correct value of P from the experimental extraction data instead of measuring it directly. For phenylethylamine, the deviation of the model prediction from the experimental results seems to be caused mostly by a different effect: the predicted pH was always larger than the experimental pH. The exact value of pH strongly influences the resulting D, as may be clear from figure 3 and equation 4 and 5. With the predicted pH, the distribution ratio is overestimated 2-4 times. To show the large influence of the pH, model predictions were generated by assuming that different amounts of acid were

Chapter 4
93
present in the solution. It was found that a value of 0.15 mM acid results in a correct description of the distribution ratios (figure 10, dashed line), and that with this acid concentration, the equilibrium pH values generated by the model are also close to the experimentally observed values. Thus, this small addition of acid would be a good explanation for the experimental distribution ratios being lower than the model predictions. Likewise, it was calculated for phenylglycinol that assumption of a small amount of acid (0.1 mM) results in a better prediction of the pH at equilibrium. In this case the pH is still substantially above pK and therefore the influence of the pH shift on the distribution coefficients is not so high.
0
10
20
30
40
50
0 5
[CE] mM
D [-
]
Figure 10: Model prediction of influence of presence of acid on distribution of S-PEA as a
function of [CE]. Total [PEA]=2 mM. Trend is the same for R-enantiomer. Solid line: no acid
present (=same as figure 9a); dashed line: 0.15 mM acid present.
To provide an explanation for the origin of acid, one portion of a solution of 2 mM phenylethylamine was stirred for two hours under argon atmosphere, while another portion of the same solution was stirred while in contact with air. The resulting pH of the ‘open’ vessel was about 0.4 pH units lower than the one stirred under argon. This strongly suggests that uptake of CO2 from air is responsible for the observed lower pH values. As phenylethylamine is a stronger base than phenylglycinol, the CO2 uptake and the associated pH decrease and deviation from the model prediction is also the strongest with this enantiomer. For correct model predictions for phenylethylamine, the CO2 uptake should be quantified and included in the model, or CO2 uptake should be prevented by carrying out the experiments in an inert atmosphere. As for the above result, uptake of 0.15 mM CO2 by a 2 mM amine solution ( ~ 7.5% by stoichiometry) during preparation of the solutions seems a realistic value.
4.5.3 Influence of temperature As can be seen in table 3, the temperature has a strong influence on the absolute values of the complexation constants, and in some cases also on the ratio of complexation constants (intrinsic selectivity). Secondly, it has been found that the partitioning ratio P is also strongly

Single stage
94
temperature dependent (figure 5a). The temperature effect on these parameters is clearly reflected in the extraction results. In figure 11, experimental and model results for the separation of PEA at 5 °C and 25 °C have been presented. It can be concluded for the distribution ratios (figure 11a) that the effects of temperature on P and complexation strength counteract, and the overall effect is small. This effect is qualitatively predicted by the model, but because of the large effect of CO2 uptake on the model results, the prediction was not included in the figure. For the operational selectivity, two effects can be distinguished clearly. The complexation constants are larger at 5 °C than at 25 °C, so the operational selectivity approaches the intrinsic selectivity already at lower extractant excess; and the intrinsic selectivity is higher at 5 °C than at 25 °C, so a larger operational selectivity is reached overall.
0
2
4
6
8
10
12
0 2 4[CE], mM
D [-
]
1
1.5
2
2.5
3
3.5
0 5 10 15 20
[CE], mM
αo
p [-
]
25 °C
5 °C
(a) (b)
Figure 11: Influence of temperature on (a) distribution ratio and (b) operational selectivity,
for phenylethylamine extraction, [PEA] = 2 mM, toluene. In (a), open symbols 25 °C and
closed symbols 5 °C, triangles S-enantiomer, squares R-enantiomer. Solid lines in (b) are
model predictions.
4.5.4 Influence of pH The model predicts that the pH has a strong influence on the extent of extraction, the distribution ratio, and a small influence on the operational selectivity (equations 4, 5 and 6). This is caused by a shift in the equilibria: at lower pH, most of the enantiomer is present in the ammonium form, not much free amine is available for transport to the organic phase and subsequent complexation, so the resulting distribution ratios are low. If the pH rises, more enantiomer is present as free amine and more complex can formed; the resulting distribution ratios are higher. Because of the higher loading of the extractant, the operational selectivity decreases slightly. To demonstrate these predictions, experiments were carried out with phenylethylamine and phenylglycinol, using toluene as solvent. For phenylglycinol, the physical partitioning P is so low that the resulting D’s approach zero as soon as the pH is lower than 7.5 (figure 12). The solid line in the plot is an independent model prediction, with

Chapter 4
95
the pH at equilibrium as input parameter. It can be seen that the model predicts the behaviour of the system very well. Because of the low values for D, no reliable value for selectivity at lower pH can be given.
0
0.5
1
1.5
2
2.5
6.5 7.5 8.5 9.5
pH [-]
D [-
]
Figure 12: Influence of pH on distribution ratio of PG, [PG] = 2 mM, [CE]= 3 mM, solvent:
toluene, 25 °C, pH set with phosphate buffer, triangles S-enantiomer, squares R-enantiomer
For phenylethylamine, similar experimental and model results were obtained: the distribution ratios also drop sharply with a decrease in pH. A second effect was also observed: if some acid is already present in the system, the relationship between D and [CE] changes: the D’s no longer rise with [CE] (as in figure 8a and 9a), but the curve flattens off or D even decreases with [CE]. For PEA, experimental data were obtained with 0.8 mM acid and 1.2 mM acid, all with [PEA]ini = 2 mM. The model results and experimental results are given in figure 13.
0
0.5
1
1.5
2
2.5
3
0 5 10
[CE], mM
D [-
]
0
0.5
1
1.5
2
2.5
3
3.5
0 5 10
[CE], mM
αo
p [-
]
(a) (b)
Figure 13: Effect of addition of acid (pH decrease) on the extraction of PEA with CE in
toluene. [PEA] = 2 mM, [HCl] = 0.8 mM (open symbols) or 1.2 mM (closed symbols);
resulting pH 7.5-8.5, T = 5 °C; (a) distribution ratios; triangles S-enantiomer, squares R-
enantiomer (b) operational selectivity.

Single stage
96
It can be seen that the experimental trends in figure 13 are described well by the model. An explanation for this effect may be that the pH drops when some amine or amino-alcohol is extracted to the organic phase, and the more additional acid is present in the system, the sharper the pH decreases. As the extent of extraction also decreases with decreasing pH, a higher [CE] does not result in higher distribution ratios under these circumstances. It is noteworthy that the predictions for the distribution ratios of PEA in figure 13 are much better than in figure 9a. The presence of the additional acid now dominates the resulting pH in the system.
4.5.5 Extractant and enantiomer recovery by back-extraction After the chiral separation in the fractional extractor, the enantiomeric product has to be recovered from the loaded organic solution. Back-extraction is a logical operation for this recovery. In the back-extraction unit, the loaded organic phase is treated with an aqueous wash stream of specified temperature and pH. The cleaned organic phase containing the extractant is then recycled to the fractional extractor for re-use. A decrease in distribution ratio D for both enantiomers may be effected by a temperature increase, a pH decrease or a combination: a temperature rise results in a weaker reaction, and a pH decrease results in lower availability of uncharged amine for complexation. Both back-extraction options, temperature increase and pH decrease, were evaluated experimentally and by model predictions for phenylethylamine and phenylglycinol. Back-extraction of phenylethylamine and of phenylglycinol by decreasing the pH of the system was successful. If the pH decreases, the distribution ratios decrease as well, as already shown in figure 12 and 13. If pH < 6, the distribution ratios approach zero such that PEA or PG is completely back-extracted to the aqueous phase. The mass balance closed within the measurement error of the HPLC analysis. It is possible to concentrate the product stream compared to the feed stream: because of the very low D, all enantiomer can be extracted from the loaded organic phase with a small volume of aqueous wash stream. The required pH decrease can be effected by addition of dilute acid to the aqueous phase, but salts are produced when the pH is brought back to the original value, so this method is not favoured. A more environmentally friendly method to lower the pH is to dissolve carbon dioxide in the aqueous phase,19 because the CO2 can be removed easily by decreasing the CO2 partial pressure. According to preliminary calculations, a relatively low partial pressure of CO2 (~ 0.2 bar) is sufficient to reduce the pH in a 2 mM PEA solution to 6. This back-extraction concept was demonstrated to work on labscale by contacting a PEA-loaded CE/toluene solution with water in presence of CO2. Decomplexation was observed visually from the clear and rapid colour change of the organic layer from deep purple (loaded) to orange (not loaded).

Chapter 4
97
Attempts to back-extract phenylethylamine by a temperature increase failed. A temperature increase results in a weaker reaction, as expected, but also in a larger physical partitioning ratio P, and these effects partly cancel out. The resulting distribution ratio is still quite high (figure 14a).
0
5
10
15
20
25
0 20 40
T [°C]
D [-
]
0
1
2
3
4
0 20 40T [°C]
D [-
]
(a) (b)
Figure 14: Distribution ratios for back-extraction by temperature shift. Both charts: back-
extraction with clean milliQ-filtered water, equal volumes aqueous phase/toluene phase,
triangles: S-enantiomer, squares: R-enantiomer. (a) Phenylethylamine. Loading conditions: 5
°C, [PEA] = 2 mM, [CE]= 3 mM. Triangles/solid line: S-enantiomer, squares/dotted line: R-
enantiomer (b) Phenylglycinol. Loading conditions: 5 °C, [PG] = 2 mM, [CE]=3 mM.
Triangles S-enantiomer, squares R-enantiomer. Solid lines: model prediction with P=0.05 (5
°C), P=0.08 (25 °C), P=0.15 (45 °).
Back-extraction of phenylglycinol, which has a much lower physical partitioning ratio than phenylethylamine, could be carried out successfully by a temperature increase. After extraction, portions of the loaded organic phase were contacted with a clean water phase at three different temperatures. In figure 14b, the resulting distribution ratios for back-extraction are reported. It can be seen that the S-enantiomer is already recovered well from the organic phase at a lower temperature than the R-enantiomer; for the R-enantiomer a larger temperature is required to lower the complexation constant sufficiently. For the model fit, it was assumed that the physical partitioning ratio P increases with T, similar to the temperature dependence of P for PEA (figure 5b). It is clear that the temperature dependence of the physical partitioning ratio should be incorporated in the model. The equilibrium model can be used to describe the back-extraction process, but for a good accuracy of the distribution ratio predictions, the temperature dependence of P should be included in the model. From the experimental data and the model predictions, it can be concluded that a pH decrease is a very effective way to back-extract amines and amino-alcohols from a loaded organic phase. Dissolution of CO2 in the system is an effective and

Single stage
98
‘green’ way to reduce the pH. For a system with a low physical partitioning ratio P, a temperature shift is also suitable. If a sufficiently large shift in distribution ratio is applied, the product stream is concentrated instead of diluted, compared to the feed composition. The extractant was recovered successfully as well. After back-extraction with dilute acid, the organic phase was washed at least four times with clean water to remove traces of acid, whereafter the toluene was evaporated, and the extractant was used again for extraction. The performance of the regenerated extractant was the same as of ‘fresh’ extractant. The extractant could be loaded and recovered several times without loss of activity.
4.6 Direction for optimisation In the previous paragraphs, it has become clear that both the distribution ratios and operational selectivity can be influenced considerably by adapting the process conditions. From initial calculations with a simple model based on the Kremser equation20, it is clear that the operational selectivity in one stage is the most important factor in determination of the required number of stages, and that variations in distribution ratios can be compensated (up to certain limits) by adjusting the flow rate ratios. Therefore, the approach seems justified to realise an operational selectivity in one extraction stage close to the intrinsic selectivity by adjusting the process conditions, to adapt the distribution ratios as far as possible and to correct non-optimal distribution ratios with changes in the solvent-to-feed ratio (S/F) and the wash-to-solvent ratio (W/S). The role of distribution ratios and flow rates in a fractional extractor will be the subject of chapter 6. In table 6, it can be seen that for all components except 2-aminopentane a minimum selectivity of 1.5 could be obtained with toluene as solvent. Table 6: Highest enantioselectivies measured in this study; [racemic mixture] = 2 mM, no pH
buffers, solvent: toluene
Component T (°C) [CE]ini mM
D1 [-] D2 [-] αop [-]
phenylglycinol 25 5 3.0 0.32 9.4 2-aminobutanol 25 4 0.12 0.19 1.6 norephedrine 5 4 2.0 3.0 1.5 2-amino-1-phenylethanol 5 2 1.1 0.7 1.5 phenylethylamine 5 7.7 2.7 0.84 3.2 2-aminopentane 5 1.9 3.0 3.0 1
4.7 Conclusion The azophenolic crown ether is a versatile and highly enantioselective extractant for chiral separation of amino-alcohols and amines by reactive extraction. The process capacity is good. The influence of process parameters such as temperature, pH and concentrations has been

Chapter 4
99
studied in detail, and these parameters can be used to tune the performance of the extraction system. Toluene and dichloromethane are both suitable solvents. Toluene is preferred to dichloromethane because it is more environmentally acceptable, although the process capacity and versatility is somewhat better in dichloromethane. Recovery of both enantiomeric products and the extractant has been carried out successfully by back-extraction involving a pH decrease with low-pressure CO2 or a temperature increase. The extractant could be re-used for chiral separation without loss of activity or selectivity. The model description based on solving the physical and chemical equilibria in the system is very suitable to understand the system’s responses to changes in process conditions. The quantitative description of the operational selectivity is very good, the description of the process capacity is reasonably good if uptake of CO2 from air is included. The equilibrium model can be used for conceptual design.
References 1 Naemura K, Nishioka K, Ogasahara K, Nishikawa Y, Hirose K, Tobe Y. Preparation and temperature-dependent enantioselectivities of homochiral phenolic crown ethers having aryl chiral barriers: thermodynamic parameters for enantioselective complexation with chiral amines. Tetrahedron: Asymmetry 1998;9:563-574 2 Hirose K, Ogasahara K, Nishioka K, Tobe Y, Naemura K. Enantioselective complexation of phenolic crown ethers with chiral aminoethanol derivatives: effects of substituents of aromatic rings of hosts and guests on complexation. J Chem Soc Perkin Trans II 2000:1984-1993 3 Schlichting E, Halwachs W, Schügerl K. Reactive extraction of salicylic acid and D,L phenylalanine in a stirred cell. Chem Eng Comm 1987;51:193-205 4 Bora MM, Ghosh AC, Dutta NN, Mathur RK. Reactive extraction of 6-aminopenicillanic acid with Aliquat-336: equilibrium and kinetics. Can J Chem Eng 1997;75:520-526 5 Koska J, Haynes CA. Modelling multiple chemical equilibria in chiral partition systems. Chem Eng Sci 2001;56:5853-5864 6 Perrin DD. Dissociation constants of organic bases in aqueous solution. London:Butterworths;1965 7 Hein F, Meier F. Zur Kenntnis der isomeren C-phenyl-äthanolamine und ihrer N,N-diäthyl-Derivate. Z Anorg Allg Chemie 1970;376:296-298 8 Bardinet. Comptes rendus hebdomadaires des seances de l’Academie des Sciences 1948;226:490 (reference from Beilstein database) 9 Schneider H-J, Yatsimirsky A. Principles and methods in supramolecular chemistry. Chichester:John Wiley and Sons;2000 p. 137-226. 10 Hirose K. A practical guide for the determination of binding constants. J Incl Phen Macroc Chem 2001;39:193-209 11 Zarzycki PK, Lamparczyk H. The equilibrium constant of b-cyclodextrin-phenolphtalein complex; influence of temperature and tetrahydrofuran addition. J Pharm Biomed Anal 1998;18:165-170 12 Georgiou ME, Georgiou CA, Koupparis MA. Flow Injection Gradient Technique in Spectrophotometric Determination of Formation Constants of Micromolecule-Cyclodextrin Complexes. Anal Chem 1995;67:114-123

Single stage
100
13 Buvari A, Barcza L, Kajtar M. Complex formation of phenolphthalein and some related compounds with b-cyclodextrin. J Chem Soc Perkin Trans II 1988;9:1687-1690 14 Rao CT, Lindberg B, Lindberg J, Pitha J. Substitution in b-cyclodextrin directed by basicity: preparation of 2-O- and 6-O-[(R)- and (S)-2-hydroxypropyl] derivatives. J Org Chem 1991;56:1327-1329 15 Duchateau ALL, Hillemans MG, Hindrikx I. Enantiomeric separation of primary alkylamines; a comparison of direct and indirect HPLC methods. Enantiomer 1997;2:61-67 16 Atkins PW. Physical Chemistry. 5th edition. Oxford:Oxford University Press;1994 17 Robbins LA. Liquid-liquid extraction. In: Schweitzer PA, editor. Handbook of separation technology for chemical engineers, 3rd edition. McGraw-Hill;1997 p. 1-419/1-447. 18 Ricker NL, Michaels JN, King CJ. Solvent properties of organic bases for extraction of acetic acid from water. J Separ Proc Technol 1979;1(1):36-41 19 Kuzmanovic B. Reactive extraction of oxygenates with aqueous salt solutions. PhD Thesis, University of Twente, Enschede, The Netherlands;2003 20 Steensma M, Kuipers NJM, Haan AB de, Kwant G. Optimisation of process conditions for industrial separation of amino acid enantiomers by fractional reactive extraction. Proc. of International Solvent Extraction Conference ISEC 2002, Cape Town, South Africa, 2002;620-625

Chapter 5
101
5 Determination of reaction kinetics in reactive extraction for chiral separation of amino acids and amino-alcohols
5.1 Introduction Two different enantioselective extractants systems were studied in more detail in the previous chapters. For chiral separation of amines and amino-alcohols, an azophenolic crown ether was identified as versatile extractant system. The equilibrium extraction performance was studied experimentally and modelled in chapter 4. A scheme of the reactions is given in figure 1a. Secondly, the Cu(II) complex of N-dodecyl-L-hydroxyproline is a versatile extractant for chiral separation of amino acids. The equilibrium separation of leucine using water/butanol was studied in detail in chapter 2; the main reactions are presented in figure 1b.
aq org
HR+ H+ + R R + C RCKRPpK
HS+ H+ + S S + C SCKSPpK
(a)
aq
HD HD + CuLi2 DCuLi +HLi
HL HL + CuLi2 LCuLi +HLi
org
P
P KL
KD
Cu2+
CuLi2
2 HLi2 H+
KCu
(b)
Figure 1: (a) Scheme of physical and chemical equilibria in separation of RS-amine or
amino-alcohol with chiral crown ether. HR+, HS+: ammonium form of enantiomers; C: crown
ether extractant; RC, SC: complexes between crown ether and neutral amine; P; partitioning
ratio. (b) main equilibria in separation of DL-leucine. Top part: formation of Cu2+-ligand
complex ‘CuLi2’; bottom part: ligand exchange of ligand ‘HLi’ for neutral enantiomer ‘HD’
and ‘HL’ with proton (H+) transfer. HLi = N-dodecyl-L-hydroxyproline ligand; DCuLi,
LCuLi: ternary complexes.
In both systems, the equilibrium selectivity and capacity are quite good, but for an economically feasible process, the rate of extraction has to be sufficiently large as well. The reaction kinetics and the mass transfer rate may both be rate-determining in a reactive extraction system, and if so, they need to be known separately. The ‘true’ complexation kinetics are also required for selection and design of process equipment and for a reliable scale-up: a reaction rate that was not limiting in certain bench-scale equipment may become limiting in large-scale equipment with faster mass transfer characteristics. Therefore, knowledge of the ‘true’ reaction kinetics is important.

Reaction kinetics
102
5.1.1 Models for extraction kinetics in reactive extraction Measuring ‘true’ kinetics in a reactive two-phase system is not trivial. The interpretation of overall extraction rate data in a certain contactor depends strongly on the model that is used to describe mass transfer and reaction kinetics in the system. Basically two fundamentally different model approaches are reported in the literature on reactive extraction: the interfacial reaction model and the homogeneous reaction model. The interfacial reaction model is used for systems in which each of the reactants is completely insoluble in the other liquid phase. As a result, the location of the chemical reaction is restricted to the interface between the phases. Mass transfer and chemical reaction are described as serial processes: the reactants are transported to the interface, are adsorbed, the reaction takes place at the interface, the products desorb and are transported into the bulk (figure 2a). This model is widely applied for reactive metal extraction processes1,2 and also for extraction of acids like citric acid1,3 and penicillin G.4,5 The reaction rate expressions are typically based on mechanistic considerations. Sometimes the adsorption isotherms are integrated; the resulting rate laws are complex expressions with non-integer reaction orders.
AACC
AC
(a)
A
AC
A + C
(b) Figure 2: schematic representation of different two-phase reactive extraction systems;
compound A is extracted by extractant C. (a) interfacial reaction (b) homogeneous reaction in
film and/or bulk
On the other hand, the homogeneous reaction model defined for two-phase reactors (‘fluid-fluid’ systems, GL or LL) assumes a finite physical solubility of at least one of the reactants in both fluid phases. As a result, the reaction is not located at the interface, but takes place in the film or bulk of one or both of the fluid phases, depending on the relative rates of these processes. Mass transfer and reaction are simultaneous, parallel processes (figure 2b). Preferential adsorption of reagents or products at the interface or the possibility of interfacial reactions is generally not considered. This type of model has been studied extensively for the gas-liquid case, especially for reactive gas absorption.6,7,8 Although it has not been widely applied to reactive extraction, the extraction of phenyl acetic acid9 and lactic acid from water by alamine 336 in octanol or decanol10,11 was studied with this model approach. The reaction rate expressions are typically based on the law of mass action, with integers for the reaction orders.

Chapter 5
103
In fact, the literature on reaction kinetics in reactive extraction systems is not comprehensive. The differences between the two model approaches are not recognised and users of one model do not seem to consider the other approach. This may be caused partly by a difference in background; chemists have a tendency to focus on the chemical reactions without taking into account mass transfer effects quantitatively, whereas engineers tend to simplify reactions and physico-chemical behaviour of the system too much.12 Users of both types of models apply a regime analysis, in which they vary interfacial area and stirring rate in a model reactor in order to identify the reaction regime. The same experimental result may lead to a completely different interpretation depending on the selected model. For instance, if the extraction rate in a system increases with an increase in interfacial area, but not with an increase in stirrer rate, the interfacial reaction model concludes that the reaction is slow compared to mass transfer13 (‘kinetically controlled’, ‘plateau zone’), whereas the homogeneous reaction model concludes that the reaction is fast compared to mass transfer14 (‘regime 3’, ‘E = Ha’). Despite this large difference, both models have been applied to detemine reaction kinetics in chemically related systems, i.e. extraction of organic acids by tertiary amines.3,9 Finally, although attempts were made to include some ‘aqueous phase reaction’ contribution in an interfacial reaction mechanism,15 it does not seem possible to write down the homogeneous reaction model in such a way that the interfacial reaction model is a limiting case, or vice-versa, nor to carry out a simple experiment to distinguish between the two models. The best way to select a model seems therefore to study the physical and chemical properties of the reactive extraction system under study, especially the species solubilities. In the reactive extraction of the mentioned chiral compounds, there is a clear physical solubility of the enantiomers in the organic phase, and it is therefore not to be expected that the reaction location will be restricted to the interface. The possibility of reaction in the organic bulk phase is correctly described by the homogeneous model. On the other hand, it may be that the enantioselective extractants and/or complexation products show some adsorption at the interface. The chiral ligand N-dodecyl-L-hydroxyproline is an amino acid with a long carbon tail and has a clear surfactant structure, and for crown ethers, surfactant behaviour has also been reported.16 In that case, the concentration profile near the interface is not described correctly by the homogeneous reaction model. Despite the fact that both these models are not completely applicable to our case, the homogeneous reaction model approach was selected to study the chiral reactive extraction systems further, because it is very unrealistic to locate the reaction at the interface only. If adsorption of the extractant and the products at the interface occurs, it is expected that the contribution of the interfacial reaction will be low compared to the contribution of the homogeneous reaction. Various model reactors have been developed over the years to study reaction kinetics in two-phase systems.17 For this study, the modified Lewis cell was selected as model reactor, because the obtained data can be interpreted rather straightforwardly, as the interfacial area and hydrodynamics are known (in contrast with small-scale process extractors, such as the

Reaction kinetics
104
rotating disc column or the packed bed), and because of its ease of construction and operation (compared to reactors such as the wetted wall column). Finally, the cell can be operated batch-wise, which is advantageous given the small amount of enantioselective extractant that is available. The regime analysis associated with the homogeneous reaction model14 is given in the next paragraph (table 2). Regime analysis has proven its usefulness in studies of reaction kinetics in gas-liquid systems, and it was also applied to reactive extraction.10,11 However, in initial measurements for the chiral reactive extraction systems under study, it seemed that this analysis was not directly applicable. Two possible causes may be stated. The original regime analysis was defined for irreversible reactions, whereas the reactions in reactive extraction systems are generally reversible. Furthermore, the analysis only holds for a case in which the resistance to mass transfer in the non-reactive phase can be neglected. This is also not generally valid in reactive extraction: in contrast with the gas-liquid case, the film layer thicknesses and the diffusion coefficients in both fluid phases are of the same order of magnitude. The aim of this paper is to study under which circumstances the homogeneous reaction model and regime analysis can be used to describe reactive extraction. Therefore, simulations of the reactive extraction process in a modified Lewis cell are carried out. Secondly, the obtained knowledge will be applied in the experimental study in the Lewis cell of the reaction kinetics in reactive extraction of phenylglycinol and phenylethylamine with the azophenolic crown ether, and the extraction of leucine with Cu(II)-C12Hyp. The scope of this work is to determine the order of magnitude of the reaction kinetics in order to allow equipment selection and conceptual process design.
5.1.2 Homogeneous reaction model and regime analysis In the homogeneous reaction model, the mass transfer process can be described in various ways. For this work, the two-film model was selected as mass transfer model because of its simplicity, and because the numerical results are similar to those of more realistic models. The two-film model is combined with a definition of the reaction(s) in one or both phases. Here, it is assumed that the reaction of interest takes place in the organic phase only. The mass balance equation for the aqueous stagnant film layer (‘1’) is for each component ‘A’:
0][
21
2
1, =∂
∂x
ADA (1)
in which D denotes the diffusivity. In the organic film ‘2’ (reaction and transport, film model):
0][
22
2
2, =+∂
∂AA R
x
AD (2)

Chapter 5
105
The organic and aqueous bulk phases are assumed to be perfectly mixed, and physical equilibrium is assumed at the interface. In general, this model has to be solved numerically. The resulting expression for the flux JA is given in equation 3. Note that the enhancement factor EA is in principle not a constant, but contains information on the reaction rate. For physical extraction, EA = 1. P is the physical partitioning ratio.
]//[11
][1
][)][
1]([ 2
21
2,1,
2,1, smkmol
EPkk
AP
AA
PAKJ
ALL
bulkbulk
bulkbulkovA
+
−=−⋅= (3)
Analytical solutions exist for a number of ‘limiting regimes’, in which specific conditions apply. The dimensionless Hatta number (Ha) and the Hinterland ratio (Al) can be used to characterise these regimes. For a (n,m)-reaction taking place in the organic phase, with rate law R = -kn,m[A]n[C]m, in which A is the component transported from the other phase and C the organic-phase extractant, HaA is given in equation 4; with C present in excess HaC is not required.6 For low conversions, the Hatta number also has this form for a reversible reaction in which the forward part of the rate law has the form R = - kn,m[A]n[C]m.
2
1, ][][
1
2
L
Amn
mn
A k
DCAknHa
⋅⋅⋅⋅+=
−
(4)
The Hinterland ratio (Al) is defined as:
2
2
δ⋅==
O
V
volumefilmreaction
volumephasereactionAl (5)
In this equation, V2 is the volume of the reactive phase, O is the interfacial area and δ is the
thickness of the mass transfer film. For an irreversible (n,m)-reaction, four limiting regimes can be distinguished:14 very slow reaction, slow reaction, fast reaction and instantaneous reaction. Depending on the regime, the reactive system will respond in a certain way to changes in interfacial area O, mass transfer coefficient kL (~ stirrer rate) and interfacial concentration [A]i. In a suitable model reactor, the response of the system to these changes can be studied. In this ‘regime analysis’ it is assumed that the resistance in the non-reactive phase can be neglected (1/kL1 << 1/PkL2EA). The information on the regimes is summarised in table 1. Indicated are the criteria for Ha and Al, the expressions for the volumetric extraction
rate NA (=JA⋅a), and dependency of extraction rate on specific area a (=O/VR), ‘stirrer rate’ kL
and interface concentration [A]i.

Reaction kinetics
106
Table 1: Classical limiting regimes for irreversible reaction7,14 assuming constant volume. regime description HaA NA * dependency on
(Al-1)⋅ HaA2
kmol/m3/s a stirring [A]i
1
Very slow reaction
< 0.2
<< 1
N=V2⋅RA
zero
zero
linear
2
Slow reaction < 0.2
>> 1
N=J⋅a=
kL2⋅[A]i⋅a linear
linear
linear
3
Fast reaction EA=Ha
> 2
N=J⋅a=
[A]i ⋅a⋅√(k1,1DA) linear
zero
linear
4
Instantaneous reaction
> 2
N=J⋅a=
a⋅kL2,B⋅[B]org linear
linear
zero
* expression for NA assuming (1,1)-reaction; other rate laws yield the same dependencies.
5.2 Simulations with crown ether extractant system For the simulations, the chemistry of the crown ether system (figure 1a and table 2) was introduced in the homogeneous reaction model equations. The reversible reaction between enantiomer R and crown ether C is known to have 1:1 stoichiometry18 and is described as R +
C ⇔ RC. It is known from previous equilibrium measurements that only R and S partition
between the aqueous and the organic phase and that C and RC remain in the organic phase. Therefore, the reaction only takes place in the organic phase (film and bulk). It was assumed that the rate law can be defined according to the law of mass action as a (1,1)-reaction:
][][][ ,1,1 RCkCRkR RRR ⋅−⋅⋅= − [kmol/m3/s] (6)
In this equation, k1,R/k-1,R equals the complexation constant KR. A similar equation is defined for the reaction between the S-enantiomer and the crown ether, with rate constants k1,S and k-
1,S. From the equilibrium measurements (chapter 4), the complexation constants KR and KS of the complexation reactions are known (table 2). The (thermodynamic) intrinsic selectivity is the ratio of the two complexation constants. It is not very likely that there is a kinetic effect in the selectivity, so it is assumed that the ratio of forward reaction rate constants equals the ratio of complexation constants:
S
R
S
R
k
k
K
K
,1
,1int ==α (7)
To find the correct equilibrium compositions, the acid-base dissociation reaction of the amine or amino-alcohol is included in the aqueous phase. The ammonium form of the amine (RH+) does not partition to the organic phase.

Chapter 5
107
Table 2: chemical data for reactive extraction systems from chapter 2 and 4. Reaction
schemes are given in figure 1. All data at 25 °C.
Racemic mixture phenylglycinol phenylethylamine leucine
extractant crown ether crown ether Cu(II)-C12Hyp solvent toluene toluene butanol K1 [m
3/kmol] or [-] 12000 (R) 900 (S) 16.2 * (D) K2 [m
3/kmol] or [-] 1200 (S) 330 (R) 7.5 * (L)
αint [-] 10 2.7 2.1
P [-] 0.06 4 0.2 pK [-] 8.5 9.4 I.E.P. 6.0 operating pH slightly > pK
no buffer slightly > pK no buffer
5.5-6.0 acetate buffer
* ligand-exchange equilibrium
The Lewis cell geometry was modelled by assuming that the two liquid bulks are ideally mixed, and that all concentration gradients are found in the film layers next to the interface. The film model equations are combined with the reaction rate equation as defined above, boundary conditions and overall mass balances. Experimentally obtained mass transfer coefficients etc. were implemented whenever available. The model was implemented in the gPROMS modelling language (PSE Ltd., London, UK). The numerical solution method is the backward finite difference method (BFDM). The film layer is divided in 10 ‘slices’ for the numerical solution. The concentration profile in time of the transferred component in the non-reactive phase (aqueous bulk) is used for comparison most of the time, because this profile can be obtained experimentally as well.
5.3 Experimental 5.3.1 Materials R- and S-phenylglycinol (99%), R- and S-phenylethylamine (98%), D- and L-leucine and L-hydroxyproline were obtained from Fluka (Buchs, Switzerland). Toluene, butanol, sodium acetate and copper(II) acetate were obtained from Merck (Darmstadt, Germany). The ligand N-dodecyl-L-hydroxyproline was synthesised according to the method of Takeuchi et al.19 The azophenolic crown ether was manufactured by Syncom b.v. (Groningen, the Netherlands) in a custom synthesis according to Naemura et al.18 Throughout the study, milli-Q filtered water was used (Millipore, Billerica, MA, USA).
5.3.2 Lewis cell design and operation The modified Lewis cell (figure 3) was manufactured at the glass shop of the University of Twente. The interface is not crossed by any cell internals and is kept flat by the presence of four vertical glass baffles in each phase and by applying moderate stirring rates. Each phase is

Reaction kinetics
108
stirred by a magnetic stirrer bar, that is mounted between the baffles (Variomag). The mass transfer coefficients at each side of the interface can be influenced separately by changing the stirring rate in that phase. The actual interface of 35 cm2 can be reduced by floating polymeric
balls at the liquid interface20 (PP, ρ ≈ 900 kg/m3, suitable for water/butanol, resulting area ~
20 cm2), or by inserting a flexible PP ring at the interface (suitable for water/toluene, resulting area ~ 24 cm2). The PP balls were kindly donated by Dr. Y. van der Zijpp and Dr. ir. W. Zuiderduin (Artecs, Enschede, The Netherlands). The cell is thermostatted with a Julabo F32 water bath and is equipped with sample ports closed with septa.
PHASE 1
PHASE 2
Figure 3: (a) Schematic picture of Lewis cell (b) photo of set-up
To carry out an experiment, 165 mL of the organic phase and 150-155 mL of the aqueous phase are brought in the Lewis cell, containing all reagents except for the compound that is going to be transferred. The solvents are mutually saturated before the measurement. Both liquid phases are stirred at the appropriate temperature (typically 25 °C) for at least 30 minutes, to ensure thermal and physical equilibrium. At t=0, typically 5 mL of the component to-be-transferred dissolved at high concentation in water is entered in the aqueous phase by a syringe. After that, samples are taken from the aqueous phase at appropriate times, usually about 7-10 samples over a time span of 2-3 hours. The amount of samples is limited to avoid substantial volume loss of the aqueous phase. For practical reasons, the pH of the aqueous phase is only determined at the end of the experiment. For reactive extraction of single enantiomers of PEA or PG with the crown ether system, 3 mM of the azophenolic crown ether dissolved in toluene was used as organic phase, and pure water (no buffer) as aqueous phase. At t=0, [R-PG]ini,aq or [S-PEA]ini,aq was 0.5 mM. For a physical extraction experiment, the measurement is carried out without extractant present, but otherwise in the same way with [rac-enantiomer]ini,aq = 2 mM. For reactive extraction of DL-leucine, butanol containing 10 mM C12Hyp is pre-extracted with 0.1 M sodium acetate solution (buffer) containing 5 mM copper(II) acetate. After pre-extraction of Cu(II) to form the Cu(II)-C12Hyp 1:2 complex, the pH of the aqueous phase is 5.5-6.0. At t=0, rac-leucine solution is injected to obtain a concentration of 0.8 mM.

Chapter 5
109
5.3.3 Chemical analysis The concentrations of both enantiomers of leucine, phenylglycinol or phenylethylamine in aqueous samples were determined by chiral HPLC. As eluent, 0.1 M perchloric acid solution in milli-Q water was used. Post-column derivatization was carried out according to Duchateau et al.21 The HPLC set-up consisted of a Varian 2510 pump, a Crownpak (+) chiral column (Daicel, Japan) cooled in a Varian 510 column oven, an Alltech 301 HPLC pump to deliver post-column derivatization reagent, a reaction coil operating at 40 °C, and a Jasco FP-2020 plus fluorescence detector operated at 325 nm excitation and 465 nm emission. Cu(II) concentrations in water were determined by atomic absorption spectrometry (AAS) on a Varian SpectrAA 110 instrument equipped with SIPS diluter (Varian, Palo Alto, USA). 0.1 M sodium acetate solution saturated with butanol was used as matrix solution.
5.3.4 Data treatment The outcome of a Lewis cell experiment is a plot of the concentration of the extracted component in the aqueous phase as a function of time. For physical extraction assuming the two-film model, the concentration in the cell of R as a function of time can be found from:
aqR
bulk
V
AJ
dt
Rd⋅=− 1,][
(8)
The flux JR follows from the homogeneous reaction model and is given in equation 3. The integrated form of equation 8 combined with equation 3 can be fitted to the experimental results of a physical extraction experiment with Kov as fit parameter. To determine kL1 and kL2 separately, physical extraction experiments are carried out in the Lewis cell at four different combinations of stirrer speeds in the two phases, namely 140/140, 140/190, 190/140 and 190/190 rpm. The partial mass transfer coefficients (kL1(140), kL1(190), kL2(140) and kL2(190) are obtained by solving the system of four equations for the four Kov values. The diffusion coefficients were estimated with the Wilke-Chang correlation.22 The physical extraction of phenylglycinol is so low that it cannot be studied by taking aqueous phase samples, because the concentration decrease in the aqueous phase is almost within the experimental error of the HPLC analysis (~3%), nor by back-extraction of organic-phase samples, because the resulting concentrations are too low to obtain a reliable result. Therefore, the mass transfer coefficients for the physical extraction of PG were estimated from the PEA data, assuming that the film layer thicknesses are the same in both systems. A reversible reaction is often studied by measuring the initial reaction (extraction) rates, which is only governed by the forward reaction. For a precise determination of the initial extraction rate, it is desirable to use the complete experimental concentration-in-time profile.

Reaction kinetics
110
Therefore, the experimental results of a reactive extraction run are also fitted to equation 3+8 with Kov as fit parameter. Kov can now be interpreted as ‘Kov,chem’ which is the product of Kov,phys and the effective enhancement factor EA,app (see equation 11 in results section). The initial extraction rate can be found from
V
ARKN bulkchemovRini ⋅⋅= 1,,, ][ (9)
Fitting of various simulated concentration profiles to this equation resulted in correct results.
5.4 Simulation results In this paragraph, model simulations of the extraction process in the Lewis cell are presented to study the overall extraction rates that can be expected in this cell for various reaction rate constants under various experimental conditions. The physical and chemical properties of the phenylglycinol-crown ether system (table 2) are used, unless indicated otherwise. The mass transfer resistances are either close to the experimentally obtained values (next paragraph), or they are set to be ‘negligible’. First, it is studied under which circumstances enhancement of mass transfer can be observed. Then the applicability of the regime analysis is tested by simulating the effect of changes in interfacial area, ‘stirring rate’ and interfacial concentration on the extraction rate. Finally, the influence of other reactions such as acid-base dissociation in the system is discussed.
5.4.1 Validation of model To test if the model results are numerically correct, the simulation model was validated by comparing the model prediction for a case without reaction with the analytical solution for physical mass transfer, using the parameters for phenylglycinol/water/ toluene (table 2). As expected, both concentration profiles were the same. As a next step, the reversible reaction between phenylglycinol and crown ether was incorporated in the model. A set of simulations was carried out with constant mass transfer coefficients and complexation constants, and a increasing reaction rate constant k1,1, to pass through the various regimes (table 3). All the trends in the resulting curves were according to the theory in table 3. In further simulations, the parameters in table 3 are used, unless mentioned otherwise.

Chapter 5
111
Table 3: base case parameters for simulations, yielding the four major regimes; 1/kL1
negligible, kL2 (close to) experimentally obtained value, k1,1 hypothetical values; reaction
R+C= RC with equilibrium parameters for phenylglycinol.
regime kL2
m/s k1,1 m3/kmol/s
Ha (Al-1)Ha2
1 6.1⋅10-5 3⋅10-3 2.66⋅10-3 6.7⋅10-3
2 6.1⋅10-5 8 0.14 17.9
3 6.1⋅10-5 3⋅103 2.66 6.7⋅103
4 6.1⋅10-5 3⋅107 266 6.7⋅107
5.4.2 Influence of kL1 on effective enhancement factor The occurrence of enhancement of mass transfer by reaction and the influence of the aqueous-phase mass transfer resistance on the obtained enhancement factor was studied by simulation, leaving out the acid-base dissociation reaction. In each run, the initial extraction rate of component A is calculated from the concentration decrease of A over the first few time intervals. The enhancement factor is determined as the ratio of (initial) reactive extraction rate and the physical extraction rate under the same circumstances:
physicalN
reactiveNEA ,
,= (10)
The simulations were carried out with and without a substantial aqueous-phase mass transfer
resistance, by setting kL1 either to 6⋅10-5 m/s (experimental value) or to a very high value
resulting in 1/kL1 = negligible. To span a range of Ha-numbers, k1,1 was varied between 3⋅10-3
and 3⋅107 m3/kmol/s. The obtained EA values were plotted as a function of Hatta-number in
figure 4.
1
10
0.001 0.1 10 1000Ha
EA
resistanceaqueous phaseno resistanceaqueous phaseEA=Ha
Figure 4: gPROMS simulation; enhancement of mass transfer (EA) as a function of Hatta
number (Ha). Reaction R + C ⇔ RC, k1,1 ranges from 3⋅10-3 and 3⋅107 m3/kmol/s. All cases
kL2 = 3⋅10-5 m/s. ‘Resistance’: kL1 = 6⋅10-5 m/s, ‘no resistance’: kL1 = 1⋅10-2 m/s.

Reaction kinetics
112
For the case without aqueous phase mass transfer resistance (solid line in the graph), it can be seen that the characteristic pattern for a reversible reaction23 is obtained. At low Ha there is no enhancement (EA = 1). A small part of the curve reaches a slope of 1, corresponding with the regime of EA = Ha (regime 3). At higher Ha values, the enhancement factor reaches a maximum value. Apparently, the maximum enhancement under these circumstances is about 6.5. If there is a substantial aqueous phase mass transfer resistance (dotted line in the graph), it can be seen that the observed enhancement factor is much lower at the same Ha-number, and the maximum enhancement factor is also lower. Furthermore, the dotted EA vs Ha curve does not reach a slope of 1 anywhere in the graph. In other words, no regime ‘3’ in which EA = Ha seems to be present. Under these circumstances, there is a difference in the experimentally observable enhancement factor (EA,app) and the ‘real’ enhancement factor EA which manifests itself only in the reactive phase. The relation between EA,app and EA can be seen in the following expression for the overall mass transfer coefficient Kov,chem (see also equation 3):
ALL
appAphysovchemov
EkPk
EKK
⋅⋅+
=⋅=
21
,,, 111
(11)
If the term containing kL1 can be neglected, the effective enhancement factor EA,app equals the ‘real’ enhancement factor EA. The larger the influence of kL1, the lower the effect of the ‘real’ enhancement factor EA in the overall effective enhancement factor EA,app. In a system with a large resistance to mass transfer in the non-reactive phase, the observable enhancement of mass transfer EA,app may disappear altogether.
5.4.3 Influence of kL1 and reversibility of reaction on regime analysis We will now explore the consequences of mass transfer resistance in the aqueous phase and reversibility of the reaction for the results of a classical regime analysis, by simulating the influence of changes in interfacial area, kL1 and kL2 (stirring rate) and interfacial concentration on the overall initial extraction rate ‘Nini’ of enantiomer R. This will be repeated for the case with and without a substantial aqueous phase resistance to mass transfer. Unless mentioned otherwise, the parameter values in the simulation have the same values as in the experiments,
namely volumes and area of Lewis cell, kL2 = 6.1⋅10-5, chemical constants from PG system,
[R]bulk,1,ini = 5⋅10-4 kmol/m3, [C]bulk,2,ini = 3⋅10-3 kmol/m3. To span all four regimes, the values
of the reaction constant k1,1 were taken from table 3. The effects of changes in interfacial area on the initial extraction rate Nini are given in table 4 as the ratio Nini, before change/Nini,after change. Similarly, the effects of changes in kL1 and kL2 are given in table 5 and the effect of changes in [R]bulk,1,ini is given in table 6. For comparison, the effect that is expected based on the conventional regime analysis assuming no resistance in the aqueous phase and irreversible reaction is given as the ratio Nini, before change/Nini,after change this effect is either ‘linear’ or ‘zero’ according to table 1.

Chapter 5
113
Table 4: Regime analysis, simulation results: influence of interfacial area change on initial
extraction rate Nini (see text). k1,1 according to ‘regime’ in table 3
A, cm2 kL1 m/s regime Nini/Nini Th. ratio*
20 � 35 cm2 1⋅10-2 1 1.67 1
= no resistance 2 1.72 1.75 3 1.74 1.75 4 1.73 1.75
20 � 35 cm2 1.1⋅10-5 1 1.73 1
= substantial resistance 2 1.73 1.75 3 1.74 1.75 4 1.74 1.75
*area factor 35/20 = 1.75; no influence in regime 1.
Table 5: Regime analysis, simulation results: influence of mass transfer coefficients kL
(‘stirring rates’) on initial extraction rate Nini. kL is changed in one phase at a time. 1=aq,
2=org. k1,1 according to ‘regime’ in table 3, A = 35 cm2
kL1 kL2 regime Nini/Nini Th. ratio*
constant, 1⋅10-2 6.1⋅10-5 --> 9.8⋅10-5 1 1.54 1
= no resistance 2 1.57 1.6 3 1.18 1 4 1.57 1.6
constant 1.1⋅10-5 6.1⋅10-5 --> 9.8⋅10-5 1 1.37 1
= substantial resistance 2 1.38 1.6 3 1.08 1 4 1.15 1.6
1.1⋅10-5 --> 1.7⋅10-5 constant, 6.1⋅10-5 1 1.09 1
= substantial resistance 2 1.09 1.5 3 1.15 1 4 1.28 1.5
*kL2 factor = 9.8/6.1 = 1.6; kL1 factor 1.7/1.1=1.5; no influence in regime 1 and 3

Reaction kinetics
114
Table 6: Regime analysis, simulation results: effect of [R]ini,aq on Nini. All cases kL1 = 1⋅10-2
m/s, k1,1 according to ‘regime’ in table 3, A= 35 cm2.
[R]bulk,1,ini regime Nini/Nini Th. ratio*
3⋅10-4 � 5⋅10-4 kmol/m3 1 1.67 1.67
2 1.67 1.67 3 1.66 1.67 4 1.64 1
* [R]ini factor = 5/3 = 1.67; no influence in regime 4
By comparing the theoretical prediction and the results from the simulation, it is clear that the conventional regime analysis is not directly valid for our system. Some of the deviations can be explained by the reversibility of the reaction and some by the presence of the aqueous phase resistance to mass transfer. It can be seen in table 5 that the effects of a change in interfacial area by a factor 1.75 are the same for the cases with and without substantial resistance to mass transfer in the aqueous phase. The expected proportional effect of the interfacial area change in regimes 2, 3 and 4 is caused by the fact that mass transfer is a flux-based process in these regimes; if less area is available, the extraction process is proportionally slower, regardless of the location of the main resistance. The unexpected influence of interfacial area on the extraction rate in regime 1 is caused by the use of initial extraction rates. In the first part of the extraction process, the bulk of the organic phase becomes physically saturated with A. This part is governed by physical extraction, which is a flux-type process that becomes faster if more area is available. After some time, the bulk is physically saturated and the (slow) reaction determines the overall extraction rate. Now additional area does not influence the extraction rate anymore: both curves are exactly parallel. Along the same line of reasoning, a system in regime 1 will respond initially to changes in stirring rate. Therefore, the regime analysis based on initial extraction rates cannot be used to identify regime 1. However, in a practical case, regime 1 can be identified easily if the physical and chemical equilibria of the system and the characteristics of the Lewis cell are known. As for the effect of organic phase stirring rate (kL2), it can be seen in table 5 that the stirring rate has an influence on the initial extraction rate in all regimes, although the magnitude of the effect varies. The unexpected influence of the stirring rate in regime 1 is caused by the use of initial extraction rates. For the series with no aqueous phase mass transfer resistance, the influence of kL2 is as predicted for regime 2 and 4 (factor 1.57~1.6). This is a logical result, because in this case the resistance is entirely located in the organic phase. The influence of kL2 is the smallest in ‘regime 3’, but the factor is not exactly 1. The system is evidently not exactly on EA = Ha here (Ha = 2.66 vs. Ea = 2.4), therefore the influence of kL2 is small, but kL2 is not eliminated completely from the flux expression. In case of substantial aqueous phase mass transfer resistance, no regime EA=Ha is present (figure 4), so it can be expected

Chapter 5
115
that the influence of kL2 is visible everywhere, also in what is supposed to be ‘regime 3’. The influence of changes in kL2 on the extraction rate in regimes 1, 2 and 4 is smaller here than in the system without mass transfer resistance in the aqueous phase. This is caused by the influence of kL1 on the overall resistance. In case of mass transfer enhancement (regime 4), the term (1/EAmkL2) has even less influence on the overall mass transfer resistance. Finally, an improvement in mass transfer in the aqueous film layer (kL1) has an effect in each regime. The largest effect is seen in regime 4, because the organic phase resistance (1/EAmkL2) is the smallest here. From table 6 it can be seen that the concentration of [R]ini,aq always has an influence on the initial conversion rate, also in regime 4 (note that [R]bulk,1 = [R]i,1 because of negligible aqueous mass transfer resistance). The deviation from the theoretical behaviour is caused by the reversibility of the reaction: then the maximum enhancement factor is defined by a different equation. For example, for the reversible model reaction R+C = RC, the analytical solution of Olander6 may be used:
ieqRC
C
bulkeq
R
CA
RKD
D
CK
D
DE
][
][1,
⋅+
⋅⋅+=∞ (12)
It can be seen that even if EA,∞ >> 1, EA,∞ is not inversely proportional to [R]i, so [R]i is not
eliminated from the flux equation. As a result, the conventional regime analysis cannot be used to identify regime 4 for a reversible reaction. Summarising, ‘conventional’ regime analysis will give erroneous results for reactive extraction in the following cases:
• Regime 1 cannot be found when initial extraction rates are used: the response on area and stirring rate changes are not correct
• For a reversible reaction, regime 4 cannot be identified by studying the response on a [R]ini change
• If mass transfer in aqueous phase is substantial, as is often the case, regime 3 cannot be identified: the response on stirring rate changes is not correct.
5.4.4 Role of acid-base dissociation and other aqueous-phase reactions Amines and amino-alcohols are bases, and depending on the pH they are present in the aqueous phase as neutral amine or as ammonium ion. Only the neutral amine can partition to the organic phase and react with the extractant, so it can be expected that the extent of acid-base dissociation has an influence on the overall extraction rate. A (very fast) acid-base dissociation reaction of the amine enantiomers was incorporated in the model and simulations of the physical extraction were carried out at pH 8.0-9.4. The pH was kept constant in the model, and the same values for kL1 and kL2 as in the previous simulations were used. The profiles for [R]tot,1 (= [R]1 + [RH+]1) have the same shape as the profiles found without acid-

Reaction kinetics
116
base dissociation, but the lower the pH, the slower the mass transfer process. The profiles were fitted to equation 3 combined with 8 to find the overall mass transfer coefficient Kov,phys. It can be seen from the results in table 7 that the Kov,phys determined in this way (as initial flux divided by concentration) is smaller than the Kov,phys used as input in the simulations. This is caused by the lower effective driving force for mass transfer: only the uncomplexed amine or amino-alcohol partitions to the organic phase, but the total aqueous phase concentration is ‘measured’. If the initial extraction flux (Jini, kmol/m2/s) based on the total aqueous amine concentration ([Rtot]bulk,1) is divided by the neutral amine concentration ([R]bulk,1), the correct (input) value for Kov is obtained. The larger the pH, the closer the neutral amine concentration is to the total amine concentration, and the smaller the deviation in Kov,phys. Table 7: Simulation results: influence of pH on determination of Kov,phys. Input: Kov,phys =
3.67⋅10-6 m/s. Total [R]bulk,1,ini = 3⋅10-4 kmol/m3, pH constant, pK 8.9.
pH fraction neutral amine [R]/[R]tot
Jini for total amine, kmol/m2/s
Kov,phys as Jini/[R]tot,bulk1,ini
Kov,phys as Jini/[Rneutral]bulk1,ini
8 0.11 1.2⋅10-10 4.1⋅10-7 3.6⋅10-6
9 0.55 6.0⋅10-10 2.0⋅10-6 3.6⋅10-6
9.4 0.76 8.3⋅10-10 2.7⋅10-6 3.6⋅10-6
These model results show that if physical (or reactive) extraction is carried out at a pH near the pK, the actual concentration of the transferred species should be used in calculation of mass transfer coefficients, instead of the total substance concentration (which usually follows from the experiment). If an amine is present in the transferable neutral form for 75%, but the overall amine concentration is used to find Kov,phys, the obtained Kov is (1/0.75 = 1.3) times too low. These results can be extended: other aqueous-phase reactions (such as complexation with metal ions or buffer species, etc.) also have an influence on the fraction of the substance that is present in the transferable form and should also be taken into account. A similar conclusion was drawn by Nymeijer et al.8 for the reactive absorption of ethylene by AgNO3 solution, concerning the availability of Ag+ ion. If sufficient data are available, the side-reactions may be included in the model. Alternatively, if data are lacking or if the chemistry of the system is complicated, the physical extraction and reactive extraction experiments should be carried out at the same pH and the same concentrations of all additives in the system; then the actual concentration of the transferred species is the same in both experiments, and the initial extraction rates can be compared directly to find the enhancement factor.

Chapter 5
117
5.5 Experimental results
5.5.1 Validation of method & characterisation of Lewis cell For correct use of the Lewis cell, the range of stirring rates has to be determined in which the interfacial area is constant. To do so, a kinetic experiment has been carried out with a system of which it is known that the reaction is interfacial, a metal ion extraction: the extraction of Cu(II) ion to the organic phase by the extractant C12Hyp in water/butanol. Note that the regime analysis for this system with interfacial reaction is not the same as for a homogeneous reaction: in an interfacial reaction system, any change in interfacial area is visible in the extraction rate. The stirring rates in the organic phase and aqueous phase were set equal. The extraction results are given in figure 5. It can be seen in the plot that the extraction rate is constant for stirring rates below 200 rpm; evidently, the reaction rate is limiting in this case. If the stirring rate is increased to 220 rpm, the extraction rate is increased slightly. At this stirring rate, a small disturbation of the liquid-liquid interface was observed visually as well. From this experiment, it follows that the interface in the cell has a constant area if the stirring rate is kept below 200 rpm. To be on the safe side, a stirring rate of 190 rpm was used as ‘high’ value, and a stirring rate of 140 rpm as ‘low’ value. It was assumed that this range of suitable stirring rates can also be used in a water/toluene system.
0
1
2
3
4
5
6
0 100 200 300
time (min)
[Cu
2+] a
q m
M
Cu 155 rpmCu 180 rpmCu 200 rpmCu 220 rpmequilibrium
Figure 5: Influence of stirrer speed on copper(II) extraction rate by C12-hydroxyproline (HLi)
ligand from water to butanol, Lewis cell; pH = 6.1, 25 °C.
Secondly, it has to be demonstrated that the mass transfer coefficients are indeed increased if the stirring rate is increased from 140 to 190 rpm, as this does not follow from the previous experiment (figure 5). The mass transfer coefficients were measured for the physical extraction of phenylethylamine (PEA) from water into toluene at 25 °C. For further characterisation of the cell, four experiments were carried out at stirrer rates of 140/140, 140/190, 190/140 and 190/190 rpm in the aqueous phase and organic phase respectively. The

Reaction kinetics
118
resulting graphs are given in figure 6. To show the differences more clearly, the natural logaritm of the concentration decrease was plotted instead of the concentration.
-1.2
-1
-0.8
-0.6
-0.4
-0.2
00 50 100 150
Time (min)
ln [P
EA
]/[P
EA
] in
i140 aq 140 org
190 aq 190 org
140 aq 190 org
190 aq 140 org
Figure 6: Concentration profiles for physical extraction of PEA from water into toluene, 25
°C. ‘140’ and ‘190’ refer to stirrer rates (rpm) in the respective phases. In axis title,
[PEA]tot,bulk,1 is abbreviated as [PEA].
It can be seen in figure 6 that the main resistance to mass transfer is located in the aqueous phase: an increase in stirrer speed in the aqueous phase results in an overall larger mass transfer rate, whereas an increase in stirrer speed in the organic phase has hardly any effect. By fitting the concentration profiles to equation 3, the overall mass transfer coefficients for PEA were determined for all four combinations of stirrer rates (table 8). The dissociation degree of PEA and PG was estimated from the experimental pH to be the same in all cases, namely 25 % as ammonium ion and 75 % as free amine. A more precise number could not be obtained, because no data on the pH change during the experiment are available due to practical limitations. It can be seen that the overall mass transfer coefficient is increased with ~ 30% when the stirring rate is increased from 140/140 to 190/190 rpm, which shows that the Lewis cell functions correctly. Based on these overall transfer coefficients, the partial mass transfer coefficients for PEA were estimated as well (table 8). The associated film layer thicknesses (assuming the film model for mass transfer) have been calculated with help of the diffusion coefficients. The mass transfer coefficients of PG are estimated under the assumption that the same film layer thicknesses apply for the physical extraction of PG and PEA (table 9).

Chapter 5
119
Table 8: Experimental overall and partial mass transfer coefficients for physical extraction of
PEA in Lewis cell, water/toluene, 25 °C. ‘1’ refers to aqueous phase, ‘2’ to organic phase.
aq. stirring rate (rpm)
org. stirring rate (rpm)
Kov, PEA (m/s)
kL1, PEA (m/s)
kL2, PEA (m/s)
δ1 (m) δ2 (m)
140 140 1.20⋅10-5 1.3⋅10-5 6.7⋅10-5 5.8⋅10-5 4.7⋅10-5
140 190 1.23⋅10-5 1.3⋅10-5 8.5⋅10-5 5.8⋅10-5 3.6⋅10-5
190 140 1.53⋅10-5 1.6⋅10-5 6.7⋅10-5 4.5⋅10-5 4.7⋅10-5
190 190 1.53⋅10-5 1.6⋅10-5 8.5⋅10-5 4.5⋅10-5 3.6⋅10-5
Table 9: Overall and partial mass transfer coefficients for physical extraction of PG,
estimated from data for PEA (table 8) in Lewis cell, water/toluene, 25 °C. ‘1’ refers to
aqueous phase, ‘2’ to organic phase.
aq. stirring rate (rpm)
org. stirring rate (rpm)
δ1 (m) δ2 (m) kL1, PG (m/s)
kL2, PG (m/s)
Kov, PG (m/s)
140 140 5.8⋅10-5 4.7⋅10-5 1.2⋅10-5 6.4⋅10-5 2.89⋅10-6
140 190 5.8⋅10-5 3.6⋅10-5 1.2⋅10-5 8.1⋅10-5 3.48⋅10-6
190 140 4.5⋅10-5 4.7⋅10-5 1.5⋅10-5 6.4⋅10-5 3.05⋅10-6
190 190 4.5⋅10-5 3.6⋅10-5 1.5⋅10-5 8.1⋅10-5 3.71⋅10-6
The film layer thicknesses are of the same order of magnitude in both phases, which is a result of the similar viscosities and stirring rates. Despite this similarity in film thickness, the resistance to mass transfer of PEA is almost exclusively located in the aqueous film layer (table 8). This effect is caused partly by the smaller diffusion coefficient in the aqueous phase (which results in kL1 < kL2) and partly by the large partitioning ratio (m ~ 4 at this pH). For PG, it can be seen that both phases contribute to the overall resistance to mass transfer with the largest resistance located in the organic phase. This difference with PEA is caused by the much lower value for the physical distribution ratio (m ~ 0.06).
5.5.2 Reactive extraction of phenylglycinol with crown ether The crown ether system was selected for the initial reactive extraction measurements, because the chemistry of the crown ether system is less complicated than the chemistry of the Cu(II)-C12Hyp system. Phenylglycinol was selected over phenylethylamine because the main resistance to mass transfer is located in the reactive phase, so the effect of the reaction with the crown ether is expected to be more clearly visible (equation 11). The concentration profile for the run with 190/190 rpm stirring rate is given in figure 7. Note that the ‘fit physical’ is based on the mass transfer coefficients from table 9 and the equilibrium distribution ratio for the reactive system. This way of plotting combines the correct initial extraction rate for physical extraction (which is not a function of the partitioning ratio) with the correct reactive equilibrium value for a fast comparison, but does not represent any real profile.

Reaction kinetics
120
0
0.1
0.2
0.3
0.4
0.5
0.6
0 50 100 150 200Time (min)
[R-P
G] a
q m
M
data, reactive
fit, reactive
fit, physical
Figure 7: reactive extraction of phenylglycinol; stirrer speed 190/190 rpm in each phase.
Prediction of physical extraction from data in table 9.
It can be seen in figure 7 already that the initial reactive extraction rate is larger than the prediction of the rate by physical transport only (at this stirrer rate, for this effective distribution ratio): there is enhancement of mass transfer by reaction. Next, the reactive extraction experiments were repeated with different stirrer rate, a different interfacial area and a different initial PG concentration. In all runs, the experimental data were fitted to the equation 2 to find the fit parameter Kov (equation 1), taking into account that an average 75% of the PG is present as free amine (the transferable form). The results are presented in table 10. The appropriate mass transfer coefficient for physical extraction Kov,phys (from table 9) is indicated as well. In this way, the enhancement of mass transfer by reaction was determined. Table 10: Reactive extraction of PG at various stirrer rates and interfacial areas.
Case Stirrers rpm
Area cm2
[R-PG]bulk,1,ini kmol/m3
Nini kmol/m3/s
Kov,chem m/s
Kov,phys m/s
EA
1 140/140 35 5⋅10-4 6.6⋅10-8 7.8⋅10-6 2.9⋅10-6 2.7
2 190/190 35 5⋅10-4 8.3⋅10-8 1.0⋅10-5 3.7⋅10-6 2.7
3 190/190 24 5⋅10-4 5.7⋅10-8 1.0⋅10-5 3.7⋅10-6 2.7
4 190/190 35 3⋅10-4 5.1⋅10-8 1.0⋅10-5 3.7⋅10-6 2.7
It is clear from the table that the mass transfer is enhanced by the reaction: in all cases, the initial extraction rate is a factor 2.7 faster than would have been expected for purely physical transport. This result indicates that the reaction is fast or very fast. Conventional regime analysis is a less suitable tool to study the system, because of the reversible reaction and the non-negligible resistance to mass transfer in the non-reactive phase. Application of conventional regime analysis indeed gives contradictory results. Compare the values for the initial extraction rate (Nini) in table 10 with table 1: the linear

Chapter 5
121
response of the system to a change in stirring rate means that the system is not in regime 1 or 3. A decrease of interfacial area in the cell by 40% resulted in a 40% lower initial extraction rate, which rules out regime 1. Finally, the response of the system to the change in PG-concentration shows that the system is not regime 4 either. So, according to the analysis, the system is in regime 2, but in this regime there is no enhancement of mass transfer. The regime analysis ends in a contradiction, which means that either the regime analysis fails or the system is not in one of the limiting regimes, but somewhere in between. As the regime analysis alone cannot be used to clarify the behaviour of the PG-crown ether system, the experimental results were compared with simulation results of the homogeneous reaction model. Parameters kL1 and kL2 from table 9 are used in the simulations. In this way, a maximum enhancement factor of about 3 is predicted. This value is close to the experimentally obtained value for EA, which indicates that the reaction rate is very fast (‘instananeous’, regime 4). The almost proportional effect of an increase in stirrer rate (entry 1 and 2 in table 10) also points at ‘regime 4’ rather than ‘regime 3’. For a more direct comparison, an experimental concentration profile is represented in figure 8 along with simulated curves for various reaction rate constants, using the appropriate experimental parameters. The reaction constants were chosen in such a way that they represent all four major regimes (table 3). It can be seen that the experimental data are best represented by the
curves with k1,1 > 3⋅105, indicating a very fast reaction. A more precise determination of the
reaction rate constants cannot be obtained in this set-up.
0.0
0.1
0.2
0.3
0.4
0.5
0.6
0 100 200
Time (min)
[R-P
G] a
q m
M
k1 3e-3
k1 8
k1 3e3
k1 3e5
k1 3e7
exp data
exp data,scaled
Figure 8: Experimental data and model simulation for reactive extraction of PG, 25 °C,
190/190 rpm, 0.5 mM R-PG, 3 mM crown ether. ‘Scaled’ experimental data in the figure were
scaled slightly to obtain the start and end concentrations from the simulation.

Reaction kinetics
122
5.5.3 Reactive extraction of PEA One reactive extraction experiment was carried out with PEA as extracted component. The resulting concentration profile is given in figure 9 along with the (predicted) profile for physical mass transfer only (leading to the same equilibrium value). It can be seen that there is no clear enhancement of mass transfer; EA is between 1 and 1.2.
0.00
0.10
0.20
0.30
0.40
0.50
0.60
0 50 100 150 200Time (min)
[S-P
EA
] aq m
Mexp
fit, reactive
fit, physical
Figure 9: reactive extraction of PEA by crown ether; stirrer speed 190/190 rpm. Prediction of
physical extraction from data in table 8.
The absence of mass transfer enhancement suggests regime 1 or 2. However, because the resistance to mass transfer for this system is almost completely located in the aqueous phase, it is just as well possible that the reaction is very fast, but that the enhancement is not observed (equation 11). gPROMS simulations were carried out using the estimated ‘acid-base’ corrected values for kL1 and kL2, the other parameters for PEA and k1,1 values from table 3. It can be seen in figure 10 that the experimental concentration decreases faster than the fastest model prediction, which suggests that the acid-base correction was not sufficient. More important, all curves with k1,1 > 8 (regime 2 and higher) coincide, which means that no (effective) enhancement of mass transfer can be observed in this system anyway. It can be concluded that the Lewis cell is not a suitable model reactor to study the true reaction kinetics of the PEA system: no conclusion can be drawn on the kinetics because the aqueous phase resistance to mass transfer is too large. These kinetics should be studied in a model reactor in which the aqueous-phase resistance is eliminated or drastically reduced. During the equilibrium experiments of PEA in the highly agigated vessel (chapter 4), it was observed that the colour change which is associated with the complexation reaction took place almost immediately upon addition of the extractant. The colour change was fast both for PG and PEA extraction, and also for the other amines studied. This suggests strongly that the reaction rate for the PEA case is very fast as well.

Chapter 5
123
0.0
0.1
0.2
0.3
0.4
0.5
0.6
0 100 200
Time (min)
[S-P
EA
] aq m
M
k1 = 3e-3
k1 = 8
k1 = 3e3
k1 = 3e7
exp datauncorr
exp datacorr
Figure 10: Experimental data and model simulation for reactive extraction of PEA, 25 °C,
190/190 rpm, 0.5 mM R-PEA, 3 mM crown ether. ‘Scaled’ experimental data in the figure
were scaled slightly to obtain the start and end concentrations from the simulation
5.5.4 Reactive extraction of DL-leucine by Cu(II)-C12Hyp In this part, the reaction kinetics in the reactive extraction of leucine by the Cu(II)-C12Hyp system in water/butanol are studied. The main equilibria in this system are presented schematically in figure 1b. The transferable species is the neutral leucine ion (‘HD’ and ‘HL’), which is a zwitterion. Some of the equilibria involved are presented in figure 2; other side reactions that play a role in this system are aqueous-phase complexations between Cu2+ ion, acetate ions (buffer) and leucine anions, zwitterions and cations. More details are reported by Koska & Haynes24 or can be found in chapter 2. Furthermore, the enantioselective reaction is a ligand exchange reaction, and the liberated ligand HLi will complex again with Cu2+ ions from the aqueous phase. It may be clear that the various side reactions in this system complicate the analysis of experimental extraction data: the actual zwitterion concentration cannot be determined. The behaviour of the system may be modelled by assuming that all reactions are instantaneous except for the ligand-exchange reaction, but the resulting model is complicated and suggests a degree of precision that cannot be justified by the available information. Instead, it was decided to carry out physical and reactive extraction experiments under the same circumstances, in terms of buffer concentration, copper concentration and pH, in order to work with equal concentrations of the zwitterion. In this way, an estimate of the reaction rate or regime can be obtained by studying if enhancement of mass transfer is obtained. The experimental approach was the same as with the crown ether system. The result of a reactive extraction experiment at 140/140 rpm is plotted in figure 11. Kov,phys for leucine in
water/butanol at 140/140 rpm stirrer rate was determined to be 6⋅10-6 m/s. This coefficient

Reaction kinetics
124
was used to generate the prediction of physical mass transfer rate in figure 12, using the equilibrium distribution ratio of the reactive system.
0
0.2
0.4
0.6
0.8
0 100 200Time (min)
[D-le
u] a
q m
M
exp
fit reactive
fit physical
Figure 11: reactive extraction of D-leucine with Cu(II)-C12Hyp system; stirrer speed 140/140
in each phase.
Additional experiments were carried out at larger stirring rates in both phases (190/190 rpm) and with a smaller interfacial area, using the polypropylene balls floating at the interface. The results are presented in tabel 11. As mentioned, the initial flux Jini is based on the total leucine concentration; the presented mass transfer coefficients are therefore uncorrected for the available concentration of neutral leucine. Because the mass transfer coefficients are all the same factor off the correct value, the enhancement of mass transfer can be determined well. Table 11: reactive extraction results for separation of DL-leucine with Cu(II)-C12Hyp
complex, 25 °C, water/butanol.
stirrer (rpm)
area (cm2)
Jini kmol/m2/s
Nini kmol/m3/s
‘Kov,phys’ m/s
‘Kov,chem’ m/s
EA
140/140 35 6.2⋅10-9 1.3⋅10-7 6⋅10-6 8⋅10-6 1.3
140/140 20 6.2⋅10-9 7.7⋅10-8 6⋅10-6 8⋅10-6 1.3
190/190 35 7.9⋅10-9 1.7⋅10-7 7.8⋅10-6 1⋅10-5 1.3
It can be seen that there is no large enhancement of mass transfer rate under these circumstances, EA is about 1.3. Given the low value of the physical partitioning (m ~ 0.2) and the about 5 times higher viscosity of butanol compared to toluene, it is very unlikely that the resistance to mass transfer is entirely located in the aqueous phase, as was the case for PEA. With a substantial contribution of both phases to the overall resistance in this system, enhancement of mass transfer by reaction should be clearly visible if the reaction is really fast. It is therefore concluded that the reaction in this system is ‘rather slow’ compared to the mass transfer: between ‘regime 2’ and ‘regime 3’. The observed response of the system to a change

Chapter 5
125
in area and in stirrer rate is consistent with this conclusion. A more quantitative result in terms of rate constant can only be given if a rate law is assumed, but this was not attempted.
5.5.5 Consequences for equipment design The reaction rate in the crown ether system is very high. Therefore it is not expected that the reaction rate will be limiting the extraction operation in large-scale equipment. For efficient operation, the aqueous phase mass transfer needs to be promoted, especially for lipophilic enantiomers like phenylethylamine (PEA). This may be done by making an appropriate column design. On the other hand, the reaction rate in the leucine system may retard the overall extraction rate in a contactor with faster mass transfer characteristics, although no definite conclusions can be drawn based on the available data. Further characterisation of this reaction was not carried out.
5.5.6 Comparison crown ether system-C12Hyp system The reaction rate in the Cu(II)-C12Hyp system was found to substantially lower than the reaction rate in the crown ether extractant system. This difference may be explained qualitatively by the chemistry of the two systems. The reaction of leucine with the Cu(II)-C12Hyp complex is a ligand-exchange reaction, involving a ligand entering, a ligand leaving and a proton transfer from the entering ligand (leucine) to the leaving ligand (C12Hyp). This is a more complicated reaction scheme than the adduct formation between the amino-alcohol or amine and the crown ether, and may be considerably slower.
5.5.7 Lactic acid/alamine 336 system from literature It can now be explained why the regime analysis could be used succesfully to study the reactive extraction of lactic acid/alamine 336.10,11 In these publications, it was observed in the experiments that the extraction rate in this system did not change with stirrer speed. The two phases were stirred with blades mounted on the same stirrer shaft. This means that the resistance to mass transfer in the aqueous phase had to be negligible in this system, although it was not stated explicitely in the original contribution nor determined in a physical extraction measurement. The negligible resistance to mass transfer in the aqueous phase is probably caused by the combination of a very low physical partitioning ratio and a highly viscous organic phase (= octanol or decanol with high concentration of organic extractant). If there is no resistance to mass transfer in the non-reactive phase, regimes 2 and 3 in reactive extraction can be identified with ‘conventional’ regime analysis. In this case, the system turned out to be in regime 3. If the Ha-number and the enhancement factor are estimated from the experimental data, it can be seen that indeed EA ~ Ha. The analysis would have failed in regime 1 (because of the use of initial extraction rates) or in regime 4 (because of the reversibility of the reaction).
Reaction kinetics
126
5.6 Conclusion The regime analysis that is used with the homogeneous reaction model fails for reactive extraction in a number of regimes: ‘regime 1’ cannot be found if initial extraction rates are used; ‘regime 3’ cannot be identified if the resistance to mass transfer in the non-reactive phase cannot be neglected; and ‘regime 4’ cannot be identified because of the reversibility of the reaction. However, it is possible to measure if the chemical reaction causes enhancement of mass transfer, by comparing the initial extraction rates with and without reaction. To do so, the physical extraction rate should be high enough to be obtained experimentally, and the fraction of the substance present as the ‘transferable’ species should be the same in both experiments, i.e. by working at the same pH, additives concentrations and physical properties. After that, information on the chemistry and physical properties of the system (such as partitioning ratio, partial mass transfer coefficients and side reactions) should be used to judge if enhancement of mass transfer would be observable in this system anyway. This approach was followed for the chiral systems of interest. It was found that the reaction between the chiral azophenolic crown ether and phenylglycinol or phenylethylamine in toluene is very fast in relation to mass transfer. Enhancement of mass transfer was found for phenylglycinol, but could not be observed for phenylethylamine, probably because the main resistance to mass transfer in this system is located in the aqueous phase. The regime of the ligand-exchange reaction applied for the chiral separation of DL-leucine was found to be between ‘slow’ and ‘fast’ reaction. As for the model contactor, it is recommendable in any case to work with equipment in which the partial mass transfer coefficients can be varied separately. In this way, the main resistance to mass transfer can be obtained experimentally. To identify the true reaction kinetics, the Lewis cell is not the most suitable reactor. It would be better to work with equipment in which the resistance to mass transfer in the non-reactive phase is negligible, and in which the resistance in the reactive phase is lower than in the Lewis cell and can be varied over a wider range, such as the rotating diffusion cell or novel, to-be-developed equipment.
References 1 Bart H-J. Reactive extraction. Berlin: Springer;2001. 209 p. 2 Bart H-J, Slater MJ. Standard test system for reactive extraction – Zinc/D2EHPA. European Federation of Chemical Engineering, working party on distillation, absorption and extraction, 2001. www.dechema.de 3 Poposka FA, Nikolovski K, Tomovska R. Kinetics, mechanism and mathematical modelling of extraction of citric acid with isodecanol/n-paraffins solutions of trioctylamine. Chem Eng Sci 1998;53(18):3227-3237 4 Reschke M, Schügerl K. Reactive extraction of Penicillin. III: Kinetics. Chem Eng J 1984;29:B25-B29

Chapter 5
127
5 Lee SC. Kinetics of reactive extraction of Penicillin G by Amberlite LA-2 in kerosene. AIChE Journal 2004;50(1):119-126 6 Westerterp KR, Swaaij WPM van, Beenackers AACM. Chemical reactor design and operation. Chichester:John Wiley and Sons;1997 7 Doraiswamy LK, Sharma MM. Heterogeneous reactions: analysis, examples, and reactor design. New York:John Wiley & Sons;1984 8 Nymeijer K, Visser T, Brilman W, Wessling M. Analysis of the complexation reaction between Ag+ en ethylene. Industrial & Engineering Chemistry Research 2004;43(11):2627-2635 9 Gaidhani HK, Wasewar KL, Pangarkar VG. Intensification of enzymatic hydrolysis of penicillin G: Part 1. Equilibria and kinetics of extraction of phenyl acetic acid by Alamine 336. Chem Eng Sci 2002;57:1979-1984 10 Wasewar KL, Heesink ABM, Versteeg GF, Pangarkar VG. Equilibria and kinetics for reactive extraction of lactic acid using Alamine 336 in decanol. J Chem Tech Biotech 2002;77:1068-1075. 11 Wasewar KL, Pangarkar VG, Heesink ABM, Versteeg GF. Intensification of enzymatic conversion of glucose to lactic acid by reactive extraction. Chem Eng Sci 2003;58:3385-3393 12 Atherton JH. Methods for study of reaction mechanisms in liquid/liquid and liquid/solid reaction systems and their relevance to the development of fine chemical processes. Trans ICHemE, 1993;71(part A):111-118 13 Danesi PR, Chiarizia R. The kinetics of metal solvent extraction. In: Campbell B, editor. CRC critical reviews in analytical chemistry, vol 10(1). CRC Press;1980. p. 1-126 14 Sharma MM. Extraction with reaction. In: Lo TC, Baird MHI, Hanson C, editors. Handbook of solvent extraction. New York:John Wiley & Sons;1983. p. 37-52 15 Hughes MA, Rod V. A general model to account for the liquid-liquid kinetics of extraction of metals by organic acids. Proc. of International Solvent Extraction Conference ISEC 1983, Denver, USA, 14-15 16 Szymanowski J. Kinetics and interfacial phenomena. Solv Extr Ion Exch 2000;18(4):729-751 17 Hanna GJ, Noble RD. Measurement of liquid-liquid interfacial kinetics. Chem Rev 1985;85:583-598 18 Naemura K, Nishioka K, Ogasahara K, Nishikawa Y, Hirose K, Tobe Y. Preparation and temperature-dependent enantioselectivities of homochiral phenolic crown ethers having aryl chiral barriers: thermodynamic parameters for enantioselective complexation with chiral amines. Tetrahedron: Asymmetry 1998;9:563-574. 19 Takeuchi T, Horikawa R, Tanimura T. Enantioselective solvent extraction of neutral DL-amino acids in two-phase systems containing N-n-alkyl-L-proline derivatives and copper(II) ion. Anal Chem 1984;56:1152-1155. 20 Doraiswamy LK. Organic Synthesis Engineering. Oxford: Oxford University Press;2001 21 Duchateau ALL, Hillemans MG, Hindrikx I. Enantiomeric separation of primary alkylamines; a comparison of direct and indirect HPLC methods. Enantiomer 1997;2:61-67 22 Reid RC, Prausnitz JM, Poling BE. Chapter 11 in: The properties of gases & liquids, 4th edition. McGraw-Hill;1988 23 Hogendoorn JA, Vas Bhat RD, Kuipers JAM, Swaaij WPM van, Versteeg GF. Approximation for the enhancement factor applicable to reversible reactions of finite rate in chemically loaded solutions. Chem Eng Sci 1997;52(24):4547-4559 24 Koska J, Haynes CA. Modelling multiple chemical equilibria in chiral partition systems. Chem Eng Sci 2001;56:5853-5864

Reaction kinetics
128

Chapter 6
129
6 Multistage equilibrium modelling of fractional reactive
extraction for chiral separation 6.1 Introduction In the previous chapters, an azophenolic crown ether was identified as a versatile enantioselective extractant for separation of amino-alcohols and amines. The influence of various process parameters on the operational selectivity and distribution ratios in a single stage was studied experimentally for this extractant and a predictive single stage equilibrium model was constructed and validated (chapter 4). The main parameters in this model are the chemical properties of the system (complexation constants KR and KS, physical partitioning ratio P and acid-base dissociation constant KA) and the process conditions (temperature, pH,
concentrations of extractant [C] and racemic mixture [rac] and phase ratio Φ). The enantiomer
that complexes the most strongly with the crown ether has the largest distribution ratio and is recovered from the extract, whereas the raffinate will contain primarily the less strongly complexed enantiomer. The extent of extraction is characterised by the distribution ratios DR and DS for each enantiomer:
aqaq
orgorg
allformsaq
allformsorgR HRR
RCR
R
RD
][][
][][
][
][
,
,
+++
== (1)
allformsaq
allformsorgS S
SD
,
,
][
][= (2)
The operational selectivity αop is defined by the ratio of distribution ratios. Its upper limit is
the intrinsic selectivity αint, which is the ratio of the complexation constants:
S
Rop D
D=α assuming DR > DS (3)
S
R
K
K=intα (4)
The equations of the single stage equilibrium model and the experimental validation are
already discussed in chapter 4. The influence of the model parameters on D and αop can be
summarised as follows:
• The distribution ratios are a complex function of all process parameters. A larger D is caused by larger KR, KS, pH, [C], P and (usually) lower T. Especially the pH and [C] influence the D’s. The attainable distribution ratios range from <<1 to >>1.

Multistage model
130
• The selectivity is mainly determined by [C] and KR and KS. αop ranges from 1 to αint, αint
can be approached closely if KR⋅[C]eq > 10. The temperature influences the intrinsic
selectivity (and the magnitude of KR and KS); the other parameters such as [rac] and pH have a small influence on the operational selectivity.
As only a partial separation can be reached in a single stage (figure 1a), staging has to be applied to reach a specified purity and yield. The fractional extraction scheme1,2 is used to be able to obtain both enantiomers at the required purity (figure 1b). In a fractional extractor, additional degrees of freedom are introduced:
• number of stages N
• location of feed stage
• flow rate ratios S/F and W/S (or W/F), replacing the phase ratio Φ
The influence of the various process parameters on the single stage extraction will be reflected in the behaviour of the multi-stage extractor. To gain insight in the behaviour of a complete extractor, a multistage equilibrium model is constructed in this chapter based on the single stage model developed in chapter 4. Such a model is a rather accurate description of a cascade of mixer-settlers, and can be applied to describe the extraction process in column contactors.
aq org
HR+ H+ + R R + C RCKRPpK
HS+ H+ + S S + C SCKSPpK
4
3
2
1
FEEDR,S
WASH
RAFFINATES
SOLVENTC
EXTRACTR, C
washsection
stripsection
Figure 1: (a) single extraction stage: main equilibria between enantiomers ‘R’ and ‘S’ and
enantioselective extractant ‘C’; (b) fractional extraction scheme, assuming KR > KS.
From the set of model enantiomers used in previous work (chapter 4), two substances were selected for the multistage modelling study: phenylethylamine and phenylglycinol. These compounds differ in complexation strength with the crown ether (KR, KS), in intrinsic selectivity and in physical partitioning. The relevant parameters are presented in table 1.

Chapter 6
131
Table 1: Data on phenylglycinol and phenylethylamine. Partitioning ratios and complexation
constants with crown ether in toluene. Parameters at T = 25 °C
Phenylglycinol (PG) Phenylethylamine (PEA)
KR = 12000 [m3/kmol] KR = 330 [m3/kmol] KS = 1200 [m3/kmol] KS = 900 [m3/kmol] P = 0.1 [-] P = 4 [-] pKA = 8.5 pKA = 9.4
OH
NH2
*
NH2
*
From short-cut calculation methods based on the Kremser equation (chapter 2), it is clear that the operational selectivity in one stage mainly determines the required number of stages for a certain product purity. It can be stated that the larger the selectivity, the lower the stages requirement. The capacity of extraction (expressed as distribution ratio) influences the required solvent-to-feed ratio and wash-to-feed ratio, and thus the productivity. This effect is reflected in the extraction factors. In a fractional extractor, the extraction factors in the wash section for each enantiomer (‘R’ and ‘S’) are given by:
W
SDE RR ⋅= and
W
SDE SS ⋅= (5)
and in the strip section:
FW
SDE RR +
⋅= and FW
SDE SS +
⋅= (6)
According to literature,1,2 a ‘symmetrical’ separation (= equal purity in extract and raffinate) is obtained with the fractional extraction scheme if:
SR DDS
W ⋅= (7)
This condition implies that the product of the extraction factors ER and ES is unity in both sections, with one E larger than unity and the other one smaller than unity, and that the feed is entered in the middle of the extractor. The ratio of ER and ES equals the operational selectivity. This condition only leads to a symmetrical separation if ER and ES are constant over the extractor, so if the distribution ratios are constant and if the phase ratio is the same in both sections of the extractor, so if W >> F. Under these circumstances, the optimal W/S ratio can be determined directly from the values of DR and DS, and extractor design is rather

Multistage model
132
straightforward. In some literature reports 3 , 4 on chiral separation by fractional reactive extraction in a pilot set-up, it is attempted to measure the distribution ratios and then set the wash flow to its optimal value by applying equation 7. If the experimental conditions in this literature are considered, the conditions of ‘constant D’s’ and ‘constant flow rate ratio in both sections’ seem to be fulfilled: a large excess of extractant is used (100-1000), so the variation of D and selectivity from stage to stage is eliminated; and W is large compared to F, so the phase ratio in both sections of the extractor is also more or less constant (W ~ W+F). So, the extraction factors are indeed constant. However, for a more economical mode of operation than found in the literature cited above, it is desirable to work at higher enantiomer concentrations and minimal excess of extractant (to increase the volumetric capacity, and to limit the inventory of expensive extractant), and to minimise W and S (to allow a larger throughput and/or a better volumetric capacity, and to limit the dilution of the product in the raffinate). In such a real extractor, the extraction factor is determined by the phase ratio in each section, and by the local distribution ratio on each stage; so the local E may vary from section to section and from stage to stage. It is expected that under these conditions the optimal W/S ratio and other process conditions cannot be found from formula (7), but should be deduced from the multistage model. It is therefore the aim of this chapter to study with the multistage model which combinations of process parameters generate a specified yield and product purity in a multistage extractor. The role of the local operational selectivity and extraction factors are studied in order to understand the deviations from Kremser-like shortcut model predictions. The consequences for the design of a multipurpose extractor will be discussed qualitatively.
6.2 Simulations Each stage in the multistage model is described by the single stage equilibrium model described in chapter 4. The exiting streams of each stage are assumed to be in equilibrium. The stages in the multistage model are connected countercurrently (fig. 1b): equations of the form eq. 8 and 9 are present for each species i: R, S, HR+, HS+, C, RC and SC:
Aqueous stream: inNoutN ii ,1, ][][ += (8)
Organic stream: inNoutN ii ,,1 ][][ =+ (9)
A fractional extractor consists of two sections, a strip section and a wash section. The feed is entered between the sections and is mixed instantaneously with the aqueous stream that exits the wash section. As measure for optical purity of the raffinate and the extract, the enantiomeric excess (e.e.) is used.5 If enantiomer R predominates in a stream, its e.e. is

Chapter 6
133
defined in equation 10. Note that ‘R’ and ‘S’ encompass R and S in all forms (R, HR+, RC, etc.) in this equation.
][][
][][..
SR
SRee
+−= (10)
If enantiomer S is present in the largest concentration, the e.e. of the stream is defined by equation 11:
][][
][][..
SR
RSee
+−= (11)
The yield of the enantiomer R in the extract is given in equation 12. Similarly, the yield of each enantiomer in each stream can be defined.
][
][, mol
mol
feedRtotal
extractRtotalyield EXTRACTR = (12)
The yields and e.e.’s in extract and raffinate are coupled by the mass balance, with two degrees of freedom in steady-state operation. If for instance the optical purity in the extract is specified (such as ‘0.98 e.e.’) as well as the yield (such as ‘0.99 yield’) then the optical purity and the yield of the other enantiomer in the raffinate are fixed as well; and the purity and yield in the raffinate will also be high. Even if one of the two enantiomers is much less interesting than the other one, the optical purity of both enantiomers should be high in their appropriate exit streams, to ensure a good yield of the desired enantiomer. If the purity of the undesired enantiomer is low, it means that much of the desired enantiomer leaves the extractor in this stream. Therefore, the specification for the e.e.’s in extract and raffinate is set to 0.98 each, which results automatically in a yield of 0.99 in each stream of the desired enantiomer. The process parameters that were studied in chapter 2 and 4 are also studied in these simulations: the temperature, pH and the concentrations of extractant and enantiomer. The concentrations of extractant and enantiomer are expressed as ‘extractant excess’ (equation 13) and ‘concentration level’, which is the specific concentration level at a fixed extractant excess.
feed
solvent
racF
CSttanextracexcess
][
][
⋅⋅= (13)
Furthermore, the influence of the flow rate ratios S/F and W/S (or W/F; either two ratios are sufficient) are studied. Then, the required number of stages to obtain the required purity of
Multistage model
134
0.98 e.e. in each stream is studied. The stages are divided evenly over the two sections, unless mentioned otherwise. Finding process conditions at which the e.e. is 0.98 in each exit stream involves a lot of trial and error. To reduce the simulation time, the influence of process conditions is studied by doing simulations at a fixed number of stages of 4 (2 in each section); the specification of ‘e.e. = 0.98 in each stream’ is exchanged for ‘equal e.e. in each stream’. This specification again ensures the best yield at best purity. It is assumed here that the process conditions which lead to higher e.e. with a fixed number of stages also lead to the lowest stages requirement for a fixed product purity, or at least that all trends observed with four stages hold at higher stage number as well. The validity of this assumption will be demonstrated. Furthermore, it was seen in the simulations that a single parameter change always results in a lower e.e. in one stream and a higher e.e. in the other stream if all other parameters are kept constant, and there is no unambiguous way to judge if the parameter change results in an improved or deteriorated separation. Therefore, adaptation of the W/S ratio is used after each process parameter change to ‘shift’ the e.e.’s in extract and raffinate to reach the point where the e.e. in the raffinate equals the e.e. in the extract. This point (new e.e. and new W/S) can be compared with the results for the old parameter setting. In order to explain some of the observed influences of the process parameter changes on the separation, the local operational selectivity and distribution ratios (thus extraction factors) were calculated from the concentration profiles. After discussing the influence of process parameters on extractor performance, a number of ‘combinations of process parameters’ are presented which lead to an e.e. of 0.98 in extract and raffinate for separation of phenylethylamine (PEA). This set of ‘operating points’ will be used as basis for the discussion of an optimal extractor design.
6.2.1 Numerical method The multistage model is implemented in gPROMS (PSE Ltd., London, UK). All equilibrium conditions and mass balances on all stages are solved simultaneously. This involves solving a large system of non-linear equations. The maximum number of stages that the model can solve is about 80; this number depends slightly on the chosen settings. The pH is assumed to be constant over the extractor and is given as an input value; although calculation of the electroneutrality balance (to identify the pH at equilibrium) is possible, the additional equilibrium condition would result in a larger set of equations for each stage, and therefore in a too severe restriction in the amount of stages that can be calculated.

Chapter 6
135
6.3 Results
6.3.1 Influence of W/S ratio In figure 2, the influence of a change in W/S ratio on e.e. and yield is presented. It can be seen that at constant S/F, a higher W/S results in a more pure extract stream, but in a less pure raffinate stream. Secondly, the yield of the desired enantiomer in the extract stream decreases with increasing wash stream. With increasing W/S, more of the undesired (less strongly complexed) enantiomer is washed out of the extract, but along with the undesired enantiomer, some of the strongly bound desired enantiomer is also washed back to the aqueous stream. It can be seen from figure 2 that adaptation of W/S can be used to reach the point where the e.e.’s in both streams are equal (indicated with arrows). Because of the mass balance, the yields are equal there as well. As stated, this adaptation of W/S is used after each other process parameter change to find the ‘equal e.e.’ point which is used to study the influence of the process parameters. Any concentrations indicated are initial concentrations in the respective streams.
0
0.2
0.4
0.6
0.8
1
0 1 2 3 4W/S
e.e.
0
0.2
0.4
0.6
0.8
1Y
ield
e.e. raff e.e. extryield raff yield extr
Figure 2: Influence of W/S ratio on e.e. and yield for PG separation, S/F = 1, pH 8.8, T=25
°C, [C]=0.01 M, [rac-PG]=0.01 M, 2+2 stages. Equal e.e./yield point indicated with arrows.
6.3.2 Influence of temperature, pH, extractant excess and concentration level In this paragraph, the effect of various process parameters is presented. Each time, a new process parameter value was used as input, and then W/F was adapted to find the operating point with equal e.e.’s (and equal yields). Only these ‘equal e.e.’ points are presented in further graphs. The process parameters of interest are resp. temperature (fig. 3a) pH (fig. 3b), extractant excess (either by S/F or by [C]) (fig. 4a) and concentration level (fig. 4b). The

Multistage model
136
results for S/F and [C] changes are combined in the graph ‘extractant excess’ to show the similarities.
0
10
20
30
40
0 10 20 30
T [°C]
W/F
0
0.2
0.4
0.6
0.8
1
e.e.
PG
PG
PEA
PEA
0
5
10
15
20
7.5 8.5 9.5 10.5
pHW
/F
0
0.2
0.4
0.6
0.8
1
e.e.
PG
PG
PEA
PEA
(a) (b) Figure 3: (a) influence of temperature on ‘equal e.e.’ points (W/F, e.e.) for separation of PEA
or PG; pH (PEA) =9.4, pH (PG) = 9.1, 2+2 stages, S/F=2 with [rac] =0.01 M and [C]=0.01
M. Lines are trendlines (only two data points were available) (b) influence of pH on ‘equal
e.e.’ points (W/F, e.e.) for separation of PEA or PG, 25 °C, 2+2 stages, S/F=2 with [rac]
=0.01 M and [C]=0.01 M.
0
5
10
15
20
0 2 4 6 8 10
extractant excess [-]
W/F
0.75
0.8
0.85
0.9
e.e.
S/F=1
S/F=1
[C]= 0.01
0
10
20
30
40
0 0.02 0.04
[C] = [rac], M
W/F
0
0.2
0.4
0.6
0.8
1
e.e.
PG
PEA
PEA
PG
(a) (b) Figure 4: (a) influence of extractant excess on separation, PG data only; extractant excess
either by increased S/F (then [C]= 0.01) or by increased [C] (then S/F=1), pH 8.8, 2+2
stages (b) influence of concentration level on equal e.e. points (W, e.e.) for separation of PEA
or PG, data for 25 °C, 2+2 stages, S/F=2 with [rac] = [C] (= constant extractant excess of
2). pH (PEA) =9.4, pH (PG) = 9.1

Chapter 6
137
Figure 3 and 4 will first be discussed in a general way, because there are many common trends which can all be explained by the same causes. It can be seen in figure 3 and 4 that for both PG and PEA an increase in extractant excess, an increase in pH, a decrease in temperature or a higher overall concentration level all result in an ‘equal e.e.’ point at a higher e.e. in both streams and at a higher W/S ratio. By each of these changes, the extent of complexation between crown ether and both enantiomers increases: more RC and SC complexes are formed. The yield in the extract increases, but the e.e. decreases; vice-versa, the purity in the raffinate increases, but the yield decreases. If now the wash stream is increased as well, more enantiomer is washed back from the extract, and equal yield and purity are obtained in extract and raffinate. The overall result is a larger W/S requirement to reach this equal e.e. point, and a better e.e. in both exit streams. The increase in e.e. by each of the above process parameter changes can have two main causes. The first explanation for the increase of e.e. at higher extent of complexation is an increase of operational selectivity in the single stage. This effect can be illustrated by calculating the local operational selectivity for the separation of PEA at three ‘concentration levels’ for the ‘equal e.e.’ points from figure 4b. The average operational selectivity over the extractor is given in figure 5 as a function of concentration level. It can be seen that the operational selectivity increases considerably with increasing concentration level. If the extent of complexation increases, the operational selectivity in each stage increases until it approaches the intrinsic
selectivity (see also chapter 4). αint is 2.7 under the circumstances given here, indicated by the
dotted line. An increase of single-stage operational selectivity from 1.95 to 2.54 has a large effect on the e.e. that can be obtained in a four-stages contactor (figure 4b). Likewise, this selectivity increase will result in a decrease in required number of stages if a product purity is specified.
1
1.5
2
2.5
3
0 0.01 0.02 0.03 0.04
[C]=[rac], M
αo
p, a
vera
ge
[-]
Figure 5: Influence of concentration level ([rac]=[C]) on realised operational selectivity for
PEA separation, parameters as in figure 4b. Dotted line: αint = 2.73 (25 °C)

Multistage model
138
The second cause for an increase of e.e. with certain process parameter changes is the effect of these process parameters on the local extraction factors (equation 5+6) and their variations. The variation of local E’s can be demonstrated by comparing the local operational selectivity and extraction factors for separation of PG as a function of pH (figure 3b). In table 2, the local
E and αop are presented for two pH values.
Table 2: Local distribution ratios and extraction factors for PG separation, data as in figure
3b. Resulting e.e. = 0.854 for pH 9.1, and e.e. = 0.790 for pH 7.9
pH 9.1 7.9
section wash wash strip strip wash wash strip strip stage 1 2 3 4 1 2 3 4
DR 7.32 6.62 5.94 8.03 1.84 1.73 1.66 2.08 DS 0.80 0.73 0.67 0.87 0.20 0.19 0.18 0.23
αop 9.11 9.02 8.92 9.18 9.11 9.05 9.02 9.20
Φ 0.70 0.70 0.52 0.52 5.13 5.13 1.44 1.44 ER 5.12 4.63 3.08 4.16 9.44 8.87 2.39 2.99 ES 0.56 0.51 0.34 0.45 1.04 0.98 0.27 0.33
It can be seen in table 2 that the operational selectivity αop is rather constant along the
extractor, whereas αop is even slightly higher for pH 7.9 than for pH 9.1. Therefore, the
increase in e.e. at higher pH cannot be explained by an operational selectivity effect. Instead, the local extraction factors should be considered. If on a certain stage both extraction factors are larger or smaller than one, that stage is counter-productive: one of the enantiomers is transported in the wrong direction. If an extraction factor is unity, that stage does not contribute to the purification of that enantiomer. In fact, on each stage for which the product of the extraction factors is not unity, the mass transfer process is not optimal. As a result, the product purity is lowered with each variation in extraction factor and consequently a larger number of stages is required to obtain a certain product purity. The variation of E’s with stage number is shown graphically in figure 6.

Chapter 6
139
0
2
4
6
8
10
1 2 3 4
stage nr
E [-
]
R pH 9.1
S pH 9.1
R pH 7.9
S pH 7.9
Figure 6: Variation of extraction factor E from stage to stage for PG separation at two pH
values. Data from table 2. E=1 indicated by straight line.
In the case of pH 7.9, the variation in local extraction factors is much larger than for pH 9.1. Therefore, some of the local extraction factors have unfavourable values. The large variation in E’s is mainly caused by the very small wash flow found at the ‘equal e.e.’ point for pH 7.9. As a result, the phase ratio in the wash section (=S/W) is very different from the phase ratio in the strip section (=S/(W+F)), and the extraction factors vary largely. This effect is also present at pH 9.1 (W/F=2.86), but much less pronounced. The lower wash flow requirement with lower pH is caused by the lower distribution ratios. Secondly, because of the variation in local concentrations, there is also a variation in distribution ratio from stage to stage (table 2), which adds to the variation in E’s. So, variation of E can be caused either by a variation of
distribution ratios from stage to stage, or by flow rate ratio variation (i.e. W≠ W+F), or by a
combination of both effects. Secondly, the two causes of a change in e.e. (change in operational selectivity and change in local extraction factors) often occur in parallel. Only in some cases one effect is dominant. It can be concluded from the above that the lowest amount of stages is required if:
• the operational selectivity is close to the intrinsic selectivity
• there is no variation in extraction factors along the extractor This situation is approached most closely if the excess of extractant is set high, to ensure high operational selectivity and low variation in E’s from stage to stage, and if conditions are chosen that yield high distribution ratios, to ensure a high W/F at operating point and consequently low variation of E between wash and strip section. High distribution ratios can be obtained by choosing a high pH, low T and high extractant excess. On the other hand, operating an extractor at high extractant concentration and high S/F and W/F restricts the process capacity and requires a large inventory of extractant. The issue of designing an ‘optimal’ extractor will be discussed in the last paragraph.

Multistage model
140
The differences in physical and chemical properties between PG and PEA are reflected in the main reasons for the e.e. increase with process parameter changes (figure 3 and 4). The complexation between crown ether and phenylethylamine is less strong than between crown ether and phenylglycinol. As a result, for most PG simulations in figure 3 and 4 the operational selectivity is approached within 90% of the intrinsic selectivity, whereas the increase in operational selectivity for PEA upon a process parameter change can be substantial. Vice versa, the distribution ratios tend to be (much) higher for PEA than for PG, mostly because of the large partitioning ratio for PEA. As a result, the required W/F ratio for symmetrical separation is much lower for PG than for PEA. Whereas this lower W/F ratio may be advantageous for the process capacity, it also results in much more variation of the extraction factor in wash and strip section. Therefore, often the increase in PG product purity with a certain change in process conditions can be explained by a reduction of variation in extraction factors over the column, and improved PEA separation can often be explained by an increase in single stage operational selectivity.
6.3.3 Influence of number of stages An underlying assumption in all of the above is that the process parameter change that causes a higher e.e. in the four-stage extractor will also lead to less stages for a certain product specification. To justify this assumption, it was studied which combinations of process conditions and number of stages yield a product purity of 0.98 e.e. in each exit stream. The influence of pH and concentration level on the W/F ratio and required number of stages are presented in figure 7a and b. A larger list of combinations of process conditions that lead to the same purity result is given in the design paragraph in table 3.
0
5
10
15
20
25
8.5 9 9.5 10
pH
W/F
0
10
20
30
40
N
0
10
20
30
40
0 2 4 6 8 10
extractant excess [-]
W/F
0
10
20
30
40
N
(a) (b) Figure 7: PEA separation; e.e. = 0.98 in both extract and raffinate, S/F = 2, [rac-PEA] =
0.02 M, 25 °C (a) Influence of pH on W/F ratio and stage requirement N, [C] = 0.02 M (b)
influence of extractant excess (via increasing [C], [rac-PEA]=0.02 M), pH 8.6.

Chapter 6
141
It can be seen that the trend observed in figure 3b and 4a for PEA separation in four stages is directly reflected in figure 7a and 7b: lower pH or lower extractant excess results in a lower e.e. in four stages and also in a larger stage requirement to reach e.e. = 0.98. Likewise, the effects of the other process parameter changes as given in the previous paragraph are reflected in table 3. It is therefore concluded that all the effects of process parameter changes predicted for the four-stage extractor can be translated directly to predict the effect on the stages requirement for a given purity specification. It was observed in the simulations that if there is no excess of extractant over the enantiomers, a full separation can never be obtained in the fractional extractor although a substantial enantiomeric excess may be found in 2+2 stages. Under these circumstances, the extractant will become fully loaded, and adding more stages will not increase the product purity any further. Therefore, the extractant always has to be present in some excess. The minimal excess is around 1.5 for the conditions studied in this paper, but depends on the strength of the interaction and should be studied for each compound separately. This situation differs from conventional (physical) extraction.
6.3.4 Location of feed stage The location of the feed stage is also a degree of freedom in a fractional extractor. In all simulations so far, the feed stage was located exactly in the middle of the extractor, with an equal amount of stages in the strip section and the wash section. This is the most efficient solution for a symmetrical separation (= e.e. the same in both product streams). However, for a situation in which one enantiomer is the desired product and the other enantiomer is racemised and recycled, an asymmetric product distribution may be preferable, such as 99% e.e. for the desired product and 90% e.e. for the other enantiomer. Such a product distribution can be obtained by using an equal amount of stages in each section and adapting the W/S ratio, or by varying the amount of stages in each section at constant W/S ratio, i.e. by varying the location of the feed stage. Without a detailed economical analysis, it cannot be decided which way (adaptation of feed stage or adaptation of W/S) is most efficient. Therefore no further simulations were carried out.
6.3.5 Reflux The behaviour of an extractor can be studied in more detail by the concentration profiles. In this way, it was observed that the concentration profile is unfavourable in almost all cases. To illustrate this issue and suggest a solution, concentration profiles for the reactive extraction of PG are given in figure 8. Note that the flow direction for the aqueous phase is from 1 to 4, and for the organic phase counter-currently from 4 to 1. The ammonium ions HR and HS were left out for clarity, [C] is negligible in the aqueous phase and neutral [R] and [S] are negligible in the organic phase.

Multistage model
142
0
0.0005
0.001
0.0015
0.002
1 2 3 4
stage nr --> flow direction
[sp
ecie
s]aq
, MR
S
0
0.002
0.004
0.006
0.008
0.01
1 2 3 4
stage nr <-- flow direction
[sp
ecie
s]o
rg, M
CRCSC
(a) (b) Figure 8: PG separation, concentration profiles over 2+2 stages extractor (a): aqueous
phase (b) organic phase. Species: R, S = neutral amine enantiomer, C = extractant, RC and
SC = complexes of enantiomer and extractant. S/F=2, W/F=2.3. [C] = 0.01 M, [rac]feed =
0.01 M, 25 °C, pH 8.8
It can be seen in figure 8b that the concentration of complexes RC and SC decreases towards the extract exit (N=1): a considerable fraction of both complexes decomplexes and is washed back from the organic phase to the aqueous phase, inclusing the more strongly complexed enantiomer (R). The entrance of the clean wash stream gives a large driving force for mass transfer towards the aqueous phase, for both enantiomers. This is very inefficient. Introduction of the more strongly bound enantiomer in the wash stream will (partially) prevent the large concentration drop of this enantiomer in the extract, by reducing the driving force for mass transfer for that enantiomer. This mode of operation is called ‘reflux’. Reflux is a standard part of a distillation design, but in extraction it is not encountered very often. In the FREX operation for chiral separation, the strongest bonded enantiomer is obtained enantiomerically pure in the product stream that exits the back-extraction unit as raffinate 2 (figure 13 in design paragraph), so reflux can be implemented by recycling a small portion of raffinate 2 into the wash stream. The effect of the presence of enantiomer R in the wash stream is that a lower amount of R is washed back from the loaded extract, compared to a clean wash stream. There is no influence on the back-washing of S. As a result, the optical purity in the extract increases. Secondly, the required wash stream flow rate to reach the operating point is reduced slightly, which results in a less dilute raffinate stream. The effect of reflux on e.e.’s in separation of PG is given in figure 9a for a constant wash stream. It can be seen that the purity in the extract increases, and the purity in the raffinate decreases. So, applying reflux also influences the location of the ‘equal e.e.’ point. New

Chapter 6
143
‘equal e.e.’ points were determined by adapting the wash stream. They are presented in figure 9b.
0.7
0.8
0.9
1
0 0.0005 0.001
[R-PG] in wash
e.e.
extract
raffinate
1.8
2
2.2
2.4
0 0.0005 0.001
[R-PG] in wash
W/F
0.84
0.85
0.86
0.87
0.88
e.e.
(a) (b) Figure 9: (a) Effect of reflux of R-PG in wash stream in PG separation on e.e. in extract and
raffinate, fixed W/F =2.3, [rac]feed = 0.01 M, S/F=2 with [C] = 0.01 M, 2+2 stages (b)
influence on location of equal e.e. points: W/F and e.e.
The effect of introduction of 0.001 M of [R-PG] in the wash stream on the concentration profiles is shown in figure 10. It can be seen in figure 10b that there is less decomplexation of RC towards the extract exit (stage 1). Because all concentrations are coupled, [R]aq in stage 1 is also higher.
0
0.0005
0.001
0.0015
0.002
1 2 3 4
stage nr --> flow direction
[sp
ecie
s]aq
, M
R
S
0
0.002
0.004
0.006
0.008
0.01
1 2 3 4
stage nr <-- flow direction
[sp
ecie
s]o
rg, M
CRCSC
(a) (b) Figure 10: PG separation, concentration profiles over 2+2 stages extractor (a): aqueous
phase (b) organic phase. Species: R, S = neutral amine enantiomer, C = extractant, RC and
SC = complexes of enantiomer and extractant. S/F=2, W/F=1.96, [C] = 0.01 M, [rac]feed =
0.01 M, reflux [R-PG]=0.001 M in wash stream.

Multistage model
144
Because of the improved product purity, it may be expected that the variation in local
extraction factors is also reduced by application of reflux. The local D’s, α’s and E’s were
calculated from the concentration profiles. It can be seen in figure 11 that although the local E’s are influenced by reflux, the variation in E’s is not reduced significantly. The most probable cause is the lower actual extractant excess: the same amount of extractant is used for more enantiomer. A lower extractant excess tends to result in more variation of E’s over the extractor.
0
1
2
3
4
5
6
1 2 3 4
stage nr
E [-
]
R no reflux S no refluxR reflux S reflux
Figure 11: Local extraction factors for PG separation without and with reflux. Data from
figure 8 and 10. Refluxed concentration [R-PG] in wash = 0.001 M.
It can be seen in figure 9 that application of reflux indeed results in increased e.e. and decreased W/F, but a rather large fraction of the product has to be refluxed to get an appreciable effect. [R-PG] = 0.001 M in the wash stream at a W/F ratio of 2 means that 40 % of the feed is recycled in the wash stream. For PEA, it was concluded that the effect of reflux is even smaller: for instance recycling of 0.001 M [S-PEA] in the wash stream at a W/F ratio of 4 means recycling 80% of the feed concentration, and it results in an e.e. increase from 0.850 to 0.861 (for 20 stages). The weaker effect of reflux for PEA may be caused by the weaker complexation reaction and stronger physical extraction effect. For PEA separation, the required W/F ratio and number of stages to reach 0.98 e.e. in extract and raffinate are presented as a function of reflux concentration in figure 12. It can be seen that the required number of stages is lowered considerably if reflux is implemented under these circumstances, but note that [S-PEA] = 0.003 in the wash stream at W/F = 3.8 implies that all S-PEA in the feed is recirculated once more through the extractor. Thus, a substantially larger amount of extractant is required to ensure sufficient extractant excess, which may be realised by increasing the S/F ratio.

Chapter 6
145
3.7
3.8
3.9
4
0 0.001 0.002 0.003
[S-PEA] in wash, M
W/F
20
25
30
N
Figure 12: Influence of reflux of S-PEA on W/F ratio and number of stages for specification
e.e. = 0.98 in extract and raffinate, S/F=1 with [C]=0.02 M, [rac]=0.01 M, pH 8.6, 25 °C
It is concluded that reflux of the strongly bound enantiomer in the wash stream indeed results in a better e.e. (or lower stage requirement) and lower W/F ratio at the operating point. However, for an appreciable effect a rather large concentration of one enantiomer has to be present in the wash stream, so a large fraction of the product stream (raffinate 2) needs to be refluxed. Especially with a high W/F ratio, application of reflux may be uneconomical. Furthermore, the effective excess of extractant is lowered when reflux is used: the same amount of extractant now has to complex with more enantiomers. Therefore, a sufficient excess of extractant has to be present when reflux is used. Vice versa, it can be seen in figure 8a or 10a that a large portion of the weakly bound enantiomer is extracted by the fresh organic solution at the bottom stage (N=4). A mode of operation can be envisaged in which an extractant solution partly loaded with the less strongly bound enantiomer enters the system. However, this way of operation was shown by simulation to be ineffective. Loading of the extractant with enantiomer ‘S’ also influences extraction of enantiomer R, because both enantiomers compete for the extractant. The overall result is that a lower excess of extractant is available, so the separation will become worse instead of better.

Multistage model
146
6.3.6 Back-extraction To recover the strongly bound enantiomer product and the extractant for re-use, the loaded solvent stream can be treated in a back-extraction unit (figure 13).
fractionalextraction
backextraction
FFeed(R,S)
Wash
streamW W2
aq. stream
Raff. 1: S in water
solvent, Cclean
solvent, R,Cloaded
Raff. 2R in
water
Figure 13: Conceptual flow sheet comprising fractional extraction and back-extraction unit
with recycle of solvent stream. Assumption: R is preferentially extracted ( KR > KS)
The extent of back-extraction in the back-extraction unit is determined by the distribution ratios, W2/S ratio and the number of stages. To ensure an efficient back-extraction, the back-extraction unit should be run under process conditions that yield low distribution ratios for both enantiomers: the extraction factor (equation 5) has to be as low as possible, but in any case lower than 1. In chapter 4, it was demonstrated experimentally that (partial) back-extraction in a single stage can be carried out by temperature increase (for components with low physical partitioning) or by pH decrease (for all components). Therefore, back-extraction simulations by pH decrease were done for PEA and PG, and by temperature increase for PG only. The specification was set to a recovery of 99.5 % (sum of enantiomers) from the loaded solvent stream into raffinate 2. The results for back-extraction of PEA and PG by pH shift are presented in figure 14a and b for 2 and 3 equilibrium stages. It can be seen that the W2/F ratio required for back-extraction decreases with decreasing pH and with increasing number of stages. The lower pH, the lower the resulting distribution ratios for both enantiomers, and the easier the back-extraction. With a higher number of stages, a higher extraction factor (but still E < 1) can be allowed. It is also clear that back-extraction of PEA can be effected at a slightly higher pH than for PG. This is caused by the lower pKA value for PG and by the stronger complexation between PG enantiomers and the extractant. Finally, a W2/F ratio lower than unity can be used for back-extraction if the pH is sufficiently low in combination with a sufficient number of stages (below dotted line). Under these circumstances, the product in raffinate 2 is concentrated compared to the feed concentration.

Chapter 6
147
0
2
4
6
5.5 6 6.5
pH
W2/
F
N = 2
N = 3
0
2
4
6
5.5 6 6.5
pH
W2/
F
N = 2
N = 3
(a) (b)
Figure 14: Back-extraction by pH shift, 5 °C, aqueous stream W2 (as ratio to feed F)
requirement for 99.5 % recovery. Data for N=2 and N=3 (a) PEA, loading conditions: 5 °C,
S/F=1.5, N=21, [C]=[rac]=0.02 M. (b) PG, loading conditions: 5 °C, S/F=1.5, N=8,
[C]=[rac]=0.02 M. Below dotted line (W2/F=1), the product is concentrated compared to the
feed concentration.
In figure 15, the simulation results for back-extraction of PG by temperature increase is presented. It can be seen that the larger T, the lower the requirement W2/F; however, a considerable W2/F and number of stages is required with temperature shift compared to pH shift. With larger temperature, the contribution of the complexation reaction is eliminated, but the extent of physical extraction increases.
0
5
10
15
20
0 10 20 30 40 50T [°C]
W2/
F
N = 5
N = 10
Figure 15: Back-extraction of PG by temperature shift, pH 8.0, aqueous stream W2 (as ratio
to feed F) requirement for 99.5 % recovery. Loading conditions: 5 °C, S/F=1.5, N=8,
[C]=[rac]=0.02 M. Below dotted line (W2/F=1), the product is concentrated compared to the
feed concentration.

Multistage model
148
For a component in which the physical extraction (partitioning ratio P) is substantial, such as for PEA, back-extraction by temperature shift can only be carried out with a large number of stages and a large W2/F ratio, which is inefficient. From figure 14, it follows that back-extraction by pH shift is very efficient for all amines and amino-alcohols, with high and low physical partitioning. If the pH is sufficiently low, concentration of the product instead of dilution can be realised, which is beneficial for the product quality. It was estimated and experimentally demonstrated in chapter 4 that the pH shift required for back-extraction (from about 9 to about 6) can be carried out conveniently with low-pressure CO2. In a process, CO2 can be removed from raffinate 2 by lowering the CO2 partial pressure or by stripping with nitrogen. In this way, no salts are produced.
6.4 Design considerations Conventionally, an extractor is designed to separate one specific compound in the most economical way. According to this method, the overall cost for the extractor is estimated and the various options are compared to find the optimal configuration. For a fractional extractor as described in this chapter, the following can be stated qualitatively: the flow rates determine the ‘diameter’ size of the extractor; [C] determines the extractant inventory; the number of stages determines the ‘height’ of the extractor. The flow rate ratio W/S is limited by hydrodynamical constraints. Cooling the system to 5 °C will cost additional money, and lowering the pH may result in salts production. However, for this process it seems much more interesting to design an extractor that is as flexible as possible instead of optimising the equipment for one specific separation, so to design multipurpose equipment instead of dedicated equipment. In this process, one versatile extractant is used to separate various compounds from the same chemical class (amines and amino-alcohols). The extraction behaviour of all amines and amino-alcohols varies basically in two ways: operational selectivity and capacity (distribution ratio). As for the capacity (distribution ratios), the extraction factors ‘should be average 1’ over the extractor, with one extraction factor > 1 and the other < 1, and this can be accomplished by adaptation of the W/S ratio. To work with hydrodynamically acceptable W/S ratios, this means that the distribution ratios should have ‘moderate values’ (roughly between 0.1 and 10), otherwise, the correct E values cannot be reached. The distribution ratio can be set to these ‘moderate’ values by adaptation of the process parameters. Especially the pH and the extractant excess are important parameters to set the D’s. The influence of process conditions
on D and αop is discussed in chapter 4.
The selectivity determines the ease of separation, so the required number of stages. In a given extractor with a fixed number of stages, there is a minimum selectivity to obtain a certain separation; a compound with lower selectivity cannot be separated. This minimum selectivity

Chapter 6
149
can be found from the Kremser equation; and the separation can only be realised if the process conditions are set in such a way that the conditions for the Kremser equation (=constant extraction factors over the extractor) are fulfilled. This can be achieved with high extent of complexation, high W/F and high extractant excess. Furthermore, it was observed that each variation of the extraction factors over the extractor will decrease the purity in the exit, or result in a higher stages requirement. So, for each case in which the selectivity is larger than the minimum value, conditions can be allowed that result in (more) variation in E’s over the column, and these are generally conditions that can be exploited to increase the capacity or lower the cost: lower S/F and W/F and/or lower extractant concentration. As illustration, a number of operating points is presented in table 3. Note that the lower S/F and W/F, the larger the possible throughput, and the lower [C], the lower the inventory of expensive extractant. Although this list contains the most important options, it can be extended almost infinitely. Table 3: Operating points for PEA separation, for a required e.e. = 0.98 in raffinate and
extract, [rac-PEA] = 0.02 M. N is total of stages, evenly distributed over the 2 sections.
T (°C) S/F W/F [C] in S pH N
5 2 17 0.02 8.6 17 5 1.5 9 0.02 8.6 21 5 1.5 11.8 0.04 8.1 16 5 1.5 3 0.02 8.1 24 5 1.8 4.7 0.02 8.1 20
25 2 20.1 0.02 9.6 28 25 2 10.9 0.02 9.1 28 25 2 4.4 0.02 8.6 32 25 2 57.5 0.04 9.6 19 25 2 12.6 0.04 8.6 20 25 1 3.95 0.04 8.6 28 25 1 18.2 0.04 9.6 26 25 4 61.5 0.02 9.6 20 25 2 30 0.08 8.6 18 25 2 8.4 0.03 8.6 22 25 2 2.8 0.03 8.1 25
Table 3 can be considered as an illustration of the flexibility of FREX. If a fractional extractor with 25 theoretical stages is available, there is still a variety of options to separate PEA with the required purity. If the concentration of crown ether is also already set, still F/S and W/S can be adapted as well as the operating temperature and the pH. If for a certain PEA batch the purity requirement is higher than usual, the process can be run at lower temperature or with higher S and W streams, yielding a better purity at a smaller throughput. And if a different
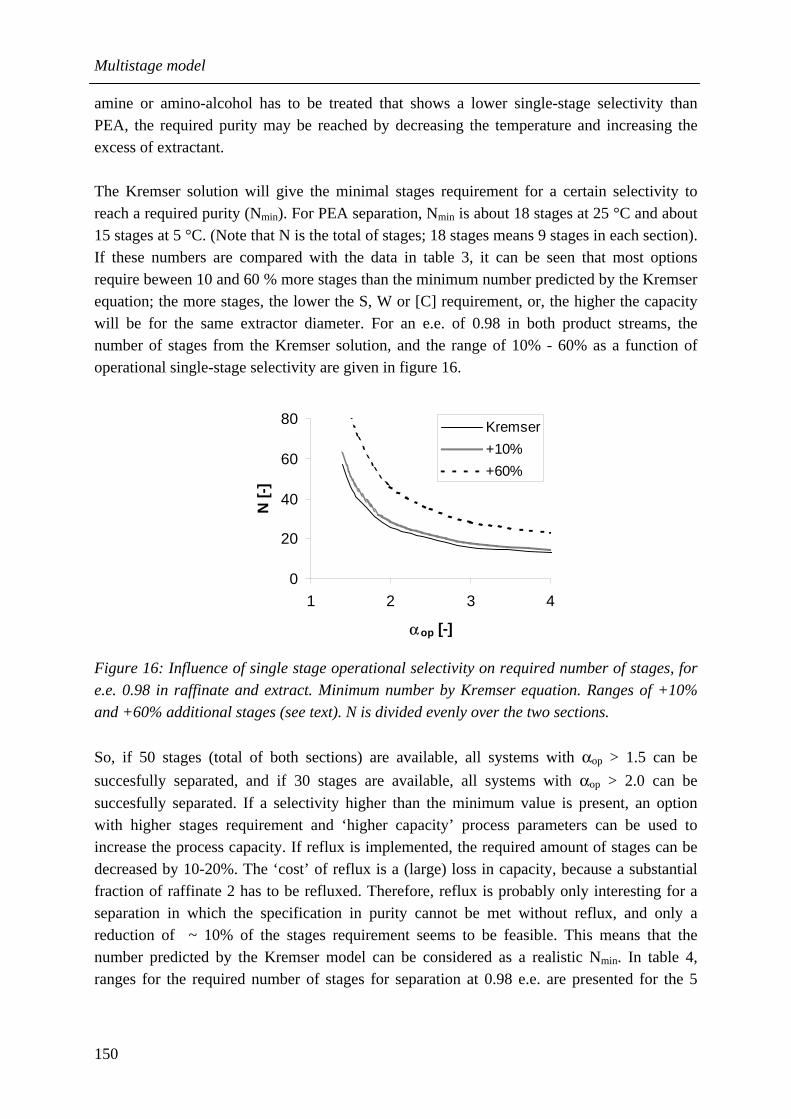
Multistage model
150
amine or amino-alcohol has to be treated that shows a lower single-stage selectivity than PEA, the required purity may be reached by decreasing the temperature and increasing the excess of extractant. The Kremser solution will give the minimal stages requirement for a certain selectivity to reach a required purity (Nmin). For PEA separation, Nmin is about 18 stages at 25 °C and about 15 stages at 5 °C. (Note that N is the total of stages; 18 stages means 9 stages in each section). If these numbers are compared with the data in table 3, it can be seen that most options require beween 10 and 60 % more stages than the minimum number predicted by the Kremser equation; the more stages, the lower the S, W or [C] requirement, or, the higher the capacity will be for the same extractor diameter. For an e.e. of 0.98 in both product streams, the number of stages from the Kremser solution, and the range of 10% - 60% as a function of operational single-stage selectivity are given in figure 16.
0
20
40
60
80
1 2 3 4
α op [-]
N [-
]
Kremser
+10%
+60%
Figure 16: Influence of single stage operational selectivity on required number of stages, for
e.e. 0.98 in raffinate and extract. Minimum number by Kremser equation. Ranges of +10%
and +60% additional stages (see text). N is divided evenly over the two sections.
So, if 50 stages (total of both sections) are available, all systems with αop > 1.5 can be
succesfully separated, and if 30 stages are available, all systems with αop > 2.0 can be
succesfully separated. If a selectivity higher than the minimum value is present, an option with higher stages requirement and ‘higher capacity’ process parameters can be used to increase the process capacity. If reflux is implemented, the required amount of stages can be decreased by 10-20%. The ‘cost’ of reflux is a (large) loss in capacity, because a substantial fraction of raffinate 2 has to be refluxed. Therefore, reflux is probably only interesting for a separation in which the specification in purity cannot be met without reflux, and only a reduction of ~ 10% of the stages requirement seems to be feasible. This means that the number predicted by the Kremser model can be considered as a realistic Nmin. In table 4, ranges for the required number of stages for separation at 0.98 e.e. are presented for the 5

Chapter 6
151
model amino-alcohols/ amines that were successfully separated in chapter 4. The estimation is based on the operational selectivity found in the single stage equilibrium experiments. Table 4: Ranges for required number of stages N for the target enantiomers, based on
experimental αop (chapter 4). Nmin from Kremser equation; Nmax is 60% more stages.
substance T (°C) solvent realised αop [-] Nmin = NKremser
Nmax
phenylglycinol 25 toluene 9.4 8 14 2-aminobutanol 25 toluene 1.5 46 81 2-aminobutanol 5 CH2Cl2 3.3 15 26 2-amino-1-phenylethanol 5 toluene 1.5 46 81 norephedrine 5 toluene 1.5 46 81 norephedrine 5 CH2Cl2 1.8 31 55
phenylethylamine 25 toluene 2.5 20 35 phenylethylamine 5 toluene 3.2 16 28
6.5 Conclusion The influence of changes in process parameters (pH, T, concentrations) were predicted with the multistage equilibrium model for reactive extraction of phenylglycinol and phenylethylamine. The purity and yield can be improved by each measure that results in a higher extent of complexation, i.e. higher extractant excess (by increasing extractant concentration or higher S/F ratio), higher concentration level, higher pH and lower temperature; but in all cases a higher W/F ratio is required as well to obtain a good yield and purity in both product streams. The increase in product purity can be explained either by an increase in single-stage operational selectivity, or by a reduction of variation in extraction factors along the extractor, or by a combination of these effects. Implementation of reflux by feeding a portion of the strongly binding enantiomer in the wash stream is advantageous as it results in higher product purities (or less stages) at a slightly smaller W/F ratio. The ‘cost’ of reflux is a loss in capacity and a higher requirement for excess of extractant. Reflux seems the most interesting for compounds that are difficult to separate because of a low single stage selectivity. Recovery of product and extractant by backextraction can be done by pH shift or temperature shift. A pH decrease results in a (much) lower concentration of the extractable species, and is an efficient back-extraction method for both compounds studied; concentration of the second raffinate instead of dilution can be realised if the pH is lower than about 6. Back-extraction by a temperature increase is much less effective and does not result in concentration of the second raffinate.

Multistage model
152
The flexibility of the fractional reactive extraction process was demonstrated by presenting the various process options that can be used to yield a certain product specification. The more equilibrium stages are available above the minimum number predicted from the Kremser-based shortcut model, the higher the process capacity. If a fractional extractor is available with 50 stages (25 stages per section), all of the enantiomers that were separated with a minimum single stage selectivity of 1.5 (chapter 4) can be separated with enantiomeric excess 0.98 in each stream.
References 1 Robbins LA. Liquid-liquid extraction. In: Schweitzer PA, editor. Handbook of separation technology for chemical engineers, 3rd edition. McGraw-Hill;1997. p. 1-419/1-447 2 Perry RH, Green DW, Maloney JO, editors. Perry’s Chemical Engineers’ Handbook, 7th edition. New York:McGraw-Hill chemical engineering series;1997 3 Takeuchi T, Horikawa R, Tanimura T, Kabasawa Y. Resolution of DL-valine by countercurrent solvent extraction with continuous sample feeding. Sep Sci Tech 1990;25(7&8): 941-951 4 Nishizawa H, Tahara K, Hayashida A, Abe Y. Continuous separation method with liquid particle extractor: enantioseparation of (±)-mandelic acid. Anal Sci 1993;9:611-615 5 Sheldon RA, Chirotechnology. Industrial synthesis of optically active compounds. Marcel Dekker Inc.; 1993.

Chapter 7
153
7 Fractional reactive extraction pilot experiments in
hollow fiber membrane modules
7.1 Introduction In the previous chapters, an azophenolic crown ether was identified as a versatile enantioselective extractant to separate various chiral amines and amino-alcohols. The single-stage physical and chemical equilibria of this extractant system were studied experimentally and modelled in chapter 4. If a fractional extractor is compared with a single extraction stage, basically three additional degrees of freedom are present: the number of stages, the solvent-to-feed (S/F) ratio and the wash-to-solvent (W/S) ratio. A multistage equilibrium model was constructed based on the single stage description and used to study these degrees of freedom in chapter 6. The aim of this chapter is the practical demonstration of the chiral separation of phenylglycinol and phenylethylamine by fractional reactive extraction in a pilot set-up, by determination of the number of equilibrium stages that can be realised in the pilot, experimental study of the influence of S/F and W/S ratio on the separation, and comparison of the experimental observations with the predictions of the multistage equilibrium model. The two compounds PEA and PG that are studied in this chapter are presented in figure 1.
Phenylglycinol (PG)
OH
NH2
*
Preferentially extracted: R Intrinsic selectivity: 10
Phenylethylamine (PEA)
NH2
*
Preferentially extracted: S Intrinsic selectivity: 2.7
Figure 1: (a) phenylglycinol (b) phenylethylamine Various types of equipment can be used for liquid-liquid extraction at pilot scale. Column contactors can be constructed with a small diameter and a limited height, containing various internals and various means of energy supply.1 Secondly, hollow fiber membrane modules have been used to carry out (fractional) extraction.2,3,4 Centrifugal extractors exist at small scale (for instance, the CINC); furthermore, so-called ‘centrifugal partition chromatography’ (CPC) or ‘counter-current chromatography’ (CCC) is also small-scale centrifugal extraction.5,6 A cascade of mixer-settlers can be operated at small scale7 or simulated with a series of separatory funnels.8 Another mixer-settler type design is the Craig extractor9. In literature, some custom-made designs for small-scale extraction are reported, such as the

Membrane extraction pilot
154
rotating glass column set-up10 or the ‘liquid particle extractor’.11 With all of these types of equipment, the fractional extraction scheme can be realised by employing two separate extractors for the two sections (wash and strip section); in a column-type contactor, entrance of the feed in the middle of the extractor may be possible, resulting in two extraction sections in one piece of equipment. So far, most authors have employed two separate units for the two sections.2,10,11 To carry out the present separation, the following demands to the pilot plant equipment can be listed:
• scale: only a few grams of the extractant, the azophenolic crown ether, are available. The organic phase volume per experiment should be limited to 100-500 mL.
• despite the small scale, multiple equilibrium stages should be realised in the contactor.
• the set-up should represent two sections: a wash and a strip section.
• the contactor should be able to handle various phase ratios. Because of the particularly small scale of this separation, column equipment and centrifugal extractors could not be used. CCC and CPC equipment, the Craig extractor and the home-made designs were considered too costly and/or too time-consuming to build. The remaining options are a series of mixer-settlers or a membrane module. A cascade of mixer-settlers may be a good contactor to check the model predictions, but the results from this contactor are less useful for design of real contactors; for the present separation, 10-30 stages per section will be required, and mixer-settlers are seldom used for applications with more than three stages. Even if a 50-stage small-volume mixer-settler cascade can be realised, the very long residence time will be prohibitive. The membrane module is a differential contactor and bears more resemblance to multistage real-life extractors; secondly the phases are not dispersed and thus easily separable, and the phase ratio can be set at wish without the risk of flooding. Besides, this contactor has a large interfacial area and promises efficient mass transfer. Therefore, the membrane module was selected as contactor. Two modules are used representing the wash and the strip section. A scheme of the set-up is given in figure 2. More details can be found in the experimental section. Comparison of the membrane extraction performance with the multistage equilibrium model requires the ‘number of equilibrium stages’ as input, whereas a membrane module is a differential contactor. Therefore it was decided to determine the NTU that can be realised in one membrane module, and convert this NTU to a number of equilibrium stages for that module. To find NTU, a reactive extraction experiment cannot be used, because the extraction factor is varying along the extractor. Therefore physical extraction of PEA from water to toluene was used to determine NTU, since the physical partitioning ratio of PEA into toluene is sufficiently high to obtain a reliable result.

Chapter 7
155
The obtained ‘number of equilibrium stages’ (N) is subsequently used to predict the influence of the solvent-to-feed ratio (S/F) on the purities and yield in a single reactive extraction section, without employing a wash section, both for PG and PEA separation. The predicted influence is validated by experiments in a single membrane module, corresponding with one extraction section. After that, simulations are done for the fractional extraction scheme, incorporating the two sections, to model the influence of the W/S ratio on the separation. The predictions are compared with the results of fractional reactive extraction experiments using the two membrane modules for separation of phenylglycinol. Similarly, the influence of temperature is studied for PG extraction. Finally, the chapter is concluded with a discussion on improvement of the realised separation and on improvement of the model predictions.
Feed(R,S)
WashW
Raffinate(S)
Solvent
Extract(R)
Figure 2: Scheme of fractional reactive extraction pilot set-up consisting of two hollow fiber
membrane modules and three pumps. Assumption: R is preferentially extracted.
7.2 Experimental The enantioselective extractant was manufactured by Syncom BV (Groningen, The Netherlands) in a custom synthesis according to Naemura et al.12 R- and S-phenylglycinol were obtained from Fluka (Buchs, Switzerland). Rac-phenylethylamine was obtained from Sigma-Aldrich (Milwaukee, WI, USA) and toluene was obtained from Merck (Darmstadt, Germany). A scheme of the membrane pilot is given in figure 2. The membrane modules have to be toluene-resistant. Commercially available solvent-resistant modules such as the Liquicel-Extra-Flow modules by Membrana require feed streams of several hundreds of liters

Membrane extraction pilot
156
per hour, so they are much too large for this application. Therefore, two small membrane modules were custom-made by SolSep BV (Apeldoorn, The Netherlands). Each module has 15 cm effective membrane length, 16 mm ID and contains 150 polypropylene fibers of 0.33/0.63 mm ID/OD (Membrana, Wuppertal, Germany), that are potted with a proprietary solvent-resistant potting. The resulting specific area is 1090 m2/m3 (calculated from log mean fiber diameter). The porosity of the membrane material was determined at 0.78 with a pycnometer13 and the calculated14 tortuosity is 1.90. The membrane material is wetted by the toluene phase. To prevent toluene leakage to the aqueous phase, a pressure difference of 50-100 mbar between the aqueous and organic side is maintained by adjusting a valve in the raffinate exit. The modules are jacketed to enable temperature control with a thermostat bath (Julabo F-32). The feed and solvent streams are delivered by a Stepdos 08 S pump (KNF FLODOS AG, Sursee, Switzerland) and the wash stream by a Watson Marlow 101U/R pump (Watson Marlow Limited, Cornwall, UK). All experiments were carried out with the aqueous phase in the fibers and the toluene phase at the shell side. The feed concentration of the racemic mixture was 2 mM (unbuffered) in MilliQ water (Millipore, Billerica, USA), the extractant concentration was 3 mM in toluene and the wash stream was milliQ water. In each experiment, the module is flushed during 2-5 times the residence time of the solvent flow at the shell side. After that, samples are taken from the aqueous raffinate stream and organic extract stream. The organic phase sample is extracted with dilute acid to obtain an aqueous sample for analysis. All samples are analysed by chiral HPLC for amine/amino alcohol enantiomer concentration. The HPLC set-up consisted of a Varian 2510 HPLC pump, a Daicel Crownpak (+) chiral column in a column oven, a derivatization coil and a Jasco FP-2020 plus fluorescence detector operated at 325 nm excitation and 465 nm emission. Post-column derivatisation with o-phtalic aldehyde /mercaptoethanol reagent is carried out according to Duchateau et al.15 The error in each concentration determined from repeated analysis of the same sample is ± 3%; the back-extraction step for the extract samples introduces an additional experimental error. Based on these error estimations, it was decided to use the data of all experiments for which the mass balance closed within 10% (calculated from feed, extract and raffinate samples).
7.2.1 Data treatment For a single stage, the capacity is characterised by the distribution ratio D for each enantiomer
and the selectivity αop is defined as the ratio of distribution ratios. The intrinsic selectivity αint
is determined by the complexation constants (KR, KS) between the crown ether and enantiomers. The appropriate formulas can be found in chapter 4. The extraction performance in an extractor is characterised more conveniently by the yield (eq. 1) and the product purity by the enantiomeric excess e.e.16 (eq. 2 and 3). Similar equations as (1) can be defined for the yield of each enantiomer in the raffinate and extract stream. Note that e.e. is always defined in such a way that its value is between 0 and 1. If [S] is larger than [R], it is defined as in

Chapter 7
157
equation (3). For PG, R ends up in the extract, so e.e.EXTR is calculated with equation 2 and e.e.RAFF with equation 3; for PEA, the situation is reversed.
feedRtotal
extractRtotalyield EXTRACTR =, (1)
][][
][][..
SR
SRee
+−= (2)
][][
][][..
SR
RSee
+−= (3)
7.3 Results and discussion
7.3.1 Estimation of number of stages by physical extraction NTU and N are determined from physical extraction data for transfer of PEA from water to toluene. The formula for NTU in a differential contactor for the raffinate (the non-reactive phase) is presented in equation 4. The number of equilibrium stages N for this separation is given by the Kremser equation. It follows that NTU can be converted to an equilibrium stage number N by applying equation 5.17 In the equations, P is the physical partitioning ratio and E
is the extraction factor (E=P⋅S/F).
E
EEPPEAPEA
PPEAPEA
NTUsolventraffinate
solventfeed
11
111
/][][
/][][ln
−
⎥⎥⎦
⎤
⎢⎢⎣
⎡+⎟
⎠
⎞⎜⎝
⎛ −⋅⎟⎟
⎠
⎞
⎜⎜
⎝
⎛
−−
= (4)
E
ENNTU
11
ln
−= (5)
The experimental NTU for phsyical extraction of PEA from water to toluene is presented in figure 3, as well as the number of equilibrium stages N that is calculated with equation 5.

Membrane extraction pilot
158
0
1
2
3
4
0 0.5 1 1.5 2
S/F [-]
NT
U o
r N [-
]
NTU N
Figure 3: NTU and N for extraction of 2 mM PEA from water to toluene in one membrane
module, F = 1.0 ml/min, 25 °C.
It can be seen that the difference between N and NTU is the most pronounced at high S/F, because the extraction factor E is the largest here. From this figure, it can be concluded that NTU is 2-3 per membrane module, so HTU = L/NTU = 5-7.5 cm. This value of HTU is comparable to the results in literature4,18 although lower HTU values were also reported (1-3 cm)19 for lower linear velocities of the liquids and membrane fibers with smaller diameter. The average N that follows from the figure is between 1 and 2, whereas an integer value is required for the model. According to the theory, NTU (and thus N) will be higher if lower flow rates are applied. Because a considerable part of the experiments will be carried out at somewhat lower aqueous and organic flow rates than the flow rates used here, N=2 will be used as ‘number of equilibrium stages per section’ in all simulations.
7.3.2 Reactive extraction: influence of solvent-to-feed ratio In the following paragraphs, the results of the reactive extraction experiments are discussed. In all cases, the multistage model prediction is presented next to the experimental result in the same figure. The experimentally used concentrations, pH and temperature are used as input parameters for each model prediction. These values can be found in ‘Experimental’ unless mentioned otherwise. In a number of cases, the model prediction is very sensitive to the exact value of a model parameter. Then, model predictions for two values of that parameter are indicated in the same figure with ‘thin lines’ and ‘thick lines’. First, the influence of the solvent-to-feed (S/F) ratio for reactive extraction of phenylglycinol and PEA was studied in a single membrane module, corresponding with one extraction section. Note that for PG, enantiomer R is predominant in the extract and for PEA, the R-enantiomer is predominant in the raffinate.

Chapter 7
159
Phenylglycinol For phenylglycinol, the model predictions and the experimentally observed effect of S/F ratio are presented in figure 4 (enantiomeric excess) and figure 5 (yield). According to the simulations, increasing the S/F ratio results in a higher yield in the extract but a lower extract purity (enantiomeric excess e.e.). Furthermore, model results at different pH values are presented to show the large effect of this process parameter on the product compositions. Because this is an equilibrium simulation, changing the feed flow and solvent flow rate by the same factor while keeping S/F constant does not affect the model result. More details on the model predictions and explanations for the observed behaviour can be found in the previous chapter.
0
0.2
0.4
0.6
0.8
1
0 1 2 3
S/F
e.e.
raff pH 8.1 extr pH 8.1raff pH 8.6 extr pH 8.6
0
0.2
0.4
0.6
0.8
1
0 1 2 3
S/F
e.e.
raff extr
(a) (b)
Figure 4: Influence of S/F ratio on enantiomeric excess in one module for phenylglycinol
separation (a) simulation (N=2), pH 8. and pH 8.1 (b) experimental result, feed flow rate F =
0.1 ml/min, pH 8.6, other parameters see ‘Experimental’.

Membrane extraction pilot
160
0
0.2
0.4
0.6
0.8
1
0 1 2 3
S/F
Yie
ldS raff pH 8.1 R extr pH 8.1S raff pH 8.6 R extr pH 8.6
0
0.2
0.4
0.6
0.8
1
0 1 2 3
S/F
Yie
ld
S raff R extr
(a) (b)
Figure 5: Influence of S/F ratio on yield in one module for phenylglycinol separation. (a)
simulation (N=2) pH 8.6 and pH 8.1 (b) experimental results, data for F=0.1 ml/min, pH 8.6.
It can be seen in figure 4b that the effect of S/F on the experimentally obtained e.e is rather small. Secondly, to reach the point in which the e.e. values are the same in raffinate and extract, a higher S/F ratio seems to be required. It was also observed in the experiments that the experimental enantioselectivity (expressed as ratio of distribution ratios according to chapter 4) is larger than the single-stage operational enantioselectivity for this system: under
similar circumstances αop = 12 in the module vs. αop = 7 in a single stage. This shows that
indeed more than one equilibrium stage is realised in the module. However, the operational selectivity is a poor measure of the quality for this separation, because it presumes that there is equilibrium between the extract and raffinate stream, whereas these streams exit the module at opposite ends and are not in equilibrium at all. Therefore, in the remaining part of this chapter only the enantiomeric excess e.e. will be used as a measure of optical purity in the product streams. For further comparison, the predicted e.e. for a single stage is presented in figure 6 next to the experimental data from figure 4b. The predicted equal e.e. point is located at e.e. = 0.47 for the single stage and at e.e. = 0.60 for two stages (figure 4a), whereas the experimental data tend towards e.e. > 0.55 at the crossing point. Thus, the realised number of stages is indeed close to 2.

Chapter 7
161
0
0.2
0.4
0.6
0.8
1
0 1 2 3
S/F
e.e.
raff extrsingle stage raff single stage extr
Figure 6: PG separation, experimental e.e. data from figure 4b for one membrane module
(open symbols) and e.e for single stage separation by model from chapter 4 (lines).
The experimental result for the yield (fig. 5b) is qualitatively the same as the model prediction: with increasing S/F, the yield in the extract increases and the yield in the raffinate decreases for both enantiomers. The pattern in the experimental results is closer to the prediction with pH 8.1 than pH 8.6, although the experimental pH was 8.6. Alternatively, it may be stated that the ‘crossing point’ in which the yields of the respective enantiomers in extract and raffinate are equal seems to be located at larger S/F ratio in the experiments than in the simulations. The same was observed for the enantiomeric excess. Thus, it seems that the solvent is not used effectively. This may be due to insufficient residence time for physical extraction and/or complexation. These observations cannot be explained directly from the multistage equilibrium model. It seems that the residence time in the extractor and the mass transfer and/or reaction rate should be taken into account. Phenylethylamine The model predictions and the experimentally observed effect of S/F ratio for phenylethylamine are presented in figure 7 (enantiomeric excess) and 8 (yield). The trends in the model predictions are the same as for phenylglycinol; however, because of the lower selectivity in the single stage for PEA, the enantiomeric excess after 2 stages is also lower. The sensitivity of the model prediction to the value of pH is large, because the pH in the system is close to the pK of phenylethylamine.

Membrane extraction pilot
162
0
0.2
0.4
0.6
0 1 2 3S/F
e.e.
raff pH 8 extr pH 8raff pH 9 extr pH 9
0
0.2
0.4
0.6
0 2 4
S/F
e.e.
raffinate extract
(a) (b)
Figure 7: Influence of S/F ratio on e.e. in one module for phenylethylamine separation (a)
simulation (2 stages) (b) experimental results, data for F = 0.1 ml/min; lines only indicated
for clarity.
0
0.2
0.4
0.6
0.8
1
0 1 2 3S/F
yiel
d
R raff pH 8 S extr pH 8R raff pH 9 S extr pH 9
0
0.2
0.4
0.6
0.8
1
0 2 4
S/F
yiel
d
R raff S extr
(a) (b)
Figure 8: Influence of S/F ratio on yield in one module for phenylethylamine separation (a)
simulation (2 stages), pH 8 and pH 9 (b) experimental results, data for F = 0.1 ml/min; lines
only indicated for clarity.
It can be seen that in the experimental results for PEA separation there is no clear trend (‘up’ or ‘down’) for e.e. and yield as a function of S/F ratio (figure 7b and 8b). If the order of magnitude of the values for e.e. and yield is compared, it is clear that the model predictions for pH 8 are much better than for pH 9 at this S/F ratio, or alternatively that the predictions for

Chapter 7
163
a low S/F ratio correspond with the experimental results at larger S/F. It seems that again the solvent is only partly used, possibly because of too low residence time. Because there is no clear trend, no conclusion can be drawn on the variation in e.e. and yield with S/F. The variations may be caused by a real effect of S/F ratio but just as well by pH variations. A similar large pH effect caused by CO2 from air was found for PEA in the single stage extraction experiments (chapter 4). The remaining experiments with the two membrane modules (fractional extraction scheme) were carried out with PG only, because this substance is a less strong base and proved less prone to CO2 uptake in the single stage experiments. Therefore PG results are expected to show more clear trends than PEA results.
7.3.3 Fractional reactive extraction: influence of wash-to-solvent ratio Two-module experiments were carried out to identify the influence of the W/S ratio on the chiral separation of phenylglycinol. To our knowledge, this influence was not studied experimentally before, although a number of authors studying fractional reactive extraction estimate the optimal W/S ratio beforehand based on the extraction factors for each enantiomer.10,11 The simulated and experimental effect on enantiomeric excess is presented in figure 9, the effect on the yield is presented in figure 10. It can be seen that according to the simulation, W/S has a pronounced effect on yield and product purity: an increase in W/S results in a more pure extract, but a lower yield in the extract.
0
0.2
0.4
0.6
0.8
1
0 1 2
W/S
e.e.
raff extract
0
0.2
0.4
0.6
0.8
1
0 1 2
W/S
e.e.
raff extract
(a) (b)
Figure 9: Influence of W/S ratio on e.e. for phenylglycinol separation. S = 0.6 ml/min, F =
0.2 ml/min, T = 25 °C, pH 8.6 (a) simulation, 2+2 stages (b) experimental data.

Membrane extraction pilot
164
0
0.2
0.4
0.6
0.8
1
0 1 2
W/S
Yie
ldS raff R extr
0
0.2
0.4
0.6
0.8
1
0 1 2
W/S
Yie
ld
S raff R extr
(a) (b)
Figure 10: Influence of W/S ratio on yield for phenylglcyinol separation. S = 0.6 ml/min, F =
0.2 ml/min, T = 25 °C, pH 8.6 (a) simulation, 2+2 stages (b) experimental data
In the experimental results, the influence of the wash stream on the e.e. is clearly visible (compare figure 9b with fig. 4b and 7b). However, the pattern observed in the e.e. in the product streams (fig. 9b) is not expected; the e.e. of the extract is expected to increase further at increasing W/S ratio instead of decrease. The effect in e.e. may be partly caused by the measuring error: because the yield in the extract is low, the concentrations of both phenylglycinol enantiomers are low as well. Under these circumstances it is difficult to monitor the variation of the concentration of the enantiomer present at the lowest concentration (in this case, S), so the e.e. value is not very reliable. Moreover, it may be that the higher aqueous flow rate and thus shorter residence time at higher W/S is detrimental to the separation. Such an effect cannot be described by the equilibrium model. The experimental and simulated results for the yield (figure 10) are qualitatively similar: with increasing W/S, the yield in the extract becomes very low while the yield in the raffinate approaches 100%. Data points at lower W/S ratio may confirm the patterns found in figure 9a and 10a, but measurements at low W/S could not be carried out because of the limited operating range of the wash flow pump. Finally, an excess of enantiomer R was measured in the aqueous stream exiting the wash section. This excess of R is indeed predicted by the model at a large W/S ratio.
7.3.4 Influence of temperature The temperature influences the physical extraction as well as the extent of complexation. For the single stage, a decrease in temperature results in larger distribution ratios and a larger operational selectivity. In line with this result, the multistage model predicts that the point with equal e.e. moves toward larger enantiomeric excess, but is located at larger W/S ratio. If

Chapter 7
165
the same S/F and W/S ratios are used, the yield of the extract will increase with decreasing temperature and its e.e. will decrease (figure 11a and 12a). One experiment was carried out at fixed S/F and W/S. The experimental result is given in figure 11b and 12b.
0
0.2
0.4
0.6
0.8
1
0 10 20 30
T [°C]
e.e.
raff extract
0
0.2
0.4
0.6
0.8
1
0 10 20 30
T [° C]
e.e.
raff extr
(a) (b)
Figure 11: Influence of temperature on e.e. in extract and raffinate, PG separation, F = 0.2
ml/min, S = 0.6 ml/min, W = 0.75 ml/min (a) simulation, 2+2 stages (b) experimental results
0
0.2
0.4
0.6
0.8
1
0 10 20 30
T [°C]
yiel
d
S raff R extr
0
0.2
0.4
0.6
0.8
1
0 10 20 30
T [° C]
yiel
d
S raff R extr
(a) (b)
Figure 12: Influence of temperature on yield in extract and raffinate, PG separation, F = 0.2
ml/min, S = 0.6 ml/min, W = 0.75 ml/min (a) simulation, 2+2 stages (b) experimental results
It can be seen that the overall influence of the temperature on the separation is almost nil. The most likely explanation is that the temperature change has an opposite effect on the kinetics and thermodynamics of the extraction process. The viscosity of the solvents will be higher at

Membrane extraction pilot
166
5 °C, resulting in slower mass transfer rates, and the complexation reaction will be substantially slower at 5 °C; therefore the extent of extraction can be expected to be smaller at lower temperature because of slower kinetics (the residence time is constant). On the other hand, the thermodynamics of the complexation reaction predicts a larger extent of extraction at lower temperature (chapter 4). Apparently, these two effects counteract, and the net result is the same extent of extraction at 5 °C and 25 °C.
7.3.5 Improvement of separation The number of equilibrium stages / NTU realised in this work was lower than the number realised by other researchers4,19 and as a result, the extent of separation that was reached in this work is also lower than expected. NTU and HTU are related via NTU=L/HTU. Firstly, some authors used longer membrane modules than 0.15 m or connected several modules in series,4 which results in a higher NTU than realised in this work. Secondly, a low NTU can also originate from a high HTU (constant L). The specific membrane area in the modules used in this work was lower than the area in commercially available equipment. No solvent-resistant membrane module of this small scale is available as standard module; the custom-made module was constructed from somewhat larger and thicker membrane fibers than used in literature, resulting in a specific area of 1090 m2/m3. In comparison with a commercial module with a specific area of about 3000 m2/m3, the custom-made module has effectively a 3 times smaller area and thus a three times larger HTU. Finally, the flow rates applied in this research were relatively high, whereas a lower flow rate results in lower HTU in membrane modules. In this work, the operating range of the wash flow pump did not allow the use of lower flow rates. The thicker membranes also cause a larger phase ratio (shell/fiber volume ~11) than common
in membrane extraction: in contrast with the 150 µm membrane thickness in this work, the
Celgard membranes (Membrana, Germany) used by most other authors2,18,19 have a
membrane thickness of only 30 µm, and therefore a much more balanced aqueous/organic
phase ratio is present when using this fiber.
7.3.6 Improvement of agreement between model and experiment The agreement between model and experiments is not very good. Firstly, there are some experimental issues that may explain part of the deviations. The most important one is the measuring error: because of the error of ± 3% in the concentration determination by HPLC and the need for back-extraction of organic-phase samples, an overall error up to 10% in the mass balance can occur, and small effects on the yield may become invisible. Next to this effect, determination of a large e.e. value is difficult in general, especially if the concentrations in the sample are low (so in case of low yield). For HPLC separation, it means that the areas of a large peak and a small peak have to be determined from the same chromatogram, so any tailing of the first peak will largely influence the area of the second peak and thus the determined enantiomeric excess. To measure e.e. in a sample precisely by

Chapter 7
167
HPLC, it is best to elute first the enantiomer that is present in the smallest concentration, to minimise the effect of tailing on the second peak area. The company Daicel (Japan) markets two chiral HPLC columns with opposite chirality (Crownpak(+) and Crownpak(-)) for this purpose, but it is an expensive solution. Secondly, the model prediction is a strong function of all process parameters and in some cases a small process parameter change has a large effect on the prediction. A clear example is the role of the pH on the extent of extraction. It can be seen in the PEA simulations (figure 7a and 8a) that a change in pH determines the behaviour of the system largely. At the same time, the pH cannot be obtained experimentally on each location within the module, so an average value has to be used as model input (for instance, the pH of the raffinate). As a result the model prediction and the experimental result deviate. A sensitivity analysis may be useful for identification of the most influential parameters. Similarly, a number of equilibrium stages of 2 was determined and used as input in all simulations based on the determination of NTU in the physical extraction experiment. It can be seen in figure 4b and 6 that almost 2 stages are realised; the best value seems to be around 1.8. In the current model, an integer value is required, so N=2 is indeed the best choice. On the other hand, the model results are very sensitive to the value of ‘N’, so this may explain part of the deviation between model and experiment. A more fundamental problem is the fact that no time-dependent behaviour is described in the model, whereas it can be expected that the residence time in the membrane module will determine if the equilibrium is approached closely within one ‘equilibrium stage’ or not. In the experiment at low temperature (figure 11 and 12), the experimental results were explained from a kinetic effect that counteracts the thermodynamic effect, and also in the experiments regarding S/F and W/S influence the residence time may be quite important. A non-equilibrium model of a membrane module may explain the trends observed in the experiments better. With such a model, the need for a ‘number of stages’ would also be circumvented. On the other hand, a non-equilibrium model requires many input data regarding membrane geometry, mass transfer and reaction kinetics, and it will only give good predictions if all input data are of good quality. The construction of such a model was not carried out because the geometry of these membrane modules cannot be described very well and because the reaction kinetics are not precisely known.
7.4 Conclusion Fractional reactive extraction for chiral separation of phenylglycinol and phenylethylamine has been performed in a pilot set-up consisting of two membrane modules. Almost two equilibrium stages could be realised in each module. In this way, a partial chiral separation of phenylglycinol and phenylethylamine was obtained. For phenylglycinol separation, it was shown experimentally that the S/F ratio influences the product purity (e.e.) slightly and the

Membrane extraction pilot
168
yields substantially, both qualitatively consistent with the multistage model prediction. The effective use of the solvent seemed to be rather low. For phenylethylamine, no clear trend could be found in the experimental data, possibly because of CO2 uptake and a subsequent pH decrease. Experiments with the two modules representing the fractional extraction scheme for phenylglycinol showed that the W/S ratio influences the yield and purity considerably; the experimental yield was qualitatively similar to the model prediction, but the experimental effect on e.e. showed a deviation from the model predictions, that may be explained with the experimental error or with an influence of residence time. Finally, a temperature decrease from 25 °C to 5 °C had no appreciable effect. The most probable explanation is that the slower kinetics counteracted with the more favourable thermodynamics at lower temperature. The number of stages realised per module was relatively low, compared to literature values. With a module containing more membrane area, a longer module and lower flow rates, the number of transfer units would have been higher and the separation would have been better. The experimental error and the sensitivity of the model prediction to the exact values of certain parameters explain some of the deviations between model prediction and experimental results. For better understanding and more accurate predictions, a non-equilibrium model may be developed that takes into account the mass transfer and chemical reaction. In this way, the use of ‘number of theoretical stages’ is also circumvented. Because the collection of the lacking non-equilibrium data was considered too time-consuming, the construction of such a model was not undertaken.
References 1 Schlichting, E.; Halwachs, W.; Schügerl, K.; Reactive extraction of salicylic acid and D,L phenylalanine in a bench-scale pulsed sieve plate column; Chem. Eng. Process. 19, 317-328 (1985) 2 Ding, H.B.; Carr, P.W., Cussler, E.W.; Racemic leucine separation by hollow-fiber extraction; AIChE J. 38(10), 1493-1498 (1992) 3 Pirkle, W.H.; Bowen, W.E.; Preparative separation of enantiomers using hollow-fiber membrane technology; Tetrahedron Asymmetry 5(5), 773-776 (1994) 4 Keurentjes, J.T.F.; Nabuurs, L.J.W.M.; Vegter, E.A.; Liquid membrane technology for the separation of racemic mixtures, J. Membr. Sci. 113, 351-360 (1996) 5 Foucault, A.P.; Enantioseparations in counter-current chromatography and centrifugal partition chromatography (review), J. Chromat. A, 906, 365-378 (2001) 6 Franco, P.; Blanc, J.; Oberleitner, W.R.; Maier, N.M.; Lindner, W.; Minguillon, C.; Enantiomer separation by countercurrent chromatography using cinchona alkaloid derivatives as chiral selectors; Anal. Chem. 74, 4175-4183 (2002) 7 Yokouchi, Y.; Ohno, Y.; Nakagomi, K.; Tanimura, T.; Kabasawa, Y.; A device for countercurrent fractional extraction and its application to continuous resolution of D,L-isoleucine; Chromatography 19(4), 374-375 (1998) in japanese

Chapter 7
169
8 Abe, Y.; Shoji, T.; Fukui, S.; Sasamoto, M.; Nishizawa, H.; Enantioseparation by dual-flow countercurrent extraction: its application to the enantioseparation of (±)propanolol; Chem. Pharm. Bull. 44(8), 1521-1524 (1996) 9 P.A. Belter, E.L. Cussler, W.-S. Hu, Bioseparations, downstream processing for biotechnology. New York: 1988 Wiley-interscience. p. 128 10 Takeuchi, T.; Horikawa, R.; Tanimura, T.; Kabasawa, Y.; Resolution of DL-valine by countercurrent solvent extraction with continuous sample feeding; Sep. Sci. Tech. 25(7&8), 941-951 (1990). 11 Nishizawa, H.; Tahara, K.; Hayashida, A.; Abe, Y.; Continuous separation method with liquid particle extractor: enantioseparation of (±)-mandelic acid; Anal. Sci. Oct. 1993, vol. 9; 611-615 12 Naemura, K.; Nishioka, K.; Ogasahara, K.; Nishikawa, Y.; Hirose, K.; Tobe, Y.; Preparation and temperature-dependent enantioselectivities of homochiral phenolic crown ethers having aryl chiral barriers: thermodynamic parameters for enantioselective complexation with chiral amines; Tetrahedron: Asymmetry 9, 563-574 (1998) 13 Guijt, C.M. Influence of membrane properties and air gap on the performance of a membrane distillation module. Thesis, University of Twente, (2003) p.81 14 M. Labecki, I. Weber, Y. Dudal, J. Koska, J. M. Piret and B. D. Bowen. Hindered transmembrane protein transport in hollow-fibre devices. J Membr Sci 1998;146:197-216 15 Duchateau, A.L.L.; Hillemans, M.G.; Hindrikx, I.; Enantiomeric separation of primary alkylamines; a comparison of direct and indirect HPLC methods; Enantiomer, 2, 61-67 (1997) 16 R. A. Sheldon, Chirotechnology, Industrial synthesis of optically active compounds, Marcel Dekker Inc. (1993) 17 Perry’s Chemical Engineers’ Handbook, 7th edition, edited by R.H. Perry, D.W. Green and J.O. Maloney. New York: McGraw-Hill chemical engineering series (1997) p. 15-18/15-19 18 Prasad R, Sirkar KK. Hollow fiber solvent extraction: performances and design. J Membr Sci 1990:50;153-175 19 Saikia B, Dutta NN, Dass NN. Extraction of L-pheylalanine in hollow fiber membrane. J membr Sci 2003;225:1-13

Membrane extraction pilot
170

Chapter 8
171
8 Conclusions and outlook In this thesis, fractional reactive extraction is evaluated as alternative industrial chiral separation technique for resolution of amines and amino-alcohols. Two major obstacles for introduction of FREX were identified in the introduction: the lack of enantioselective extractants for all major chemical classes, and the low productivity of current systems. In this final chapter the main conclusions are given, fractional reactive extraction is compared with the current industrial separation techniques and an outlook for further research is presented.
8.1 Conclusions 8.1.1 Development of enantioselective extractants In this thesis, it has been demonstrated for the chemical classes of amines and amino-alcohols that versatile and selective enantioselective extractants can be identified among known selectors from the chiral recognition literature. Four selective systems for separation of various target amines and amino-alcohols were identified using a systematic selection method. The best system, an azophenolic crown ether, showed an enantioselectivity of 1.3-5.0 for 5 out of 6 target enantiomers in the screening experiments, and a selectivity of 1.5-9.4 for the same enantiomers with improved process conditions. The most promising enantioselective extractants in the chiral recognition literature originate from techniques with a similar separation mechanism as extraction, based on differences in complexation constants for the two enantiomer-extractant complexes in the liquid: liquid membranes, extraction, HPLC/CMP and electrophoresis. To realise an enantioselectivity > 1.5 and versatility in extraction, the enantioselectivity should also be > 1.5 in the original technique, and should be reported for a number of the target analytes or for closely related substances.
8.1.2 Extractant performance The extraction conditions such as temperature, pH and concentrations of enantiomers and extractant have a large influence on the capacity (distribution ratios) and selectivity in a single stage. The intrinsic selectivity can be approached closely by the operational selectivity if the product of complexation constant and equilibrium extractant concentration is sufficient:
KR⋅[C] > 10. Under the conditions studied, an excess of extractant of 2-3 (mol/mol) was needed to approach this maximum operational selectivity, which is much lower than the extractant excess of 50-100 applied previously in literature. The distribution ratio can be set nearly at wish by adapting pH, excess of extractant, concentration level and temperature. ‘Moderate’ values of distribution ratios should be realised (range 1-10), because they will result in favourable extraction factors in combination with hydrodynamically acceptable phase ratios. A model of the single stage based on the physical and chemical equilibria in the system is valuable to understand and predict the influence of process conditions. For the azophenolic crown ether system, recovery of the extractant and product enantiomer by back-extraction can be carried out by temperature increase, and more effectively by pH decrease: a

Conclusions & outlook
172
pH shift from ~ 9 to ~ 6 is sufficient, which can be realised by dissolving low pressure CO2. The recovered extractant could be re-used without loss of activity. By a combination of experiments in the modified Lewis cell and a rate-based model, it was concluded that the reaction kinetics of the azophenolic crown ether system are between ‘fast’ and ‘instantaneous’, and the reaction kinetics of the Cu(II)-N-dodecyl-L-hydroxyproline system are between ‘slow’ and ‘fast’. An important conclusion is also that there is no general kinetic model description for reactive extraction including mass transfer in both phases, and no discussion in literature when the ‘interfacial reaction model’ or the ‘homogeneous reaction model’ should be applied. Furthermore, the regime analysis derived for reactive gas absorption gives erroneous results for reactive extraction in a number of regimes.
8.1.3 FREX process performance The multistage equilibrium extractor model based on the validated single stage model was used to determine the required amount of stages, S/F ratio, W/F ratio and process conditions to obtain a specified product yield and purity. The number of stages is primarily determined by the operational selectivity in the single stage; if more stages than the minimum number are available, a larger process capacity can be reached. Various combinations of process conditions can be identified that all yield the same product purity, but differ in capacity. All
five model enantiomers with αop > 1.5 (chapter 4) can be separated in the same 50-stages fractional extractor. Thus, a fractional extractor is very flexible and suitable for a multi-product environment. Partial chiral separation of phenylethylamine and phenylglycinol by fractional reactive extraction was demonstrated in a pilot set-up consisting of two small-scale membrane modules, each containing almost two equilibrium stages.
8.2 Comparison of FREX with current industrial separation techniques It has been demonstrated that the main drawbacks of (diastereomer) crystallisation can be overcome by FREX: FREX does not involve solid-phase handling, the chiral selector is not consumed, and with the identified versatile extractant FREX is also more flexible than crystallisation. Crystallisation will probably remain the separation method of choice for those enantiomers that can be separated with very high selectivity in only one or two steps. As SMB chromatography also has the mentioned advantages compared to crystallisation, outperforming SMB seems to be the real challenge for FREX. SMB seems to be gaining importance over crystallisation1 mainly because of the better versatility and therefore faster development time. This good versatility is caused by staging: a rather low selectivity is required for full separation compared to crystallisation. For a large-scale SMB separation, a selectivity of 1.3-2.0 is generally aimed at2 to ensure good productivity, which is comparable to the selectivity required for FREX (1.5-3.0). As a result, a similar process versatility seems possible in FREX. As for cost, enantioselective extractants can be expected to be less expensive than CSP’s, compared per mole of selector sites. The selectors for both techniques

Chapter 8
173
are similar in complexity, but only for SMB the selector has to be immobilised onto column material. At this moment SMB beats FREX in development time, because CSP materials are already available for most classes of enantiomers, whereas the availability of enantioselective extractants is very limited. The main advantage of FREX, compared to SMB, is that the chiral selector (and therefore the enantiomer feed) can be present at a much higher volumetric concentration. As a result, the capacity is higher, which results in smaller process equipment. Additionally, SMB requires high pressures and constant switching of streams. For all these reasons, FREX equipment is expected to be less expensive, both in capital cost, energy input and maintenance. Furthermore, it has been shown in chapter 4 that the extent of complexation is higher at higher concentrations (higher loading at equal excess of extractant), so the selector is used more effectively in FREX and a lower excess is required. As for dilution, the product streams in SMB are in general diluted by a factor 1-3 for the raffinate and 4-10 for the extract compared to the feed.2,3 Dilution in FREX is less: a FREX process can be designed in such a way that the raffinate will be diluted only 2 times (a W/F ratio lower than about unity is not favourable for the separation), and the extract can even be concentrated compared to the feed by applying different conditions for back-extraction. Summarising, FREX has clear advantages over other industrial separation techniques such as SMB. However, although the technical feasibility of FREX for amino-alcohol/amine separation has been described, the technology is much less developed than SMB. The major issues that still need to be solved before FREX may be adopted as industrial separation technique are:
• process design, flow sheet, economic evaluation, trials on kg/day scale
• equipment design and scale-up methodology
• identification of extractants for enantiomers from other major chemical classes
8.3 Outlook 8.3.1 Process design A conceptual process design for a specific amine or amino-alcohol separation may be drafted based on the available data. The capacity and purity requirements should be set and the solubility of enantiomers, extractants and complexes should be determined experimentally to find the maximum concentrations. Then a number of process configurations can be identified using the multistage model, in terms of S/F ratio, stages, process conditions and types of equipment, and be compared by an economical evaluation to find the best alternative. A combination of FREX with other techniques is possible, for instance FREX as main separation with crystallisation as final purification, or purification by FREX of an enantio-enriched product from asymmetric synthesis. For further proof and for marketing purposes, it is essential that pilot tests are carried out on a kg/day scale in industrial extraction equipment.

Conclusions & outlook
174
8.3.2 Equipment design and scale-up Equipment for FREX differs from most conventional equipment for (reactive) extraction in a number of ways: a large number of stages should be realised in a relatively low volume, two separation sections should be present and a wide range of phase ratios should be allowed. For reliable scale-up and equipment design for FREX, the correct determination of reaction kinetics in reactive extraction deserves more attention. A multidisciplinary approach is recommended, in which both the role of mass transfer and physical extraction is incorporated as well as surfactant behaviour of extractants and complexes. It seems that a combination of experimental techniques will be required, such as experiments in an improved model reactor in combination with analysis of the surface processes by novel spectroscopic techniques.
8.3.3 Extractant development & design The proposed selection method is expected to be useful to identify enantioselective extractants for other classes of enantiomers than amines/amino-alcohols in the chiral recognition literature. There is a wealth of material on chiral recognition that can be exploited further. Often, the selectors obtained from the literature should be adapted before they can be used as extractants, for instance by connecting an alkyl tail to a molecule to increase hydrophobicity, while preserving the selectivity. Cooperation of chemists and chemical engineers is essential here. Regarding the design of chiral selectors for chromatography (CSP’s), it was stated by Pirkle
and Pochapsky4 that ‘the CSP designer should maximise ∆∆G while minimising the absolute
value of ∆G to improve chromatographic efficiency’. However, in extraction the strength of
the complexation (∆G) determines the capacity of the forward extraction step, so it should not be minimised at all. Efficient product recovery can be realised under different process
conditions. For a selectivity between 1.5 and 3, ∆∆G should be between 1.0 and 2.7 kJ/mol (at
ambient temperature), regardless of the strength (∆G) of the interaction. Therefore, in contrast
with the CSP designer, the enantioselective extractant designer should try to realise a
sufficiently high ∆∆G for a high selectivity and a high ∆G for a high process capacity, and
ensure that a method is available to carry out back-extraction efficiently. Finally, measures to prevent loss of extractant by leaching and/or entrainment should be taken.
References 1 Rouhi AM. Chiral Chemistry. Chem Eng News 2004;82(24):47-62 2 Schulte M, Strube J. Preparative enantioseparation by simulated moving bed chromatography (review). J Chromat A 2001;906:399-416 3 Strube J, Jupke A, Epping A, Schmidt-Traub H, Schulte M, Devant R. Design, optimization and operation of SMB chromatography in the production of enantiomerically pure pharmaceuticals. Chirality 1999;11:440-450 4 Pirkle WH, Pochapsky TC. Considerations of chiral recognition relevant to the liquid chromatographic separation of enantiomers. Chem Rev 1989;89:347-362

List of symbols
175
List of symbols Abbreviations; species may be used as subscripts. A acid (in acid-base dissociation constant) AAS atomic absorption spectrometry C, CE (crown ether) extractant CD circular dichroism
CE capillary electrophoresis C12Hyp, HLi N-dodecyl-L-hydroxyproline ligand CCC counter-current chromatography CMP chiral mobile phase CSP chiral stationary phase Cu(II), Cu copper(II) ion FREX fractional reactive extraction HR, HR+ ammonium ion of S-enantiomer HS, HS+ ammonium ion of R-enantiomer PEA phenylethylamine PG phenylglycinol PP polyprolylene R R-enantiomer (neutral) RC complex of extractant and R-enantiomer S S-enantiomer (neutral) SC complex of extractant and S-enantiomer TLC thin layer chromatography UF ultrafiltration Physico-chemical parameters A interfacial area m2 Al Hinterland ratio [-] D diffusion coefficient m2/s E extraction factor [-] E, EA enhancement factor (in reaction kinetics) [-] E Electric field (electrophoresis) F feed stream (flow rate) m3/s J extraction flux kmol/m2/s Ha Hatta number [-] K overall mass transfer coefficient m/s K complexation constant (index: compound) depends on stoichiometry [ ] concentration kmol/m3 N volumetric extraction rate kmol/m3/s

List of symbols
176
N number of equilibrium stages [-] NTU number of transfer units [-] O interfacial area (in chapter 5) m2 P partitioning ratio (physical) org/aq concentration [-] S solvent stream (flow rate) m3/s T temperature °C V volume m3 W wash stream (flow rate) m3/s a specific interface m2/m3 e.e. enantiomeric excess [-] f friction factor (electrophoresis) J⋅s/cm2 kL partial mass transfer coefficient (index L) m/s k1,1, kn,m reaction rate constant depends on stoichiometry q effective charge (electrophoresis) C rpm rotations per minute x, y mole fraction (Kremser/Fenske) y
α selectivity [-]
δ film layer thickness m
µ electrophoretic mobility cm2/V⋅s subscripts aq aqueous (phase) bulk in the liquid bulk chem ‘chemical’, refers to reactive system i interfacial ini initial (at t=0) int intrinsic (selectivity) op operational (selectivity) org organic (phase) phys ‘physical’, refers to non-reactive system tot total (sum of species) 1 ‘feed phase’ = aqueous phase 1 strongest extracted enantiomer 2 ‘reactive phase’ = organic phase 2 weakest extracted enantiomer
∞ infinite
superscripts S surface

Publications
177
List of publications Reviewed papers & conference proceedings 1. M. Steensma, N.J.M. Kuipers, A.B. de Haan and G. Kwant. Optimisation of process
conditions for industrial separation of amino acid enantiomers by fractional reactive extraction. Proceedings of the International Solvent Extraction Conference, ISEC 2002; p. 620-625; South African Institute of Mining and Metallurgy: Johannesburg, 2002
2. A.B. de Haan, N.J.M. Kuipers, M. Steensma. Opportunities for extraction technology in chiral separations. Proceedings of the International Solvent Extraction Conference, ISEC 2002; p. 589-596; South African Institute of Mining and Metallurgy, Johannesburg, 2002
3. M. Steensma, N.J.M. Kuipers, A.B. de Haan and G. Kwant. Identification of enantioselective extractants for chiral separation of amines and amino-alcohols. Submitted to Chirality.
4. M. Steensma, N.J.M. Kuipers, A.B. de Haan and G. Kwant. Influence of process parameters on extraction equilibria for the chiral separation of amines and amino-alcohols with a chiral crown ether. Submitted to the Journal of Chemical Technology and Biotechnology.
5. M. Steensma, R.J.G.W. Stoffele, M.J. Rouhof, N.J.M. Kuipers, A.B. de Haan, G. Kwant. Fractional reactive extraction for chiral separation of amino-alcohols and amines: a pilot plant study. Submitted to International Solvent Extraction Conference, ISEC 2005, Beijing, China.
6. M. Steensma, N.J.M. Kuipers, A.B. de Haan and G. Kwant. Determination of reaction kinetics in reactive extraction for chiral separation of amino acids and amino-alcohols. Manuscript in preparation.
7. M. Steensma, N.J.M. Kuipers, A.B. de Haan and G. Kwant. Multistage equilibrium modelling of fractional reactive extraction for chiral separation. Manuscript in preparation.
Non-reviewed conference proceedings 1. M. Steensma, N.J.M. Kuipers, A.B. de Haan and G. Kwant. Extractant design for the
separation of enantiomers by reactive extraction. Proceedings of AIChE annual meeting 2003, p. 396-403; American Institute of Chemical Engineers: New York, 2003.
2. M. Steensma, N.J.M. Kuipers, A.B. de Haan and G. Kwant. Development and optimisation of an enantioselective extractant for chiral separation of amino-alcohols by reactive extraction. Proceedings of CHISA 2004, Prague, Czech Republic, 2004.

178