Chipotle Mexican Grill Equity Evaluation
35
Chipotle Mexican Grill Equity Analysis CHIPOTLE MEXICAN GRILL (CMG) May 6, 2015 Authored by: Erik Berg & Michael Martocci
-
Upload
michael-martocci -
Category
Documents
-
view
72 -
download
3
Transcript of Chipotle Mexican Grill Equity Evaluation
Authored by:

1
TABLE OF CONTENTS
Executive Summary 2
Company and Industry Background 3Peers 4-6
Analysis of Historical Financial Data 7
DCF Valuation 8-10Base Case DCF 8Bear Case DCF 9Bull Case DCF 10
Relative Valuation 11
EBITDA Exit Multiple Valuation 12
Conclusion 13
References 15
Tables and Figures 16-24

2
EXECUTIVE SUMMARY
Chipotle is Overvalued by 10.3%Chipotle closed on 5/4/2015 at $633.57 a share.
According to the combined results of various valuation models our analysts have determined that Chipotle shares represent a value of $568.52 (See Figure 1). This means that Chipotle is currently trading at a 10.3% premium. Despite this overvaluation, it is our belief that Chipotle is an excellent company that will see significant growth in coming years, just not the levels of growth that it’s current price tag would indicate.
Market has High Expectations of Growth Chipotle has grown at an electric pace over the past
decade. It has benefitted from macroeconomic trends such as the growth of the “fast-casual” dining segment, increased consumer health consciousness, and increased consumer frugality. While we are bullish on the future of Chipotle, to be worth the implied market valuation it would need to see even greater growth over the next 10 years than it has over the previous 10. It is our belief that Chipotle is a great company, with a strong future, but that sort of growth is unrealistic in all but the most perfect of economic climates.
Uncertainty ConcernsThere are four major areas of uncertainty regarding
the future of Chipotle. The first is its slow international expansion. Chipotle relies mostly on word-of-mouth marketing. It is uncertain if the international consumer base will take to Chipotle’s food offerings in the same way that the U.S. market has. The second area of uncertainty for Chipotle is its stubborn stance on responsible food sourcing. Chipotle’s hardline advocate stance against GMO foods and other foods produced in environmentally or socially irresponsible ways is an area of worry. While its “Food With Integrity” mission statement has resonated with consumers thus far, growing produce prices, drought
Recommendation
HOLD
Price Target
$568.52
Price Target Range
$454.36-$610.27
TTM Stock Chart

3
COMPANY AND INDUSTRY BACKGROUND
Chipotle Mexican Grill is a chain of fast-casual restaurants serving Mexican-themed food. It is focused on providing the sort of high-quality food otherwise found in full-service restaurants with the same speed and convenience that consumers expect from a fast-food chain. It was one if the first restaurants in the “fast-casual” segment of the restaurant industry. It has a simple menu and only uses high-quality raw ingredients. Chipotle’s mission statement is “Food With Integrity” and it has pledged to insure that all of its food is produced in an environmentally and societally conscious way.
Founder Steve Ells opened the first Chipotle in Denver, Colorado in 1993. Within one month the original restaurant was selling over 1,000 burritos a day. The restaurants were an immediate success and Ells had opened 16 restaurants by 1998 when McDonald’s Corporation became a major investor. Chipotle grew rapidly after McDonald’s investment and had opened over 500 stores by 2005. On January 26th, 2006, Chipotle made its initial public offering at $22.00 a share. Chipotle’s IPO was, at the time, the best U.S. IPO in six years. In October of 2006 McDonald’s fully divested from Chipotle. In August 2008 Chipotle opened its first international location in Toronto, Canada. Chipotle now also has restaurants in England, France, and Germany. All of Chipotle’s restaurants are company-owned.
Chipotle is part of the “fast-casual” segment of the restaurant industry. Fast-casual restaurants provide higher-quality food than traditional fast food restaurants while preparing the food faster than one would expect at a full table service establishment. They generally use less frozen or processed foods than the typical fast food restaurant. Costumers can eat in at tables located within the restaurant or take their food out once it is ready. The typical price point for a fast-casual restaurant is between $8-$15. This is up to 40% higher than the average fast food meal, but trends are that consumers are willing to pay more for higher quality food. Fast-casual restaurants only began to truly gain in popularity in the early 2000’s. Since that time they have been one of the fastest growing segments of the restaurant market. According to the Economist, sales from fast-casual restaurants rose by 10.5% in 2014 compared to 6.1% for fast food chains. Chipotle was one of the first truly popular fast-casual restaurants and led the way for others such as Panera Bread, Shake Shack,
4
PEERS
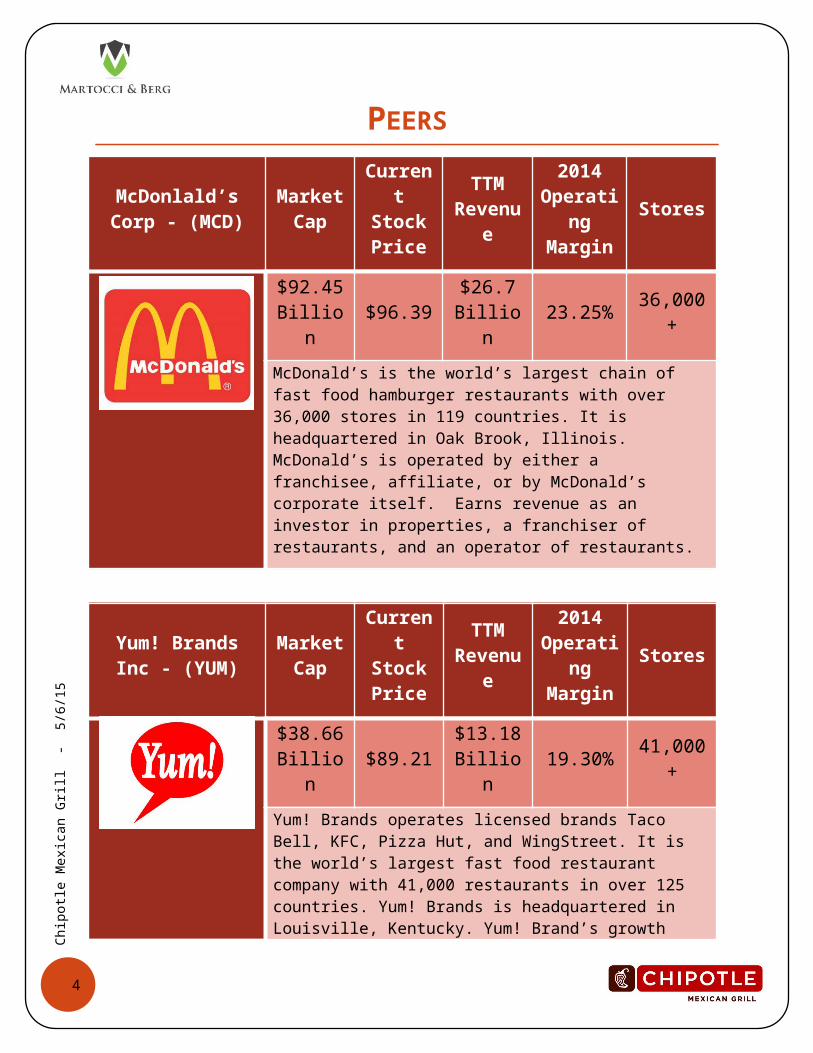
McDonlald’s Corp - (MCD)
Market Cap
Current Stock Price
TTM Reven
ue
2014 Operati
ng Margin
Stores
$92.45 Billion
$96.39$26.7 Billion
23.25%36,000
+
McDonald’s is the world’s largest chain of fast food hamburger restaurants with over 36,000 stores in 119 countries. It is headquartered in Oak Brook, Illinois. McDonald’s is operated by either a franchisee, affiliate, or by McDonald’s corporate itself. Earns revenue as an investor in properties, a franchiser of restaurants, and an operator of restaurants.
Yum! Brands Inc - (YUM)
Market Cap
Current Stock Price
TTM Reven
ue
2014 Operati
ng Margin
Stores
$38.66 Billion
$89.21$13.18 Billion
19.30%41,000
+
Yum! Brands operates licensed brands Taco Bell, KFC, Pizza Hut, and WingStreet. It is the world’s largest fast food restaurant company with 41,000 restaurants in over 125 countries. Yum! Brands is headquartered in Louisville, Kentucky. Yum! Brand’s growth relies on international expansion.
Darden Restaurants Inc. - (DRI)
Market Cap
Current Stock Price
TTM Reven
ue
2014 Operati
ng Margin
Stores
$7.75 Billion
$61.64$6.54 Billion
9.84% 2,100+

5
Darden Restaurants is the world’s largest full-service restaurant company and operates casual dining chains such as Olive Garden, LongHorn Steakhouse, Bahama Breeze, Seasons 52, and The Capital Grille. Darden has 2,100 restaurant locations worldwide. Darden Restaurants Inc is based in Orlando, Florida.
PEERS (CONT.)
Domino’s Pizza Inc - (DPZ)
Market Cap
Current Stock Price
TTM Reven
ue
2014 Operati
ng Margin
Stores
$5.90 Billion
$106.13
$2.04 Billion
18.77%10,000
+
Domino’s is a pizza delivery and restaurant chain headquartered in Ann Arbor, Michigan. With more than 10,000 stores, Domino’s is the second-largest pizza chain in the U.S. and the largest worldwide. Domino’s has had a resurgence after changing their pizza recipe and rebranding to focus on quality.
Panera Bread Company -
(PNRA)
Market Cap
Current Stock Price
TTM Reven
ue
2014 Operati
ng Margin
Stores
$4.89 Billion
$182.24
$2.53 Billion
7.89% 1,800+
Panera Bread is a chain of fast casual bakery-café restaurants headquartered in Sunset Hills, Missouri. Panera Bread operates or franchises 1,800 locations in the United States. Panera focuses on healthy options and freshly made baked goods.
The Wendy’s Market Curren TTM 2014 Stores

6
Company - (WEN)
Capt Stock Price
Revenue
Operating
Margin
$4.11 Billion
$11.19$2.06 Billion
10.30% 6,650+
Wendy’s is the world’s third largest hamburger fast food chain with approximately 6,650 locations worldwide. It is headquartered in Dublin, Ohio and is known for its “old fashioned” aesthetic. Wendy’s signature items are its square hamburgers and “Frosty” dessert.
PEERS (CONT.)
Brinker International Inc. – (EAT)
Market Cap
Current Stock Price
TTM Reven
ue
2014 Operati
ng Margin
Stores
$3.41 Billion
$54.04$2.99 Billion
13.16% 1,500+
Brinker International is an international restaurant company that owns the chains Chili’s and Maggiano’s. It operates over 1,500 restaurants worldwide and is headquartered in Dallas, Texas.
Jack in the Box Inc. – (JACK)
Market Cap
Current Stock Price
TTM Reven
ue
2014 Operati
ng Margin
Stores
$3.38 Billion
$88.90$1.50 Billion
13.49% 2,200+

7
Jack in the Box is a fast food restaurant that serves hamburgers and a selection of international themed foods. The company also operates Qdoba Mexican Grill. It is headquartered in San Diego, California and operates 2,200 locations predominantly on the West Coast of the United States.
Papa Jon’s International Inc. – (PZZA)
Market Cap
Current Stock Price
TTM Reven
ue
2014 Operati
ng Margin
Stores
$2.56 Billion
$64.14$1.60 Billion
10.30% 4,600+
Papa John’s is the third largest pizza delivery chain in the world and is headquartered in Jeffersontown, Kentucky. It operates over 4,600 establishments in 35 countries. It is predominately operated using a franchise model and was the first pizza chain to make online ordering available.
ANALYSIS OF HISTORICAL FINANCIAL DATA
Chipotle has incredibly strong financials
Balance SheetCash and cash equivalents has been rising at a strong pace, increasing
22% between 2013 and 2013, and rising another 31% between 2013 and 2014. Additionally, Chipotle has been able to maintain a working capital ratio of above 3, signaling that they are more than capable of meeting their short

8
terms obligations. Property, Plant, and Equipment (PPE) have nearly double since 2010, signaling that Chipotle has been investing heavily in its future growth. On the liabilities side, something that sticks out is that Chipotle ha no debt, neither long nor short term. Moreover they have no preferred stock. The capital structure of the firm is rather simple.
Income StatementStarting at the top line, revenue has been growing at a ferocious pace,
however in an unstable manner. Sales rose by 24% in 2011, 20% in 2012, 18% in 2013, and then shot up 28% in 2014. This was largely due to increased menu prices in 2014, yet also increased traffic in stores and growth in the number of stores. CoGS have seemed to breakout a bit to the high side after sticking to around 30-32% of revenue. The figure now stands at 34.4% of sales. Operating expenses as a percent of revenues, on the other hand, are trending down, as it seems Chipotle is benefitting from a greater spreading of fixed costs as well as a decreased need for marketing spend due to social media and word of mouth campaigns. With revenues rising faster than costs have, operating income, as a percent of sales has trended higher, reaching 18% in 2014 versus 10% in 2008. Overall both growth and margins have been up and to the right.
Cash Flow StatementSomething that sticks out on the cash flow statement is the ability of
the firm to generate cash flow in excess of net income, a good sign, as they can put that cash to good use. Additionally, the firm seems to be tying up large amounts of cash into investing activities that should fuel future growth if they pan out well.

9
DCF VALUATION
DCF OverviewFor Chipotle’s discounted cash flow analysis (DCF) we came up with
three different scenarios, base, bear, and bull. Chipotle does a good job of generating cash flow as it has healthy margins, little need for working capital, and a favorable cash conversion cycle. To project sales growth, the driver of much of our other projections, we turned to comparable store sales, growth in number of stores, and average sales at each store, based on the number of stores at the end of the year. We got a sense of what percentage average store sales change based on a change in comparable store sales. We then paired this with projections for number of new stores to get estimates for revenues. For costs we looked to management guidance, paired with long-term averages and trends, to give us an idea of expectations. WACC was simply calculated due to Chipotle’s lack of debt (See Figure 19). Our terminal growth rate is a combination of inflation projections and US GDP projections. However with the difficulty in coming up with a terminal growth rate, we also performed an EBITDA Exit Multiple valuation to come up with what we feel to be a more accurate terminal value.
Base CaseOur base case assumes that Chipotle will experience mid single digit
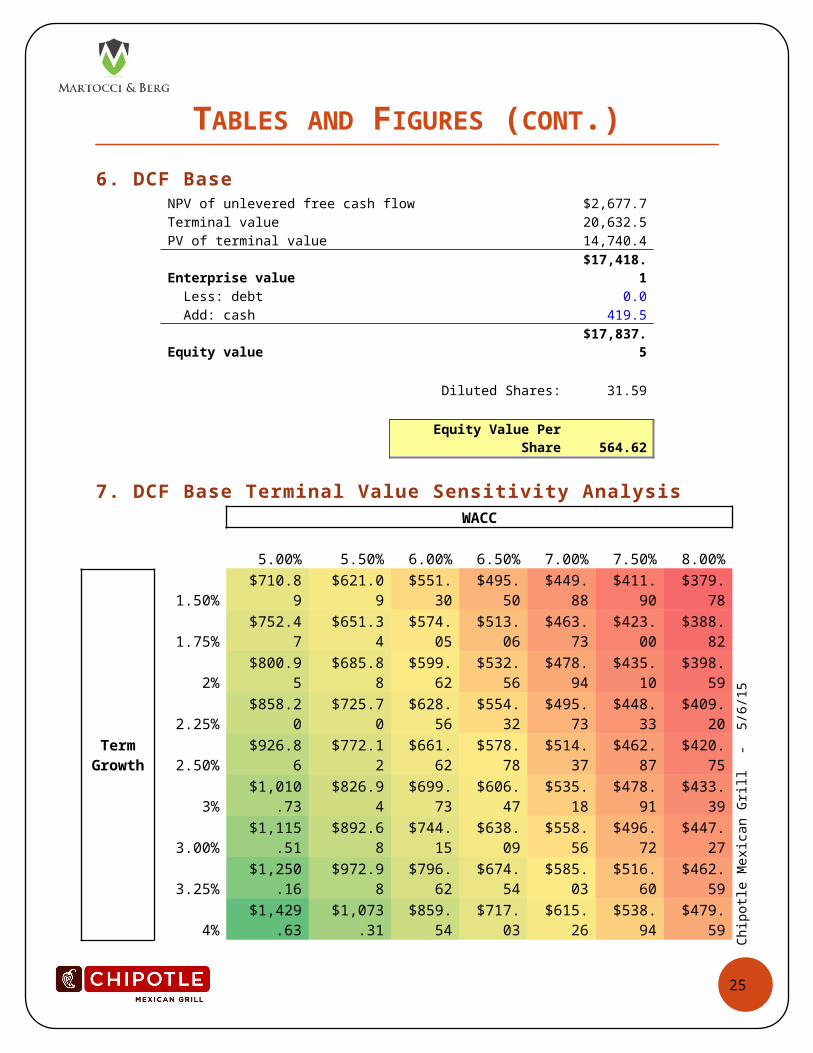
comparable store sales growth in 2015, as they predict, and decline slightly each year then on. The base case also assumes that Chipotle will add 185 stores each year up for the next 5 years, as they look to “significantly increase” the number of new locations. The base case also assumes that Chipotle’s cost of goods sold will remain at their long-term average of 33.5%. With all of these factors incorporated, the base case DCF implies a per share price for Chipotle of $564.62, signaling a 10.8% overvaluation in the market. We give this scenario a 65% of occurring. (For Base Case DCF Sensitivity Analysis see Figures 7 & 8)
NPV of unlevered free cash flow $2,677.7
Terminal value 20,632.5
PV of terminal value 14,740.4
Enterprise value $17,418.1
Less: debt 0.0

10
Add: cash 419.5
Equity value $17,837.5
Diluted Shares: 31.59
Equity Value Per Share 564.62
DCF VALUATION (CONT.)
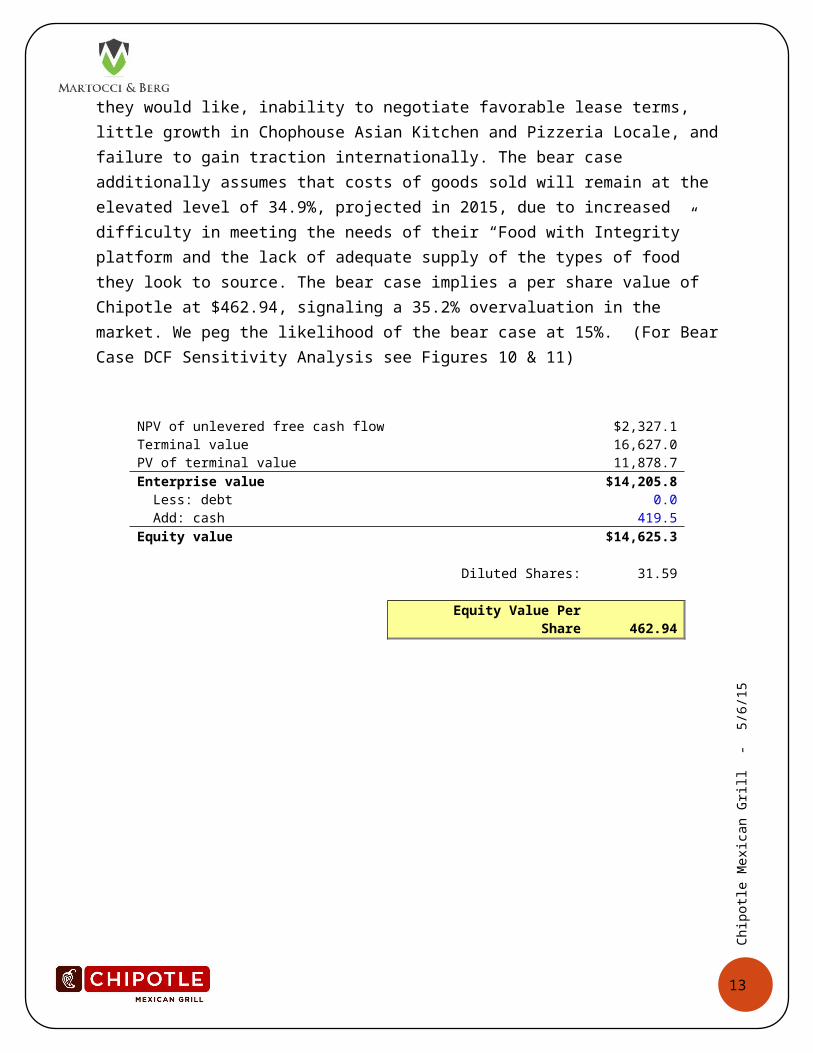
Bear CaseOur bear case paints a grimmer picture, as one might expect. The bear
case predicts that comparable store sales growth, in 2015, will be in the low single digits, then declining slightly each year, as comps become harder to beat. The bear case also assumes that just 700 new stores will be opened over the next 5 years, a far cry from the 925 new locations assumed in the base case. This lower number for new locations could materialize as the result of saturation in the US market, making it hard for Chipotle to find worthwhile new properties, inability to train enough employees in a timey manner to open stores at the pace they would like, inability to negotiate favorable lease terms, little growth in Chophouse Asian Kitchen and Pizzeria Locale, and failure to gain traction internationally. The bear case additionally assumes that costs of goods sold will remain at the elevated level of 34.9%, projected in 2015, due to increased difficulty in meeting the needs of their “Food with Integrity” platform and the lack of adequate supply of the types of food they look to source. The bear case implies a per share value of Chipotle at $462.94, signaling a 35.2% overvaluation in the market. We peg the likelihood of the bear case at 15%. (For Bear Case DCF Sensitivity Analysis see Figures 10 & 11)
NPV of unlevered free cash flow $2,327.1Terminal value 16,627.0PV of terminal value 11,878.7Enterprise value $14,205.8 Less: debt 0.0 Add: cash 419.5
11
Equity value $14,625.3
Diluted Shares: 31.59
Equity Value Per Share 462.94

12
DCF VALUATION (CONT.)
Bull CaseOur bull case puts Chipotle in the most favorable light of the three
cases. The bull case predicts that comparable store sales will grow in the low double digits, and tapering off to high single digits by 2019. This then implies average restaurant sales to grow in the high single digits. The bull case also assumes large-scale growth in the number of new locations. The model assumes that Chipotle will add 200 new locations in 2015 and 2016, 220 new locations in 2017 and 2018, and 160 more in 2019, for a total of 1000 new locations. This growth in new locations would be fueled by Chipotle’s ability to find new/favorable US locations, increase their awareness abroad, and growth the Chophouse Asian Kitchen and Pizzeria Locale brands. If Chipotle is able to successfully grow their two other lines and gain traction in international markets, our estimation of 1000 new locations between now and 2019, could prove to be an underestimation. The bull case also assumes that cost of goods sold will remain at the historical average of 33.5%. The bull case implies a per share price of $702.41, signaling the market is undervaluing shares by 10.9%. We put the likelihood of the bull case materializing at 20%. (For Bull Case Sensitivity Analysis see Figures 4 & 5)
NPV of unlevered free cash flow $3,251.6
Terminal value 25,922.4
PV of terminal value 18,519.6
Enterprise value $21,771.2
Less: debt 0.0
Add: cash 419.5
Equity value $22,190.7
Diluted Shares: 31.59
Equity Value Per Share 702.41
DCF SynthesisWhen considering the various possible outcomes for Chipotle, the DCF models come up with varied potential share prices. To come up with a single summary statistic share price we did a weighted average of the three case based on the likelihood of each occurring. After doing this we arrived at a DCF implied per share price of $576.93, 7.8% below the current share price in the market.
13
Weighted DCF ValuationState of the World Likelihood of Occurrence Stock PriceBull 20% $702.41Base 65% $564.62Bear 15% $462.94
Weighted DCF Valuation $576.93
RELATIVE VALUATION
Over Valuation According to Relative Valuation
Chipotle is overvalued according to a relative valuation analysis. When compared to the industry peer group mentioned above (see figure 11), a relative valuation analysis found Chipotle stock to be overvalued significantly. Chipotle closed at $633.57 on 5/4/15. If the relative valuation share values represent the true value of Chipotle shares it would mean that CMG is trading at between approximately a 40% premium. We believe that while Chipotle is currently trading at a premium, it is much less than 40%. It is our belief that a relative valuation of Chipotle is not the best estimate of Chipotle’s value. Chipotle has grown at a much faster pace relative to the restaurant industry and has positioned itself as a leader in the category. It is only natural that it appears overvalued when compared to industry peers. There are however, some question marks raised as to the intrinsic value of Chipotle compared to market expectations.
Mean RV Share Calculations
Comparison Metric EV Equity Value Equity Value/Share Earnings 14,956.27 482.04 EBITDA 12,307.27 13,065.32 421.10
EBIT 12,817.49 13,575.54 437.54 Sales (P/S) 8,972.68 289.19
Sales (EV/Sales) 10,012.58 10,770.63 347.14
Average Mean RV Share Value $395.40
Median RV Share Calculations Comparison Metric EV Equity Value Equity Value/Share
Earnings 15,799.54 509.22 EBITDA 11,673.10 12,431.16 400.66
EBIT 13,303.66 14,061.71 453.21 Sales (P/S) 7,985.26 257.36
Sales (EV/Sales) 9,273.20 10,031.26 323.31

14
EBITDA EXIT MULTIPLE VALUATION
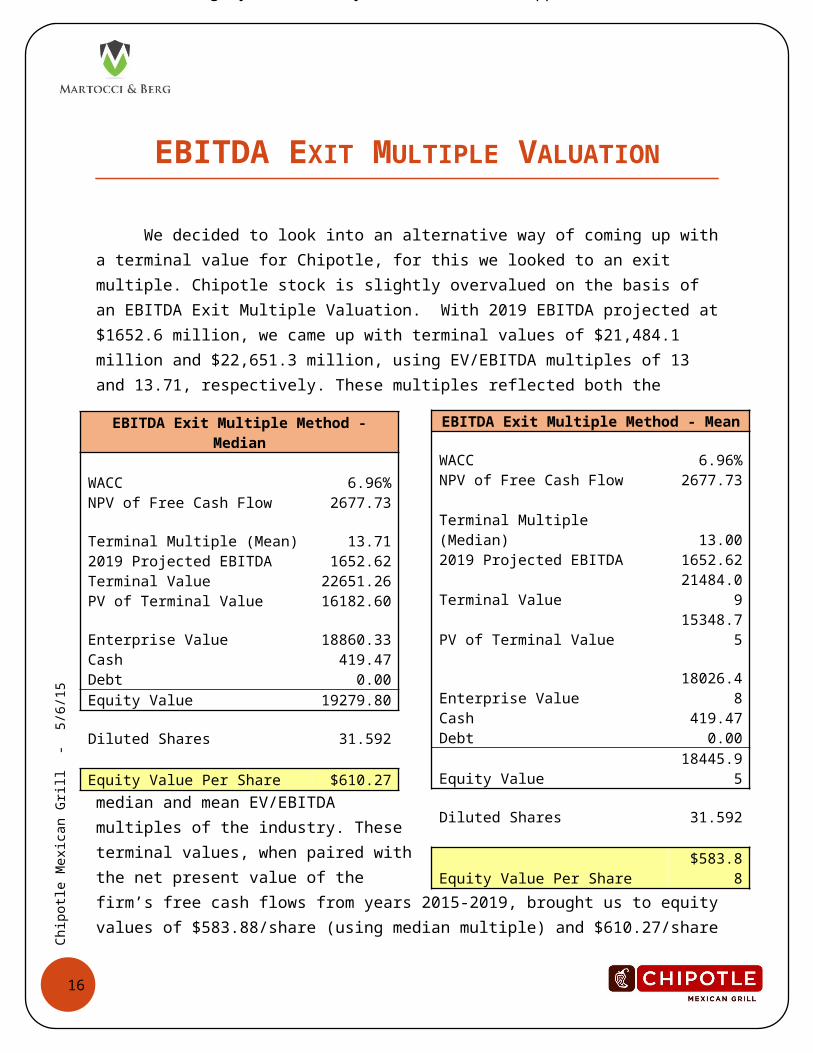
We decided to look into an alternative way of coming up with a terminal value for Chipotle, for this we looked to an exit multiple. Chipotle stock is slightly overvalued on the basis of an EBITDA Exit Multiple Valuation. With 2019 EBITDA projected at $1652.6 million, we came up with terminal values of $21,484.1 million and $22,651.3 million, using EV/EBITDA multiples of 13 and 13.71, respectively. These multiples reflected both the median and mean EV/EBITDA multiples of the industry. These terminal values, when paired with the net present value of the firm’s free cash flows from years 2015-2019, brought us to equity values of $583.88/share (using median multiple) and $610.27/share (using mean multiple). We then took an average
of the two methods to arrive at an implied share price of $597.08, signaling an overvaluation in the market of 4.57%. (For Sensitivity Analysis see Figures 18 & 16 respectively)
Average $597.08
Over Valuation According to Relative Valuation
Chipotle is overvalued according to a relative valuation analysis. When compared to the industry peer group mentioned above (see figure 11), a relative valuation analysis found Chipotle stock to be overvalued significantly. Chipotle closed at $633.57 on 5/4/15. If the relative valuation share values represent the true value of Chipotle shares it would mean that CMG is trading at between approximately a 40% premium. We believe that while Chipotle is currently trading at a premium, it is much less than 40%. It is our belief that a relative valuation of Chipotle is not the best estimate of Chipotle’s value. Chipotle has grown at a much faster pace relative to the restaurant industry and has positioned itself as a leader in the category. It is only natural that it appears overvalued when compared to industry peers. There are however, some question marks raised as to the intrinsic value of Chipotle compared to market expectations.
Mean RV Share Calculations
Comparison Metric EV Equity Value Equity Value/Share Earnings 14,956.27 482.04 EBITDA 12,307.27 13,065.32 421.10
EBIT 12,817.49 13,575.54 437.54 Sales (P/S) 8,972.68 289.19
Sales (EV/Sales) 10,012.58 10,770.63 347.14
Average Mean RV Share Value $395.40
Median RV Share Calculations Comparison Metric EV Equity Value Equity Value/Share
Earnings 15,799.54 509.22 EBITDA 11,673.10 12,431.16 400.66
EBIT 13,303.66 14,061.71 453.21 Sales (P/S) 7,985.26 257.36
Sales (EV/Sales) 9,273.20 10,031.26 323.31
EBITDA Exit Multiple Method - Mean
WACC 6.96%NPV of Free Cash Flow 2677.73
Terminal Multiple (Median) 13.002019 Projected EBITDA 1652.62Terminal Value 21484.09PV of Terminal Value 15348.75
Enterprise Value 18026.48Cash 419.47Debt 0.00Equity Value 18445.95
Diluted Shares 31.592
Equity Value Per Share $583.88
EBITDA Exit Multiple Method - Median
WACC 6.96%NPV of Free Cash Flow 2677.73
Terminal Multiple (Mean) 13.712019 Projected EBITDA 1652.62Terminal Value 22651.26PV of Terminal Value 16182.60
Enterprise Value 18860.33Cash 419.47Debt 0.00Equity Value 19279.80
Diluted Shares 31.592
Equity Value Per Share $610.27

15
16
CONCLUSION
We Believe in Chipotle
Chipotle is an excellent company. They have grown at an incredible rate during their time as a public company and we at Martocci & Berg fully expect this growth to continue into the future. They are the undisputed leader in the “fast-casual” restaurant segment. No one in the segment serves as high quality food, to as many customers, at the same speed that Chipotle does. They train and promote from within and their employees believe in the vision of the company. Chipotle is experimenting with potentially exciting additions to the fast-casual dining space in their Chophouse Southeast Asian Kitchen and Pizzeria Locale restaurants. Chipotle’s management team has proven itself capable of nurturing a growing company into a powerhouse and we have every confidence that they will continue to lead Chipotle wisely.
But Chipotle is Not Perfect
Not for the first time, Chipotle is faced with an uncertain future. In the past, Chipotle has proved itself to be innovative and highly disruptive, but we are not sure that level of performance can continue. We believe that the market is overestimating Chipotle’s growth levels over the next 5-10 years. Chipotle exploded across the United States and that is showing no signs of stopping, but its fate internationally is far less certain. Chipotle so far has opened 17 restaurants outside of the United States. Non as of yet seem to have taken off the way they have in the U.S. Chipotle relies on predominately word of mouth marketing and there is no guarantee that Chipotle will reach the breaking point of momentum necessary to see sustained growth in the international markets. There are other question marks surrounding Chipotle as well such as the wisdom of its hard-liner stance on food supply chain transparency and its subsidiary restaurant chains.
Hold Recommendation

17
We at Martocci & Berg will be holding steady in our Chipotle positions and we suggest you do the same. Our valuation models suggest that Chipotle is currently trading at approximately a 10.3% premium. Given the uncertain climate surrounding Chipotle, we think the markets are overestimating the short-term future growth potential of Chipotle. That being said, we think Chipotle is an incredibly strong company and are very bullish on it’s future. Chipotle won’t grow enough to justify its current price tag, but if you are already along for the ride, we believe that you will like where you are going.

18
Thanks so Much Professor Atanasov!
Next Burrito is on us! – Erik & Michael

19
REFERENCES
Data collected for this report from: Bloomberg Yahoo! Finance Chipotle’s 2014 10-K Wikipedia Chipotle’s IPO statement Chipotle’s latest 10-Q Chipotle’s 2014 Annual Report FRED Treasury Yield Database NYU Implied Risk Premium Calculator

20
TABLES AND FIGURES
1. Valuation Matrix
Valuation Matrix
Valuation Technique WeightStock Price
RV Mean 5% $395.40RV Median 5% $388.75Weighted DCF 40% $576.93EBITDA Exit Multiple Median 25% $583.88EBITDA Exit Multiple Mean 25% $610.27
Calculated Share Value $568.52
2. Weighted DCF Valuation
Weighted DCF ValuationState of the World Likelihood of Occurrence Stock PriceBull 20% $702.41Base 65% $564.62Bear 15% $462.94
Weighted DCF Valuation $576.93
3. DCF BullNPV of unlevered free cash flow $3,251.6
Terminal value 25,922.4
PV of terminal value 18,519.6
Enterprise value $21,771.2
Less: debt 0.0
Add: cash 419.5
Equity value $22,190.7
Diluted Shares: 31.59
Equity Value Per Share 702.41

21
TABLES AND FIGURES (CONT.)
4. DCF Bull Terminal Growth Sensitivity AnalysisWACC
702.41 5.00% 5.50% 6.00% 6.50% 7.00% 7.50% 8.00%
Term Growth
1.50% $662.33 $579.24 $514.65 $463.00 $420.78 $385.61 $355.881.75% $700.79 $607.21 $535.69 $479.25 $433.59 $395.88 $364.24
2% $745.63 $639.16 $559.34 $497.28 $447.66 $407.08 $373.282.25% $798.58 $675.99 $586.12 $517.41 $463.19 $419.31 $383.092.50% $862.09 $718.93 $616.69 $540.03 $480.43 $432.76 $393.77
3% $939.67 $769.63 $651.94 $565.65 $499.67 $447.60 $405.463.00% $1,036.59 $830.44 $693.03 $594.89 $521.30 $464.07 $418.303.25% $1,161.14 $904.72 $741.56 $628.61 $545.79 $482.46 $432.47
4% $1,327.14 $997.52 $799.76 $667.92 $573.75 $503.13 $448.20
5. DCF Bull COGS Growth Sensitivity AnalysisWACC
702.41 5.00% 5.50% 6.00% 6.50% 7.00% 7.50% 8.00%
CoGS 2016 on
32.0% $1,182.66 $946.80 $789.59 $677.30 $593.10 $527.62 $475.2532.5% $1,154.57 $924.43 $771.02 $661.45 $579.29 $515.40 $464.3033.0% $1,126.48 $902.05 $752.45 $645.61 $565.49 $503.18 $453.3533.5% $1,098.39 $879.67 $733.88 $629.76 $551.68 $490.96 $442.3934.0% $1,070.30 $857.30 $715.31 $613.91 $537.87 $478.74 $431.4434.5% $1,042.20 $834.92 $696.75 $598.06 $524.06 $466.52 $420.4935.0% $1,014.11 $812.54 $678.18 $582.21 $510.25 $454.30 $409.5435.5% $986.02 $790.17 $659.61 $566.37 $496.45 $442.07 $398.5936.0% $957.93 $767.79 $641.04 $550.52 $482.64 $429.85 $387.6336.5% $929.84 $745.41 $622.47 $534.67 $468.83 $417.63 $376.6837.0% $901.75 $723.04 $603.90 $518.82 $455.02 $405.41 $365.7337.5% $873.66 $700.66 $585.34 $502.98 $441.22 $393.19 $354.7838.0% $845.57 $678.28 $566.77 $487.13 $427.41 $380.97 $343.83

22
TABLES AND FIGURES (CONT.)
6. DCF BaseNPV of unlevered free cash flow $2,677.7
Terminal value 20,632.5
PV of terminal value 14,740.4
Enterprise value $17,418.1
Less: debt 0.0
Add: cash 419.5
Equity value $17,837.5
Diluted Shares: 31.59
Equity Value Per Share 564.62
7. DCF Base Terminal Value Sensitivity AnalysisWACC
564.62 5.00% 5.50% 6.00% 6.50% 7.00% 7.50% 8.00%
Term Growth
1.50% $710.89 $621.09 $551.30 $495.50 $449.88 $411.90 $379.781.75% $752.47 $651.34 $574.05 $513.06 $463.73 $423.00 $388.82
2% $800.95 $685.88 $599.62 $532.56 $478.94 $435.10 $398.592.25% $858.20 $725.70 $628.56 $554.32 $495.73 $448.33 $409.202.50% $926.86 $772.12 $661.62 $578.78 $514.37 $462.87 $420.75
3% $1,010.73 $826.94 $699.73 $606.47 $535.18 $478.91 $433.393.00% $1,115.51 $892.68 $744.15 $638.09 $558.56 $496.72 $447.273.25% $1,250.16 $972.98 $796.62 $674.54 $585.03 $516.60 $462.59
4% $1,429.63 $1,073.31 $859.54 $717.03 $615.26 $538.94 $479.59

23
TABLES AND FIGURES (CONT.)
8. DCF Base COGS Sensitivity AnalysisWACC
564.62 5.00% 5.50% 6.00% 6.50% 7.00% 7.50% 8.00%
CoGS 2016 on
32.0% $1,202.27 $961.76 $801.45 $686.96 $601.12 $534.38 $480.9932.5% $1,173.69 $939.00 $782.57 $670.86 $587.10 $521.97 $469.8833.0% $1,145.10 $916.24 $763.69 $654.76 $573.08 $509.56 $458.7733.5% $1,116.51 $893.48 $744.82 $638.65 $559.05 $497.16 $447.6634.0% $1,087.93 $870.72 $725.94 $622.55 $545.03 $484.75 $436.5534.5% $1,059.34 $847.96 $707.06 $606.45 $531.01 $472.35 $425.4335.0% $1,030.75 $825.20 $688.19 $590.35 $516.98 $459.94 $414.3235.5% $1,002.16 $802.44 $669.31 $574.24 $502.96 $447.54 $403.2136.0% $973.58 $779.68 $650.43 $558.14 $488.94 $435.13 $392.1036.5% $944.99 $756.92 $631.56 $542.04 $474.91 $422.72 $380.9837.0% $916.40 $734.16 $612.68 $525.93 $460.89 $410.32 $369.8737.5% $887.82 $711.39 $593.80 $509.83 $446.87 $397.91 $358.7638.0% $859.23 $688.63 $574.93 $493.73 $432.85 $385.51 $347.65
9. DCF Bear NPV of unlevered free cash flow $2,327.1Terminal value 16,627.0PV of terminal value 11,878.7Enterprise value $14,205.8 Less: debt 0.0 Add: cash 419.5Equity value $14,625.3
Diluted Shares: 31.59
Equity Value Per Share 462.94

24
TABLES AND FIGURES (CONT.)
10. DCF Bear Terminal Growth Sensitivity AnalysisWACC
462.94 5.00% 5.50% 6.00% 6.50% 7.00% 7.50% 8.00%
Term Growth
1.50% $662.33 $579.24 $514.65 $463.00 $420.78 $385.61 $355.881.75% $700.79 $607.21 $535.69 $479.25 $433.59 $395.88 $364.24
2% $745.63 $639.16 $559.34 $497.28 $447.66 $407.08 $373.282.25% $798.58 $675.99 $586.12 $517.41 $463.19 $419.31 $383.092.50% $862.09 $718.93 $616.69 $540.03 $480.43 $432.76 $393.77
3% $939.67 $769.63 $651.94 $565.65 $499.67 $447.60 $405.463.00% $1,036.59 $830.44 $693.03 $594.89 $521.30 $464.07 $418.303.25% $1,161.14 $904.72 $741.56 $628.61 $545.79 $482.46 $432.47
4% $1,327.14 $997.52 $799.76 $667.92 $573.75 $503.13 $448.20
11. DCF Bear COGS Sensitivity AnalysisWACC
462.94 5.00% 5.50% 6.00% 6.50% 7.00% 7.50% 8.00%
CoGS 2016 on
32.0% $1,182.66 $946.80 $789.59 $677.30 $593.10 $527.62 $475.2532.5% $1,154.57 $924.43 $771.02 $661.45 $579.29 $515.40 $464.3033.0% $1,126.48 $902.05 $752.45 $645.61 $565.49 $503.18 $453.3533.5% $1,098.39 $879.67 $733.88 $629.76 $551.68 $490.96 $442.3934.0% $1,070.30 $857.30 $715.31 $613.91 $537.87 $478.74 $431.4434.5% $1,042.20 $834.92 $696.75 $598.06 $524.06 $466.52 $420.4935.0% $1,014.11 $812.54 $678.18 $582.21 $510.25 $454.30 $409.5435.5% $986.02 $790.17 $659.61 $566.37 $496.45 $442.07 $398.5936.0% $957.93 $767.79 $641.04 $550.52 $482.64 $429.85 $387.6336.5% $929.84 $745.41 $622.47 $534.67 $468.83 $417.63 $376.6837.0% $901.75 $723.04 $603.90 $518.82 $455.02 $405.41 $365.7337.5% $873.66 $700.66 $585.34 $502.98 $441.22 $393.19 $354.7838.0% $845.57 $678.28 $566.77 $487.13 $427.41 $380.97 $343.83
25
TABLES AND FIGURES (CONT.)
12. Relative Valuation Comps
NAME TICKER P/E EV/EBITDAEV/Next Yr Est
EBIT P/S EV/SalesCHIPOTLE MEXICAN GRILL CMG 40.47 21.74 17.77 4.55 4.50
MCDONALD'S CORP MCD 19.84 10.75 13.82 3.55 3.76YUM! BRANDS INC YUM 29.30 16.63 15.65 2.89 2.81DARDEN RESTAURANTS DRI 35.66 16.89 1.27 1.36DOMINO'S PIZZA INC DPZ 36.13 18.47 17.11 2.97 3.55PANERA BREAD COMPANY PNRA 28.80 11.49 17.18 1.1 1.82WENDY'S CO/THE WEN 40.69 10.8 19.78 1.86 2.16BRINKER INTERNATIONAL EAT 18.77 11.71 12.83 1.21 1.54JACK IN THE BOX INC JACK 32.58 14.29 17.77 2.35 2.46PAPA JOHN'S INTL INC PZZA 35.80 15.51 1.61 1.53
High 40.69 18.47 19.78 3.55 3.76Average 30.84 13.71 16.38 2.09 2.33Median 32.58 13.00 17.00 1.86 2.16Low 18.77 10.75 12.83 1.10 1.36
13. Relative Valuation – Mean Mean RV Share Calculations
Comparison Metric EV Equity Value Equity Value/Share Earnings 14,956.27 482.04 EBITDA 12,307.27 13,065.32 421.10
EBIT 12,817.49 13,575.54 437.54 Sales (P/S) 8,972.68 289.19
Sales (EV/Sales) 10,012.58 10,770.63 347.14
Average Mean RV Share Value $395.40

26
TABLES AND FIGURES (CONT.)
14. Relative Valuation – MedianMedian RV Share Calculations
Comparison Metric EV Equity Value Equity Value/Share Earnings 15,799.54 509.22 EBITDA 11,673.10 12,431.16 400.66
EBIT 13,303.66 14,061.71 453.21 Sales (P/S) 7,985.26 257.36
Sales (EV/Sales) 9,273.20 10,031.26 323.31
Average Median RV Share Value $388.75
15. EBITDA Exit Multiple Valuation – MeanEBITDA Exit Multiple Method - Mean
WACC 6.96%NPV of Free Cash Flow 2677.73
Terminal Multiple (Median) 13.002019 Projected EBITDA 1652.62Terminal Value 21484.09PV of Terminal Value 15348.75
Enterprise Value 18026.48Cash 419.47Debt 0.00Equity Value 18445.95
Diluted Shares 31.592
Equity Value Per Share $583.88

27
TABLES AND FIGURES (CONT.)
16. EBITDA Exit Valuation – Mean – Sensitivity Analysis
EBITDA Multiple $583.88 11 12 13 14 15
WACC
5.00% $553.97 $594.95 $635.94 $676.93 $717.925.50% $542.05 $582.07 $622.10 $662.12 $702.156.00% $530.45 $569.54 $608.63 $647.72 $686.816.50% $519.17 $557.35 $595.54 $633.72 $671.907.00% $508.20 $545.50 $582.80 $620.09 $657.397.50% $497.53 $533.96 $570.40 $606.84 $643.288.00% $487.14 $522.74 $558.34 $593.94 $629.558.50% $477.03 $511.81 $546.60 $581.39 $616.189.00% $467.18 $501.18 $535.18 $569.18 $603.18
17. EBITDA Exit Valuation – MedianEBITDA Exit Multiple Method - Median
WACC 6.96%NPV of Free Cash Flow 2677.73
Terminal Multiple (Mean) 13.712019 Projected EBITDA 1652.62Terminal Value 22651.26PV of Terminal Value 16182.60
Enterprise Value 18860.33Cash 419.47Debt 0.00Equity Value 19279.80
Diluted Shares 31.592
Equity Value Per Share $610.27

28
TABLES AND FIGURES (CONT.)
18. EBITDA Exit Valuation – Median – Sensitivity Analysis
EBITDA Multiple $610.27 11 12 13 14 15
WACC
5.00% $548.90 $589.89 $630.87 $671.86 $712.855.50% $538.32 $578.34 $618.37 $658.39 $698.426.00% $528.03 $567.12 $606.21 $645.30 $684.396.50% $518.03 $556.21 $594.39 $632.57 $670.757.00% $508.31 $545.61 $582.90 $620.20 $657.507.50% $498.86 $535.29 $571.73 $608.17 $644.618.00% $489.66 $525.26 $560.87 $596.47 $632.078.50% $480.72 $515.51 $550.30 $585.09 $619.889.00% $472.02 $506.02 $540.02 $574.02 $608.02
19. WACC CalculationsINPUTS
Debt 0YTM of Debt 0%Effective Tax Rate 38.45%Shares 31,027,000.00Share Price as of 5/4/15 633.57Risk-free rate 2.31%Market Premium 5.8%Beta 0.80Total Value 31,027,000.00
CALCULATIONSEquity Value 19,657,776,390.00Cost of Equity 6.96%
WACC 6.96%