Chinook salmon, in comparison to other stocks of interest ... · 2. geographic analysis of stock...
24
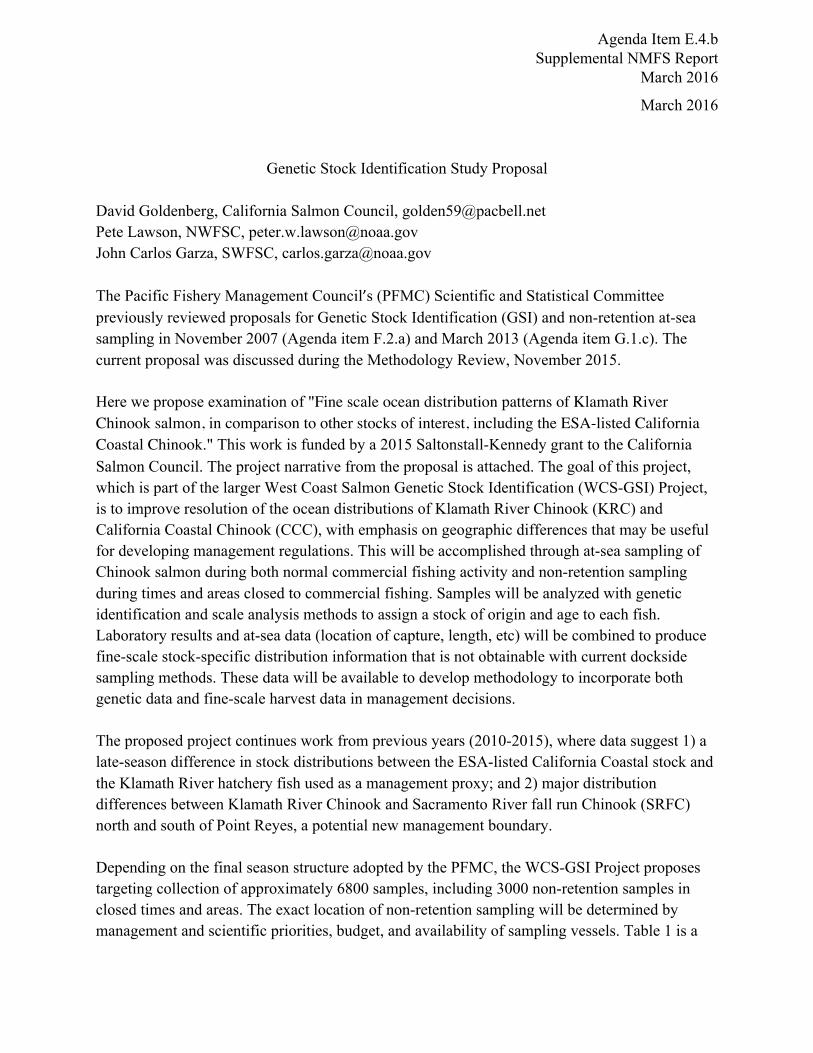
March 2016 Genetic Stock Identification Study Proposal David Goldenberg, California Salmon Council, [email protected] Pete Lawson, NWFSC, [email protected] John Carlos Garza, SWFSC, [email protected] The Pacific Fishery Management Council’s (PFMC) Scientific and Statistical Committee previously reviewed proposals for Genetic Stock Identification (GSI) and non-retention at-sea sampling in November 2007 (Agenda item F.2.a) and March 2013 (Agenda item G.1.c). The current proposal was discussed during the Methodology Review, November 2015. Here we propose examination of "Fine scale ocean distribution patterns of Klamath River Chinook salmon, in comparison to other stocks of interest, including the ESA-listed California Coastal Chinook." This work is funded by a 2015 Saltonstall-Kennedy grant to the California Salmon Council. The project narrative from the proposal is attached. The goal of this project, which is part of the larger West Coast Salmon Genetic Stock Identification (WCS-GSI) Project, is to improve resolution of the ocean distributions of Klamath River Chinook (KRC) and California Coastal Chinook (CCC), with emphasis on geographic differences that may be useful for developing management regulations. This will be accomplished through at-sea sampling of Chinook salmon during both normal commercial fishing activity and non-retention sampling during times and areas closed to commercial fishing. Samples will be analyzed with genetic identification and scale analysis methods to assign a stock of origin and age to each fish. Laboratory results and at-sea data (location of capture, length, etc) will be combined to produce fine-scale stock-specific distribution information that is not obtainable with current dockside sampling methods. These data will be available to develop methodology to incorporate both genetic data and fine-scale harvest data in management decisions. The proposed project continues work from previous years (2010-2015), where data suggest 1) a late-season difference in stock distributions between the ESA-listed California Coastal stock and the Klamath River hatchery fish used as a management proxy; and 2) major distribution differences between Klamath River Chinook and Sacramento River fall run Chinook (SRFC) north and south of Point Reyes, a potential new management boundary. Depending on the final season structure adopted by the PFMC, the WCS-GSI Project proposes targeting collection of approximately 6800 samples, including 3000 non-retention samples in closed times and areas. The exact location of non-retention sampling will be determined by management and scientific priorities, budget, and availability of sampling vessels. Table 1 is a Agenda Item E.4.b Supplemental NMFS Report March 2016
Transcript of Chinook salmon, in comparison to other stocks of interest ... · 2. geographic analysis of stock...
March 2016
Genetic Stock Identification Study Proposal David Goldenberg, California Salmon Council, [email protected] Pete Lawson, NWFSC, [email protected] John Carlos Garza, SWFSC, [email protected] The Pacific Fishery Management Council’s (PFMC) Scientific and Statistical Committee previously reviewed proposals for Genetic Stock Identification (GSI) and non-retention at-sea sampling in November 2007 (Agenda item F.2.a) and March 2013 (Agenda item G.1.c). The current proposal was discussed during the Methodology Review, November 2015. Here we propose examination of "Fine scale ocean distribution patterns of Klamath River Chinook salmon, in comparison to other stocks of interest, including the ESA-listed California Coastal Chinook." This work is funded by a 2015 Saltonstall-Kennedy grant to the California Salmon Council. The project narrative from the proposal is attached. The goal of this project, which is part of the larger West Coast Salmon Genetic Stock Identification (WCS-GSI) Project, is to improve resolution of the ocean distributions of Klamath River Chinook (KRC) and California Coastal Chinook (CCC), with emphasis on geographic differences that may be useful for developing management regulations. This will be accomplished through at-sea sampling of Chinook salmon during both normal commercial fishing activity and non-retention sampling during times and areas closed to commercial fishing. Samples will be analyzed with genetic identification and scale analysis methods to assign a stock of origin and age to each fish. Laboratory results and at-sea data (location of capture, length, etc) will be combined to produce fine-scale stock-specific distribution information that is not obtainable with current dockside sampling methods. These data will be available to develop methodology to incorporate both genetic data and fine-scale harvest data in management decisions. The proposed project continues work from previous years (2010-2015), where data suggest 1) a late-season difference in stock distributions between the ESA-listed California Coastal stock and the Klamath River hatchery fish used as a management proxy; and 2) major distribution differences between Klamath River Chinook and Sacramento River fall run Chinook (SRFC) north and south of Point Reyes, a potential new management boundary. Depending on the final season structure adopted by the PFMC, the WCS-GSI Project proposes targeting collection of approximately 6800 samples, including 3000 non-retention samples in closed times and areas. The exact location of non-retention sampling will be determined by management and scientific priorities, budget, and availability of sampling vessels. Table 1 is a
Agenda Item E.4.b Supplemental NMFS Report
March 2016

draft version of the proposed sampling plan, formulated with the understanding that the final sampling plan may be altered to accommodate the PFMC commercial season. The fraction of Sacramento River fall Chinook encounters varies considerably by area-week and by year. We have observed stock fractions between 43-73%, with a yearly average of 54%. Fractions of CCC vary from 2-10%, with an annual average of 5%; fractions of KRC vary from 4-11%, with an annual average of 7%. At these rates we expect to observe at least a few individuals of each stock of interest in samples of 100 fish per area-month stratum.
1-‐31 1-‐18 19-‐30
1-‐14
15-‐31
1-‐13
14-‐29
May June July August Management zone Port OR-‐KMZ Brookings 200 200 200 200 200 200
Crescent City 100 100 100 100 100 100 KMZ
Eureka 100 100 100 100 100 100 Fort Bragg Fort Bragg 200 200 200 200 200 200 San Francisco-‐N Bodega Bay 400 200 200 200 200 200 200
San Francisco 200 100 100 100 100 100 100 San Francisco-‐S
Half Moon Bay 200 100 100 100 100 100 100 Total samples 800 2000 2000 2000
Non-‐retention samples 0 800 1400 800
Table 1. Target sample sizes in numbers of fish for synoptic sampling in the Oregon and California Klamath Fishery Management Zones, south to San Francisco. Red cells are anticipated to require non-retention sampling.
Estimated Impacts. It is proposed to collect 3000 non-retention samples. Mortality during catch-and-release sampling is estimated at 31%, resulting in 930 mortalities. Actual mortality estimates for all stocks, including SRFC, will be provided by the STT during the PFMC 2016 salmon preseason management process.
Project Narrative 2014/2015 Saltonstall Kennedy (2014/15 S-K)
Application Organization: California Salmon Council
Title: Fine scale ocean distribution patterns of Klamath River Chinook salmon, in comparison to other
stocks of interest, including the ESA-listed California Coastal Chinook
Vision/ Goal
Data from previous years (2010-2014) suggest 1) a late-season difference in stock distributions
between the ESA-listed California Coastal Chinook and the Klamath River fall run Chinook used
as a management proxy; and 2) major differences in the relative catch rates of Klamath River fall
run Chinook and Sacramento fall run Chinook north and south of Point Reyes, a potential new
management boundary. We will collect at-sea samples and associated metadata to evaluate rates
of catch per unit effort on a stock-specific basis between Humbug Mountain and Pigeon Point
(Klamath Management Zone in Oregon and California, Fort Bragg Management Area, San
Francisco Management Area) and analyze the temporal stability of these observed differences.
We will use precise capture location and depth data to produce fine-scale stock-specific
distribution models which are not possible with current dockside sampling methods. These data
will be available to develop methodology to incorporate both genetic identification data and fine-
scale harvest data in management decisions.
Objectives
1. targeted sampling effort to distinguish the distributions of Klamath, Sacramento, and
California Coastal Chinook stocks between Humbug Mountain and Pigeon Point
contract with commercial fishermen to collect at-sea samples and associated metadata
during normal fishing operations
collect non-retention samples and data in times and areas closed to commercial fishing, as
allowed by the Pacific Fishery Management Council and permitted by state enforcement
agencies
analyze biological samples with genetic methods to assign stock of origin to individual
fish
analyze scale samples to construct age cohorts
compare catch per unit effort for Klamath, Sacramento, and California Coastal Chinook
stocks in each management zone (or portion thereof)
2. geographic analysis of stock distributions in the ocean fishery
use precise capture location and depth to generate time-series maps of stock distribution
throughout the fishing season
The U.S. west coast commercial Chinook salmon (Oncorhynchus tshawytscha) fishery is
managed on a stock-specific basis. Access to the fishery has been severely limited in the past
decades due to concerns about harvest of fish from weak stocks, sometimes in years when other
stocks are healthy and abundant. In 2006, commercial salmon fisheries were heavily constrained
in California and Oregon to reduce harvest of Klamath River fall run Chinook (KRFC) and the
Klamath Management Zone (KMZ) was closed entirely. In 2008 and 2009, nearly all Chinook
fisheries south of Cape Falcon, Oregon were completely closed to meet conservation objectives
for the Sacramento River fall run Chinook (SRFC). In 2010, commercial fisheries south of Point
Arena were open for only eight days, again to meet conservation objectives of SRFC. In 2011,
2012, and 2014, commercial fisheries were restricted due to the U.S. Endangered Species Act
(ESA) consultation standard for California Coastal Chinook (CCC) evolutionarily significant
unit (ESU). In 2012-2014, commercial fisheries were restricted south of Point Arena to limit
harvest of Sacramento River winter-run Chinook (PFMC 2014).
Though the specific stock of concern is not consistent, the need to understand stock distribution
throughout the historical fishing season (May-September) remains. In-river and ocean conditions
change from year to year, often affecting stocks differently; a stock may be abundant and
productive for a number of years, then require implementation of harvest restrictions. Current
fishery management strategy responds to changes in population numbers on a stock-specific
basis by limiting effort in certain times and areas; this strategy inherently requires a stock-
specific temporal-spatial analysis of catch data.
Previous data have shown 1) a late-season difference in stock distribution of CCC and KRFC
(Satterthwaite et al. 2014); and 2) a stock composition difference north and south of Point Reyes
(unpublished data). The current proposal aims to evaluate the differences observed in previous
data and determine if these trends persist from year to year. Differential distributions of three
stocks of salmon (KRFC, CCC, SRFC) have management implications for the commercial
salmon fishery: concerns about one or more of these stocks have constrained fisheries for
decades. In instances where one stock is weak but others are abundant, there is potential to direct
fishing effort toward more abundant stocks. Current monitoring tools and distribution models
lack the fine-scale temporal-spatial data and ability to differentiate these stocks.
1) late-season difference in distribution of California Coastal and Klamath River fall run
Chinook
Since 2000, commercial and recreational fishermen in California have had limited fishing
opportunity in some years due to restrictions in place to protect the California Coastal Chinook
ESU. Low returns of naturally spawning fish to rivers in the spawning range of this ESU (e.g.,
the Eel and Russian rivers) prompted the National Marine Fisheries Service (NMFS) to list the
CCC ESU as Threatened under the ESA in 1999, requiring that the best available science be used
to protect them. Current estimates of abundance and harvest of Pacific salmon are based on
dockside recovery of coded wire tags (CWTs) which are inserted into snouts of juvenile fish
before they leave hatcheries. Unfortunately, naturally spawning fish, such as the entire CCC
ESU, are largely untagged; management relies on the tagged KRFC hatchery fish as a proxy.
"Information on abundance and productivity trends for the naturally spawning component of the
CC Chinook salmon ESU is extremely limited" (NMFS 2007). Even less is known about the
geographic and temporal distribution of CCC fish as they mix in the ocean with salmon of other,
more abundant, stocks. CCC salmon are not the target of the Pacific commercial salmon fishery,
but are intermixed with other stocks, including the historically abundant SRFC, and are
harvested as bycatch. This bycatch is limited through an ESA consultation standard that sets the
maximum age-4 ocean harvest of KRFC at 16% (NMFS 2000, KRTAT 2002).
Though CCC fish are not coded wire tagged, they are easily distinguished from KRFC with
genetic methods. Genetic stock identification (GSI) is capable of assigning stock of origin to all
fish, not just those fish which have CWTs inserted at the hatchery.
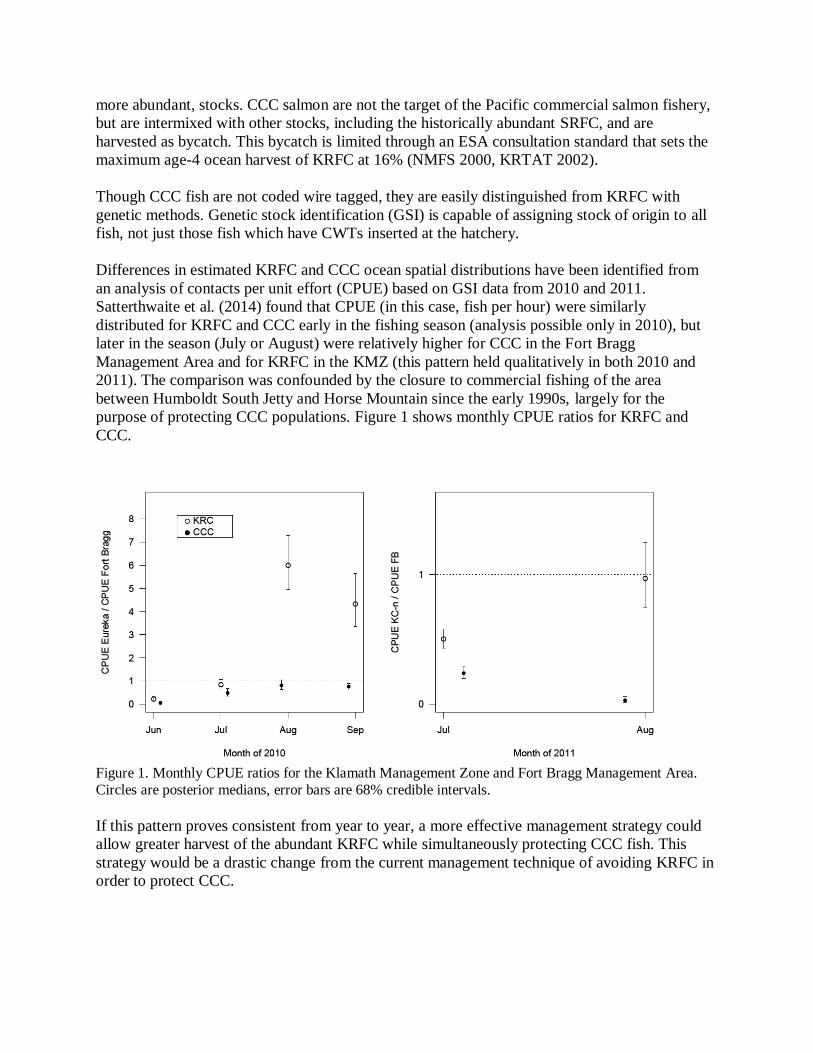
Differences in estimated KRFC and CCC ocean spatial distributions have been identified from
an analysis of contacts per unit effort (CPUE) based on GSI data from 2010 and 2011.
Satterthwaite et al. (2014) found that CPUE (in this case, fish per hour) were similarly
distributed for KRFC and CCC early in the fishing season (analysis possible only in 2010), but
later in the season (July or August) were relatively higher for CCC in the Fort Bragg
Management Area and for KRFC in the KMZ (this pattern held qualitatively in both 2010 and
2011). The comparison was confounded by the closure to commercial fishing of the area
between Humboldt South Jetty and Horse Mountain since the early 1990s, largely for the
purpose of protecting CCC populations. Figure 1 shows monthly CPUE ratios for KRFC and
CCC.
Figure 1. Monthly CPUE ratios for the Klamath Management Zone and Fort Bragg Management Area.
Circles are posterior medians, error bars are 68% credible intervals.
If this pattern proves consistent from year to year, a more effective management strategy could
allow greater harvest of the abundant KRFC while simultaneously protecting CCC fish. This
strategy would be a drastic change from the current management technique of avoiding KRFC in
order to protect CCC.
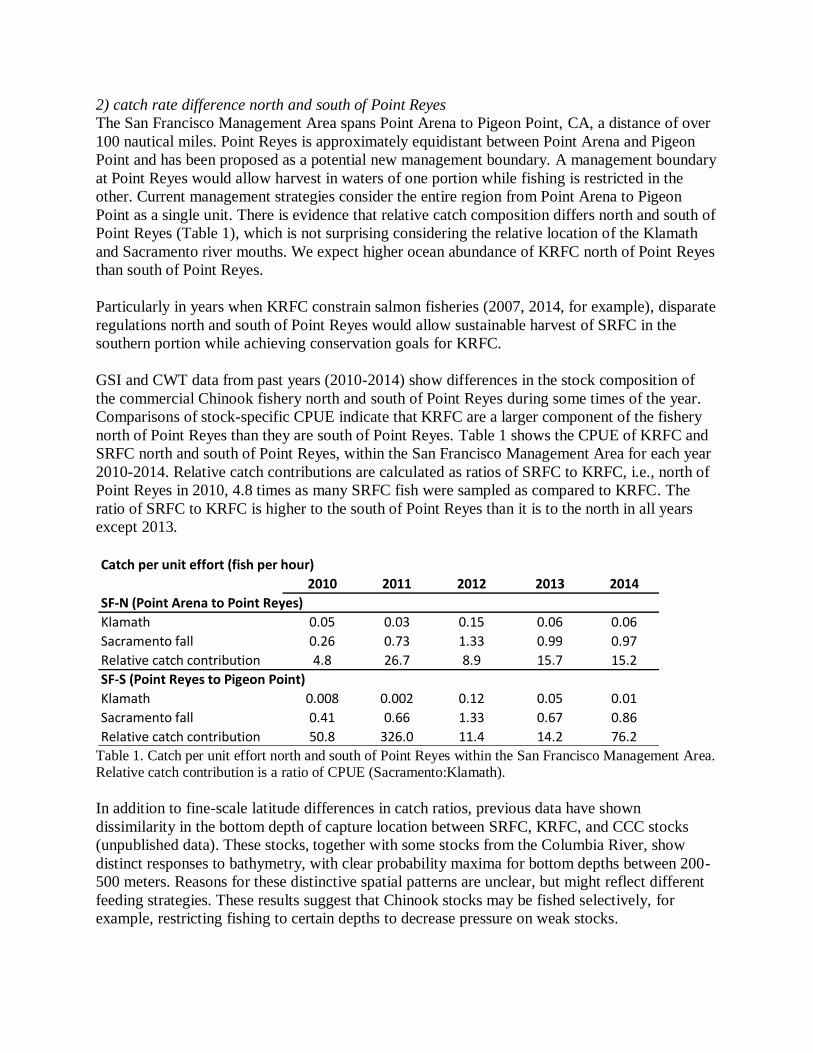
2) catch rate difference north and south of Point Reyes
The San Francisco Management Area spans Point Arena to Pigeon Point, CA, a distance of over
100 nautical miles. Point Reyes is approximately equidistant between Point Arena and Pigeon
Point and has been proposed as a potential new management boundary. A management boundary
at Point Reyes would allow harvest in waters of one portion while fishing is restricted in the
other. Current management strategies consider the entire region from Point Arena to Pigeon
Point as a single unit. There is evidence that relative catch composition differs north and south of
Point Reyes (Table 1), which is not surprising considering the relative location of the Klamath
and Sacramento river mouths. We expect higher ocean abundance of KRFC north of Point Reyes
than south of Point Reyes.
Particularly in years when KRFC constrain salmon fisheries (2007, 2014, for example), disparate
regulations north and south of Point Reyes would allow sustainable harvest of SRFC in the
southern portion while achieving conservation goals for KRFC.
GSI and CWT data from past years (2010-2014) show differences in the stock composition of
the commercial Chinook fishery north and south of Point Reyes during some times of the year.
Comparisons of stock-specific CPUE indicate that KRFC are a larger component of the fishery
north of Point Reyes than they are south of Point Reyes. Table 1 shows the CPUE of KRFC and
SRFC north and south of Point Reyes, within the San Francisco Management Area for each year
2010-2014. Relative catch contributions are calculated as ratios of SRFC to KRFC, i.e., north of
Point Reyes in 2010, 4.8 times as many SRFC fish were sampled as compared to KRFC. The
ratio of SRFC to KRFC is higher to the south of Point Reyes than it is to the north in all years
except 2013.
Table 1. Catch per unit effort north and south of Point Reyes within the San Francisco Management Area. Relative catch contribution is a ratio of CPUE (Sacramento:Klamath).
In addition to fine-scale latitude differences in catch ratios, previous data have shown
dissimilarity in the bottom depth of capture location between SRFC, KRFC, and CCC stocks
(unpublished data). These stocks, together with some stocks from the Columbia River, show
distinct responses to bathymetry, with clear probability maxima for bottom depths between 200-
500 meters. Reasons for these distinctive spatial patterns are unclear, but might reflect different
feeding strategies. These results suggest that Chinook stocks may be fished selectively, for
example, restricting fishing to certain depths to decrease pressure on weak stocks.
2010 2011 2012 2013 2014
SF-N (Point Arena to Point Reyes)
Klamath 0.05 0.03 0.15 0.06 0.06
Sacramento fall 0.26 0.73 1.33 0.99 0.97
Relative catch contribution 4.8 26.7 8.9 15.7 15.2
SF-S (Point Reyes to Pigeon Point)
Klamath 0.008 0.002 0.12 0.05 0.01
Sacramento fall 0.41 0.66 1.33 0.67 0.86
Relative catch contribution 50.8 326.0 11.4 14.2 76.2
Catch per unit effort (fish per hour)

Current dockside sampling records location of capture by management area, as reported in
fishermen interviews; in the case of the San Francisco Management Area, all fish caught
between Point Arena and Pigeon Point are analyzed as a single geographic component. In
contrast, at-sea sampling by the commercial salmon fleet provides exact date-time stamps, GPS
locations of capture, and depth information. Data from samples collected at sea more precisely
identify geographic and temporal concentrations of fish in the ocean during exposure to the
commercial fishery.
Genetic methods provide stock of origin data for all fish independently of CWTs, including
naturally spawning fish. At-sea sampling methods produce fine-scale geographic and depth data;
combined with stock identity and age information derived from laboratory analyses, we can
produce high-resolution geographic and temporal maps of age-specific stock distribution. Figure
3 shows examples of high-resolution maps identifying stock-specific catch probabilities in 2010-
2012. Our current data are insufficient to calculate time-series of catch probabilities throughout
the fishing season or to conduct rigorous comparisons of stocks. The work proposed here will
address this information gap by sampling in geographic areas where more data are needed, refine
sampling methods to obtain data that are more representative of the commercial fishery, and
construct cohort-specific data for sampled fish. Improved stock differentiation and increased
temporal-spatial precision have potential to refine current management methods.

Figure 3. Probability of catch in 2010-2012. Values are model outputs and do not correspond directly to
catch per unit effort. Stars represent point of ocean entry for each stock.
1. Project goals and objectives
Program priority
As outlined in Saltonstall Kennedy Grant Program Theme #2.A, this project will improve the
cost effectiveness, accuracy, timeliness, and methods for the collection, reporting, and
dissemination of fishery-dependent data; provide advanced sampling techniques to improve data
collection in otherwise inaccessible habitats, and improve current stock assessments by refining
estimates of population dynamics; and improve current sampling methods for fisheries not
included in existing surveys. As outlined in Theme #3.B, this project will improve stock
definitions and understanding of stock boundaries.
The primary focus of the proposed work is an evaluation of the distribution of Klamath River fall
Chinook in the KMZ (California and Oregon), Fort Bragg, and San Francisco Management
Areas. Preliminary data from 2010 and 2011 indicate a late-season difference in stock
distribution of KRFC and CCC in the KMZ and Fort Bragg Management Area. Major stock
distribution differences have also been identified north and south of Point Reyes, and in
shallower and deeper water. Data from this proposal will be combined with previous datasets to
determine whether the observed patterns in stock distributions are sufficiently stable for 1) a
reevaluation of the use of the KRFC as a proxy for CCC stocks; and 2) the division of the large
San Francisco Management Area into smaller zones, allowing harvest regulations to be
implemented which will reduce impacts on ESA-listed and other conservation stocks and
increase harvest opportunity on the more productive stocks.
This project will utilize at-sea sampling techniques and genetic methods to investigate the
distribution of KRFC in comparison to other stocks in the west coast commercial salmon fishery.
Specifically, we will 1) collect samples and associated metadata at sea during normal
commercial fishing operations; 2) use non-retention sampling methods in times and areas closed
to commercial fishing; 3) analyze tissue samples to determine the stock-specific catch per unit
effort throughout the fishing season; 4) analyze scales to construct age cohorts; and 5) analyze
precise capture locations and depths to characterize fish aggregations, stock distributions, and
boundaries in relation to management boundaries.
1) collect samples and associated metadata at sea during normal commercial fishing operations
The optimal strategy is synoptic sampling of the areas managed as commercial fisheries by the
Pacific Fishery Management Council (PFMC) during the primary period when adult fish are
present and fisheries were historically open (May-September). However, such a project is very
costly and exceeds available resources. As such, the primary goal of the proposed project is to
evaluate specific areas where significant changes in fishery management may be possible with
several years of additional data.
The sampling target is 100 fish per week in each fishery management area or portion thereof, a
potential target of 2,100 fish sampled in each area during this 21 week period in each year.
Sampling areas are KMZ-OR, KMZ-CA, Fort Bragg Management Area, SF-N (Point Arena to
Point Reyes, and SF-S (Point Reyes to Pigeon Point).
Sampling in open times and areas will begin on May 1, 2016. Though the season structure is not
yet determined by PFMC, we anticipate the Fort Bragg, SF-N, and SF-S areas to be open for
large portions of the period May-September. Sampling effort and analysis will be scaled up or
down in each management area to match available resources and season restrictions. We expect
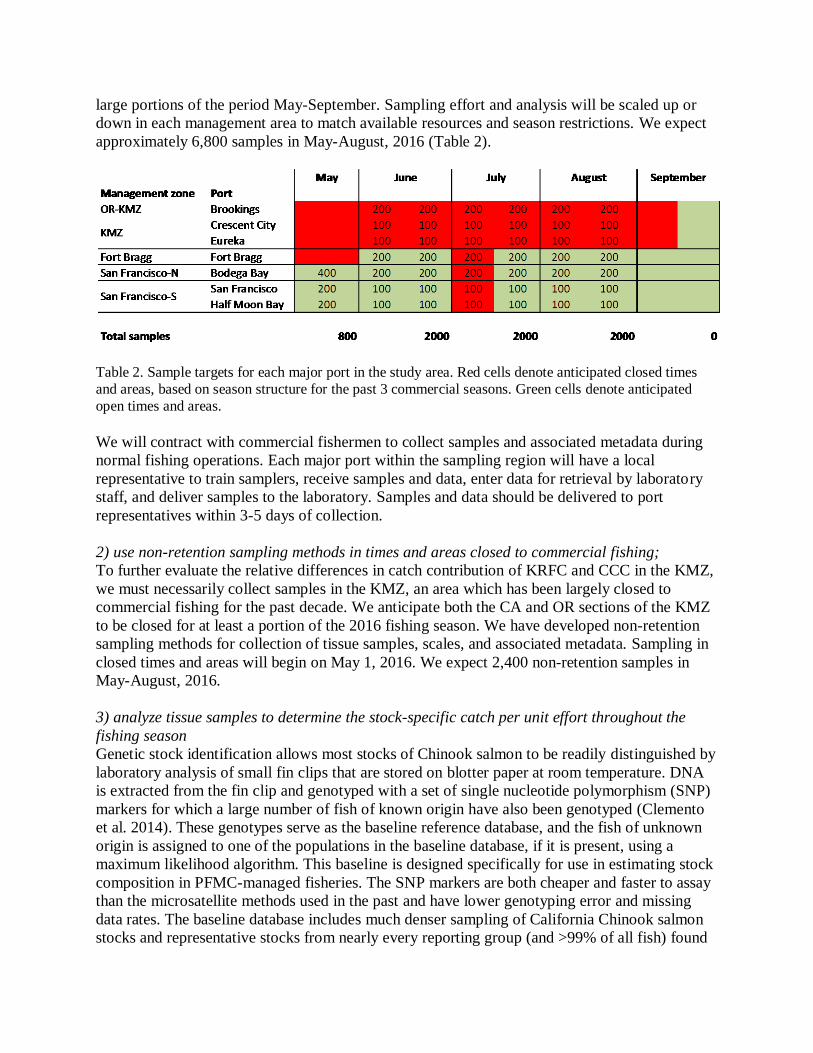
approximately 6,800 samples in May-August, 2016 (Table 2).
Table 2. Sample targets for each major port in the study area. Red cells denote anticipated closed times
and areas, based on season structure for the past 3 commercial seasons. Green cells denote anticipated
open times and areas.
We will contract with commercial fishermen to collect samples and associated metadata during
normal fishing operations. Each major port within the sampling region will have a local
representative to train samplers, receive samples and data, enter data for retrieval by laboratory
staff, and deliver samples to the laboratory. Samples and data should be delivered to port
representatives within 3-5 days of collection.
2) use non-retention sampling methods in times and areas closed to commercial fishing;
To further evaluate the relative differences in catch contribution of KRFC and CCC in the KMZ,
we must necessarily collect samples in the KMZ, an area which has been largely closed to
commercial fishing for the past decade. We anticipate both the CA and OR sections of the KMZ
to be closed for at least a portion of the 2016 fishing season. We have developed non-retention
sampling methods for collection of tissue samples, scales, and associated metadata. Sampling in
closed times and areas will begin on May 1, 2016. We expect 2,400 non-retention samples in
May-August, 2016.
3) analyze tissue samples to determine the stock-specific catch per unit effort throughout the
fishing season
Genetic stock identification allows most stocks of Chinook salmon to be readily distinguished by
laboratory analysis of small fin clips that are stored on blotter paper at room temperature. DNA
is extracted from the fin clip and genotyped with a set of single nucleotide polymorphism (SNP)
markers for which a large number of fish of known origin have also been genotyped (Clemento
et al. 2014). These genotypes serve as the baseline reference database, and the fish of unknown
origin is assigned to one of the populations in the baseline database, if it is present, using a
maximum likelihood algorithm. This baseline is designed specifically for use in estimating stock
composition in PFMC-managed fisheries. The SNP markers are both cheaper and faster to assay
than the microsatellite methods used in the past and have lower genotyping error and missing
data rates. The baseline database includes much denser sampling of California Chinook salmon
stocks and representative stocks from nearly every reporting group (and >99% of all fish) found

in ocean fisheries off California and Oregon. Scientific partners have developed a new maximum
likelihood method for evaluating whether a fish assigned to one of the baseline stocks actually
came from a genetically similar stock not represented in the baseline, as GSI can not accurately
identify a fish that comes from an unrepresented stock. This baseline also has a method for
identifying non-Chinook salmon, which are occasionally sampled in error.
Catch per unit effort is an indicator of local abundance, calculated as the number of legal-sized
fish caught per hour. CPUE is stratified by month and area, as appropriate. Fish that are caught in
retention fisheries but not sampled are included in effort calculations even though genetic and
age data are unavailable, i.e., stock-specific CPUE is adjusted to include all fish regardless of
whether or not they are sampled.
4) scale aging analysis to construct cohort-specific data
Circuli patterns on scales will be used to determine the age of Chinook salmon sampled with
retention and non-retention methods.
We are in negotiation with both the California Department of Fish and Wildlife (CDFW) Ocean
Salmon Project (OSP) and the Oregon Department of Fish and Wildlife (ODFW) to process and
analyze scales for age determination. Scales will be analyzed only after stock of origin is
determined; only those scales from fish of stocks of interest (KRFC, CCC, SRFC) will be
assessed for age.
Scales will be delivered to the appropriate agency as they are collected throughout the season.
Age data are anticipated by April, 2017.
5) analyze precise capture locations and depths to characterize fish aggregations, stock
distributions, and boundaries in relation to management boundaries
We will map concentrations of Chinook salmon with respect to their stock of origin, age, size,
and depth of capture. These models and visualizations will be available to state, regional, and
federal fisheries managers for incorporation into management as a new tool for reducing bycatch
of threatened Chinook salmon stocks in the mixed-ocean commercial salmon fishery.
An at-sea sampling scheme that is representative of the entire commercial fishery is difficult to
achieve. Sample sizes are necessarily small due to budget and equipment limitations. We do not
obtain a truly random sample because not all fishermen are eager to participate. Fishermen have
competing economic interests; they may switch fisheries or, alternatively, increase sampling
effort when salmon are less abundant in an effort to ensure income stability. It is unclear how
well GSI data collected during non-retention sampling represents the harvest stock compositions
that result from normal, retention fishing (O'Farrell et al. 2012). In lieu of a sampling scheme
that strictly represents the entire commercial fishery, we will coordinate with the California and
Oregon Departments of Fish and Wildlife to compare genetic datasets to total commercial
landings. Despite differences in geographic precision (at-sea samples have precise latitude,
longitude, and depth information; dockside samples are associated with a management zone
only), genetic data can be better understood within the context of total harvest. Currently, we
account for total catch of sampling vessels, but do not consider total catch of the larger fleet.

We will work to incorporate these distribution models into current management schemes. GSI
can assign stock of origin to all fish regardless of CWT implantation (naturally spawning CCC
fish, for example) within the ocean harvest, but estimates of total ocean harvest will require
rigorous sampling methods to represent the entire fishery or statistical methods to scale genetic
data to total landings.
previous work
In 2006 and 2007, the states of California, Oregon, and Washington implemented pilot projects
to explore the application of GSI to salmon management. Saltonstall Kennedy (S-K) grant
number NA08NMF4270421 (see Supporting Documentation) was awarded to fund collection
and analysis of at-sea samples in 2008, but the commercial Chinook fishery was closed, even to
non-retention sampling, until 2010 due to concerns for the SRFC run meeting conservation
objectives. Accordingly, data collection was delayed until 2010.
Goals of the prior S-K-funded project were to 1) determine the distribution of Klamath River
Chinook (KRFC) and other Chinook stocks in times and areas closed to salmon commercial
fishing due to restrictions on ocean harvest of Klamath River Fall Chinook and ESA-listed
stocks, including some times and areas that have been closed for over 20 years; 2) provide
information that may allow fishery managers to design fisheries that provide greater harvest of
strong (abundant) stocks while limiting weak stock impacts to ensure compliance with allowable
fishery impacts on weak stocks; and 3) establish a uniting collaborative process among
fishermen, scientists, and fisheries managers on the U.S. west coast by working together to
achieve goals and objectives.
We contracted over 330 commercial fishermen on 174 vessels to collect data in California and
Oregon. Vessel operators and associated crew on 86 vessels in California and 88 vessels in
Oregon participated in 2683 days of retention and non-retention sampling. A total of 9,603 fish
were sampled from May through September, 2010. Scientific partners analyzed over 8,900 tissue
samples with genetic methods for stock of origin; state management partners analyzed over
8,300 scale samples for age.
We developed a basic method for displaying stock distributions using catch per unit effort for
each stock of interest because CPUE provides better representation of relative local abundance
than stock composition estimates which are unscaled for fishing effort or total catch. We
explored a number of alternatives for presentation of fishery information, several of which were
incorporated into user portals on the Pacific Fish Trax (PFX) website. The PFX portals query a
secure online database which was used as a data repository for at-sea data, individual fish stock
assignments, and raw microsatellite genetic data for Oregon.
Further details of the results from the prior Saltonstall Kennedy grant can be found in the final
report (see Supporting Documentation).
As a continuation of the work in the prior Saltonstall Kennedy award, we will continue data
collection efforts to address geographic areas where data are sparse or nonexistent, specifically
the KMZ in CA and OR, refine sampling methods to be more representative of total harvest of
the commercial fleet, and construct age cohorts for sampled fish. Our ultimate goal is to

incorporate GSI data into current fishery management schemes through improved technology
and outreach to all stakeholders. Data from the work described in this proposal will be combined
with data from previous years to determine whether the observed pattern in stock distributions is
sufficiently stable to support a change in management strategy for conservation of the CCC ESU
and/or implement a new management boundary at Point Reyes.
2. Project impacts
Fishing community cooperation and participation
This project directly engages fishermen in data collection activities and the management process.
Rather than a top-down approach to managing fisheries, commercial salmon fishermen are active
partners in project design, sampling methodology improvements, and data collection and
management.
Increased fishing opportunities
To protect the weakest salmon stocks, fisheries managers are often compelled to institute
closures over large areas and time periods. Inferences about relative local abundance can reduce
uncertainty in the use of indicator stocks for conservation and fishery management. Reduced
uncertainty potentially can lead to reduced precautionary harvest restrictions and increased
fishing opportunities. With increased understanding of stock distribution, we may be able to
more finely direct fishing opportunity to places where weak stocks are less prevalent. One
method for directing fishing effort might be the use of new management boundaries (i.e., Point
Reyes).
Fine scale stock distribution model
Samples collected at sea are accompanied by a date-time stamped GPS location and recorded
depth of capture. In contrast, dockside sampling is not able to record exact harvest location or
depth. Current dockside sampling methods capture harvest location on the scale of the
management zone, as reported in fishermen interviews, and port of landing. The current
monitoring techniques analyze CWTs collected dockside and do not take into account the precise
geographic location or depth of harvest. We will incorporate precise geographic data into a
rigorous analysis of stock distribution in the ocean fishery.
Reduced bycatch of ESA-listed stocks
Though ESA-listed Chinook stocks are the same species as the target of commercial fisheries,
they are managed as bycatch. Use of more accurate and precise management tools will allow for
access to the commercial salmon fishery while simultaneously protecting the stocks of concern.
Though very little information is available for the CCC ESU, it is ESA-listed and therefore not
considered healthy. More precise management tools have the potential to target decreased
harvest of stocks of concern, rather than decreased harvest of proxy stocks, which may or may
not have the desired result.
We also may identify hitherto unrecognized conservation concerns and move to address them.
While such action may result in short-term fishing limitations, allowing stocks to recover will
increase and stabilize future fishing opportunities.
Near real-time management information
GSI is capable of producing catch composition estimates within days of sample collection.
CWTs, on the other hand, do not produce usable datasets while the fishery is open. While we
have not yet been able to produce GSI results in real-time, we are decreasing processing time and
improving communication networks in order to inform fishermen and managers of catch
composition within a week of harvest.
Development of fishery-independent techniques
While this project focuses on sampling the U.S. west coast commercial Chinook fishery, the
methods can be adapted to a wide variety of fisheries in other locations. We do not attempt to
extrapolate these data to be representative of the recreational fishery which has daily limits and
more spatiotemporal coverage along the coast, but these methods are easily adaptable to the
recreational salmon fishery.
3. Evaluation of project
We will collect and analyze sufficient samples to create stock-specific distribution maps of the
commercial salmon harvest between Humbug Mountain and Pigeon Point. We will provide an
accounting of contracted fishermen, sampled areas, numbers of samples collected, and age and
genetic results. We will provide maps of distributions and summaries of catch compositions,
distribution of effort and catch, and standardized distributions of stocks of interest including
KRFC, CCC, and SRFC. An indicator of success will be the degree to which genetic results,
scale age data, and meta-data are incorporated in analytic and visualization tools available to
fishermen, managers, and the general public via the Pacific Fish Trax website.
We will test the hypothesis that the observed distribution differences of KRFC and CCC are
stable over multiple seasons. We will continue to analyze the stock composition differences of
KRFC and SRFC north and south of Point Reyes. An indicator of success will be creation of a
statistical analysis of these patterns and successful collaboration with fisheries managers to
develop a sampling scheme with both dockside and at-sea methods that represents landings of
the entire commercial fishery.
Success will also be judged by the continued acceptance of the concepts embodied in the project
and the cooperation and support of fishermen, mangers, scientists, and the general public,
Expected products from this project include 1) a database of effort, catch locations, stock
identifications, and ancillary data for analysis; 2) synthesized and summarized final report to the
granting agency; 4) presentations to local fishermen's organizations; 5) technical presentations to
scientific and management meetings; and 6) technical white papers and memoranda for use in
management.
4. Need for government financial assistance
In California, sampling has been supported by disaster relief funds (2010-2012), S-K funds
(2010-2011, see details in section 1 above), and NOAA Cooperative Fisheries Research funds
(2012-2014).
In Oregon, sampling has been supported by Oregon Watershed Enhancement Board (2006-
2007), disaster relief funds (2008-2011), special federal grant appropriations (2008-2010), S-K
Funds (2010-2011), and NOAA Cooperative Fisheries Research funds (2010-2014).
This project is currently unfunded for the 2015 and 2016 commercial fishing seasons. We are
seeking $184,000 in Cooperative Fisheries Research funds from NMFS for California and
~$200,000 for Oregon and Washington. If awarded, these funds will assist in the collection of
data and samples between Point Arena and Pigeon Point (Fort Bragg and San Francisco
Management Areas) when those areas are open in 2015. Sampling closed areas is difficult and
expensive due to regulatory requirements and the need to compensate fishermen fully for their
time and cost of operation. At the same time, there is a need for comprehensive distribution
information that includes both open and closed areas. Funds from this proposed project will be
used to sample closed times and areas in 2016 to augment the sampling from open areas.
5. Federal, state, and local government activities and permits
Data and sample collection during open fishing season will require no additional permits.
Samples will be collected during normal fishing activities after fish are harvested under standard
commercial permits.
Data and samples that are collected in times and areas closed to commercial fishing will require
both federal and state permits, including a Scientific Research Permit from NOAA National
Marine Fisheries Service, a Scientific Collecting Permit from CDFW, a Scientific Taking Permit
from ODFW, and an incidental take permit from the International Pacific Halibut Commission
(IPHC). We have precedence and experience in acquiring the federal and state permits necessary
to conduct this sampling. Please see Supporting Documentation for copies of prior permits.
Licensed commercial fishermen will contract with the respective state representatives to collect
samples under the appropriate permits issued by NOAA, CDFG, ODFW, and IPHC.
6. Project work plan
a) project design
at-sea sampling
When the commercial season is open, samples are collected during normal fishing activities by
the commercial salmon fleet. See Table 2 for details on sample targets. Handheld GPS units are
turned on when gear is set in the water and set to record track marks of effort every five minutes.
After fish are landed on the boat, fishermen record a waypoint on handheld GPS units. All fish,
regardless of whether or not they are sampled, are recorded on the GPS units. In order to
distribute sampling effort evenly over the season, fishermen are limited in the number of samples
collected each day, week, and month. Only legal Chinook salmon are sampled. Coho salmon and
sub-legal fish are not sampled.
Fishermen are trained to collect a small piece of tissue from any fin except the adipose fin and 8-
10 scales from the key area of the fish. Tissue samples are stored on blotter paper and scales are
stored on wax paper. Both are dried as quickly as possible and stored at ambient temperature.
Samples are placed in an envelope with data fields for GPS data point (generated by GPS unit),

length of fish (measured in mm), hatchery marks (presence of adipose fin), and depth of capture
estimate (gear depth estimated in fathoms).
non-retention sampling methods
During closed times and areas, fishermen are trained to collect tissue and scale samples, as well
as associated at-sea data, with non-lethal fishing methods. In order to minimize mortality to fish,
all fish are brought aboard using a shallow, knotless net. Each vessel is required to have at least
two people on board to minimize damage to the fish and time spent out of the water. Fish are
released immediately after sampling, after approximately one minute out of the water.
Sample collection and handling is identical to normal, retention sampling described above. Only
legal Chinook salmon are targeted for sampling. Because measurements are not collected until
the fish is aboard, however, fishermen are instructed to collect samples from fish that appear to
be legal. Sub-legal fish are later removed from analyses. Coho salmon are not sampled. As
required in the commercial fishery, all hooks are barbless to allow easy removal.
Laboratory genetic analysis
Tissue samples will be shipped by Priority Mail to the University of California Santa Cruz
Marine Sciences Campus, where project collaborators will catalogue them and separate scale
samples for delivery to the appropriate scale aging laboratory. Tissue samples will then be
digested in a protease digestion buffer and DNA extracted using silica membrane-based plates
with DNEasy 96 Tissue Kits following the manufacturer’s protocols. Purified genomic DNA will
then be arrayed into 96- well plates for high throughput SNP genotyping. Genotypes will then be
collected from 96 SNP loci using 96.96 Dynamic SNP Genotyping Arrays™ with an EP1 system
(Fluidigm Corporation, South San Francisco, CA) according to the manufacturer’s protocols.
Genotypes were called using the Fluidigm SNP Genotyping Analysis Software (version 2.1.1).
This panel of SNP markers included 95 loci specific for Chinook salmon and one for
identification of coho salmon (see Clemento et al. 2014 for SNP marker details).
Genetic stock assignment
Genetic stock identification (GSI) analysis will be performed with the gsi_sim software and
using the method described in Anderson et al. (2008). A baseline reference database that includes
SNP genotypes of 8,031 fish from 69 populations grouped in 38 reporting units (units are
generally composed of multiple populations that are genetically similar or are subject to similar
management regimes) from Alaska, British Columbia, Washington, Oregon, and California
(Clemento et al. 2011). Coho salmon are occasionally misidentified as Chinook salmon in
fisheries and ecological sampling and the baseline includes both the diagnostic SNP marker
mentioned above and genotype data from a collection of 47 coho salmon from California to
identify coho salmon (Clemento et al. 2014). We will employ the simulation-based method for
defining low-confidence individual assignments described by Clemento et al. (2014), with such
assignments defined as those that have a z-score of the distribution of simulated genotypes of < -
3.0 and either a reporting unit posterior probability < 0.9 or fewer than 90 loci successfully
genotyped.

Scale age analysis
Scales are delivered on wax paper, at ambient temperature (Nicholas and Van Dyke 1982). We
will preferentially select scales from the KRFC, CCC, and SRFC stocks, as these stocks are the
most relevant to current management and conservation priorities.
Scales will be analyzed with contemporary mounting, digital imaging and digital reading
techniques. For each sample, approximately 5-10 scales are cleaned and mounted onto a glass
slide. Each slide is examined and the best 2-3 scales are digitally imaged using an Olympus
Colorview IIIu camera coupled to a transmitted light microscope and Olympus analysis FIVE
imaging software. Scale images are randomly sorted into stock-specific reading assignments to
reduce reader error associated with reading scales from salmon stocks with varying life history
types. CDFW OSP has found that reading scales concurrently from different salmon stocks
(specifically run-type) within the Central Valley increases reader error.
Scale samples are read by a single experienced reader and field length data are only taken into
consideration after the initial determination of age by the reader. Flain and Glova (1988)
demonstrated that aging scales by an individual experienced reader can be more accurate than
aging scales using multiple readers. Individual ages are determined from scales by counting
winter annuli, a standard method for scale aging of Pacific salmon (Bugaev 2004). Annuli can be
identified as bands of closely spaced or broken circuli. Age compositions are based on direct
counts of winter annuli. Age assignments for SRFC and KRFC samples collected in September
are not adjusted to reflect the use of September 1 as the “birth date” for these stocks in west coast
ocean harvest models.
When available, known-age scales from CWT and/or parentage based tagging samples will be
added to reading assignments to evaluate reader accuracy and potentially correct for bias; bias
will be corrected using a modified maximum likelihood estimator (MLE) based on Kimura and
Chikuni (1987). These scales will be collected from adipose fin-clipped salmon containing
CWTs observed during dockside monitoring of commercial salmon fisheries and/or fish
returning to hatcheries.
Catch per unit effort statistics
The GSI-derived stock identity results will provide distribution data on all the reporting groups
in the baseline reference database that are encountered in the fisheries, and when coupled with
the scale-age results will provide stock-age-time-area-specific encounter data. The number of
encounters will then be standardized (divided) by the associated sampling effort to yield CPUE.
To calculate stock-specific CPUE, the effort denominator is adjusted to account for all fish
caught on the sampling vessel each day in each management zone. Each fish has a proportion of
effort assigned to it, calculated as the fraction of time required to catch it.
Spatial distribution analysis
Normalizing the area-specific CPUE estimates for each stock, age, and time period estimates the
respective distributional coefficients (fraction of the coast-wide age stock susceptible to fisheries
in that time and area). It is not necessary to know the stock-age (cohort) ocean-wide abundance
to estimate these coefficients because CPUE is normalized and coefficients refer to the same
cohort in the same time period. Nonuniformity of the estimated distributional coefficients would
reflect a non-uniform distribution of the stock over the area, as well as the associated sampling
and/or measurement error contained in these data. Relative density does not translate directly
into numbers in each management area without accounting for catchability, unfished areas, or the
possibility that effort and fish are distributed differently within the fished area. Spatial variation
in catchability could also be problematic. Nevertheless, if fishermen are efficient samplers of the
underlying fish abundance (i.e., no aggregations of fish go unexploited for long, and within
management areas effort is well targeted toward areas with fish), we expect our distribution
estimates to provide a good approximation of how the density of each stock varies through space
(Satterthwaite et al. 2013).
Where possible, the estimated distributions will be compared with those derived from the CWT
database.
The NEPA Questionnaire is attached in Supporting Documentation.
b) Roles and responsibilities
Sampling will be conducted by California and Oregon commercial fishermen contracted with the
California Salmon Council and Oregon Salmon Commission, respectively. Each state will
contract with local liaisons in each major fishing port, as well as a coast-wide fleet manager to
coordinate sample delivery, data entry, payments to fishermen, etc. Fishermen coordinate with
local port liaisons to meet sampling targets, submit samples and at-sea data, and maintain
sampling equipment. Port liaisons will be in daily contact with a fleet manager who will monitor
progress towards sampling targets, communicate results to the fleet and the public, and
coordinate with laboratory personnel.
Genetic analysis will be conducted at the UCSC/NOAA Cooperative Institute laboratory where
the set of SNP genetic markers and baseline database were developed.
We are currently in negotiation with both CDFW and ODFW to process and analyze scales for
age data. Both state agencies have extensive experience imaging and reading scales collected
inland, dockside and at sea.
We have established working relationships with the commercial salmon fleet, the laboratory
performing genetic analysis, and two scale-aging laboratories. Sampling equipment will be
available to the sampling fleet upon announcement of the commercial season structure in mid-
April 2015, prior to the start of the grant period.
c) Data Sharing Plan
Though this project will not generate any environmental data, data sharing plans are being
drafted for all at-sea data, genetic assignments, and scale analysis.
At-sea data, including catch, fishing effort, and fish biology, will be shared immediately with all
collaborators via an online data management system accessed by project participants (https://fp.
pacificfishtrax. org). Stock assignments and age data will be uploaded electronically as soon as
they are verified by respective laboratory staff.
The Pacific Fish Trax website is currently configured to accept data entry from local port liaisons
and lab staff. Associated at-sea metadata are visible to samplers immediately upon data entry
(within several days). Genetic stock assignments are posted to PFX as they become available
(within 2 months of sample collection). Fishermen have full access to the data from their
samples, but data from other boats are visible only in aggregated formats. In order to protect
privacy and business practices of commercial fishermen, data are visible only when grouped with
at least two additional vessels.
d) Major products/deliverables and dissemination of results
We are submitting a separate proposal for funds to continue development of the PFX website
into a comprehensive fisheries informatics system. Within the existing framework, we will
incorporate new data sources, analytical capabilities, and improved usability. The PFX platform
will enable secure data sharing between project partners, maintain privacy of sampling vessels,
and develop tools for scientists as well as the general public to explore fisheries and
oceanographic data with map-based visualizations.
e) Project milestones
In month 1 of the project (January 2016), David Goldenberg and Nancy Fitzpatrick will
negotiate with CDFW, ODFW, and other appropriate scale aging laboratories to collaborate on
scale aging work and sharing of CWT and GSI datasets.
In months 3 and 4, various members of the team will attend and participate in PFMC meetings,
where the commercial salmon will be negotiated and disseminated.
In month 4, pending the publication of the commercial salmon season regulations, Sarah Bates,
Carlos Garza, Pete Lawson, and Nancy Fitzpatrick will obtain necessary permits from NOAA,
CDFW, and ODFW for collection of non-retention samples. Sarah Bates and Michael O'Farrell
will also finalize the sampling plan; David Goldenberg will solicit fleet participation via mail,
and contract with port liaisons. David Goldenberg, Sarah Bates, and Nancy Fitzpatrick will
conduct in-port meetings and train port liaisons, who will in turn fishermen samplers. Similar
meetings will be held at the end of the salmon season, in month 10.
Throughout the salmon season, in months 5-9, liaisons will deliver samples to the genetics
laboratory and enter at-sea data directly to the online database. Stock assignments will be
generated by Carlos Garza's team and disseminated as they are available, within 2 weeks of
sample delivery to the laboratory, in months 6-10. Scales will be delivered from the genetics
laboratory to the scale laboratory, in months 6-10. Age data will be disseminated as they are
available, by month 15 (April 2017).
In month 10, Sarah Bates will clean datasets and generate estimates of CPUE for all stocks in all
months and zones.
In months 11-12, Sarah Bates and Peter Lawson will generate map-based stock comparisons; in
month 13, Sarah Bates and Peter Lawson will generate estimates of time-area distribution
patterns. In months 11-12, William Satterthwaite and Michael O'Farrell will synthesize at-sea
and biological data. In months 13-15, we will compare GSI data to CWT data.
In month 15, various members of the team will attend and participate in PFMC meetings to
present data and findings.
See Supporting Documentation for Gantt chart of major milestones described here.
7. Project management
This proposal is part of a coordinated effort to understand stock distributions in the west coast
commercial Chinook fishery. Members of the project management team described below are
currently working together in a well-established collaboration.
David Goldenberg, CEO of the California Salmon Council, will act as the principal investigator
for this project. He will be responsible for administration and work cooperatively with the
science and technical teams. He will be the main contact with S-K Administration to sign all
contracts, provide regular reports and financial data, and receive and disburse grant funds. Mr.
Goldenberg will schedule all meetings and supervise workflow so that the project goals are
accomplished in a timely manner. Mr. Goldenberg will be the responsible party for meeting all
goals and objectives of the study on behalf of the industry in California, as well as hiring port
liaisons and fishermen for work conducted in California. He will coordinate with his Oregon
counterpart, Nancy Fitzpatrick, Lead Administrator of the Oregon Salmon Commission. Nancy
Fitzpatrick will be responsible for hiring a port liaison and fishermen for work conducted in the
state of Oregon.
Drs. Gil Sylvia, Oregon State University (OSU), and Pete Lawson, OSU and NMFS, will
provide overall leadership to all science components of the project, and ensure that industry and
scientists are collaborating to achieve project goals and objectives. They will coordinate the
collection of scientific data and amalgamation of the databases.
Dr. John Carlos Garza leads the genetics laboratory at the University of California Santa Cruz
(UCSC) Marine Sciences Campus that is part of the UCSC/NOAA Cooperative Institute. He will
oversee the laboratory and data analysis by UCSC staff and assist with report preparation.
Drs. O'Farrell and Satterthwaite, both NMFS, will assist in matters of project implementation,
including advising on potential changes to the allocation of sampling effort over time and space
and modification of sampling practices to promote the generation of representative data. Jeff
Feldner, PFMC member and former fisherman, will provide consultation for at-sea sampling and
industry-scientist relations.
Dr. O'Farrell will provide expertise on the use of scientific products derived from the project for
use in Pacific salmon fishery assessment and management through PFMC.
Dr. Satterthwaite will provide statistical and analytical code and assistance related to
comparisons of stock-specific CPUE and stock proportions across current and proposed
management boundaries.
Sarah Bates, Fleet Manager and fisherman, will coordinate sample collection, data and sample
delivery to the laboratory, basic data analysis, and communications with the commercial fleet.
This project does not anticipate using consultants, but for financial purposes, USCS, OSU, and
the Oregon Salmon Commission collaborators are considered subcontractors to the California
Salmon Council.
Please see Supporting Documentation for CVs of key project participants, as well as letters of
support for NOAA staff:
David J. Goldenberg, CEO, California Salmon Council
Nancy Fitzpatrick, Executive Director, Oregon Salmon Commission
Gil Sylvia, Chairman, Fish Trax Systems, Inc. and Director, Coastal Oregon Marine Experiment
Station
Peter Lawson, Fisheries Biologist, NMFS Northwest Fisheries Science Center
John Carlos Garza, Supervisory Research Geneticist, NMFS Southwest Fisheries Science Center,
and Adjunct Professor of Ocean Sciences, UCSC
Michael O' Farrell, Research Fishery Biologist, NMFS Southwest Fisheries Science Center
William Satterthwaite, Research Ecologist, NMFS Southwest Fisheries Science Center
Jeff Feldner, PFMC Board member
Sarah Bates, Fleet Manager, California Salmon Council
8. Participation by persons or groups other than the applicant
Federal agencies
NOAA staff will provide statistical and analytical assistance related to laboratory genetic
analysis, stock assignments, comparisons of stock-specific CPUE, advise on any adaptive
changes to the sampling plan, and assist in development of tools for fine-scale spatial analysis.
State agencies
The California Salmon Council is a state entity with oversight by both the California Department
of Food and Agriculture and CDFW.
The Oregon Salmon Commission is an industry-funded state commodity commission with
oversight by the Oregon Department of Agriculture.
The University of California Santa Cruz is a research oriented public institution with full service
genetic analysis facilities and expertise.
Fishing communities
The fleet manager, port liaisons, and all samplers will be contracted from within the commercial
salmon fleet. Commercial fishermen will contract with the California Salmon Council and
Oregon Salmon Commission to collect data and samples at sea, enter data in ports, and deliver
samples to the laboratory. Members of the fishing fleet participate in sample design, refine
sampling methods, communicate with enforcement agencies as appropriate, and provide valuable
feedback about feasibility of project design.
9. Outreach and Education
Members of the commercial salmon fleet have been integral in developing and planning this
project. All sampling and associated in-port activities are conducted by members of the fishing
community. The contract, if approved, would be awarded to industry representatives. The
fishermen involved in this project are committed to resolving issues that affect their ability to
engage in successful fishing and make full use of the Chinook stocks that are currently under
fishery management plans.
Outreach to fishermen
We will distribute reports of aggregated catch numbers (on a weekly basis) and stock
composition estimates (as they become available) to the commercial salmon fleet. These reports
will inform fishermen about fishing activities coast wide and may assist in fishing decisions.
Reports will be published on the PFX website, as well as mailed directly to project participants.
Meetings will be held in major fishing ports at the beginning and end of the commercial fishing
season to educate fishing communities about project goals and objectives, train fishermen in
sample collection, and subsequently review project results.
Dissemination of information to fisheries managers
Stock-specific catch per unit effort data will be available to the PFMC Salmon Assessment Team
by the March 2017 Council meeting. We will collaborate with regional and state managers to
provide any other requested datasets in usable formats.
REFERENCES
Anderson EC, Waples RS, Kalinowski ST (2008). An improved method for predicting the
accuracy of genetic stock identification. Can J Fish Aquat Sci 65(7):1475-1486.
Bugaev AV (2004). Scale pattern analysis estimates of the age and stock composition of
Chinook salmon Oncorhynchus tshawytscha in R/V TINRO trawl catches in the western Bering
Sea in September-October 2002 (NPAFC Doc. 764) 15 p. KamchatNIRO, Kamchatka
Fisheries & Oceanography Inst., Fisheries State Committee of Russia.
Clemento AJ, Abadía-Cardoso A, Starks HA, Garza JC (2011). Discovery and characterization
of single nucleotide polymorphisms in Chinook salmon, Oncorhynchus tshawytscha. Mol Ecol
Resour 11(1):50-66.
Clemento AC, Crandall ED, Garza JC, Anderson EC (2014). Evaluation of a single nucleotide
polymorphism baseline for genetic stock identification of Chinook Salmon (Oncorhynchus
tshawytscha) in the California Current large marine ecosystem. Fish B-NOAA 112:112-130.
Flain M, Glova G (1988). A test of the reliability of otolith and scale readings of Chinook
salmon (Oncorhynchus tshawytscha). New Zeal J Mar Fresh, 22: 497-500.
Kimura DK, Chikuni S. (1987). Mixtures of empirical distributions: an iterative application
of the age-length key. Biometrics 43:23-35.
KRTAT (2002). Ocean abundance projections and prospective harvest levels for Klamath River
fall Chinook, 2002 season. Klamath River Technical Advisory Team. Unpublished report.
Available from U.S. Fish and Wildlife Service, 1829 South Oregon Street, Yreka, California,
96097
Nicholas JW, Van Dyke LA (1982). Straying of adult coho salmon to and from a private
hatchery at Yaquina Bay, Oregon. Oregon Department of Fish and Wildlife, Information Reports
(Fish) 82-10, Portland.
NMFS (2000). Biological Opinion and Incidental Take Statement, effects of the Pacific Coast
Salmon Plan on California Central Valley spring-run Chinook, and California Coastal Chinook
salmon. National Marine Fisheries Service, Southwest Region, Protected Resources Division.
NMFS (2007). Federal Recovery Outline for the Evolutionary Significant Unit of California
Coastal Chinook Salmon. National Marine Fisheries Service, Southwest Regional Office, Santa
Rosa CA.
O'Farrell MR, Satterthwaite WH, Spence BC (2012). California Coastal Chinook salmon: status,
data, and feasibility of alternative fishery management strategies. NOAA National Marine
Fisheries Service, Santa Cruz CA.
PFMC (2014). Review of 2013 Ocean Salmon Fisheries: Stock assessment and fishery
evaluation document for the Pacific coast salmon fishery management plan. Pacific Fishery
Management Council, Portland OR.
Satterthwaite WH, Mohr MS, O'Farrell MR, Wells BK (2013). A comparison of temporal
patterns in the ocean spatial distribution of California's Central Valley Chinook salmon runs.
Can J Fish Aquat Sci 70:574–584.
Sattherthwaite WH, Mohr MS, O'Farrell MR, Anderson EC, Banks MA, Bates SJ, Bellinger MR,
Borgerson LA, Crandall ED, Garza JC, Kormos BJ, Lawson PW, Palmer-Zwahlen ML (2014).
Use of genetic stock identification data for comparison of the ocean spatial distribution, size at
age, and fishery exposure of an untagged stock and its indicator: California Coastal versus
Klamath River Chinook. Trans Amer Fish Soc 00:1-17.