Chinook Needs of Southern Resident Killer Whales & … Needs of Southern Resident Killer Whales &...
20
September 26, 2011 Chinook Needs of Southern Resident Killer Whales & Ratios of Chinook Available : Whale Needs Alison Agness - Fishery Biologist NOAA Fisheries, Northwest Region
Transcript of Chinook Needs of Southern Resident Killer Whales & … Needs of Southern Resident Killer Whales &...

September 26, 2011
Chinook Needs of Southern Resident Killer Whales & Ratios of Chinook Available : Whale Needs Alison Agness - Fishery Biologist NOAA Fisheries, Northwest Region

2
The Whales’ Chinook Food Energy Needs
NMFS uses four pieces of scientific information to estimate the whales’ energy needs from Chinook: (1) Their estimated metabolic requirements, (2) The population age/sex structure and abundance, (3) Estimated time spent in inland and coastal waters of
their range, and (4) How much of their metabolic requirements would
ideally be met by Chinook, based on available data regarding percent Chinook in their diet.

3
Estimated Metabolic Requirements
0
50,000
100,000
150,000
200,000
250,000
300,000
Dai
ly P
rey
Ener
gy R
equi
rem
ents
(kca
l/day
)
Age and Sex Classes (Noren 2011)
Max DPER
Min DPER
• Review Noren (2011) results:

4
Population Age/Sex Structure and Abundance
• Known age and sex of all individuals.*
*Annual census by The Center for Whale Research
0
2
4
6
8
10
12
14
16
Num
ber o
f Wha
les
Age and Sex Class (Noren 2011)
J
K
L

5
Daily Prey Energy Requirements by Pod
• Multiplied number of whales per pod and class by both Min and Max DPER.
• Summed the resulting DPER values across class categories per pod.
0
1,000,000
2,000,000
3,000,000
4,000,000
5,000,000
6,000,000
7,000,000
8,000,000
J K L
Tota
l DPE
R N
eeds
(kca
l/day
)
Pod
Total DPER Needs (kcal/day) Min
Total DPER Needs (kcal/day) Max

6
Estimated Time Spent in Inland and Costal Waters
0
5
10
15
20
25
30 Av
erag
e D
ays/
Mon
th
(Han
son
and
Emm
ons
2010
)
Month
Inland Waters
Jpod Kpod Lpod
0
5
10
15
20
25
30
Aver
age
Day
s/M
onth
(H
anso
n an
d Em
mon
s 20
10)
Month
Coastal Waters
Jpod Kpod Lpod

7
Monthly Energy Requirements by Pod & Location
• Multiplied total pod DPER by number of days per month and location.
0 20,000,000 40,000,000 60,000,000 80,000,000
100,000,000 120,000,000
Ener
gy R
equi
rem
ents
(k
cal)
Month
J pod, Inland waters
Max Min
0 20,000,000 40,000,000 60,000,000 80,000,000
100,000,000 120,000,000 140,000,000
Ener
gy R
equi
rem
ents
(k
cal)
Month
J pod, Coastal waters
Max Min

8
Summarized by Pod and FRAM Time Periods
0 50,000,000
100,000,000 150,000,000 200,000,000 250,000,000 300,000,000 350,000,000 400,000,000 450,000,000
Oct
-Apr
il
May
-Jun
e
July
-Sep
t
Oct
-Apr
il
May
-Jun
e
July
-Sep
t
Oct
-Apr
il
May
-Jun
e
July
-Sep
t
J K L Ener
gy R
equi
rem
ents
(kca
l)
FRAM Time Period by Pod
Inland waters Min Max
0 200,000,000 400,000,000 600,000,000 800,000,000
1,000,000,000 1,200,000,000 1,400,000,000 1,600,000,000
Oct
-Apr
il
May
-Jun
e
July
-Sep
t
Oct
-Apr
il
May
-Jun
e
July
-Sep
t
Oct
-Apr
il
May
-Jun
e
July
-Sep
t
J K L Ener
gy R
equi
rem
ents
(kca
l)
FRAM Time Period by Pod
Coastal waters Min Max

9
Summarized for the Whole Population
0
500,000,000
1,000,000,000
1,500,000,000
2,000,000,000
2,500,000,000
3,000,000,000
Oct-April May-June July-Sept Oct-April May-June July-Sept
Inland Coastal
Ener
gy R
equi
rem
ents
(kca
l)
FRAM Time Period by Location
Min
Max
10
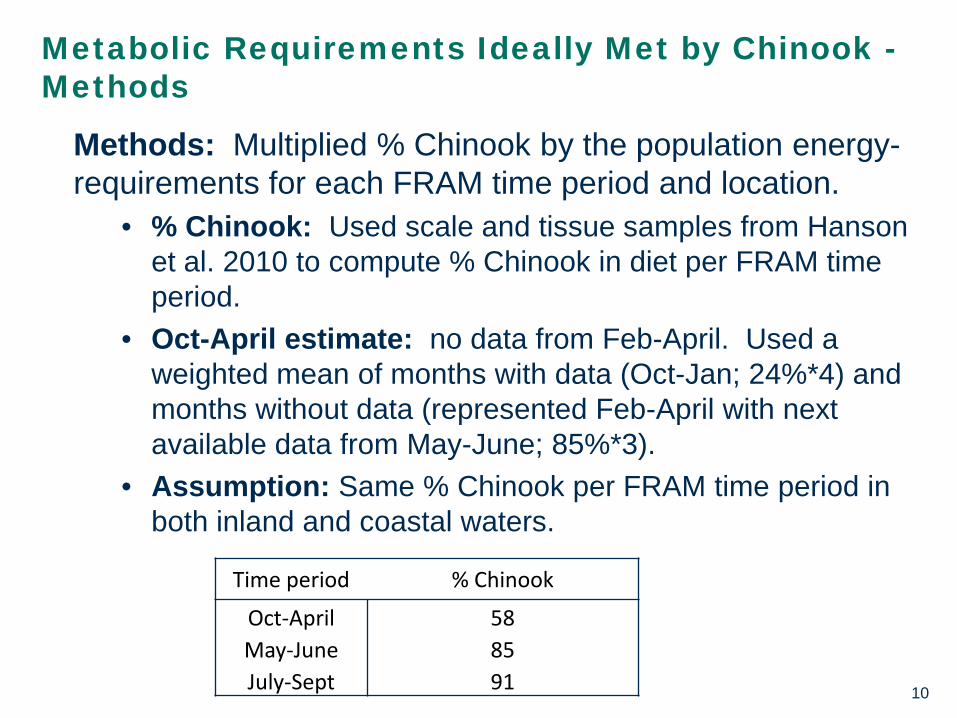
Metabolic Requirements Ideally Met by Chinook -Methods
Methods: Multiplied % Chinook by the population energy-requirements for each FRAM time period and location.
• % Chinook: Used scale and tissue samples from Hanson et al. 2010 to compute % Chinook in diet per FRAM time period.
• Oct-April estimate: no data from Feb-April. Used a weighted mean of months with data (Oct-Jan; 24%*4) and months without data (represented Feb-April with next available data from May-June; 85%*3).
• Assumption: Same % Chinook per FRAM time period in both inland and coastal waters.
Time period % Chinook
Oct-April 58 May-June 85 July-Sept 91

11
Metabolic Requirements Ideally Met by Chinook- Results
0
500,000,000
1,000,000,000
1,500,000,000
2,000,000,000
2,500,000,000
Oct-April May-June July-Sept Oct-April May-June July-Sept
Inland Coastal
Ener
gy R
equi
rem
ents
(k
cal)
FRAM Time Period and Location
Non-Chinook Min Chinook Min
0
500,000,000
1,000,000,000
1,500,000,000
2,000,000,000
2,500,000,000
3,000,000,000
Oct-April May-June July-Sept Oct-April May-June July-Sept
Inland Coastal
Ener
gy R
equi
rem
ents
(k
cal)
FRAM Time Period and Location
Non-Chinook Max
Chinook Max
Minimum
Maximum

12
Ratios of Chinook Available Compared to the Whales Needs - Methods
• Ratio = Prey Available (kcal) / Whale Needs (kcal) • Specific to FRAM time period and location.
• Indicate that Chinook available is greater than the whales’ needs by the magnitude of the value.
• Computed ratios where fisheries are closed and open for comparative purposes. • All U.S. and Canadian Fishing Open • All Open Except Puget Sound Fishing • Only Canadian Fishing Open • All U.S. and Canadian Fishing Closed
• Considered ratios for other marine predators and systems to provide context.
• New: Consider the relative influence of select parameters on the ratio estimates to highlight model sensitivities.

13
Ratios of Chinook Available Compared to the Whales Needs – Coastal Results
15 20 25 30 35 40 45 50 55 60 65
0 1 2 3 4 5
Aver
age
Rat
io
Fishing Scenario
May-June
5
10
15
20
25
0 1 2 3 4 5
Aver
age
Rat
io
Fishing Scenario
July-Sept
5
10
15
20
25
30
35
0 1 2 3 4 5
Aver
age
Rat
io
Fishing Scenario
Oct-April
Fishing Scenario: 1 = All U.S, and Canadian Fishing Open
2 = All U.S. and Canadian Fishing Open Except Puget Sound
3 = Only Canadian Fishing Open
4 = All U.S. and Canadian Fishing Closed

14
Ratios of Chinook Available Compared to the Whales Needs – Coastal Results, Cont.
0 5
10 15 20 25 30 35 40 45 50 55 60 65 70
Rat
io
Year
All U.S. and Canadian Fishing Open
0 5
10 15 20 25 30 35 40 45 50 55 60 65 70
Rat
io
Year
All U.S. and Canadian Fishing Except Puget Sound
0 5
10 15 20 25 30 35 40 45 50 55 60 65 70
Rat
io
Year
Only Canadian Fishing Open
0 5
10 15 20 25 30 35 40 45 50 55 60 65 70
Rat
io
Year
All U.S. and Canadian Fishing Closed
Oct-April May-June July-Sept

15
Ratios of Chinook Available Compared to the Whales Needs – Inland Results
Fishing Scenario: 1 = All U.S, and Canadian Fishing Open
2 = All U.S. and Canadian Fishing Open Except Puget Sound
3 = Only Canadian Fishing Open
4 = All U.S. and Canadian Fishing Closed
4
5
6
7
8
0 1 2 3 4 5
Aver
age
Rat
io
Fishing Scenario
Oct-April
5 6 7 8 9
10 11 12 13
0 1 2 3 4 5
Aver
age
Rat
io
Fishing Scenario
May-June
3
4
5
6
7
8
9
10
11
0 1 2 3 4 5
Aver
age
Rat
io
Fishing Scenario
July-Sept

16
Ratios of Chinook Available Compared to the Whales Needs – Inland Results, Cont.
0
2
4
6
8
10
12
14
Rat
io
Year
All U.S. and Canadian Fishing Open
0
2
4
6
8
10
12
14
Rat
io
Year
All U.S. and Canadian Fishing Open Except Puget Sound
0
2
4
6
8
10
12
14
Rat
io
Year
Only Canadian Fishing Open
0
2
4
6
8
10
12
14
Rat
io
Year
All U.S. and Canadian Fishing Closed
Oct - April May- June July-Sept

17
Ratios for Other Marine Predators and Systems Ratios of prey to predators in four North Pacific ecosystem models. Predators included are cetaceans with fish comprising more than 25% of their diet (Kaplan 2011).
Region Predator
Weighted Prey Ratios by diet composition
only most abundant prey items that collectively sum to 95% of diet
excluding individual prey items <5% of diets
Northern California Current baleen whalesa 24.2 23.9 23.9
Northern California Current orcasb 124.4 122.2 119.6
Northern California Current sperm whalesc 20.0 19.5 19.0
Northern California Current toothed whalesd 14.3 14.3 14.1
Northern British Columbia toothed whalese 3.1 3.1 2.9
Eastern Bering Sea toothed whalesf 30.3 30.1 21.6
Western Bering Sea toothed whalesg 6.0 6.0 5.8

18
Relative Influence of Parameters on the Ratio Estimates
Example: 2008, All U.S. and Canadian Fishing Open, Inland Waters, July – Sept • Start with set values for 2 parameters and a model
decision-rule – • DPER level (Max); Selectivity Function (NOAA-FRAM
model); and After Natural Mortality step of FRAM • Ratio = 4.77
• Vary DPER level (Min) • Ratio = 5.73
• Vary Selectivity Function • Ford-FRAM, Ratio = 3.34 • No Selectivity, Ratio = 18.22
• Vary decision rule for natural mortality • Before natural mortality, Ratio = 5.56

19
Relative Influence of Parameters on the Ratio Estimates, Cont. • Whale Needs:
• Number of whales in the population • Age/Sex distribution • Days spent in each location • DPER level • % Chinook in diet
• Chinook Availability: • Selectivity function • Inclusion/exclusion of FRAM-estimated natural mortality • Assumptions about the contribution of coastal-origin stocks
to inland availability and visa versa (i.e., only those caught were available)

20
Potential New Approaches for Consideration
• Use a Monte Carlo approach to estimate ratios - incorporate variability in each parameter and decision-rule and test parameter sensitivity.
• Further investigate ratios for other predators and systems.
• Other thoughts?