Chinese steel exports. - media.kallanish.com
5
Transcript of Chinese steel exports. - media.kallanish.com
Trade wars are now the flavour of the day but so far the hard measures
have yet to catch up with the aggressive rhetoric. An ongoing tit-for-tat
response between China and the USA may well worsen over the
coming months and change the picture for global trade.
In this issue however we take a look at the direct impacts of the tariffs
announced so far on steel. The result may be counterintuitive: higher
Chinese steel exports.
With inventory levels sliding again, the market may have now adjusted
to a healthier level. There remain doubts over real estate demand
however.
In particular the extent to which the state is supporting real estate
markets through social housing policies which we take a look at in our
end use section.
With concerns over Chinese domestic demand
and international trade, the question now for the
steel industry is will Chinese steel exports see a
rebound?
www.kallanish.com © Kallanish 2018 Page 1
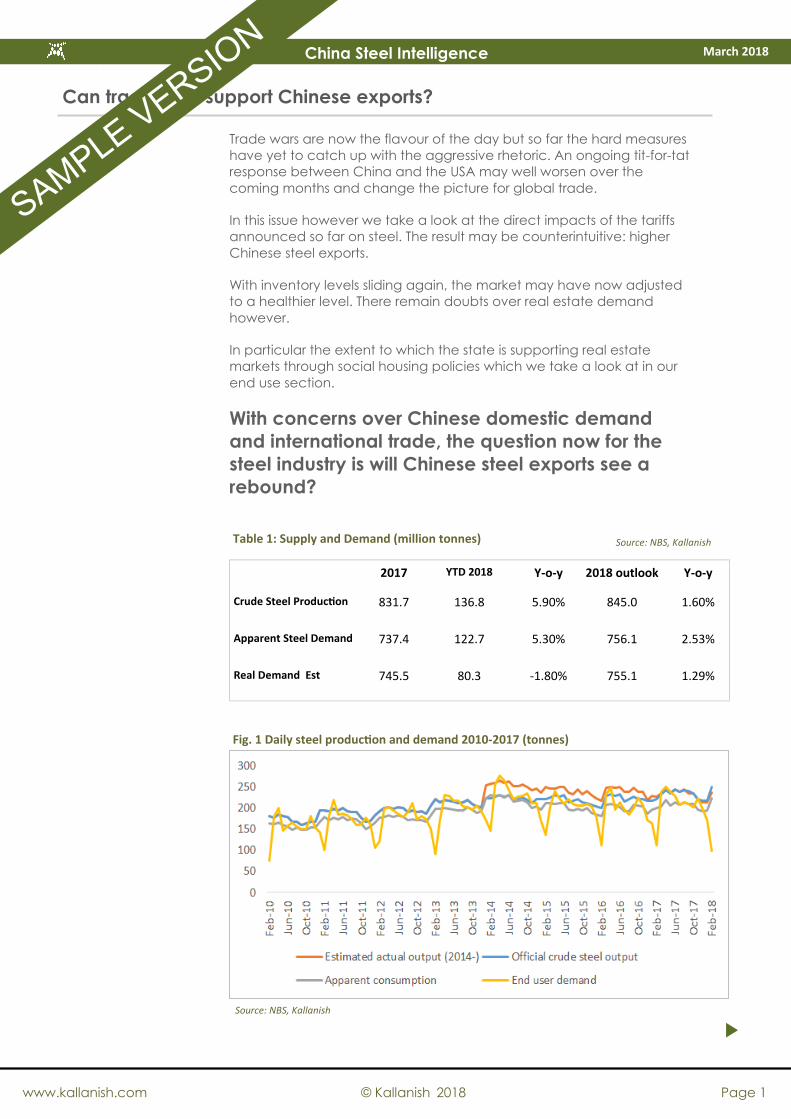
Fig. 1 Daily steel production and demand 2010-2017 (tonnes)
Source: NBS, Kallanish
Table 1: Supply and Demand (million tonnes)
2017 YTD 2018 Y-o-y 2018 outlook Y-o-y
Crude Steel Production 831.7 136.8 5.90% 845.0 1.60%
Apparent Steel Demand 737.4 122.7 5.30% 756.1 2.53%
Real Demand Est 745.5 80.3 -1.80% 755.1 1.29%
Source: NBS, Kallanish
Issue 2, April 2016
China Steel Intelligence China Steel Intelligence March 2018
Can trade wars support Chinese exports?
SAMPLE V
ERSION

As trade has become such a hot topic in the first few months of this year steel
markets have been running around trying to calculate the actual impact of
each announcement as it comes out, no mean feat considering that there
have been significant new announcements on trade every few days. As things
stand however it is important also to not lose track of the larger underlying
trends that are driving steel trade, especially exports from North and East Asia.
Crucially, the Trump tariffs may not have much impact on the overall
competitiveness of Chinese steel internationally, or on the underlying drive to
export or not to export, which is set in China’s domestic steel market. So what
impact will the Trump tariffs actually have on Asia’s steel trade, and how are
China’s exports likely to develop going forward?
One key reason why the US more aggressive approach to trade is provoking a
response is that so much is still uncertain or ill-defined. Negotiations have
continued beyond the start of implementation of the Section 232 tariffs, and
even the agreements which appear firm have not specified how quota will be
calculated. South Korea for example, which is the only country to have a
concrete deal on avoiding tariffs, will be set a quota at 70% of average US
imports from the country over 2015-2017. But will this quota apply equally to all
products? Will the quota evolve over time? Will the calculations consider the
value of products imported? If specific products are later granted exemptions
to tariffs, will they also then be excluded from the quota limit? Or will the quota
limit itself have to be adjusted to exclude these products? These details will
only emerge as the niggling issues of implementation are ironed out over the
coming months.
To get a better sense of how trade will be affected, we’ve looked at customs
data from China, South Korea and Japan. One thing to note is that the US
tariff codes which will be charged the 25% tax do not cover all the codes we
normally use to report imports and exports. In fact, only around two thirds of
China’s exports to the USA are covered by the tariffs, as they exclude pipe
fittings and other products which we normally include in our monthly data. Of
the 6.46 million tonnes of steel reported exported to the USA by China, South
Korea and Japan in 2017, 6.02m t is covered by the tariffs. For this section, the
trade data only includes HS codes that will be charged the new 25% US tariffs.
South Korea is currently the only country to have agreed the outlines of a deal
to avoid duties. South Korean steel exporters will not have to pay the duties of
25% on steel and 10% on aluminium that the USA imposed as a result of a
Section 232 investigation. The country will only be allowed to export up to a
quota of 2.68 million tonnes of steel to the US, however, just 77% of the 3.47mt
of products covered by the investigation that it exported to the country in
2017.
www.kallanish.com © Kallanish 2018 Page 2
China Steel Intelligence March 2018
Can trade wars support Chinese exports?
Chinese steel
exports more
positive despite
Trump
Negotiations
so far
What do we
know?
Fig. 2 Korean exports to US swap duties for quota (t/m)
Source: Korean customs, Kallanish
SAMPLE V
ERSION
www.kallanish.com © Kallanish 2018 Page 12
China Steel Intelligence March 2018
Kallanish - North America
4110 Lydia St
Pittsburgh PA 15207
t: +1 412 586 7195
Kallanish - Bulgaria
13 Yantra Street
Sofia 1000 Bulgaria
t: +359 89 7799633
Kallanish - China
Rm.5G, 5/F, Jiafa Building
129 Datian Rd., Jing’an District
Shanghai, China
Tel +86 182 1728 2941
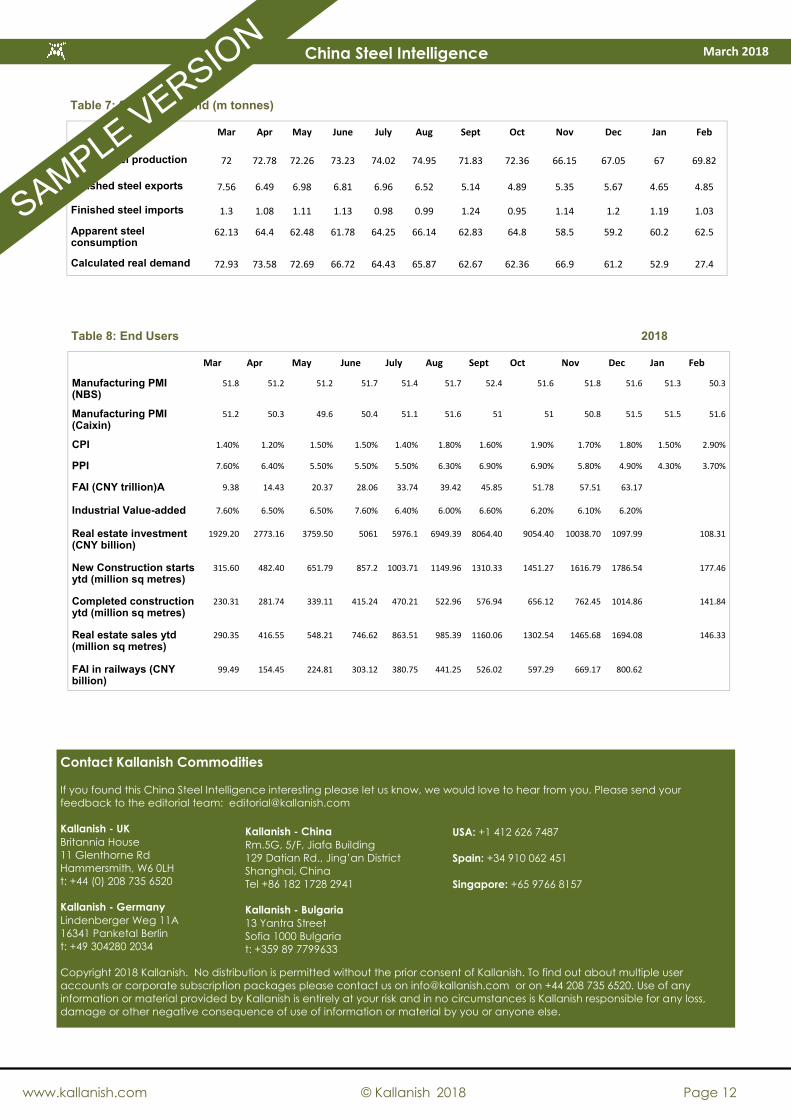
Table 7: Supply/Demand (m tonnes)
Mar Apr May June July Aug Sept Oct Nov Dec Jan Feb
Crude steel production 72 72.78 72.26 73.23 74.02 74.95 71.83 72.36 66.15 67.05 67 69.82
Finished steel exports 7.56 6.49 6.98 6.81 6.96 6.52 5.14 4.89 5.35 5.67 4.65 4.85
Finished steel imports 1.3 1.08 1.11 1.13 0.98 0.99 1.24 0.95 1.14 1.2 1.19 1.03
Apparent steel consumption
62.13 64.4 62.48 61.78 64.25 66.14 62.83 64.8 58.5 59.2 60.2 62.5
Calculated real demand 72.93 73.58 72.69 66.72 64.43 65.87 62.67 62.36 66.9 61.2 52.9 27.4
Table 8: End Users 2018
Mar Apr May June July Aug Sept Oct Nov Dec Jan Feb
Manufacturing PMI (NBS)
51.8 51.2 51.2 51.7 51.4 51.7 52.4 51.6 51.8 51.6 51.3 50.3
Manufacturing PMI (Caixin)
51.2 50.3 49.6 50.4 51.1 51.6 51 51 50.8 51.5 51.5 51.6
CPI 1.40% 1.20% 1.50% 1.50% 1.40% 1.80% 1.60% 1.90% 1.70% 1.80% 1.50% 2.90%
PPI 7.60% 6.40% 5.50% 5.50% 5.50% 6.30% 6.90% 6.90% 5.80% 4.90% 4.30% 3.70%
FAI (CNY trillion)A 9.38 14.43 20.37 28.06 33.74 39.42 45.85 51.78 57.51 63.17
Industrial Value-added 7.60% 6.50% 6.50% 7.60% 6.40% 6.00% 6.60% 6.20% 6.10% 6.20%
Real estate investment (CNY billion)
1929.20 2773.16 3759.50 5061 5976.1 6949.39 8064.40 9054.40 10038.70 1097.99 108.31
New Construction starts ytd (million sq metres)
315.60 482.40 651.79 857.2 1003.71 1149.96 1310.33 1451.27 1616.79 1786.54 177.46
Completed construction ytd (million sq metres)
230.31 281.74 339.11 415.24 470.21 522.96 576.94 656.12 762.45 1014.86 141.84
Real estate sales ytd (million sq metres)
290.35 416.55 548.21 746.62 863.51 985.39 1160.06 1302.54 1465.68 1694.08 146.33
FAI in railways (CNY billion)
99.49 154.45 224.81 303.12 380.75 441.25 526.02 597.29 669.17 800.62
Contact Kallanish Commodities
If you found this China Steel Intelligence interesting please let us know, we would love to hear from you. Please send your
feedback to the editorial team: [email protected]
Kallanish - UK
Britannia House
11 Glenthorne Rd
Hammersmith, W6 0LH
t: +44 (0) 208 735 6520
Kallanish - Germany
Lindenberger Weg 11A
16341 Panketal Berlin
t: +49 304280 2034
Copyright 2018 Kallanish. No distribution is permitted without the prior consent of Kallanish. To find out about multiple user
accounts or corporate subscription packages please contact us on [email protected] or on +44 208 735 6520. Use of any
information or material provided by Kallanish is entirely at your risk and in no circumstances is Kallanish responsible for any loss,
damage or other negative consequence of use of information or material by you or anyone else.
Kallanish - China
Rm.5G, 5/F, Jiafa Building
129 Datian Rd., Jing’an District
Shanghai, China
Tel +86 182 1728 2941
Kallanish - Bulgaria
13 Yantra Street
Sofia 1000 Bulgaria
t: +359 89 7799633
USA: +1 412 626 7487
Spain: +34 910 062 451
Singapore: +65 9766 8157
SAMPLE V
ERSION

Start my subscription Yes, please start my subscription so that I can read the China Steel Intelligence. Please choose your option
below:
Option 1: CSI, US$3000
Option 2: CSI, with KallanishSteel Subscriber 15% discount, US$ 2550
Option 3: CSI and KallanishSteel Bundle, 15% discount, US$ 4249
Name
Job Title
Company
Address
City
Phone
Please tick below:
I confirm I am signing up for a 12 month subscription to CSI
I have read and agreed to the Kallanish Terms and Conditions.
Signature: _____________________________________________ Date: _________________________________
Subscribe to CSI today [email protected] +44 208 735 6520
Get your copy of the monthly China Steel
Intelligence report at a great price
China Steel Intelligence is a monthly report put together by our expert
team of analysts based in Shanghai.
If you are already a subscriber to KallanishSteel you qualify for an
additional discount. The pricing options for 12 month subscriptions are
available below.
To sign up complete the form below and return to us.
Option 1: CSI US$ 3000
Option 2: CSI, KallanishSteel Subscriber Rate US$ 2550 SAVE 15%
Option 3: CSI + KallanishSteel Bundle US$ 4249 SAVE 15%
CSI Content:
The report is filled with market
information, charts and graphs.
Supplied in PDF
Excel statistical supplement
7-10 pages
Supply and demand
forecasts
End use sector data
Trade data
Macro economic overview
Payment type: Pay by invoice
Pay by credit card
Credit card: Visa AMEX Mastercard
Card number
CCV Exp
Name on card
Signature
ORDER FORM Subscribe to China Steel Intelligence today
China Steel Intelligence March 2018