Chincoteague Visitor Transportation Study Draft Presentation November 1998 The Marketing Source,...
57
Chincoteague Chincoteague Visitor Visitor Transportation Transportation Study Study Draft Presentation Draft Presentation November 1998 November 1998 The Marketing Source, The Marketing Source, Inc. Inc.
-
Upload
eileen-harrell -
Category
Documents
-
view
215 -
download
0
Transcript of Chincoteague Visitor Transportation Study Draft Presentation November 1998 The Marketing Source,...

Chincoteague Visitor Chincoteague Visitor Transportation Study Transportation Study
Draft PresentationDraft Presentation
November 1998November 1998
The Marketing Source, Inc.The Marketing Source, Inc.
THE MARKETING SOURCE, INC.
2
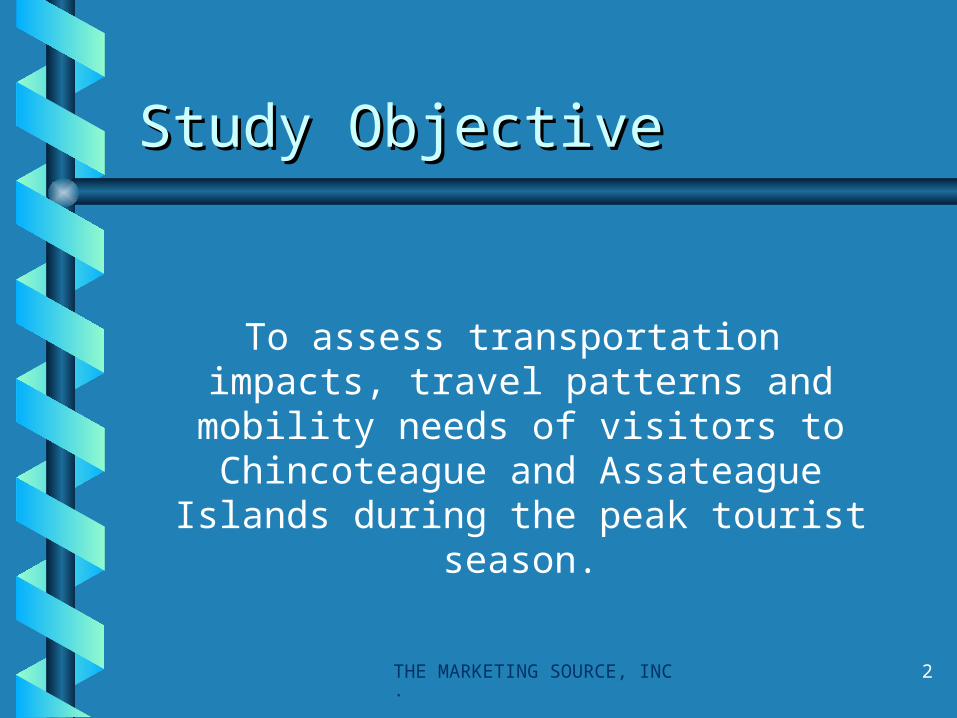
Study ObjectiveStudy Objective
To assess transportation impacts, travel patterns and mobility needs of visitors to Chincoteague and Assateague Islands
during the peak tourist season.
THE MARKETING SOURCE, INC.
3
Study ComponentsStudy Components
Chincoteague Assateague Surveys Surveys
THE MARKETING SOURCE, INC.
4
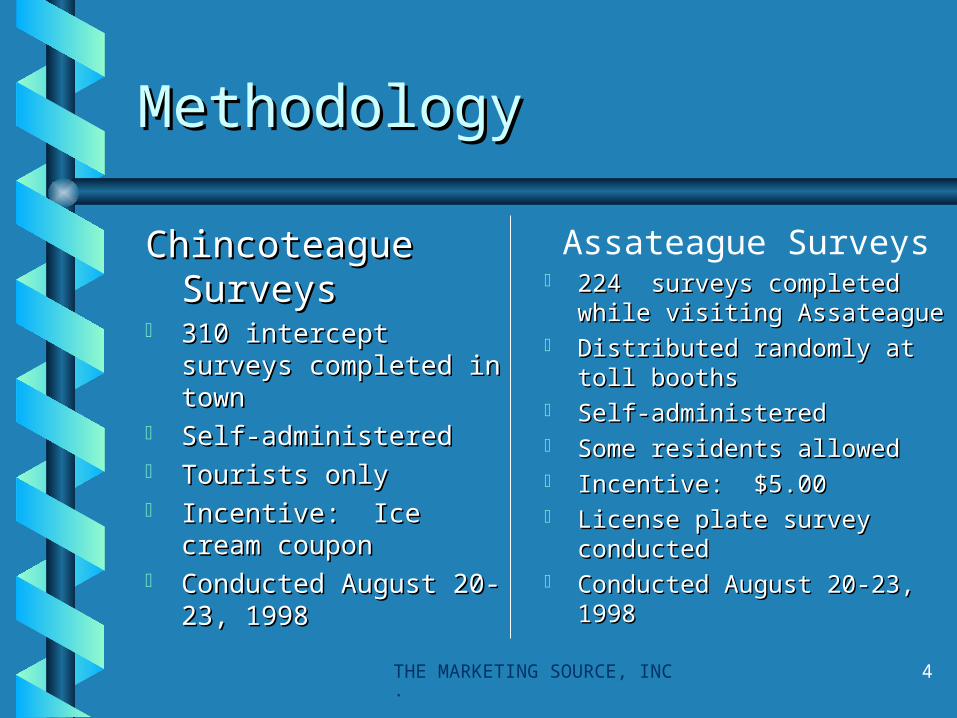
MethodologyMethodology
Chincoteague Chincoteague SurveysSurveys
310 intercept surveys 310 intercept surveys completed in towncompleted in town
Self-administeredSelf-administered Tourists only Tourists only Incentive: Ice cream Incentive: Ice cream
coupon coupon Conducted August 20-Conducted August 20-
23, 199823, 1998
Assateague Surveys 224 surveys completed 224 surveys completed
while visiting Assateaguewhile visiting Assateague Distributed randomly at toll Distributed randomly at toll
boothsbooths Self-administeredSelf-administered Some residents allowed Some residents allowed Incentive: $5.00Incentive: $5.00 License plate survey License plate survey
conductedconducted Conducted August 20-23, Conducted August 20-23,
19981998

THE MARKETING SOURCE, INC.
5
Who was interviewed?Who was interviewed?

THE MARKETING SOURCE, INC.
6
Profile of respondentsProfile of respondents
Gender: Gender: 41% men; 59% women41% men; 59% women
Age: Age: Under 30 yearsUnder 30 years 8% 8%
30-39 years30-39 years 3030
40-49 years 40-49 years 3636
50+ years50+ years 2626
Income: Income: Under $35KUnder $35K 14%14%
$35-49K$35-49K 2121
$50-74K$50-74K 2929
$75-100K$75-100K 1717
Over $100KOver $100K 1818

THE MARKETING SOURCE, INC.
7
Who comes to Who comes to Chincoteague and Chincoteague and Assateague Islands?Assateague Islands?

THE MARKETING SOURCE, INC.
8
Many visitors come from Many visitors come from Pennsylvania, Eastern Shore, Pennsylvania, Eastern Shore,
and other parts of Maryland.and other parts of Maryland.
Other States10%
DE3%
NY5%
PA21%
Eastern Shore22%
VA4%
NJ8%
MD23%
Source: License Plate Survey; Base = 5,150

9
Origin points differ by Origin points differ by length of visit.length of visit.
State Weekday WeekendMaryland 21% 27%
Pennsylvania 25% 21%
Accomack 7% 6%
Northhampton 3% 1%
Other Eastern Shore 10% 17%
New Jersey 8% 7%
Virginia 5% 3%
New York 6% 4%
Delaware 2% 4%
Source: License Plate Survey; Base = 5,150

THE MARKETING SOURCE, INC.
10
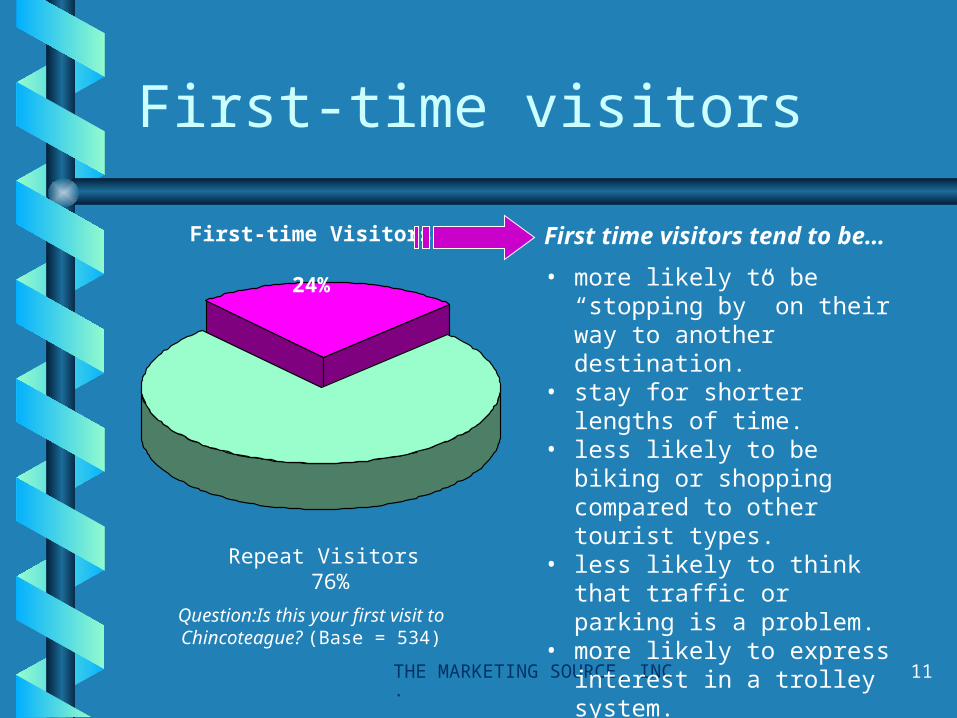
Question:Is this your first visit to Chincoteague? (Base = 534)
Three-fourths (76%) of those surveyed had previously visited Chincoteague Island.
Repeat Visitors 76%
First-time Visitors 24%
Among repeat visitors…
• 33% had visited 1-3 times; 67% had visited 4+ times (over past 5 years).
• Most stay for a week or more.• Frequent visitors (4+ times in
5 years) are more likely to rate weekend traffic a problem and also rate parking at Assateague Beach a problem.
• Repeat visitors are more likely to not want any changes to occur.
THE MARKETING SOURCE, INC.
11
Question:Is this your first visit to Chincoteague? (Base = 534)
First-time visitors
Repeat Visitors 76%
First-time Visitors 24%
First time visitors tend to be…
• more likely to be “stopping by” on their way to another destination.
• stay for shorter lengths of time.• less likely to be biking or
shopping compared to other tourist types.
• less likely to think that traffic or parking is a problem.
• more likely to express interest in a trolley system.
THE MARKETING SOURCE, INC.
12
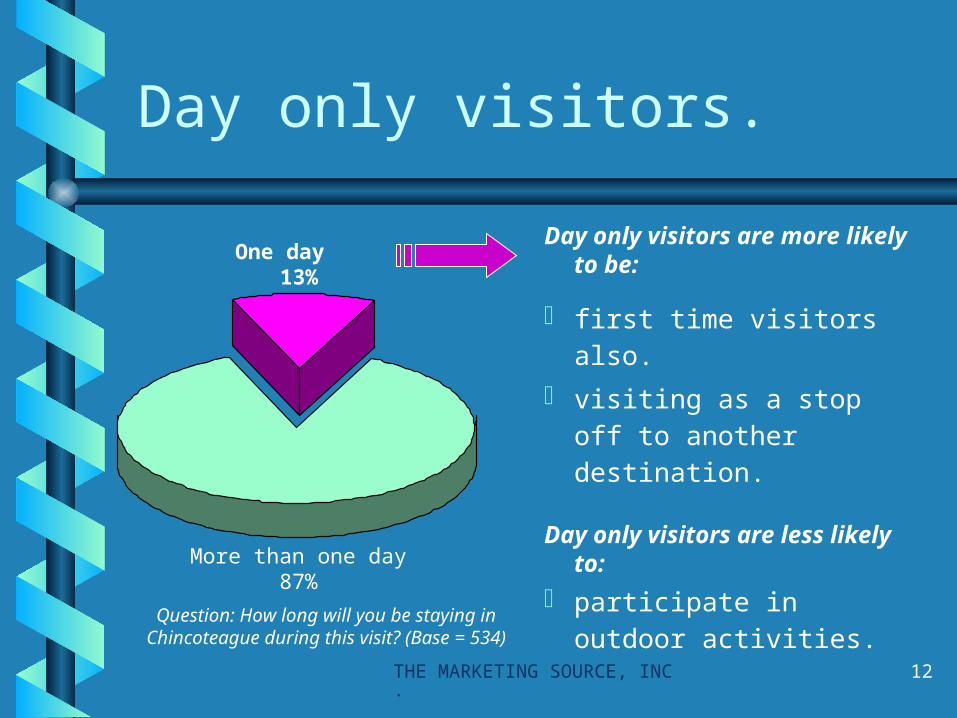
Question: How long will you be staying in Chincoteague during this visit? (Base = 534)
Day only visitors.
More than one day87%
One day 13%
Day only visitors are more likely to be:
first time visitors also.
visiting as a stop off to another destination.
Day only visitors are less likely to:
participate in outdoor activities.

THE MARKETING SOURCE, INC.
13
The majority (71%) of the persons The majority (71%) of the persons interviewed have at least 3 persons interviewed have at least 3 persons in their party..in their party..
29%
41%
30%
0% 20% 40% 60%
1 to 2
3 to 4
5+
Question: How many people, including yourself, are in your party? (Base = 533) Average = 4.2 persons
Number in Party

14
Over half (56%) of tourist travel with Over half (56%) of tourist travel with children under 12 years old.children under 12 years old.
37%
56%
21%
0% 20% 40% 60%
No children
Children<12 years
Children13-16 years
Presence of Children in Party
Question: How many children under 12 years old are in your party? How many children 13-16 years old are in your party? (Base = 531)
Those with young children..
• are more active in outdoor activities.
• use their car more often.• stay longer.• say they would visit more
often with pedestrian friendly downtown.
• receptive to proposed enhancements (trolley, additional bike trails/racks, bike lanes, and new interpretive center.
• tend to be 30-39 years old.

THE MARKETING SOURCE, INC.
15
For the majority (89%), Chincoteague Island is the
final trip destination. Only 1 in 10 (11%) say it is a stop-off point to another destination.

THE MARKETING SOURCE, INC.
16
Major destinations visiting while on this trip include:
Williamsburg 11%
Ocean City 9%
Virginia Beach 7%
Washington DC 5%
Maryland (unspecified) 12%
Virginia (unspecified) 16%
Caution: Small sample size; Base =46
THE MARKETING SOURCE, INC.
17
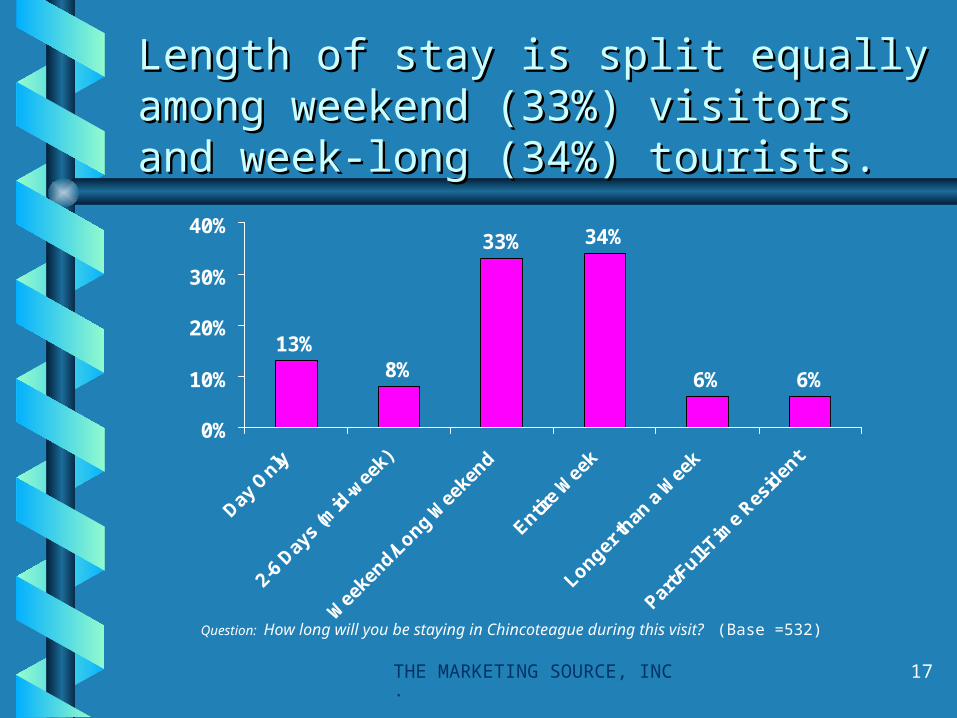
Length of stay is split equally among Length of stay is split equally among weekend (33%) visitors and week-weekend (33%) visitors and week-long (34%) tourists.long (34%) tourists.
13%8%
33% 34%
6% 6%
0%
10%
20%
30%
40%
Day O
nly
2-6
Days
(mid
-wee
k)
Wee
kend/L
ong Wee
kend
Entire
Wee
k
Longer th
an a
Wee
k
Part/F
ull-Tim
e Res
iden
t
Question: How long will you be staying in Chincoteague during this visit? (Base =532)

THE MARKETING SOURCE, INC.
18
What are the spending habits?
Amount Spent by Length of Stay
Length of Stay Day Only Weekend Week (Base) (58)* (156) (162)
Less than $300 88% 34% 8%$300-499 5 28 14$500-999 5 29 30$1,000-1,499 2 6 30$1,500 or more 0 3 18
* Caution: Low sample size
Question: What is the approximate total amount of money you will spend while on this trip to the islands?

THE MARKETING SOURCE, INC.
19
What do Tourists do while visiting the islands?
THE MARKETING SOURCE, INC.
20
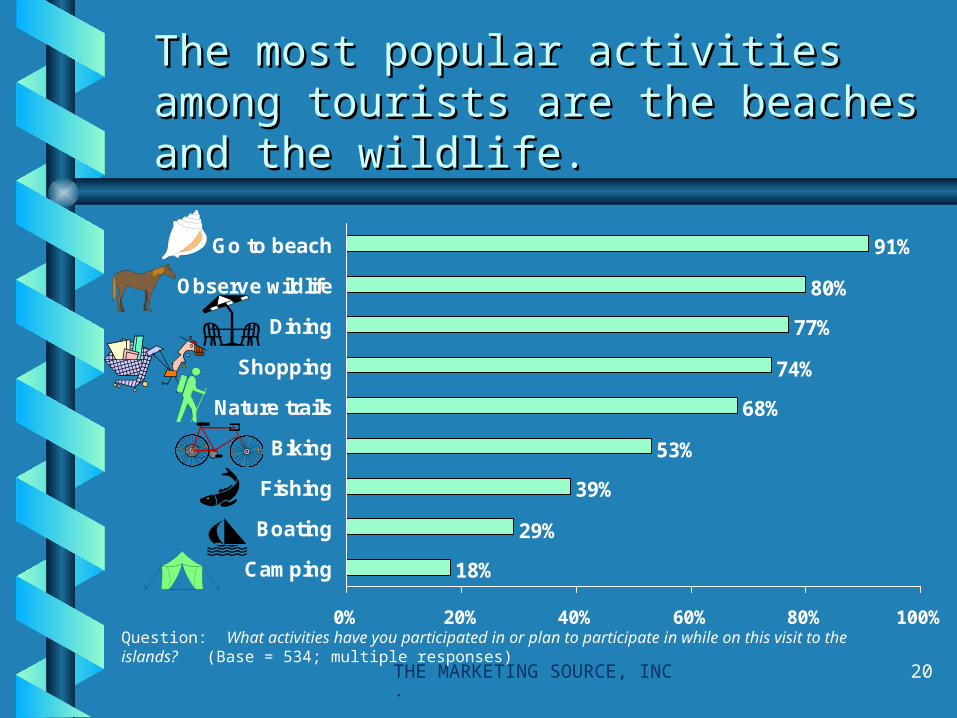
The most popular activities among The most popular activities among tourists are the beaches and the tourists are the beaches and the wildlife.wildlife.
18%
29%
39%
53%
68%
74%
77%
80%
91%
0% 20% 40% 60% 80% 100%
Camping
Boating
Fishing
Biking
Nature trails
Shopping
Dining
Observe wildlife
Go to beach
Question: What activities have you participated in or plan to participate in while on this visit to the islands? (Base = 534; multiple responses)
21
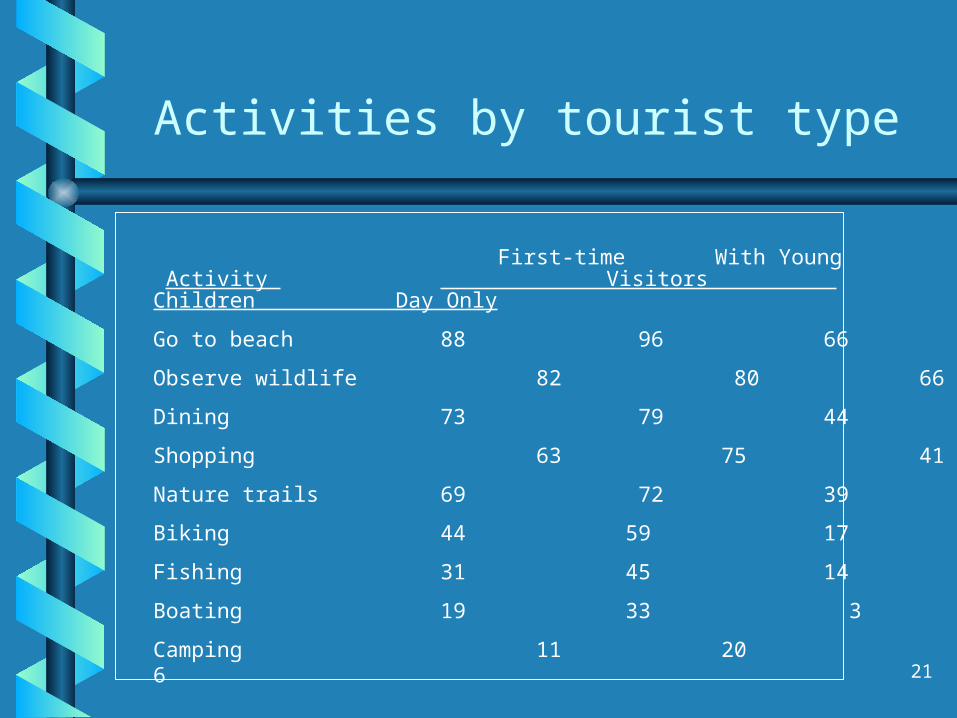
Activities by tourist type
First-time With Young Activity Visitors Children Day Only
Go to beach 88 96 66
Observe wildlife 82 80 66
Dining 73 79 44
Shopping 63 75 41
Nature trails 69 72 39
Biking 44 59 17
Fishing 31 45 14
Boating 19 33 3
Camping 11 20 6
THE MARKETING SOURCE, INC.
22
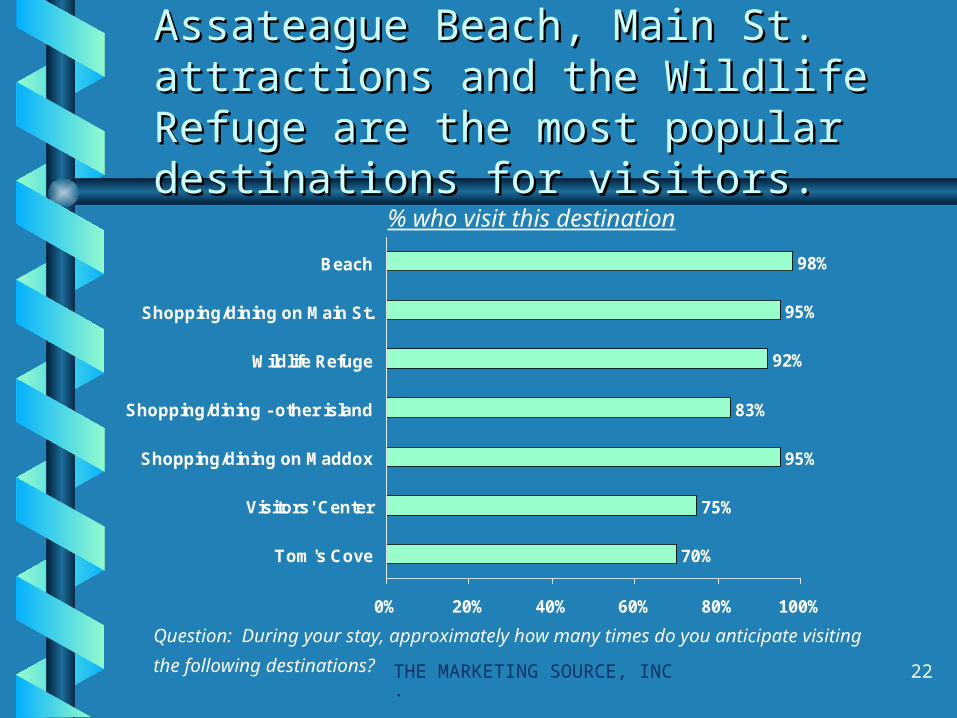
Assateague Beach, Main St. Assateague Beach, Main St. attractions and the Wildlife Refuge attractions and the Wildlife Refuge are the most popular destinations are the most popular destinations for visitors.for visitors.
70%
75%
95%
83%
92%
95%
98%
0% 20% 40% 60% 80% 100%
Tom's Cove
Visitors' Center
Shopping/dining on Maddox
Shopping/dining - other island
Wildlife Refuge
Shopping/dining on Main St.
Beach
Question: During your stay, approximately how many times do you anticipate visiting the
following destinations?
% who visit this destination

THE MARKETING SOURCE, INC.
23
The average number of visits to each destination varies by length of visit.
Average Visits by Length of Visit Destination Day Only Weekend Week
Shopping or dining on Main Street 2 3 4 Shopping or dining on Maddox Rd. 2 3 4Shopping or dining at other places 2 2 3 on the island Assateague Beach 1 3 6 Chincoteague National Wildlife Refuge 1 2 4Chincoteague Refuge Visitors’ Center 1 1 2 Tom’s Cove Visitors’ Center (on beach) 1 1 2

THE MARKETING SOURCE, INC.
24
How do visitors travel around Chincoteague and Assateague Islands?
THE MARKETING SOURCE, INC.
25
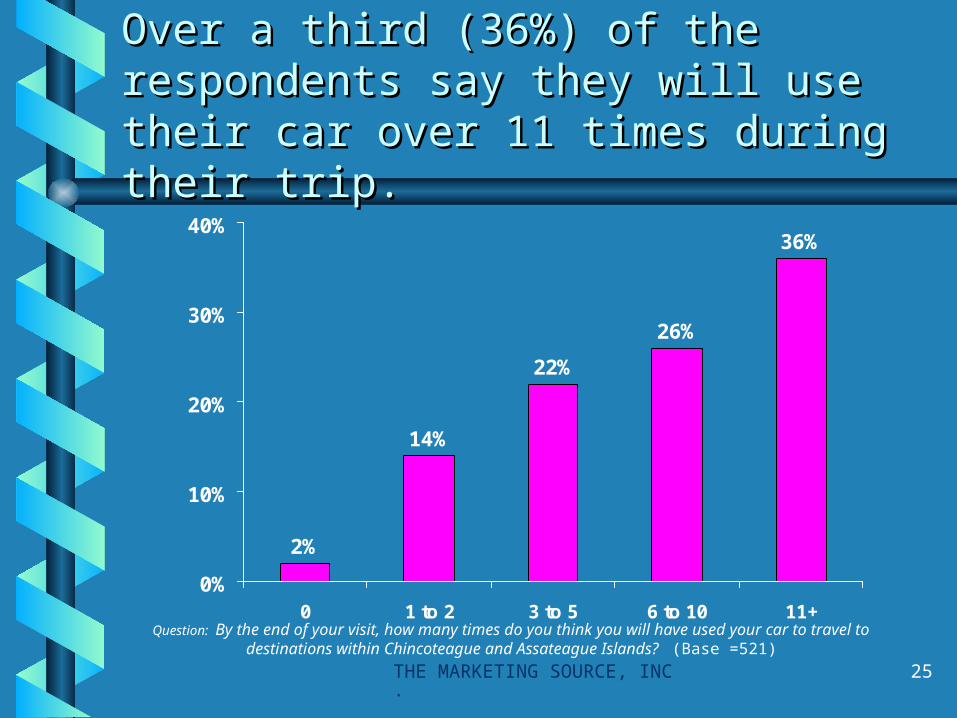
Over a third (36%) of the respondents Over a third (36%) of the respondents say they will use their car over 11 times say they will use their car over 11 times during their trip.during their trip.
2%
14%
22%
26%
36%
0%
10%
20%
30%
40%
0 1 to 2 3 to 5 6 to 10 11+Question: By the end of your visit, how many times do you think you will have used your car to travel to
destinations within Chincoteague and Assateague Islands? (Base =521)

THE MARKETING SOURCE, INC.
26
Over half (57%) of week-long visitors use their vehicles 11 or more times.
Over half (57%) of week-long visitors use their vehicles 11 or more times.
Length of Visit Day Only Weekend Week
(Base) (68) (168) (180)
None 6% 2% 0%
1-2 times 62 12 2
3-5 times 20 38 13
6-10 times 9 34 28
11+ times 3 14 57
Question: By the end of your visit, how many times do you think you will have used your car to travel to destinations within Chincoteague and Assateague Islands?
Vehicle U
se
THE MARKETING SOURCE, INC.
27
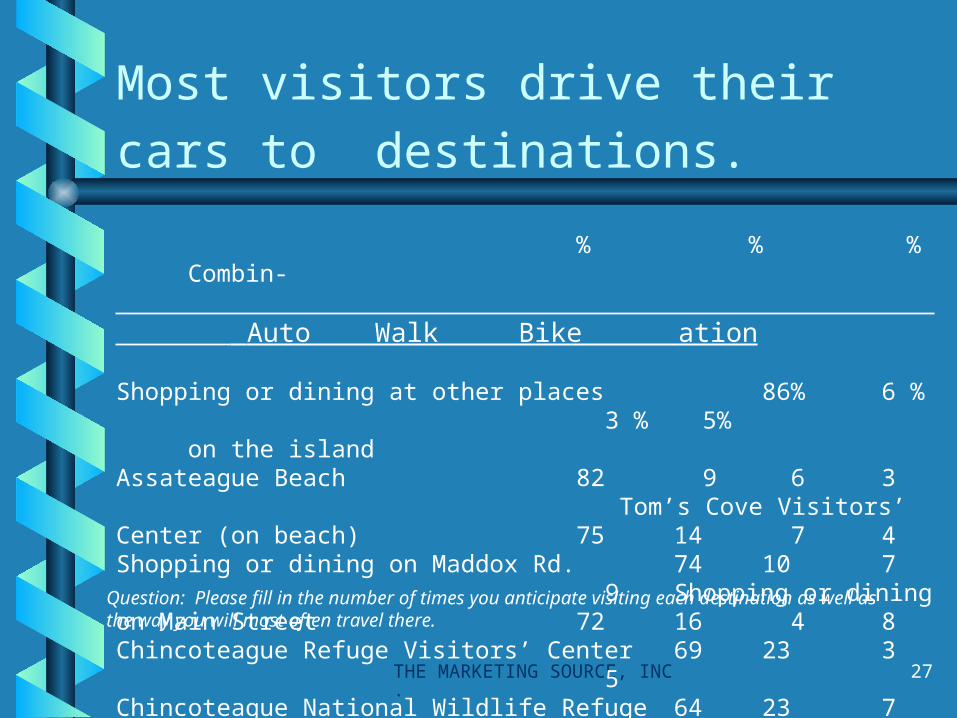
Most visitors drive their cars to destinations.
% % % Combin- Auto Walk Bike ation
Shopping or dining at other places 86% 6 % 3 % 5% on the island Assateague Beach 82 9 6 3 Tom’s Cove Visitors’ Center (on beach) 75 14 7 4Shopping or dining on Maddox Rd. 74 10 7 9Shopping or dining on Main Street 72 16 4 8Chincoteague Refuge Visitors’ Center 69 23 3 5Chincoteague National Wildlife Refuge 64 23 7 6
Question: Please fill in the number of times you anticipate visiting each destination as well as the way you will most often travel there.

THE MARKETING SOURCE, INC.
28
Do visitors think that traffic congestion and parking conditions are a problem?

THE MARKETING SOURCE, INC.
29
Visitors acknowledge that traffic is Visitors acknowledge that traffic is more congested on the weekend. more congested on the weekend. However, only about a third say that However, only about a third say that it is a problemit is a problem..
7%
15%
11%
28%
40%
38%
0% 10% 20% 30% 40% 50%
WildlifeRefuge
Maddox St.
Main St.
Weekend
Weekday
Question: How would you rate the overall automobile TRAFFIC CONGESTION on the islands both during the week and on the weekend? Use a scale of 1 to 5, where “5” is a big problem and “1” is no problem at all.
% “4” and “5” responses
THE MARKETING SOURCE, INC.
30
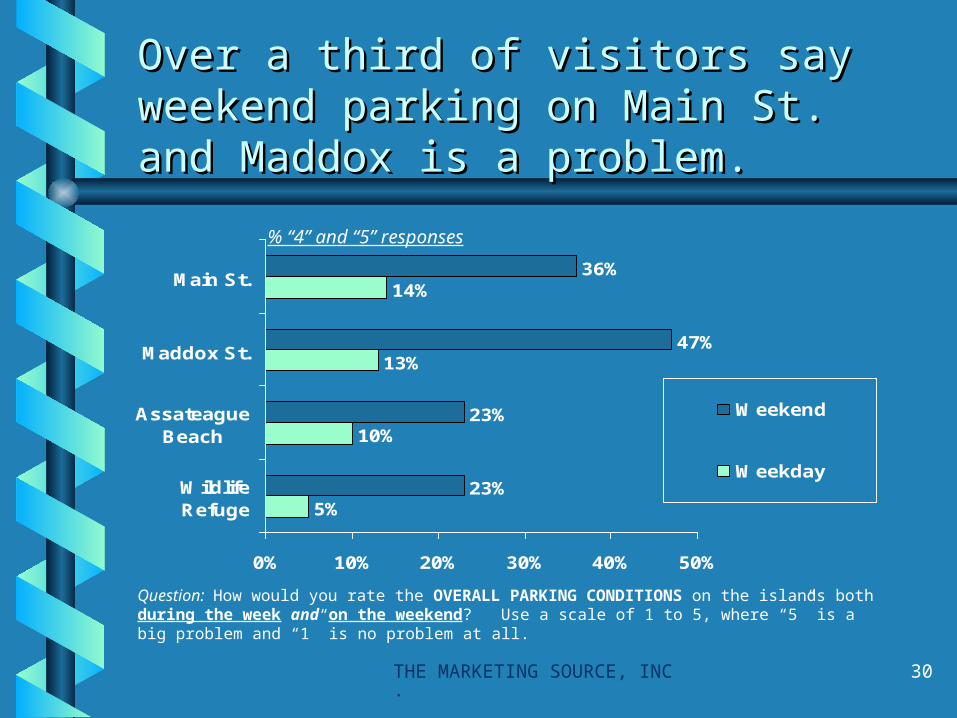
Over a third of visitors say Over a third of visitors say weekend parking on Main St. and weekend parking on Main St. and Maddox is a problem. Maddox is a problem.
5%
10%
13%
14%
23%
23%
47%
36%
0% 10% 20% 30% 40% 50%
WildlifeRefuge
AssateagueBeach
Maddox St.
Main St.
Weekend
Weekday
Question: How would you rate the OVERALL PARKING CONDITIONS on the islands both during the week and on the weekend? Use a scale of 1 to 5, where “5” is a big problem and “1” is no problem at all.
% “4” and “5” responses

THE MARKETING SOURCE, INC.
31
What do visitors think about possible improvements?
Pedestrian-Friendly Downtown
Trolley Service
Additional Bike Trails/Racks
New Educational/Interpretive Center
Visitors’ Input

THE MARKETING SOURCE, INC.
32
10%
9%
18%
30%
53%
0% 20% 40% 60%
Other
Lengthen stay
Visit islands more often
Visit downtown moreoften
Would not influenceplans
Nearly a third (30%) of visitors say Nearly a third (30%) of visitors say they would visit downtown more they would visit downtown more often if it were more pedestrian-often if it were more pedestrian-friendly.friendly.
Those visitors who support the pedestrian-friendly downtown are more likely to:
• visited 1-3 times in the past 5 years.
• be visitors with children under 12 years. (36%)
Downtown changes are less likely to influence frequent visitors (4+ times in 5 years).Question: A proposed idea is a pedestrian-friendly downtown
with wide sidewalks, bike lanes, and a trolley system that would provide central access to shopping and restaurants. Which of the following describe how this pedestrian-friendly downtown might affect your future plans to visit the islands? [Check all that apply] Base = 534
Reaction to Pedestrian-Friendly Downtown Proposal
THE MARKETING SOURCE, INC.
33
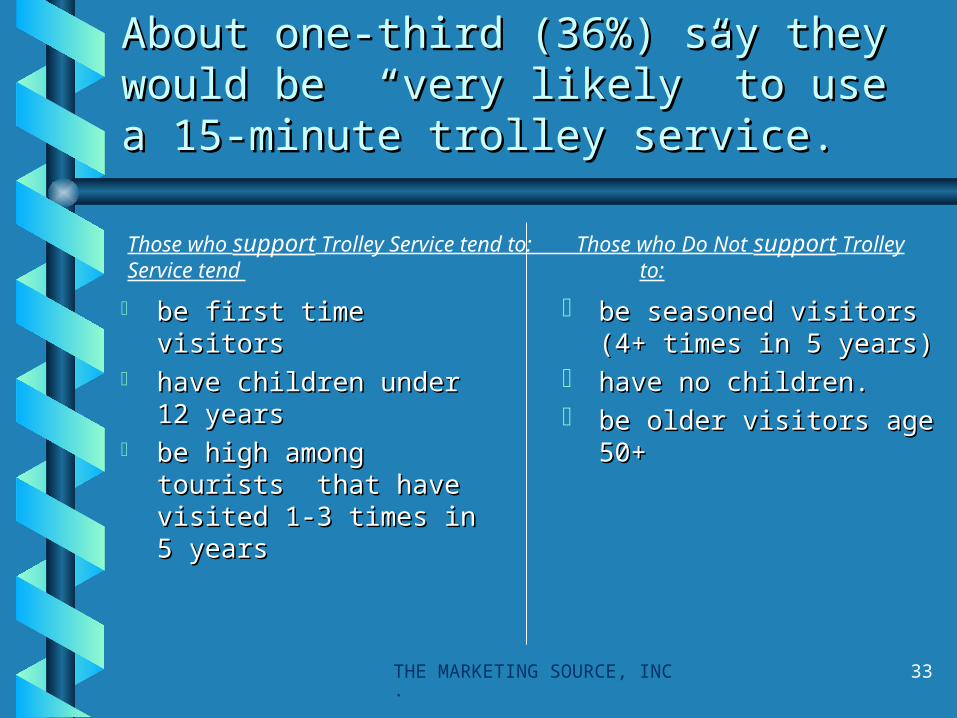
About one-third (36%) say they About one-third (36%) say they would be “very likely” to use a 15-would be “very likely” to use a 15-minute trolley service.minute trolley service.
be first time visitorsbe first time visitors have children under 12 have children under 12
yearsyears be high among tourists be high among tourists
that have visited 1-3 that have visited 1-3 times in 5 yearstimes in 5 years
Those who support Trolley Service tend to: Those who Do Not support Trolley Service tend to:
be seasoned visitors (4+ be seasoned visitors (4+ times in 5 years) times in 5 years)
have no children. have no children. be older visitors age 50+be older visitors age 50+
34
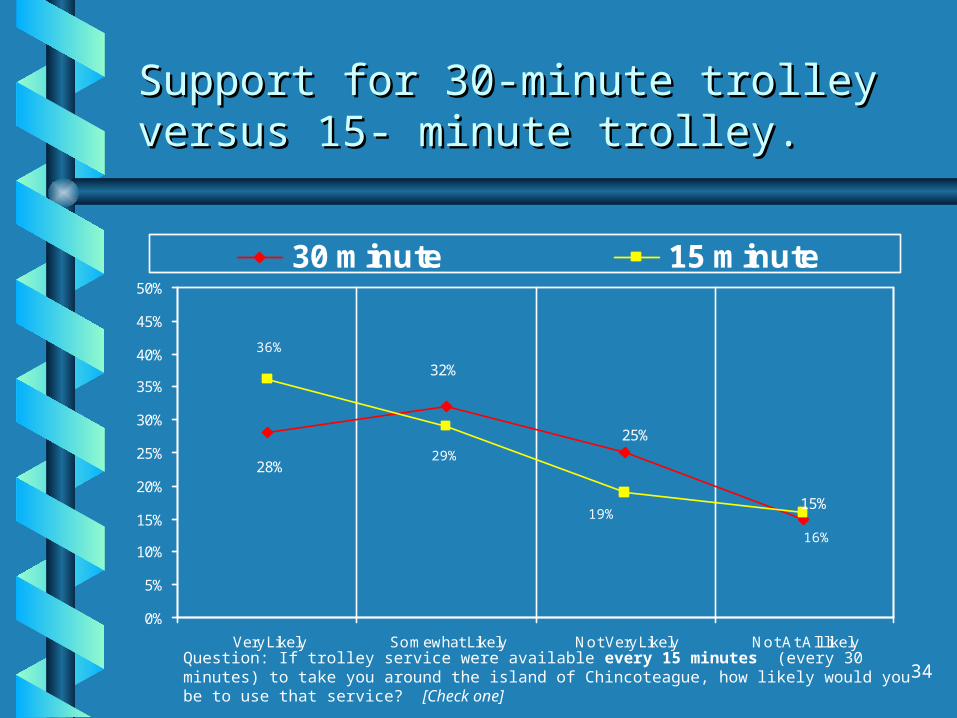
15%
25%
32%
28%
36%
29%
19%
16%
0%
5%
10%
15%
20%
25%
30%
35%
40%
45%
50%
Very Likely Somewhat Likely Not Very Likely Not At All likely
30 minute 15 minute
Support for 30-minute trolley versus Support for 30-minute trolley versus 15- minute trolley.15- minute trolley.
Question: If trolley service were available every 15 minutes (every 30 minutes) to take you around the island of Chincoteague, how likely would you be to use that service? [Check one]

THE MARKETING SOURCE, INC.
35
Suggested Trolley Suggested Trolley Destinations outside of Destinations outside of Chincoteague IslandChincoteague Island
Those that responded mentioned:Those that responded mentioned:
Assateague BeachAssateague Beach 42%42%
Assateague Island (unspecified)Assateague Island (unspecified) 3434
NASA/Wallops IslandNASA/Wallops Island 1111
Wildlife areas/RefugeWildlife areas/Refuge 8 8
Tom’s Cove Visitors’ CenterTom’s Cove Visitors’ Center 3 3
Question: What destinations, other than the Island of Chincoteague, would you like the trolley to go? Base =175

THE MARKETING SOURCE, INC.
36
Nearly half of visitors say they would Nearly half of visitors say they would likely use additional bike trails/racks likely use additional bike trails/racks or bike lanes adjacent to major or bike lanes adjacent to major thoroughfares. thoroughfares.
13%
7%
16%
17%
14%
8%
15%
18%
46%47%
0% 10% 20% 30% 40% 50% 60%
"1" Not at all likely
"2"
"3"
"4"
"5" Very likely
Bike lanes nearthoroughfares
Additional bikelanes/racks
Question: To what extent would you use additional bike trails and bike racks around Chincoteague (Base = 525) or bike lanes adjacent to the major thoroughfares in Chincoteague (Base = 520) if they were made available to you? Please use a scale of 1 to 5, where “5” is very likely to use and “1” is not at all likely to use.
THE MARKETING SOURCE, INC.
37
5%
7%
16%
37%
57%
0% 20% 40% 60%
Other
Lengthen stay
Visit more often
Would not influenceplans
Would visit center
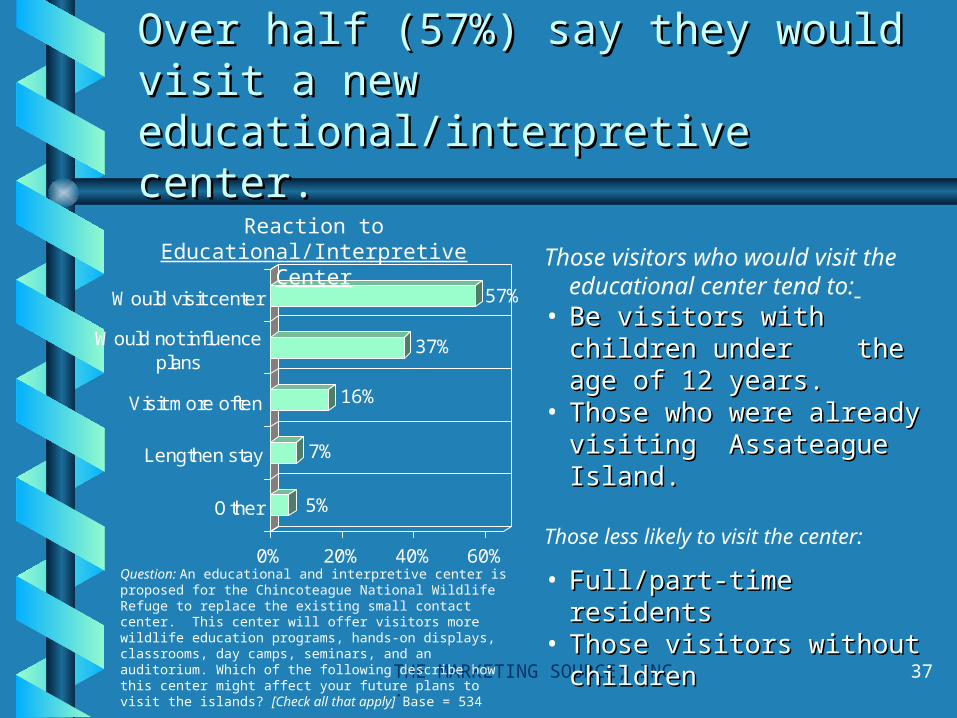
Over half (57%) say they would visit Over half (57%) say they would visit a new educational/interpretive a new educational/interpretive center.center.
Those visitors who would visit the educational center tend to:
• Be visitors with children Be visitors with children under the age of 12 under the age of 12 years. years.
• Those who were already Those who were already visiting Assateague visiting Assateague Island.Island.
Those less likely to visit the center:
• Full/part-time residentsFull/part-time residents• Those visitors without Those visitors without
childrenchildren
Question: An educational and interpretive center is proposed for the Chincoteague National Wildlife Refuge to replace the existing small contact center. This center will offer visitors more wildlife education programs, hands-on displays, classrooms, day camps, seminars, and an auditorium. Which of the following describe how this center might affect your future plans to visit the islands? [Check all that apply] Base = 534
Reaction to Educational/Interpretive
Center
THE MARKETING SOURCE, INC.
38
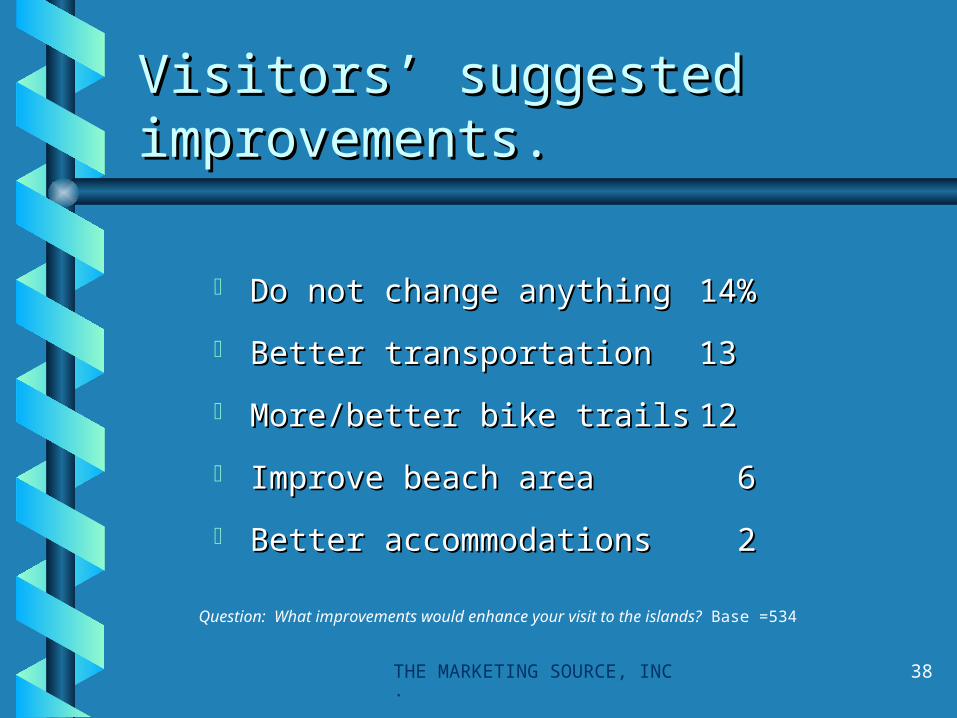
Visitors’ suggested Visitors’ suggested improvements.improvements.
Do not change anythingDo not change anything 14% 14%
Better transportationBetter transportation 13 13
More/better bike trailsMore/better bike trails 1212
Improve beach areaImprove beach area 6 6
Better accommodationsBetter accommodations 2 2
Question: What improvements would enhance your visit to the islands? Base =534

THE MARKETING SOURCE, INC.
39
What do visitors think about Assateague Island?
THE MARKETING SOURCE, INC.
40
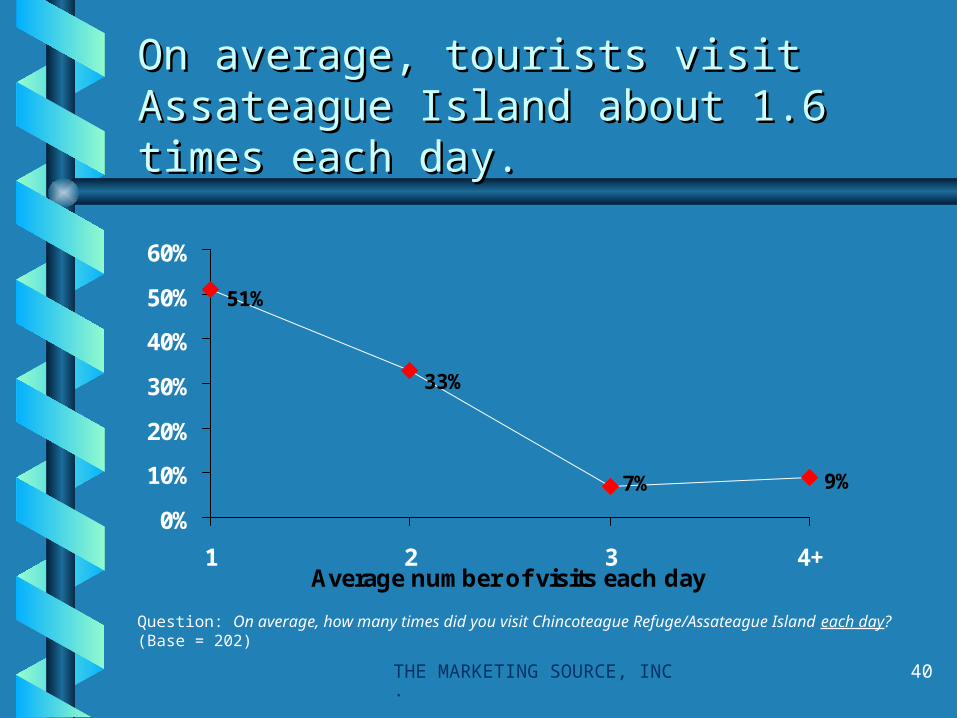
On average, tourists visit On average, tourists visit Assateague Island about 1.6 times Assateague Island about 1.6 times each day.each day.
51%
7% 9%
33%
0%
10%
20%
30%
40%
50%
60%
1 2 3 4+Average number of visits each day
Question: On average, how many times did you visit Chincoteague Refuge/Assateague Island each day? (Base = 202)
THE MARKETING SOURCE, INC.
41
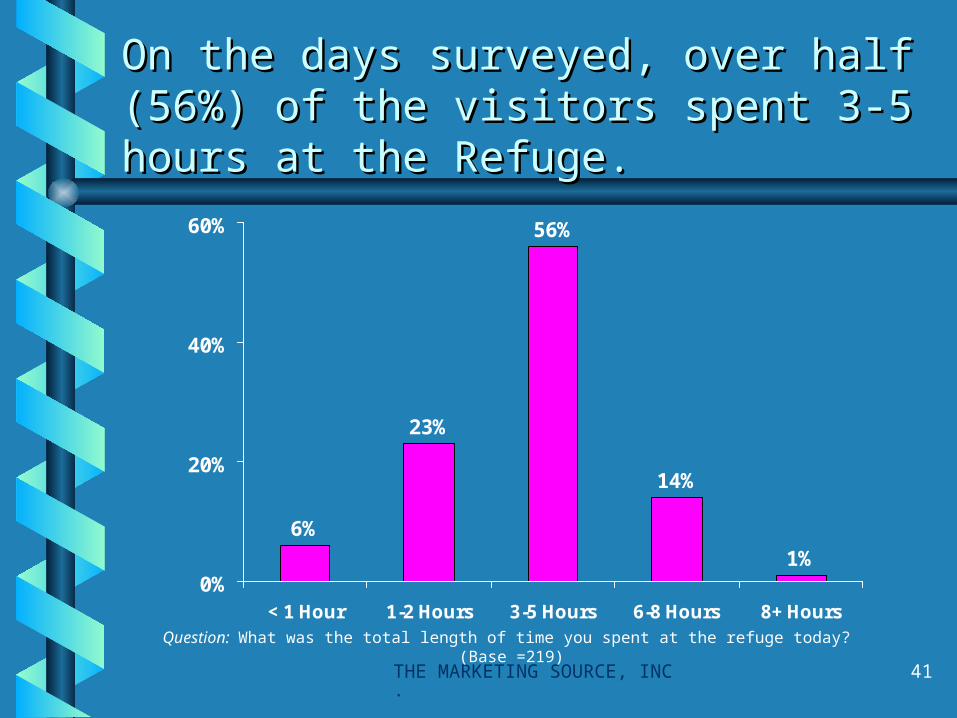
On the days surveyed, over half (56%) On the days surveyed, over half (56%) of the visitors spent 3-5 hours at the of the visitors spent 3-5 hours at the Refuge.Refuge.
6%
23%
56%
14%
1%0%
20%
40%
60%
< 1 Hour 1-2 Hours 3-5 Hours 6-8 Hours 8+ Hours
Question: What was the total length of time you spent at the refuge today? (Base =219)
THE MARKETING SOURCE, INC.
42
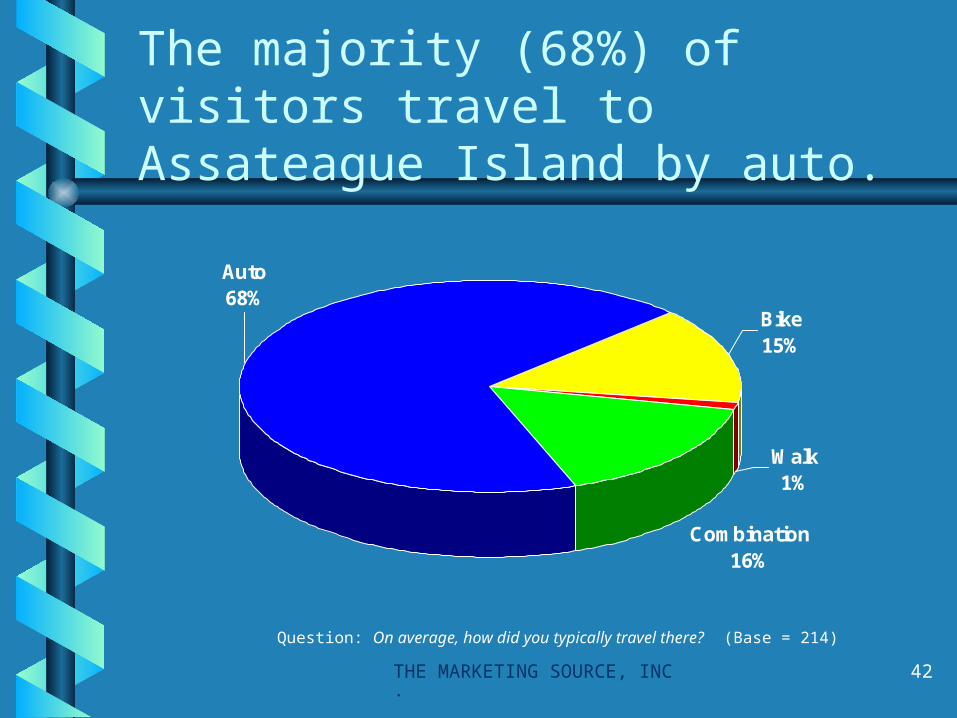
The majority (68%) of visitors travel to Assateague Island by auto.
Walk1%
Combination16%
Auto68%
Bike15%
Question: On average, how did you typically travel there? (Base = 214)

THE MARKETING SOURCE, INC.
43
Most (59%) visitors purchase Most (59%) visitors purchase weekly passes and the majority weekly passes and the majority (89%) believe that the pass price (89%) believe that the pass price is “just right”.is “just right”.
Too low6%
Just Right89%
Too high5%
Question: Do you feel that the price of your entrance pass was too high, too low or just right? Base =213
Reaction to Pass PriceType of pass purchased:
Weekly 59%
Annual 10
Federal Duck Stamp 9
Golden Age 7
Cyclist/Walk-in 4
Golden Eagle 1
Unsure 9
Question: What type of Refuge entrance pass did you use? Base = 220

THE MARKETING SOURCE, INC.
44
““Beaches” and “wildlife observation” Beaches” and “wildlife observation” are the most frequently stated are the most frequently stated reasons why tourists come to the reasons why tourists come to the Assateague. Assateague.
27%
17%
19%
43%
71%
88%
0% 20% 40% 60% 80% 100%
Other
Wildlife programs
Wildlife photography
Biking
Wildlife observation
Beaches
Question: Why did you select Assateague as your vacation destination? (Base = 224; multiple responses)
THE MARKETING SOURCE, INC.
45
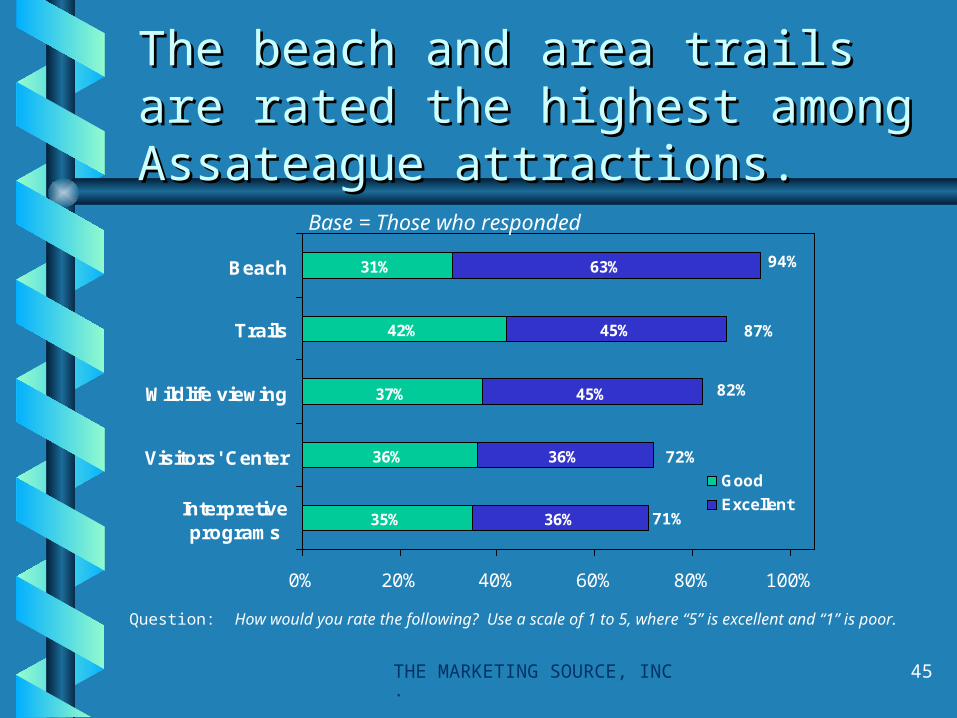
The beach and area trails are The beach and area trails are rated the highest among rated the highest among Assateague attractions.Assateague attractions.
35%
36%
37%
42%
31%
36%
36%
45%
45%
63%
0% 20% 40% 60% 80% 100%
Interpretiveprograms
Visitors' Center
Wildlife viewing
Trails
Beach
Good
Excellent
94%
87%
82%
72%
71%
Question: How would you rate the following? Use a scale of 1 to 5, where “5” is excellent and “1” is poor.
Base = Those who responded
THE MARKETING SOURCE, INC.
46
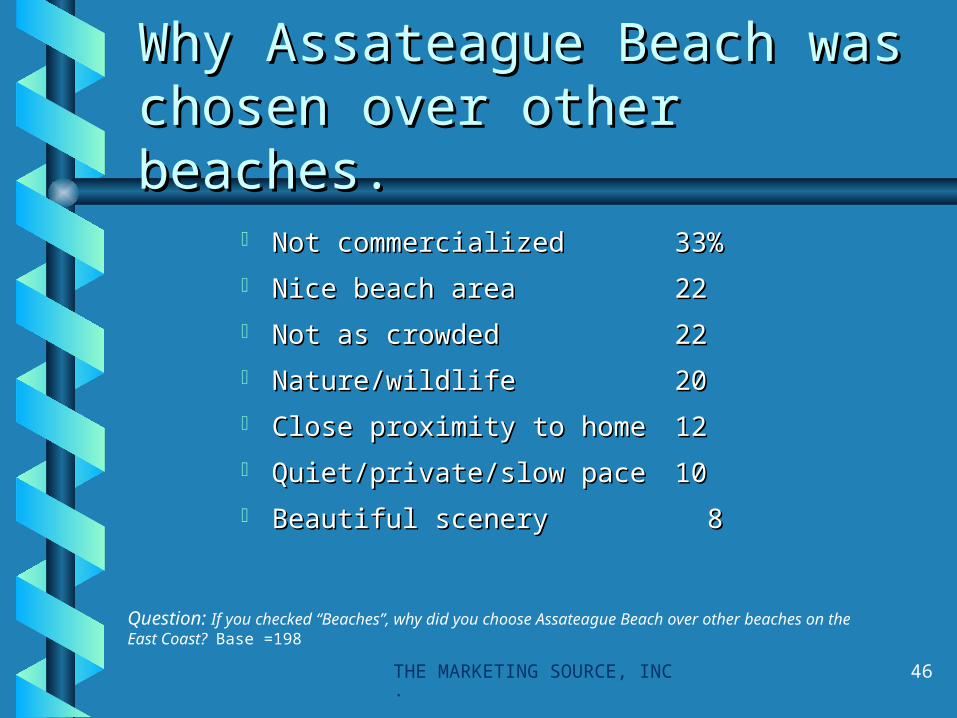
Why Assateague Beach was Why Assateague Beach was chosen over other beaches.chosen over other beaches.
Not commercializedNot commercialized 33%33%
Nice beach areaNice beach area 2222
Not as crowdedNot as crowded 2222
Nature/wildlifeNature/wildlife 2020
Close proximity to homeClose proximity to home 1212
Quiet/private/slow paceQuiet/private/slow pace 1010
Beautiful sceneryBeautiful scenery 8 8
Question: If you checked “Beaches”, why did you choose Assateague Beach over other beaches on the East Coast? Base =198

THE MARKETING SOURCE, INC.
47
Summary Findings: Points of Origin
Assateague tourists are primarily Assateague tourists are primarily traveling from Maryland, Virginia, traveling from Maryland, Virginia, Pennsylvania, and New Jersey.Pennsylvania, and New Jersey.
Approximately 10% of weekday visitors Approximately 10% of weekday visitors and 17% of weekend visitors are and 17% of weekend visitors are residents of the Eastern Shore.residents of the Eastern Shore.
THE MARKETING SOURCE, INC.
48
Summary Findings: Visitation
About one-quarter (24%) of the tourists are About one-quarter (24%) of the tourists are visiting Chincoteague for the first-time. These visiting Chincoteague for the first-time. These visitors are more likely to be staying for visitors are more likely to be staying for shorter periods. shorter periods.
Three-quarters of the tourists are repeat Three-quarters of the tourists are repeat visitors, with many having been at least 4 visitors, with many having been at least 4 times over the past 5 years. times over the past 5 years.
THE MARKETING SOURCE, INC.
49
Summary Findings: Length of Visit
Close to 10% of the island visitors are Close to 10% of the island visitors are stopping off on their way to a primary stopping off on their way to a primary destination.destination.
Only 13% of tourists are visiting for the Only 13% of tourists are visiting for the day only. A third are staying for the day only. A third are staying for the weekend and another third are week-weekend and another third are week-long visitors.long visitors.
THE MARKETING SOURCE, INC.
50
Summary Findings: Composition of Tourists
Although one-third of tourists are traveling Although one-third of tourists are traveling alone or with one other person during their alone or with one other person during their visit, the majority are traveling with children.visit, the majority are traveling with children.
Families with young children (under 12 years) Families with young children (under 12 years) tend to be participating more in outdoor tend to be participating more in outdoor activities. They also are staying longer.activities. They also are staying longer.
Families with young children would likely use Families with young children would likely use new bike trails, bike lanes and they would use new bike trails, bike lanes and they would use a trolley system if made available.a trolley system if made available.
In addition, most families with small children In addition, most families with small children would visit a new educational/interpretive would visit a new educational/interpretive center.center.

THE MARKETING SOURCE, INC.
51
Summary Findings: Activities
The beach and observing wildlife are the The beach and observing wildlife are the most popular activities among tourists, most popular activities among tourists, followed by shopping and dining out on followed by shopping and dining out on Main Street and visiting the Wildlife Refuge.Main Street and visiting the Wildlife Refuge.
Most visitors use their car to travel to these Most visitors use their car to travel to these attractions.attractions.
Biking is most popular to the Wildlife Biking is most popular to the Wildlife Refuge, to Tom’s Cove and shopping and Refuge, to Tom’s Cove and shopping and dining on Maddox Blvd.dining on Maddox Blvd.

THE MARKETING SOURCE, INC.
52
Summary Findings: Perceived traffic and parking problems
Few people noted problems on the Few people noted problems on the weekday. But about a third categorize weekday. But about a third categorize traffic congestion as a “problem” on traffic congestion as a “problem” on the weekend.the weekend.
A similar pattern was found for A similar pattern was found for perceived parking problems. perceived parking problems. Respondents particularly noted Respondents particularly noted weekend parking problems on Main St. weekend parking problems on Main St. and Maddox St. and Maddox St.

THE MARKETING SOURCE, INC.
53
Summary Findings: Perceived traffic and parking problems
.. Over half of the tourists polled say they would consider using trolley service. Many would like to see the trolley go to Assateague Island, specifically the beach area.
Tourists with young children and first time visitors and more likely to use a trolley system, while seasoned visitors (4+times in 5 years) and older visitors are less likely to use a trolley system.
About a third say they would visit the downtown area more often if it were pedestrian-friendly.
The majority support additional bike trails/racks and bike lanes adjacent to major thoroughfares.
54
Summary Findings: Perceived traffic and parking problems
Most (57%) would visit a new Most (57%) would visit a new interpretive and educational center. interpretive and educational center. Groups with children under 12 years Groups with children under 12 years would be more likely to visit while would be more likely to visit while fulltime/part-time residents were less fulltime/part-time residents were less likely to visit a new center.likely to visit a new center.

55
Summary Findings: Assateague Island
Like Chincoteague visitors, Assateague Like Chincoteague visitors, Assateague Island tourists are most likely to be repeat Island tourists are most likely to be repeat visitors.visitors.
Cars (68%) are the main mode of Cars (68%) are the main mode of transportation used by tourists to travel transportation used by tourists to travel to Assateague. Biking (15%) is the next to Assateague. Biking (15%) is the next most popular mode of travel used.most popular mode of travel used.
Tourists are visiting Assateague Island Tourists are visiting Assateague Island multiple times each day (1.6 times ).multiple times each day (1.6 times ).

THE MARKETING SOURCE, INC.
56
Summary Findings: Assateague Island
Over half of Assateague Island visitors Over half of Assateague Island visitors spent 3-5 hours at the refuge.spent 3-5 hours at the refuge.
Most visitors to Assateague purchase a Most visitors to Assateague purchase a weekly pass. In addition, most feel weekly pass. In addition, most feel that the entrance fee is fairly priced.that the entrance fee is fairly priced.
The beaches , wildlife and biking are The beaches , wildlife and biking are the most popular activities on the most popular activities on Assateague Island.Assateague Island.
THE MARKETING SOURCE, INC.
57
Summary Findings: Assateague Island
Visitors chose Assateague as their Visitors chose Assateague as their vacation destination over other vacation destination over other beaches because the beach was not beaches because the beach was not commercialized and crowded. In commercialized and crowded. In addition, they also mentioned that addition, they also mentioned that wildlife was an appealing attribute of wildlife was an appealing attribute of the island.the island.