China's WTO Accession and Its Trade with the Southeast Asian ...
44
China’s WTO Accession and Its Trade with the Southeast Asian Economies by Kar-yiu Wong University of Washington ([email protected] , http://faculty.washington.edu/karyiu/ ) December 15, 2003 (Preliminary. Please do not quote.)
Transcript of China's WTO Accession and Its Trade with the Southeast Asian ...
China’s WTO Accession and Its Trade with the Southeast Asian Economies
by
Kar-yiu Wong
University of Washington
([email protected], http://faculty.washington.edu/karyiu/)
December 15, 2003 (Preliminary. Please do not quote.)
1
1. Introduction After 15 years of hard working, China eventually gained entrance into the World Trade Organization (WTO) in November 2001. To get final approval from members of this organization, China has agreed to liberalize its foreign trade and reduce many of its restrictions on foreign direct investment. A summary of trade liberalization China has agreed to do in the near future is given below:1 (a) Reduction of the average import tariff from 24.6 to 9.4 per cent:
• from 22 to 17.5 per cent for agricultural products; elimination of subsidies for exports of agricultural exports;
• From 25 to 8.9 per cent for industrial products; from 100 to 25 per cent for
vehicles and 10 per cent for vehicle parts by 2006 and from 12.5 to 3.4 per cent (2002) and zero (2005) for information technology products;
(b) Farm subsidies to be capped at 8.5 of production value; (c) Elimination of import tariffs on computers, semiconductors and other high-tech
products by 2005; (d) Elimination of quotas by 2006; (e) Substantial opening of service sectors, including banking, insurance, telecommuni-
cations and professional services:
• Up to 49 per cent foreign ownership in telecommunications and insurance after three years;
• Importers to have own distribution networks;
• Full market access for foreign banks within five years (currency business with
local enterprises after two years). Because of the extent of the trade liberalization to be implemented within a short time, because of the size of China’s economy, and probably also because of the recent spectacular growth of China’s economy, it is expected that trade liberalization by China will have significant impacts on China’s economy and the economies of many other countries. Members of the Association of Southeast Asian Nations (ASEAN), many of which share common borders with China, are paying much attention to the growth of the Chinese economy and the changes in trade policies the Chinese government has to implement as a condition for its accession to the WTO. How their economies will be affected is a big and hot issue that they want to find out.
1 For more details, read Magarinos and Sercovich (2002).
2
While it is recognized that different countries, different industries, and different individuals will be affected in different ways by China’s accession to the WTO, there are some concerns among many people in the ASEAN countries that they could be hurt by trade liberalization of China. It is worried that China may become too competitive that ASEAN will lose market shares in the rest of the world. Such a worry is based on the following assumptions:
(a) The economies of China and ASEAN are similar, with similar factor endowments and technology levels.
(b) China and ASEAN export similar products.
(c) China and ASEAN export their products to similar markets.
(d) China has a competitive edge due to its lower labor costs. In this paper, we try to assess this argument and these arguments, and we want to analyze the trade relations between China and some of these ASEAN countries. An examination of these assumptions will allow us to have an idea of how valid such worries are, and analyzing the trade relations between China and the ASEAN members will give us a better picture of how these countries depend on each other, how they may be affected by China’s accession to the WTO, and what their governments may do to enhance the welfare of their economies. Section 2 of this paper examines the competition between Chinese and ASEAN products in the rest of the world. We will try to see how valid the above arguments are. In section 3, we will examine mutual trade between China and five of the larger ASEAN economies: Indonesia, Malaysia, the Philippines, Singapore, and Thailand. In particular, we will examine the intra-industry trade between China and each of these five countries. Section 4 examines the implications of mutual trade between China and these five economies. The last section provides some concluding remarks. 2. Competition between Chinese and Southeast Asian Products
in Third Markets China’s accession to the WTO and the resulting diminishing restrictions on import of many foreign products has created a lot of concerns to some countries such as Southeast Asian countries. There are worries that as a new member of the WTO, China will be able to export more products to the rest of the world, and these products compete directly with the products from Southeast Asia. These worries are based on the following propositions: (a) Trade liberalization allows China to allocate more of its resources in the exportable
sectors, leading to expansion of its exports. (b) China and many of these Asian countries export similar products. (c) China and many of these Asian countries compete in similar markets.

3
(d) The labor costs in China are lower, making the Chinese products competitive (or too
competitive) in the third markets. Let us examine these worries and the four propositions. 2.1 Trade Liberalization and Expansion of Export Sectors Proposition (a) can be explained in terms of the textbook two-country, two-good neoclassical framework, in which it has been shown that when a country liberalizes its import, its offer curve shifts out and will lead to an increase in its export. In such a framework, the validity of proposition (a) can be supported. In fact, this result is quite robust because it does not depend on the elasticity of the other country’s import demand.2 Such a framework, however, is not appropriate for analyzing the present issue because the concerns of these Asian countries are about the competition between their products and Chinese products in other markets. To provide a more fruitful analysis, a framework with at least three countries is needed. A recent attempt is provided in a related paper of mine (Wong, 2003). I analyze theoretically possible interactions among three countries, with two of them have products competing in a third country. I show that if one of the exporting countries (such as China) liberalizes its import, its export to the third country may go up or down. Although this impact on trade is ambiguous, the paper does have derived conditions under which the country would choose to export more to the third country. Without more empirical work and data, it is in fact not easy to predict how the volumes of China exports may change as China lessens its restrictions on import of foreign products. In particular, in a multi-product framework, it is very difficult to say for sure whether China will export more or less of any of its products to the rest of the world. It is, however, the general belief that China tends to export more to the rest of the world when it allows freer trade, as required by the conditions for its accession to the WTO. 2.2 Commodity Overlap Propositions (b) and (c), which are widely received in many people in Asian countries, had led to the wide-spread belief that trade liberalization by China could cause threats to many other Asian economies. Let us now analyze these two propositions carefully. It is believed that China and most members ASEAN economies have similar factor endowments. They are labor-abundant countries relative to the rest of the world, and
2 As a matter of fact, if the import demand of the other country is inelastic, the first county will lower its
import.
4
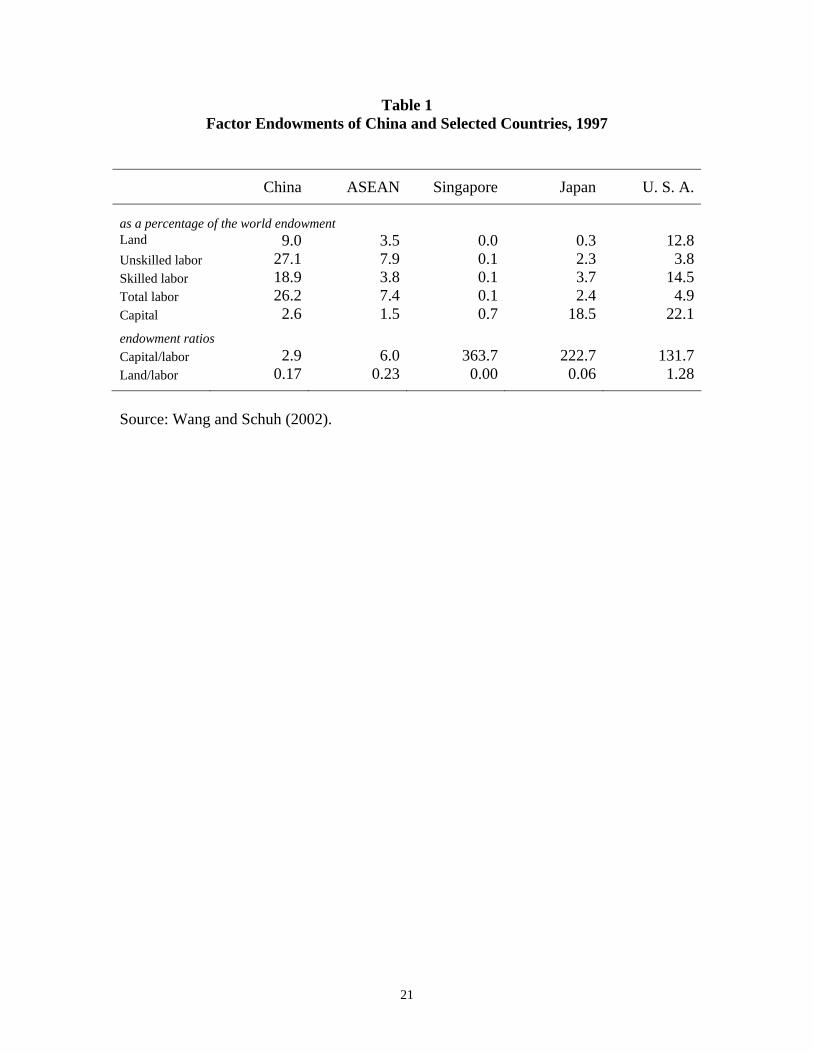
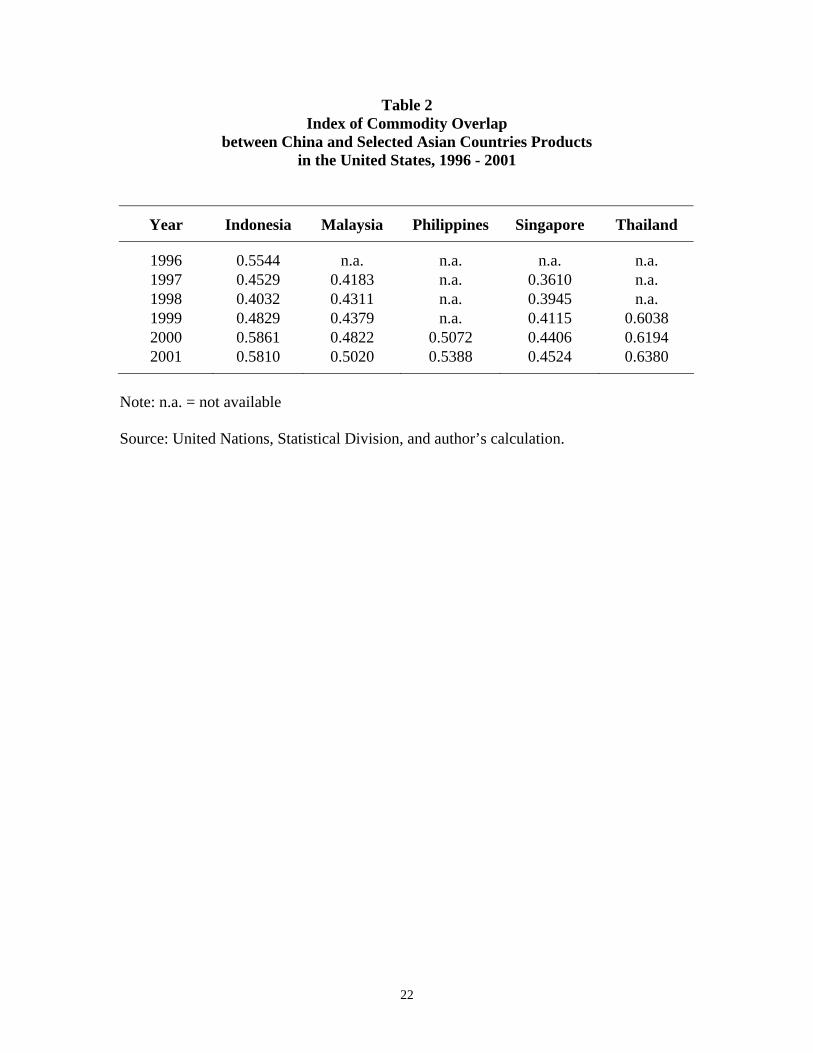
according to the Heckscher-Ohlin Theorem, they are expected to export mainly labor-intensive goods;3 for example, textiles, clothing, shoes, toys, and so on. Table 1 shows the factor endowments of China and some ASEAN countries in 1997. It is clear from the table that while China is bigger than all ASEAN members combined at least in terms of the size of the labor force, all these countries have remarkably similar factor endowment ratios such as capital-labor and land-labor ratios. For comparison purpose, the factor endowments of Singapore (one of the members of ASEAN), Japan, and the U. S. are also presented. It is shown that the latter three countries have much higher capital-labor ratios. In particular, despite being one of the ASEAN members, Singapore has a capital-labor ratio nearly three times as high as that of the U. S. Like Japan, Singapore has very low land-labor ratios. As a result, in terms of factor endowments, Singapore is closer to Japan but less so to other ASEAN countries, while China and the rest of the ASEAN countries have very similar factor endowment ratios. Since both China and ASEAN as a whole are labor abundant, traditional trade theory predicts that these countries export labor-intensive products, and the theory undoubtedly suggests that products from China will compete heavily with products from ASEAN countries. To examine whether the traditional trade theory is consistent with the observed data, i.e., whether China products do compete heavily with ASEAN products in the rest of the world, we measure how similar the exports from these countries are. We collect the two-digit exports to the United States from China and the following five Asian countries: Indonesia, Malaysia, the Philippines, Singapore, and Thailand.4 An index of commodity overlap between the exports of countries A and B to country C is then defined as follows:
112
C k kAB A B
kI s s= − −∑ , (1)
where k
is is the share of good k in country’s i’s export to country C. It is noted that CABI
lies between zero and one, and a higher index means a higher degree of commodity overlap between the products from the two countries.5 We calculate the indices of commodity overlap between the products from China and those from each of these ASEAN members to the United States from 1996 to 2001. The result is shown in Table 2. The degree of overlap ranges from 0.36 to 0.63. It is noted that China’s exports overlap the least with Singapore’s exports, which is not surprising as Singapore has been shown to be very capital abundant. The degrees of overlap between the exports from China with the exports from the other ASEAN countries were high, with the indices for these countries being more than 0.5 in 2001. It is expected to certain extent
3 The theory is explained in virtually all international trade texts and theory books. See, for example,
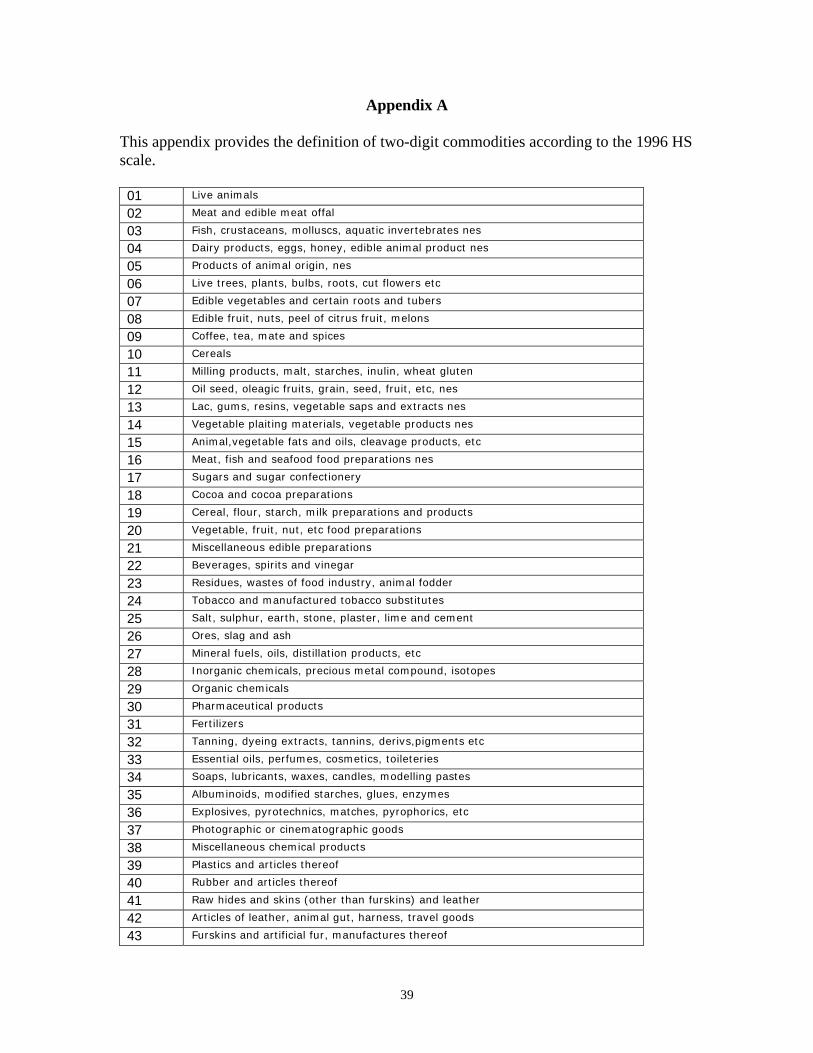
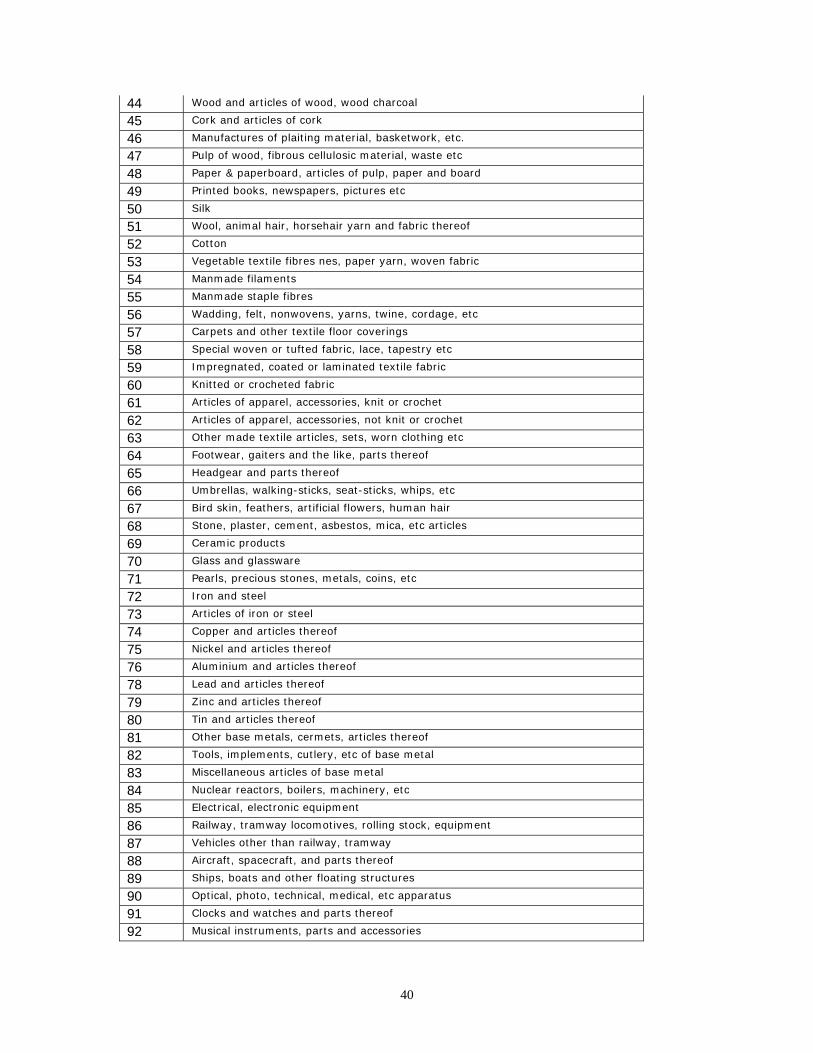
Wong (1995) as a reference. 4 For the names of these two-digit industries, see Appendix A. 5 For more details of this index, see Appendix B.
5
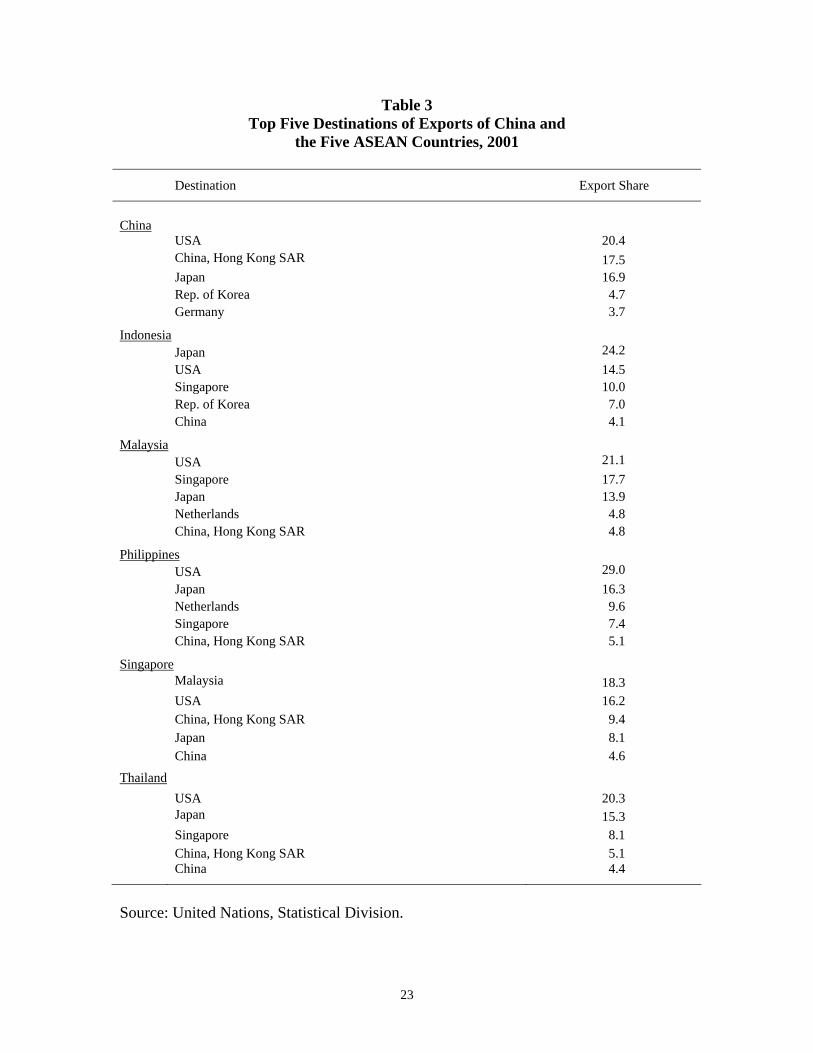
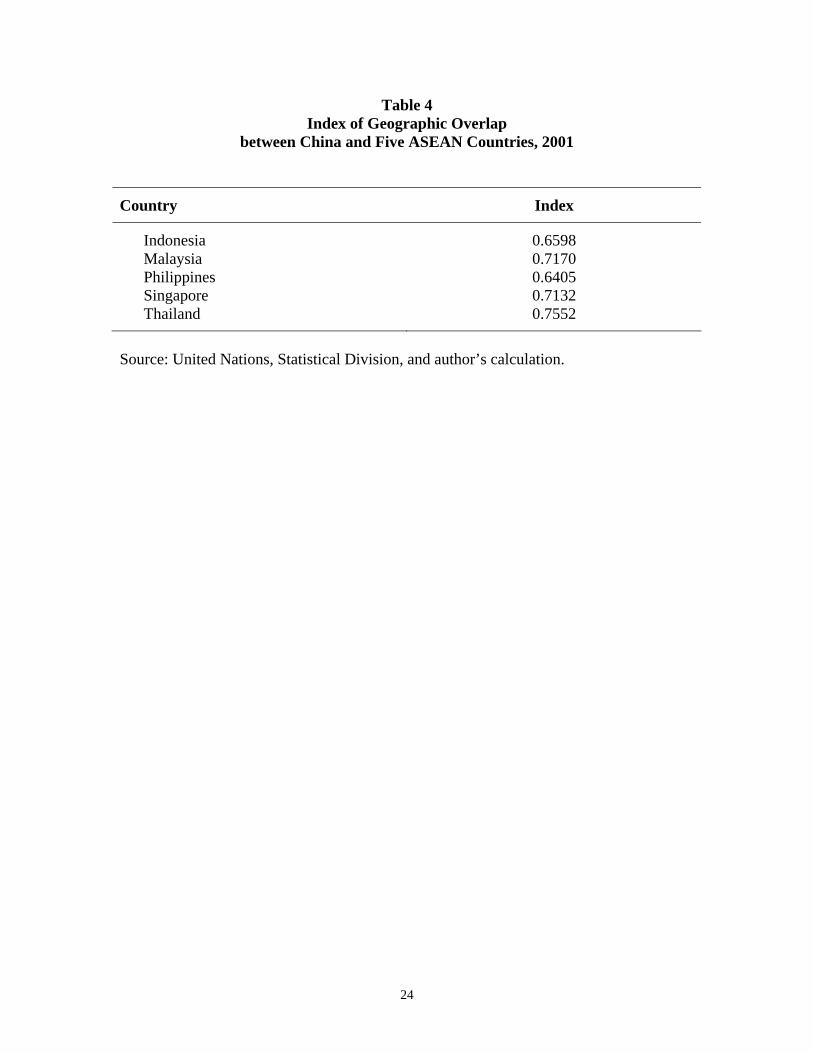
that China’s exports overlap the most with Thailand’s exports, with indices being more than 0.6 in 1999 to 2001. The table reveals one more feature: The index of commodity overlap between China and each of these Asian countries is generally rising over time during the considered period. In fact, the indices for Malaysia, Philippines, Singapore, and Thailand are strictly rising during this period. The index for Indonesia fell from 1996 to 1998, but then it rose to more than 0.58 in 2000 and 2001. How can we explain this phenomenon? One possible explanation is that China started as a very labor-abundant country as compared with the ASEAN countries.6 Since then, the capital stock inside the economy rose rapidly, through domestic saving and foreign direct investment. As its capital-labor ratio increased, it got more competitive in exporting capital-intensive products, and competed more with the products from these Asian countries. 2.3 Geographic Overlap We next turn to the geographic competition of the products from China and these five Asian countries. Table 3 lists the top five destinations of the products from these Asian countries in 2001. There is a high degree of overlap. The US and Japan are top buyers of the products from these countries. As a matter of fact, except for Singapore, the US and Japan are two of the top three importers of the products of China and these Asian countries. For all these countries, the top two importers of each of these countries accounted for nearly or even more than 40 percent of the country’s exports, or if the top three importers are considered, then the figure goes up to nearly or over 50 percent. This shows that the exports of these countries are highly concentrated on a few markets. Another interesting feature is that Hong Kong is one of the top five buyers of the products from China, Malaysia, the Philippines, Singapore, and Thailand. Table 3 gives only a partial picture of the degree of competition between China’s exports and those of each of the five ASEAN countries because how they compete in other markets has not been included. In order to have a fuller picture, we define the Index of Geographic Overlap between countries A (China) and B (any of these five Asian countries) as follows:
112
gAB Aj Bj
j
I s s= − −∑ , (2)
where ijs is the share of country i’s export to country j, i = A, B. This index covers all the countries that these countries export their products to. However, we focus on the degree of overlap of their exports in the rest of the world; i.e., the mutual trade among these six countries are excluded in the calculation. The index ranges between zero and one, and a higher value represents a higher degree of geographical overlap.
6 China opened its economy to foreign trade at the end of 1970s, after keeping the economy basically
closed for many years.
6
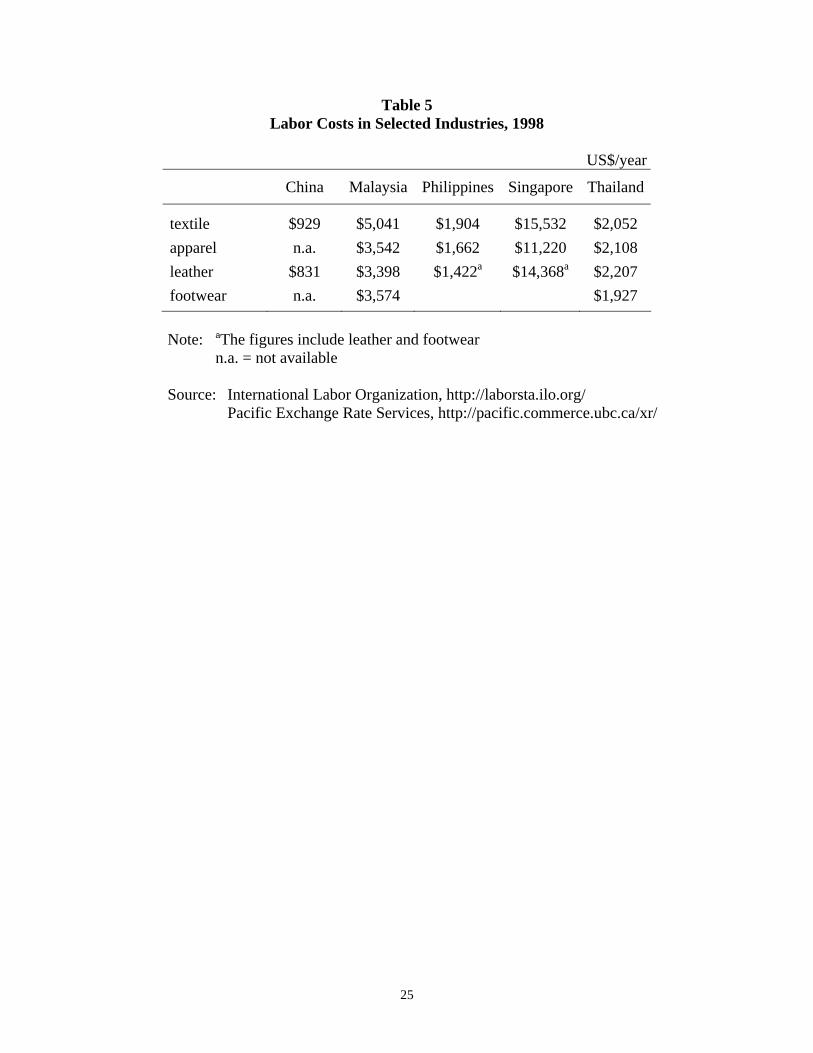
Table 4 gives the index of geographic overlap for the exports of China with those of these five countries in 2001. These figures show high degree of geographic overlap for these exports, all with indices of over 60 percent. The index is especially higher between China’s exports and Thailand’s exports, with a value of 75.5 percent. These tables show that the exports of China and those of the five ASEANs countries overlap to certain degrees in terms of the goods and geographic locations of their markets. However, is the overlap serious? We note that the indices of commodity overlap are generally around 50 to 55 percent, while those of geographic overlap are higher, around 70 percent. This means that even though they depend on similar markets, they are selling somewhat different products to these markets. As a matter of fact, the indices of commodity overlap seem to suggest that even though it is generally regarded that these countries are labor-abundant countries, their exports are not as similar as one may think. There are actually enough of differences among their products so that they may be able to expand their market shares not necessarily at each other’s expense. 2.4 Labor Costs The major worry about China’s exports and their competitiveness in the world markets probably comes from the presumption that China has lower labor costs (Proposition (d)). To see whether this presumption is true, we present the labor costs in some labor-intensive industries in China, Malaysia, Philippines, Singapore, and Thailand in 1998 in Table 5.7 The table gives the labor costs in the following industries in these countries: textile, apparel, leather, and footwear in 1998.8 The table shows that China has labor costs in these industries much lower than those in the Philippines, Malaysia, Thailand and Singapore. At least for these four ASEAN countries, China does seem to have a competitive edge in these products in the rest of the world. The table, however, does not show the figures for other ASEAN countries such as Cambodia, Lao, Viet Nam, and Myanmar. These countries are at earlier stages of development than China, and it is quite possible, and is thus believed, that they have labor costs even lower than those of China. Perhaps future research will reveal more information. 7 Labor cost is the cost incurred by the employer in the employment of labor. The statistical concept of
labor cost comprises remuneration for work performed, payments in respect of time paid for but not worked, bonuses and gratuities, the cost of food, drink and other payments in kind, cost of workers’ housing borne by employers, employers’ social security expenditures, cost to the employer for vocational training, welfare services and miscellaneous items, such as transport of workers, work clothes and recruitment, together with taxes regarded as labor cost.
8 For the Philippines and Singapore, the leather industry includes the footwear industry. This is due to the use of different ISIC systems for these two countries. See the web site of the International Labor Organization for more details. The data for other ASEAN countries are not available, and 1998 is the latest years in which the data for all these countries are available.
7
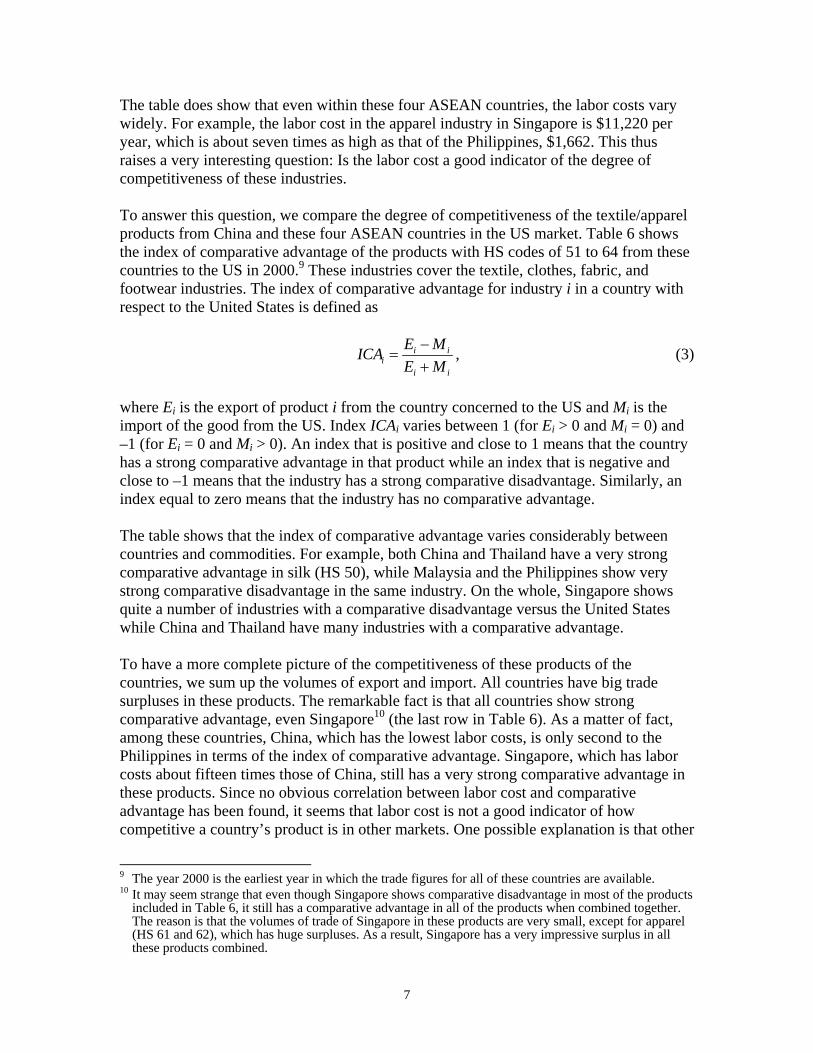
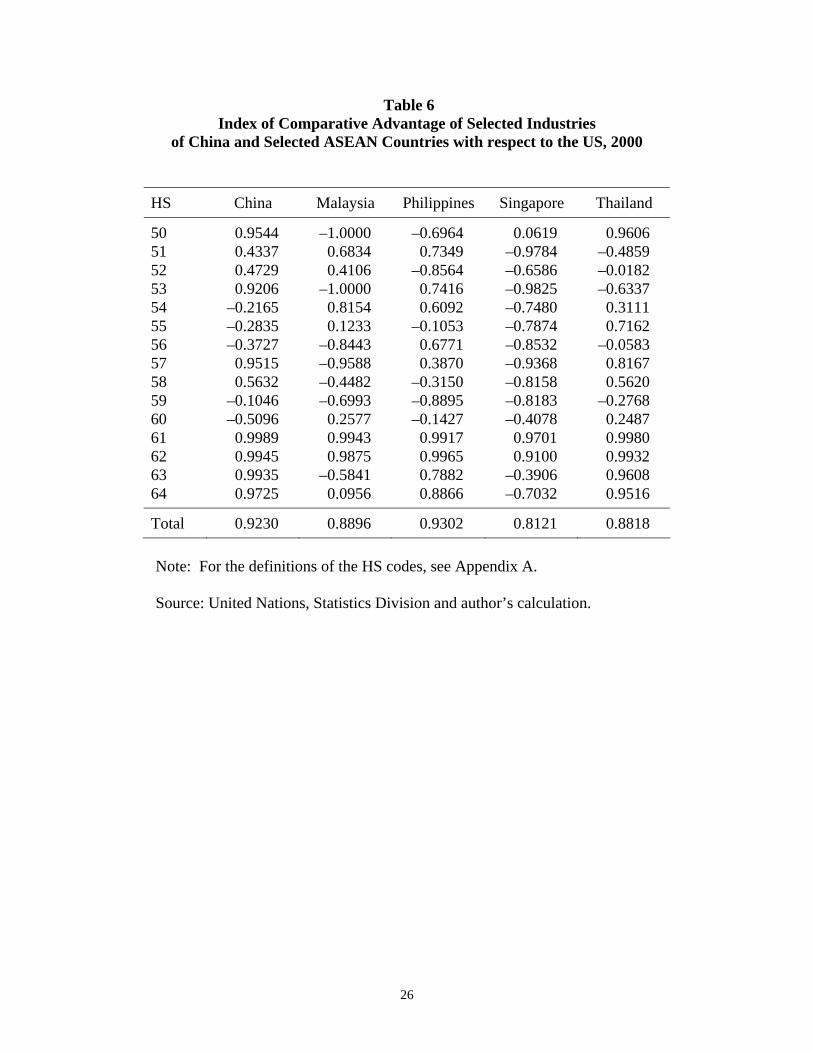
The table does show that even within these four ASEAN countries, the labor costs vary widely. For example, the labor cost in the apparel industry in Singapore is $11,220 per year, which is about seven times as high as that of the Philippines, $1,662. This thus raises a very interesting question: Is the labor cost a good indicator of the degree of competitiveness of these industries. To answer this question, we compare the degree of competitiveness of the textile/apparel products from China and these four ASEAN countries in the US market. Table 6 shows the index of comparative advantage of the products with HS codes of 51 to 64 from these countries to the US in 2000.9 These industries cover the textile, clothes, fabric, and footwear industries. The index of comparative advantage for industry i in a country with respect to the United States is defined as
i ii
i i
E MICAE M−
=+
, (3)
where Ei is the export of product i from the country concerned to the US and Mi is the import of the good from the US. Index ICAi varies between 1 (for Ei > 0 and Mi = 0) and –1 (for Ei = 0 and Mi > 0). An index that is positive and close to 1 means that the country has a strong comparative advantage in that product while an index that is negative and close to –1 means that the industry has a strong comparative disadvantage. Similarly, an index equal to zero means that the industry has no comparative advantage. The table shows that the index of comparative advantage varies considerably between countries and commodities. For example, both China and Thailand have a very strong comparative advantage in silk (HS 50), while Malaysia and the Philippines show very strong comparative disadvantage in the same industry. On the whole, Singapore shows quite a number of industries with a comparative disadvantage versus the United States while China and Thailand have many industries with a comparative advantage. To have a more complete picture of the competitiveness of these products of the countries, we sum up the volumes of export and import. All countries have big trade surpluses in these products. The remarkable fact is that all countries show strong comparative advantage, even Singapore10 (the last row in Table 6). As a matter of fact, among these countries, China, which has the lowest labor costs, is only second to the Philippines in terms of the index of comparative advantage. Singapore, which has labor costs about fifteen times those of China, still has a very strong comparative advantage in these products. Since no obvious correlation between labor cost and comparative advantage has been found, it seems that labor cost is not a good indicator of how competitive a country’s product is in other markets. One possible explanation is that other
9 The year 2000 is the earliest year in which the trade figures for all of these countries are available. 10 It may seem strange that even though Singapore shows comparative disadvantage in most of the products
included in Table 6, it still has a comparative advantage in all of the products when combined together. The reason is that the volumes of trade of Singapore in these products are very small, except for apparel (HS 61 and 62), which has huge surpluses. As a result, Singapore has a very impressive surplus in all these products combined.

8
factors such as capital costs and also the skill levels of labor are also important in determining how well a product can be sold in other markets. It is also possible that a country with a higher labor cost can remain competitive by offering products with a higher quality. 3. Mutual Trade between China and Southeast Asian
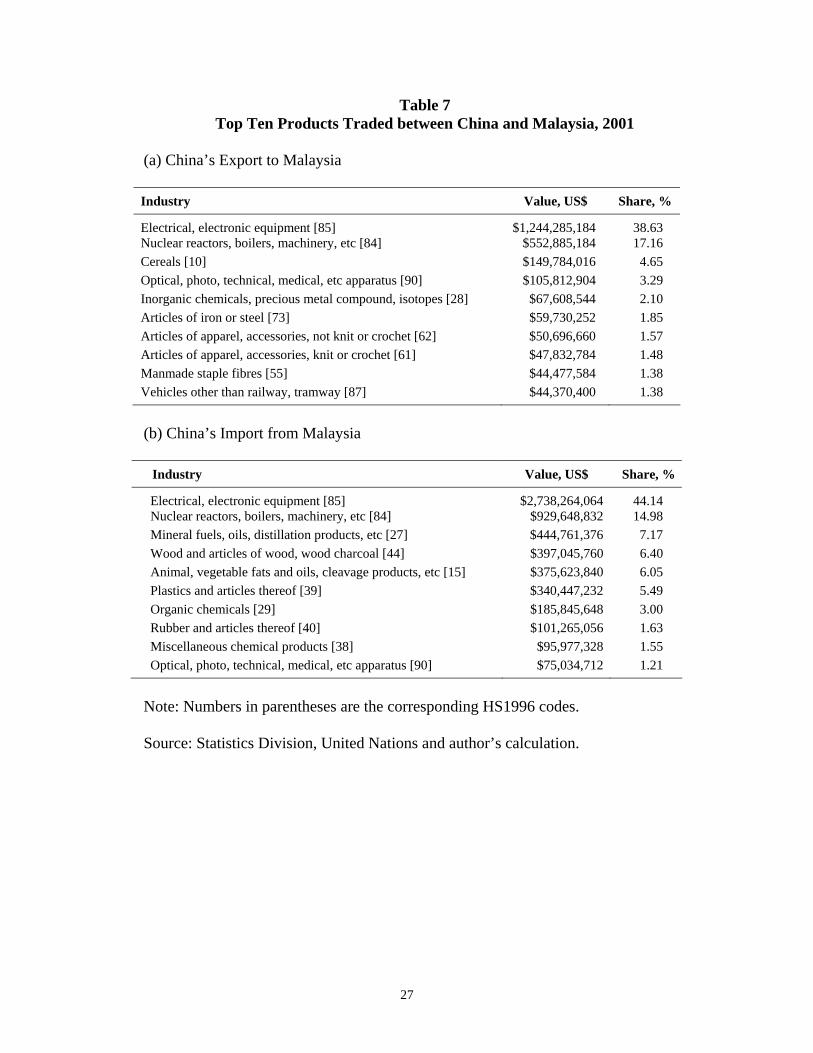
Countries Focus is usually given to the competition between Chinese products and products from ASEAN in the rest of the world. Thus there have been concerns that ASEAN products may lose out in the world markets when there is a surge in the Chinese exports. We argued that not enough of evidence has been found to support this “competitiveness” view. Furthermore, this view may have diverted people’s attention from mutual trade between China and ASEAN, where an increase in mutual trade may benefit all the countries. In this section, we examine the following types of trade between China and each of the five ASEAN: Indonesia, Malaysia, Philippines, Singapore, and Thailand, We will analyze both inter-industry trade and intra-industry trade. 3.1 Trade between China and Malaysia It is not too obvious that China and Malaysia are important trading partners of each other, but data suggest that they are. In 2001, Malaysia was China’s 13th largest market for its products (1.21 percent of the total export), or the eighth largest supplier of China’s imports (2.55 percent of the total import). For Malaysia, China was the sixth largest market (4.53 percent) and the fourth largest supplier (5.40 percent). Table 7 shows major products that are traded between China and Malaysia. In 2001, nearly 40 percent of China’s export to Malaysia was “Electrical, electronic equipment,” and more than 17 percent of the export was “Nuclear reactors, boilers, machinery, etc.” All other eight products included in the list were manufacturing products, except “Cereals”. Interestingly, Malaysia’s two major exports to China were also “Electrical, electronic equipment” (44 percent) and “Nuclear reactors, boilers, machinery, etc” (14.98 percent). Malaysia did export some agricultural and natural resources products to China, such as “Mineral fuels, oils, distillation products, etc” (7.17 percent) and “Wood and articles of wood, wood charcoal” (6.40 percent). Trade between China and Malaysia is partly consistent with the factor-endowment theory of international trade. For example, since it is believed that China is more labor abundant than Malaysia is, it is not surprising to note that China exports apparel (HS 61 and 62) to Malaysia. Similarly, Malaysia is regarded as a country abundant in natural resources, and its exports of mineral fuels and wood products are thus consistent with the theory.
9
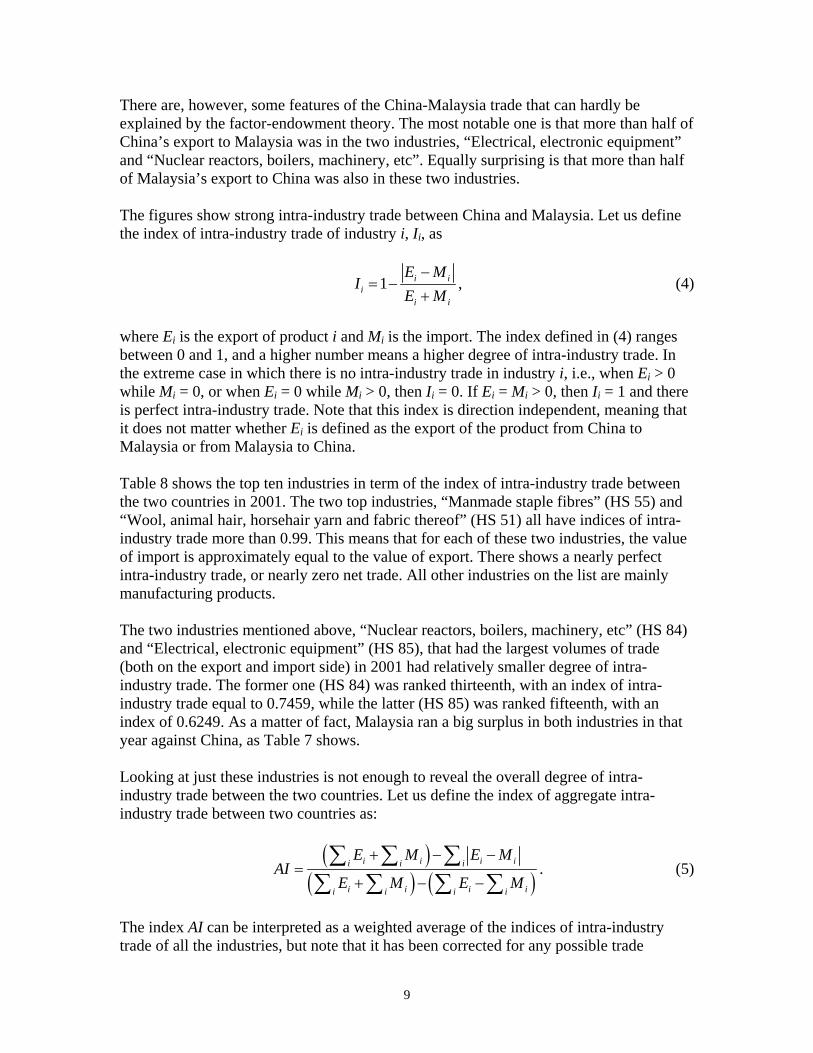
There are, however, some features of the China-Malaysia trade that can hardly be explained by the factor-endowment theory. The most notable one is that more than half of China’s export to Malaysia was in the two industries, “Electrical, electronic equipment” and “Nuclear reactors, boilers, machinery, etc”. Equally surprising is that more than half of Malaysia’s export to China was also in these two industries. The figures show strong intra-industry trade between China and Malaysia. Let us define the index of intra-industry trade of industry i, Ii, as
1 i ii
i i
E MI
E M−
= −+
, (4)
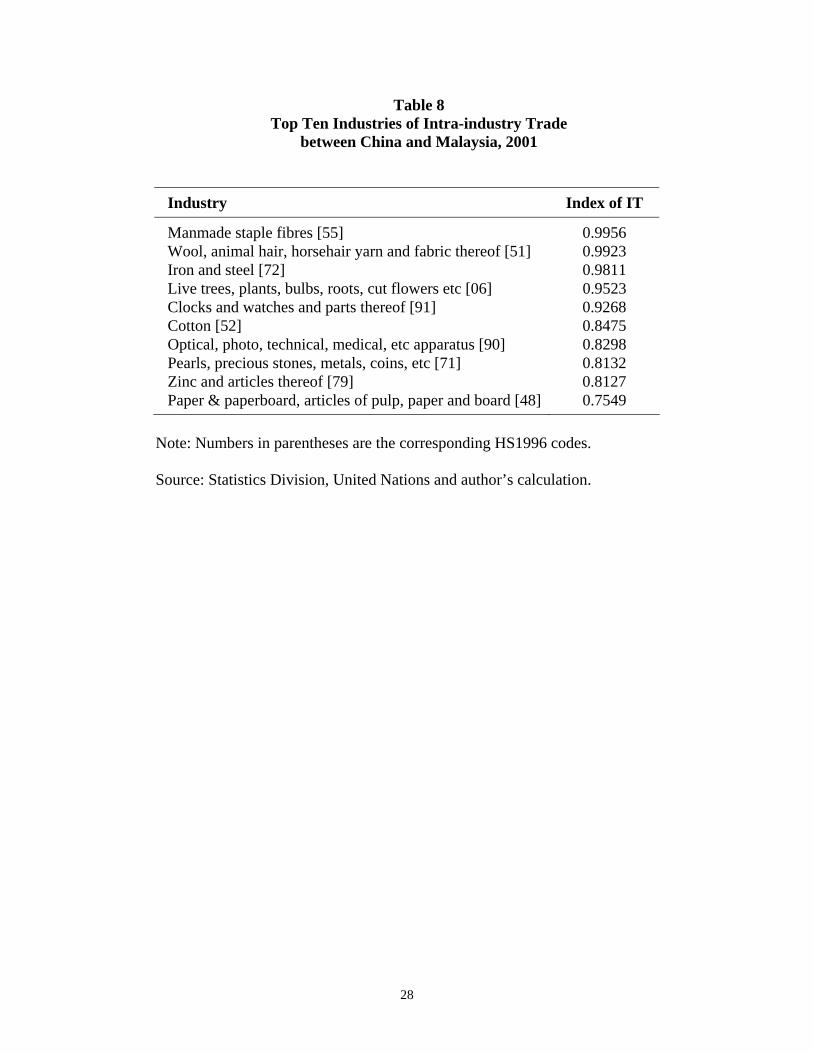
where Ei is the export of product i and Mi is the import. The index defined in (4) ranges between 0 and 1, and a higher number means a higher degree of intra-industry trade. In the extreme case in which there is no intra-industry trade in industry i, i.e., when Ei > 0 while Mi = 0, or when Ei = 0 while Mi > 0, then Ii = 0. If Ei = Mi > 0, then Ii = 1 and there is perfect intra-industry trade. Note that this index is direction independent, meaning that it does not matter whether Ei is defined as the export of the product from China to Malaysia or from Malaysia to China. Table 8 shows the top ten industries in term of the index of intra-industry trade between the two countries in 2001. The two top industries, “Manmade staple fibres” (HS 55) and “Wool, animal hair, horsehair yarn and fabric thereof” (HS 51) all have indices of intra-industry trade more than 0.99. This means that for each of these two industries, the value of import is approximately equal to the value of export. There shows a nearly perfect intra-industry trade, or nearly zero net trade. All other industries on the list are mainly manufacturing products. The two industries mentioned above, “Nuclear reactors, boilers, machinery, etc” (HS 84) and “Electrical, electronic equipment” (HS 85), that had the largest volumes of trade (both on the export and import side) in 2001 had relatively smaller degree of intra-industry trade. The former one (HS 84) was ranked thirteenth, with an index of intra-industry trade equal to 0.7459, while the latter (HS 85) was ranked fifteenth, with an index of 0.6249. As a matter of fact, Malaysia ran a big surplus in both industries in that year against China, as Table 7 shows. Looking at just these industries is not enough to reveal the overall degree of intra-industry trade between the two countries. Let us define the index of aggregate intra-industry trade between two countries as:
( )
( ) ( )i i i ii i i
i i i ii i i i
E M E MAI
E M E M
+ − −=
+ − −
∑ ∑ ∑∑ ∑ ∑ ∑
. (5)
The index AI can be interpreted as a weighted average of the indices of intra-industry trade of all the industries, but note that it has been corrected for any possible trade

10
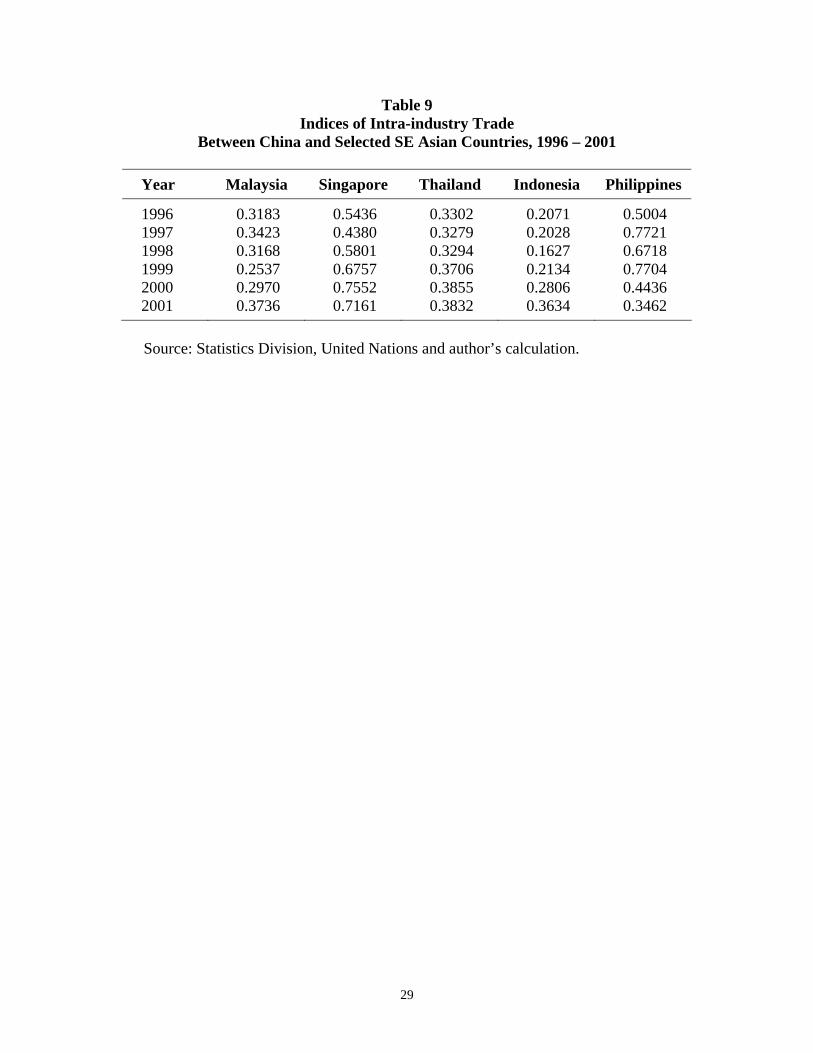
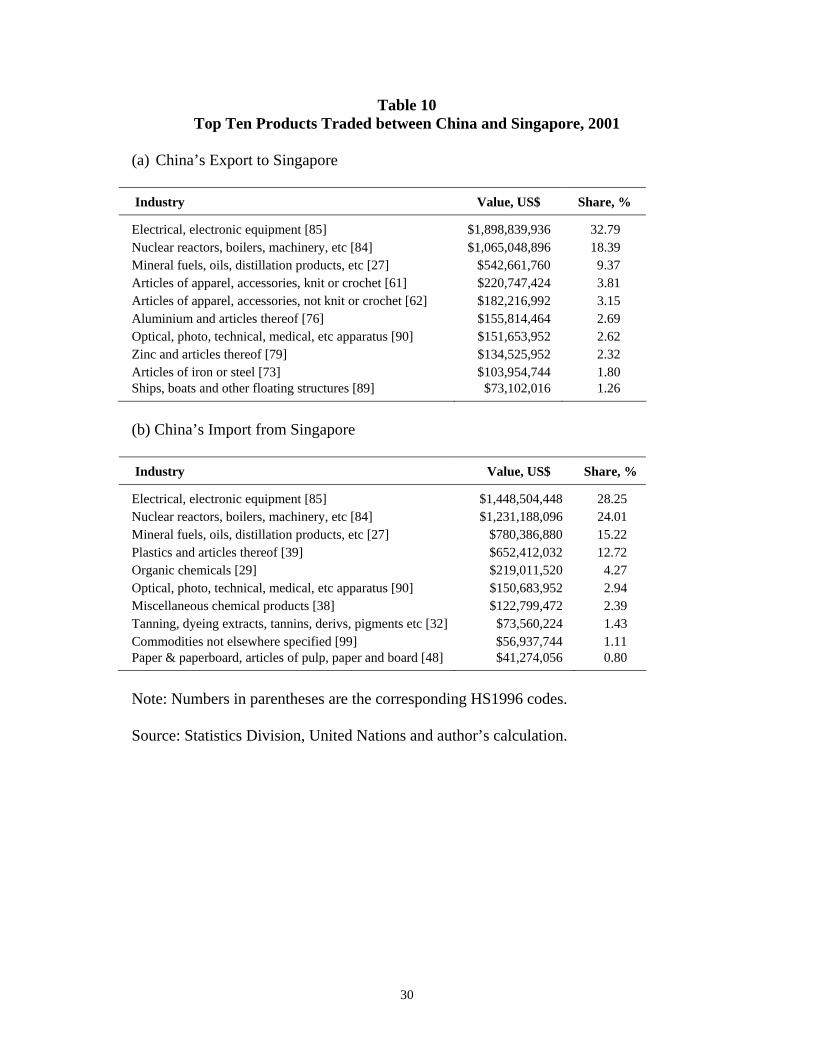
balance between the two countries. It lies between 0 and 1, and a larger number represents a higher degree of intra-industry trade between the countries.11 Note also that the definition in (5) is direction dependent, because its value depends on which country’s trade balance is used, and thus the balance can be positive or negative (unless in the singular case in which the aggregate trade balance is zero). The indices of aggregate intra-industry trade between China and Malaysia for the years from 1996 to 2001 are given in the second column of Table 9.12 These numbers do not suggest that intra-industry trade between the two countries is significant. For example, in 2001, the aggregate index of intra-industry trade is 0.3736. As a matter of fact, this value is already the highest in the period. In 1996, the aggregate index was 0.3183, followed by 0.3423 in 1997. The Asian crisis broke out in the second half of 1997. Apparently the aggregate index fell after the crisis, with the lowest number of 0.2537 recorded in 1999. After that, intra-industry grew again, reaching the highest value in 2001.13 3.2 Trade between China and Singapore We now turn to the trade between China and Singapore, both of which are important trading partners of each other. In 2001, Singapore was the seventh largest markets for China’s products, with a value of US$5,790 million, or 2.18 percent of China’s total export. On the import side, Singapore was the tenth biggest supplier, with a value of imports equal to US$5,128 million, or 2.11 percent of the total import. Merchandise trade between the two countries is fairly balanced, with a small surplus of about six percent of the total volume of trade in China’s favor. For Singapore, China is the fifth largest market of its products in 2001, or 4.38 percent of its total export. On the import side, China supplied 6.21 percent of Singapore’s imports, being the fourth largest supplier in the world market. Like Malaysia, Singapore had trade with China highly skewed toward a few industries. As shown in Table 10, in 2001, “Electrical, electronic equipment” (HS 85) and “Nuclear reactors, boilers, machinery, etc” (HS 84) accounted for more than half of Singapore’s import from China and Singapore’s export to China. Interestingly, China ran a trade surplus in industry 85 but a deficit in industry 84. Another interesting feature is that “Mineral fuels, oils, distillation products, etc” (HS 27) was ranked the third on both the export and import sides. This means that the same three industries are the top three industries, with the same order, in terms of trade between China and Singapore. China exported a lot of apparel products to Singapore (HS 61 and 62). These two industries were ranked the fourth and the fifth in terms of China’s export to Singapore.
11 AI is equal to zero if all industries have either import or export. This is the case of zero intra-industry
trade. On the other hand, it is equal to one if all industries have equal values of import and export. This is the case of perfect intra-industry trade.
12 The last columns of the table give the indices for Singapore and Thailand, which we will discuss later. 13 We will have more discussion about this point later.
11
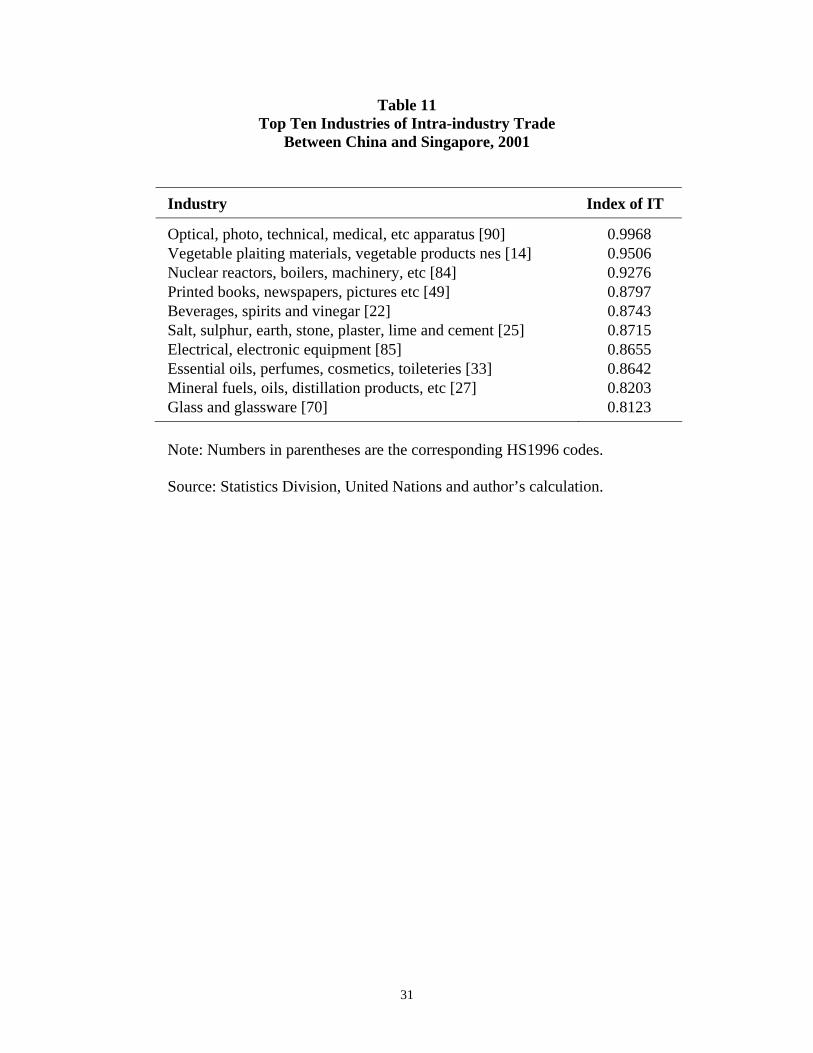
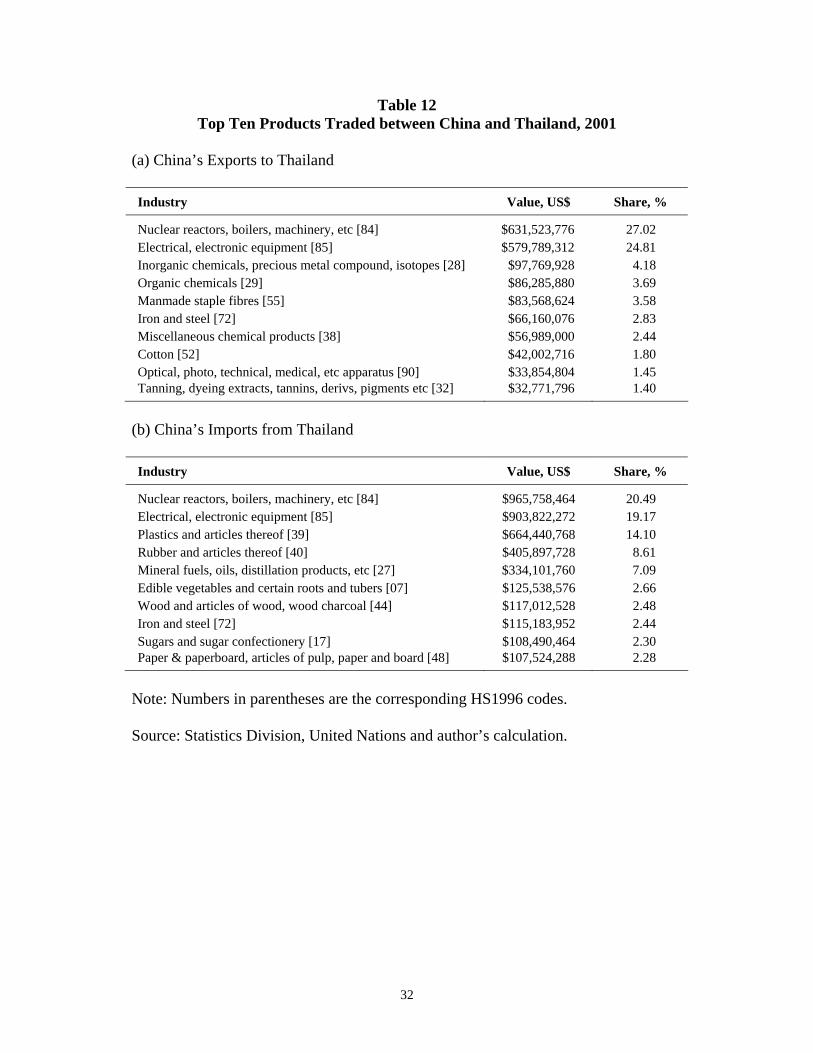
China is revealed to have a comparative advantage versus Singapore in these two industries, as Singapore’s export of these products to China was nearly zero in 2001.14 All the goods included in the two top ten lists in Table 11 are manufacturing. Unlike Malaysia, Singapore does not have the comparative advantage in minerals and natural resources. As the table shows, trade between China and Singapore is mainly in manufacturing products. Table 11 gives the ten industries that have the biggest indices of intra-industry trade in 2001 between China and Singapore. “Optical, photo, technical, medical, etc apparatus” (HS 90) tops the list, with an index of 0.9968. This means that the value of export was approximately the same as the value of import between the two industries. All other industries on the list seem to have a high degree of differentiation. It is interesting to note that “Electrical, electronic equipment” (HS 85), which is the industry with the biggest volumes of export and import, is also on the top-ten list for intra-industry trade. Being ranked the seventh, it has an index of intra-industry trade of 0.8655. All other industries on the top-ten list are those with certain degree of differentiation among the products within the same industries. Table 9 gives the aggregate index of intra-industry trade, which is defined above, for trade between China and Singapore from 1996 to 2001. In 2001, the aggregate index was 0.7161, a very high value. The table shows that for each of the years Singapore had the highest degree of intra-industry trade with China among the three southeast countries shown in Table 9. The trend of the aggregate index does show an upward movement, although there seems to be a dip right after the Asian crisis in 1997. The upward trend of the index’s movement was quickly restored shortly after the crisis. It reached the highest value of 0.7552 in 2000. 3.3 Trade between China and Thailand We now turn to the trade between China and Thailand. In 2001, Thailand was the 18th largest market for China’s products, and it was the tenth largest source of the products imported by China. On the other side, China was the fifth largest markets for Thailand’s exports but the third largest source of products Thailand purchased from the rest of the world. These figures suggest that China was a very important trading partner for Thailand. Table 12 shows the top ten industries of trade between the two countries in 2001. The biggest trading industries are, as in Malaysia and Singapore, “Nuclear reactors, boilers, machinery, etc” (HS 84) and “Electrical, electronic equipment” (HS 85). More than half of China’s export to Thailand were products of these two industries. The importance of these two industries was less for China’s import to Thailand, and they together accounted for about 40 percent of the total import.
14 Singapore’s export of apparel products (HS 61 and 62) to China in 2001 was only US$335,129. China’s
trade surplus in these two industries in that year was US$402,629,287.
12
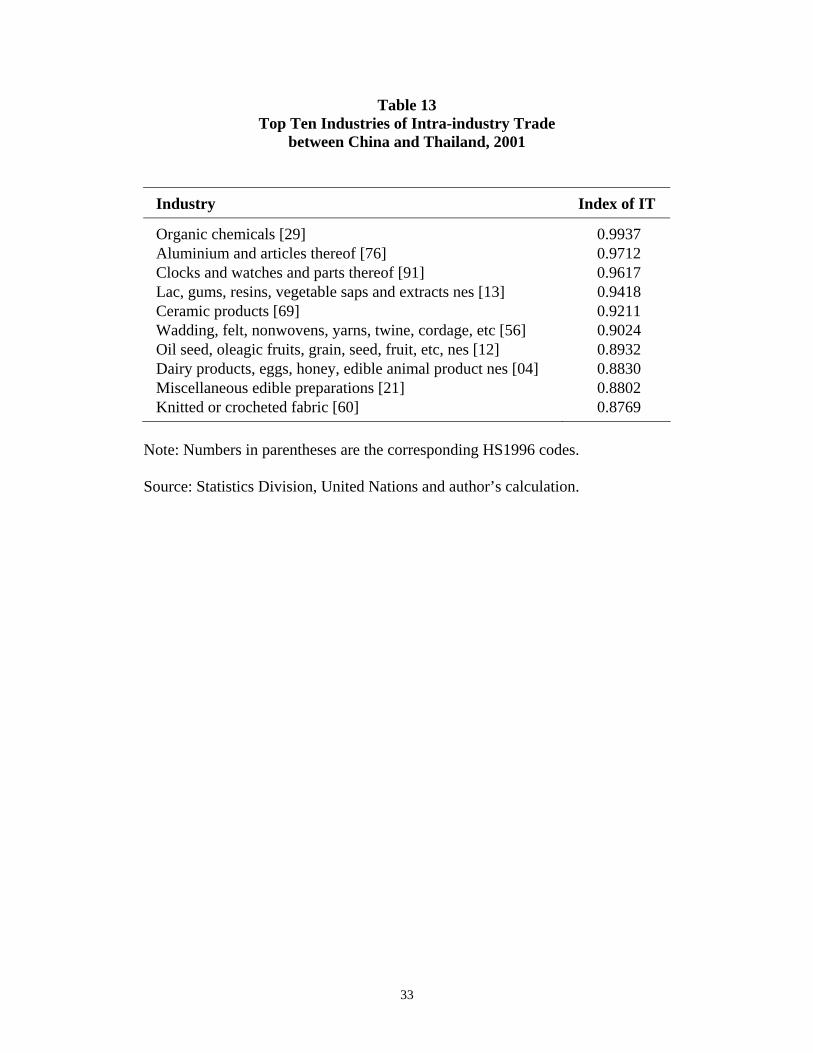
Other important products that China exported to Thailand consisted of manufacturing products like “Iron and steel” (HS 72) and “Optical, photo, technical, medical, etc apparatus” (HS90), but they also included chemicals and chemical products (HS 28, 29, and 38). The products imported by China from Thailand are not limited to manufacturing products. “Plastics and articles thereof” (HS 39), “Rubber and articles thereof” (HS 40), “Mineral fuels, oils, distillation products, etc” (HS 27), “Edible vegetables and certain roots and tubers” (HS 07), and “Wood and articles of wood, wood charcoal” (HS 44) were the third to the seventh most important products imported by China from Thailand. It is interesting to note that “Iron and steel” (HS 72) was on the top-ten list for both import and export. Table 13 gives the top ten industries that had the highest degree of intra-industry trade between China and Thailand in 2001. The industry that tops the list was organic chemicals (HS 29), with an index of intra-industry trade of 0.9937. Note that this industry was the fourth largest industry in terms of China’s export to Thailand. This means that this industry not only is big in terms Thailand’s import, but is also big in terms of intra-industry trade. Other products that had high degree of intra-industry trade between the countries were not limited to manufacturing products. Products like “Oil seed, oleagic fruits, grain, seed, fruit, etc, nes” (HS 12), “Dairy products, eggs, honey, edible animal product nes” (HS 04), and “Miscellaneous edible preparations” (HS 21), which were ranked the seventh, eighth, and ninth on the list of intra-industry trade, were not the usual manufacturing products with high degree of differentiation that the theory tends to depict. It is interesting to note that in terms of either import or export between the two countries, “Nuclear reactors, boilers, machinery, etc” (HS 84) and “Electrical, electronic equipment” (HS 85) are the two biggest industries. Their degrees of intra-industry trade, however, are not that high: The former was ranked the eighteenth, with an index of intra-industry trade of 0.7907, while the latter was ranked the nineteenth, with an index of intra-industry trade of 0.7816. For all industries as a whole, the degree of intra-industry trade between China and Thailand was not too high. In 2001, the aggregate index of intra-industry trade between the two countries was 0.3832, which was slightly higher than that for China and Malaysia, but is sufficiently lower than that for China and Singapore. (Table 9) The degree of intra-industry trade between China and Thailand had been moving up gradually from 1996 to 2001, although it dropped slightly in 1997 and 1998. 3.4 Trade between China and Indonesia We now examine the trade between China and Indonesia. In 2001, Indonesia was the fourteenth largest markets for China’s products, and was the thirteenth largest supplier of the products purchased by China from the world. For Indonesia, in 2001, China was the
13
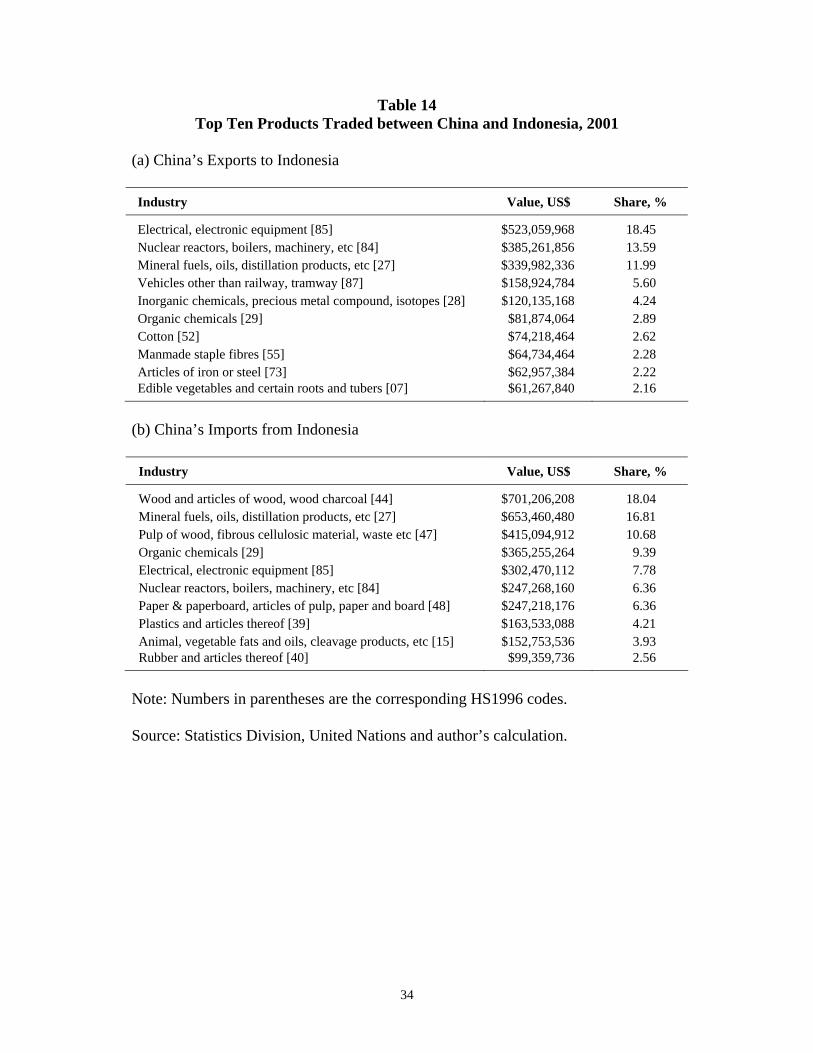
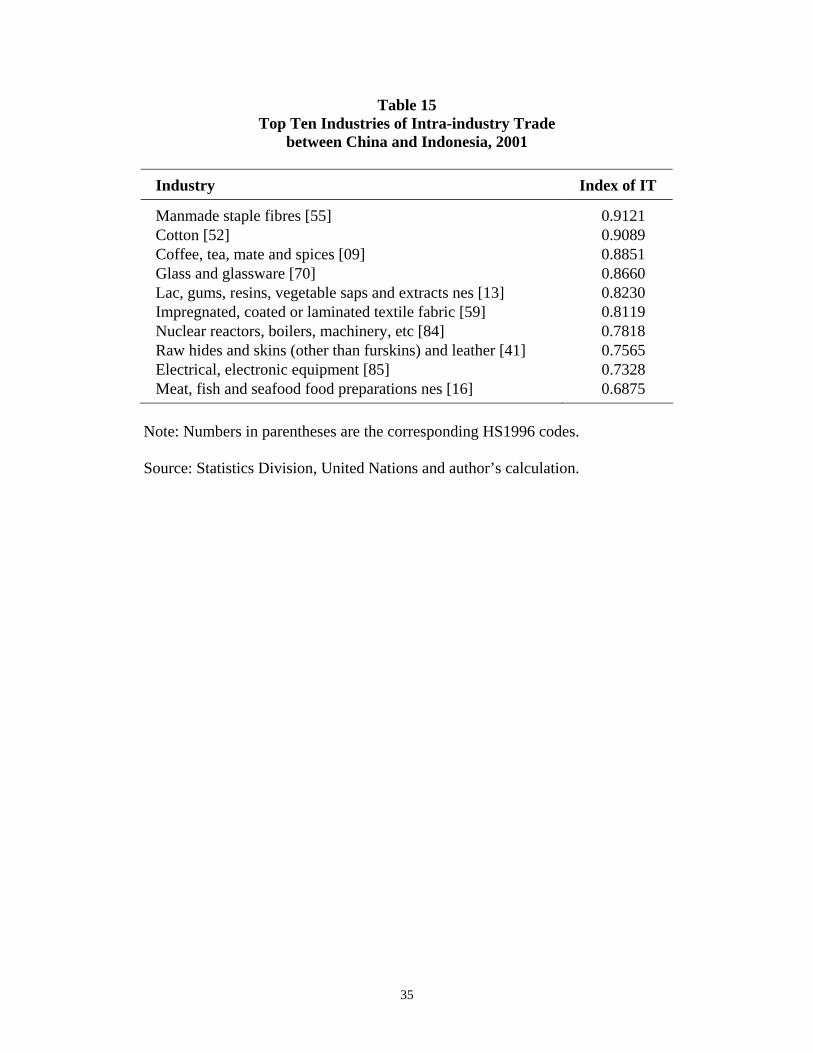
fifth largest markets for its products, and also the fifth largest supplier of the products it purchased. These numbers show how importance China is as a trading partner for Indonesia. Table 14 shows the top ten industries traded between China and Indonesia in 2001. China’s two most important products sold to Indonesia were “Electrical, electronic equipment” (HS 85) and “Nuclear reactors, boilers, machinery, etc” (HS 84). Together, they accounted for more than thirty percent of China’s export to the country. Other major products from China to Indonesia varied from agricultural products (such as edible vegetables to manufacturing products such as vehicles and articles of iron and steel. Chemical products (inorganic and organic) were also important exports. Products from Indonesia to China are mostly natural resources and processed products. Topping the list of the products from Indonesia to China in 2001 was “Wood and articles of wood, wood charcoal” (HS 44). “Mineral fuels, oils, distillation products, etc” (HS 27) and “Pulp of wood, fibrous cellulosic material, waste etc” (HS 47) were ranked the second and the third. Other products on the list included “Organic chemicals (HS 29), “Paper & paperboard, articles of pulp, paper and board” (HS 48), “Plastics and articles thereof” (HS 39), and “Rubber and articles thereof” (HS 40). It is interesting to note that “Electrical, electronic equipment” (HS 85) and “Nuclear reactors, boilers, machinery, etc” (HS 84), which were the two largest products to be imported from or exported to China in 2001 for Malaysia, Singapore, and Thailand, were only ranked the fifth and sixth in terms of imports from China to Indonesia. Table 15 presents the ten largest industries in terms of intra-industry trade between China and Indonesia in 2001. “Manmade staple fibres” (HS 55) topped the list, but its index of intra-industry trade was only 0.9121, which is lower than the largest indices for intra-industry trade between China and Malaysia, Singapore, and Thailand. As a matter of fact, the table presents quite a different picture of intra-industry trade between China and Indonesia as compared with the pictures of intra-industry trade between China and other ASEAN countries analyzed above. The list in the table includes mostly agricultural products or processed products. Not too many manufacturing products were included: the two notable examples were “Nuclear reactors, boilers, machinery, etc” (HS 84) and “Electrical, electronic equipment” (HS 85), being ranked the seventh and the ninth. To look at the degree of intra-industry trade between China and Indonesia, refer to Table 9. In 2001, the aggregate index of intra-industry trade between the two countries was 0.3634, which was comparable with the corresponding indices for Malaysia, Singapore, and Thailand. However, it is noted that the figure rose sufficiently from the figures in previous years. For example, it was 0.2071 in 1996, then dropped down to the lowest of 0.1627 in 1998 after the Asian crisis, before it climbed back up to 0.2134 in 1999, 0.2806 in 2000, and then 0.3634 in 2002. 3.5 Trade between China and Philippines
14
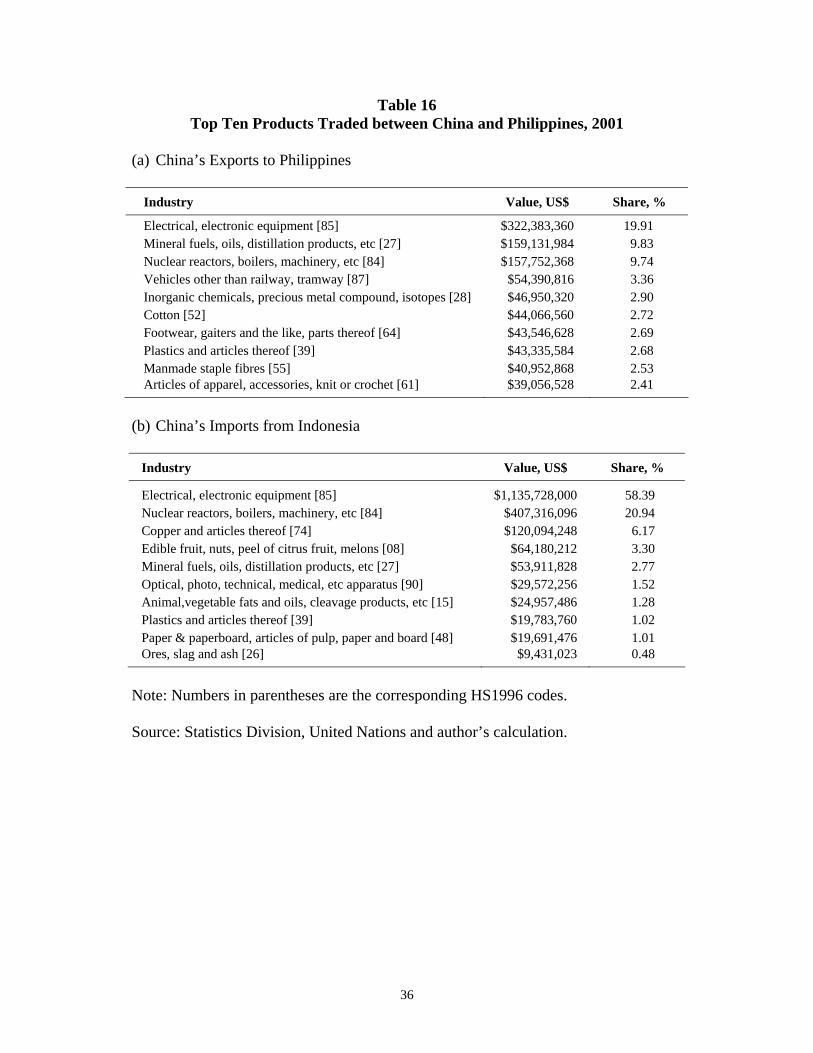
We now turn to the trade between China and Philippines. For China, the Philippines is not among its biggest trading partners. In 2001, the Philippines was ranked the 23rd as a market for China’s export, buying only 0.61 percent in dollar term of all the goods China exported, and was the 22nd largest suppliers of foreign goods to China, supplying 0.8 percent of the goods China purchased. For the Philippines, China is a much more important trading partner. In 2001, China was the eleventh largest market of the Philippines’s exports, buying 2.47 percent of the goods. China was the fifth largest supplier of foreign products the Philippines bought, or a percentage of 3.35. Table 16 lists the important industries of trade between China and the Philippines. All these products are manufacturing products. The three biggest industries with products exported from China to the Philippines in 2001 were “Electrical, electronic equipment” (HS 85, 19.9 percent), “Mineral fuels, oils, distillation products, etc” (HS 27, 9.8 percent), and “Nuclear reactors, boilers, machinery, etc” (HS 84, 9.7 percent). These and many others on the top-ten list were considered to be capital-intensive. The interesting, and probably puzzling, feature is that included on the list are also products that are considered to be labor intensive; for example, “Footwear, gaiters and the like, parts” (HS 64), “Manmade staple fibres” (HS 55), and “Articles of apparel, accessories, knit or crochet” (HS 61). China versus the Philippines seemed to have a comparative advantage in these three industries. In 2001, China’s indices of comparative advantage with respective to the Philippines for these three industries were 0.9928, 0.8891, and 0.8543, respectively. Table 5 shows that China did not have much advantage with respective to the Philippines in terms of labor costs in textile, apparel, and footwear industries. The figures in Table 5 were in 1998, and it is believed that with the recent spectacular growth of the Chinese economy in recent years, the labor costs in these industries must have risen much to close part of the gaps between the China’s and the Philippines’ labor costs. In fact, it is noted that Thailand had labor costs in these industries slightly higher than those in the Philippines, but China did not show that much comparative advantage in these industries with respective to Thailand. For example, in 2001, China’s indices of comparative advantage versus Thailand for industries 64, 55, and 61 were 0.5564, 0.2082, and 0.8589, respectively.15 In 2001, imports of China from the Philippines were mostly in the industries “Electrical, electronic equipment” (HS 85) and “Nuclear reactors, boilers, machinery, etc” (84). The former accounted for 58 percent of the import while the latter accounted for 21 percent. This means that about 80 percent of the products China purchased from the Philippines in that year from in these two industries. In fact, the flows of products in this direction were so concentrated commodity-wise that more than 90 percent of them were in the top five industries.
15 Why China had such high comparative advantage in these supposedly labor-intensive industries versus
the Philippines seems to be an interesting topic for future research. Since it is beyond the scope of this paper, we will not get into the details.
15
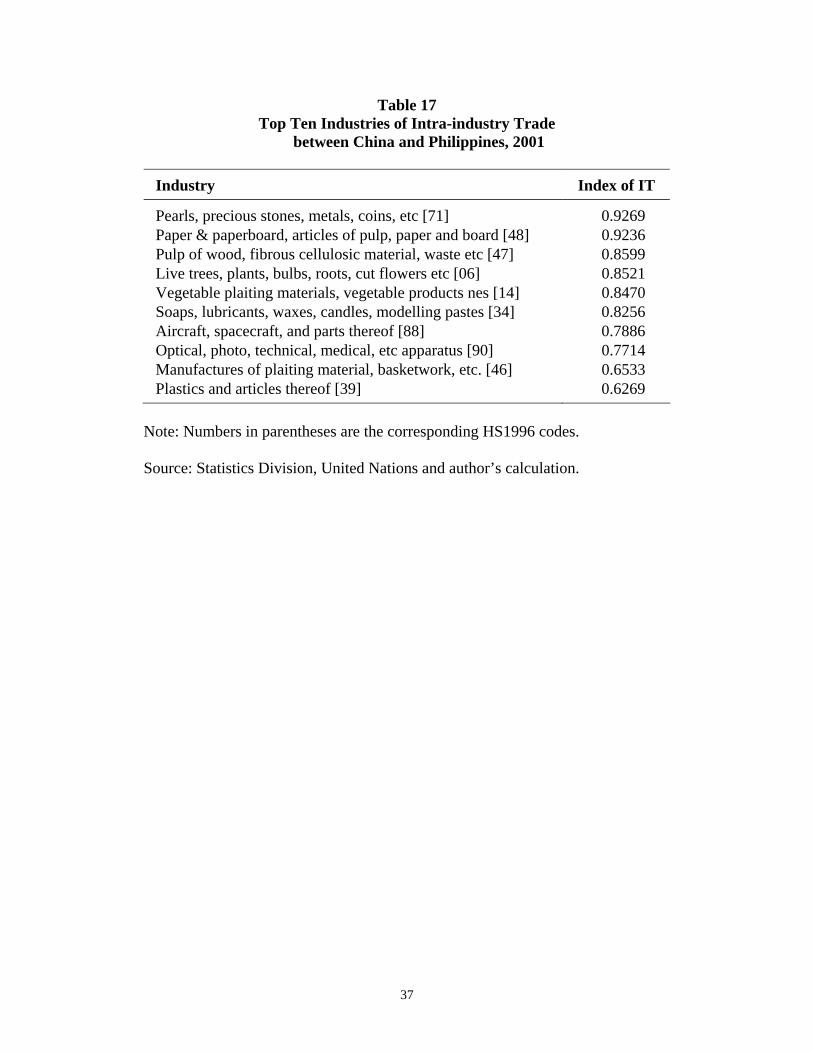
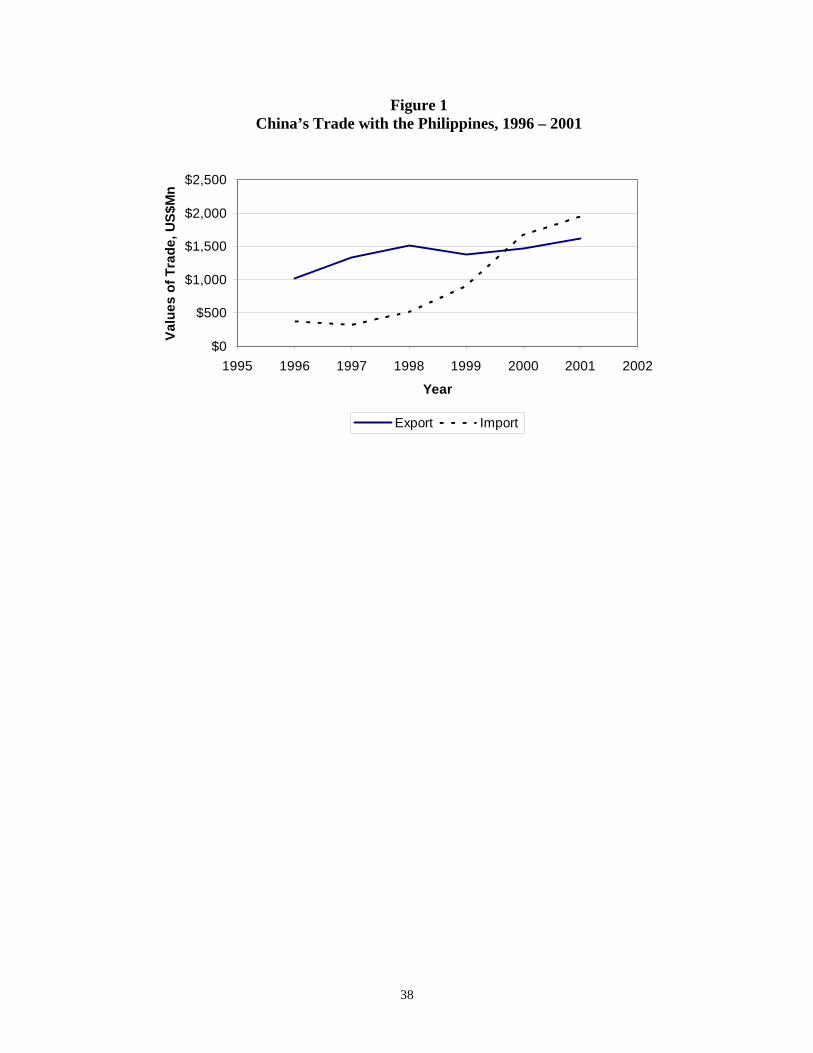
Table 17 gives the ten industries with the largest indices of intra-industry trade between China and the Philippines in 2001. The first two industries were “Pearls, precious stones, metals, coins, etc” (HS 71) and “Paper & paperboard, articles of pulp, paper and board” (HS 48). Both of them had an index of intra-industry trade slightly greater than 0.92. Most of the industries on this top ten list are manufacturing products, but there are also non-manufacturing products such as “Live trees, plants, bulbs, roots, cut flowers etc” (HS 06) and “Vegetable plaiting materials, vegetable products nes” (HS 14). However, even for manufacturing products, there are industries on this list that usually have lower indices of comparative advantage for trade between China and other southeast Asian countries; for example, “Soaps, lubricants, waxes, candles, modelling pastes” (HS 34) and “Manufactures of plaiting material, basketwork, etc.” (HS 46). Table 9 gives the aggregative indices of intra-industry trade between China and the Philippines from 1996 to 2001. There are some features of these numbers. First, in 2001 alone, the degree of intra-industry trade between China and the Philippines was not very high: Its index of 0.3462 was the lowest among all the five pairs in the same year. However, that number dropped significantly over the previous years. In 1996, the index was 0.5004. During and shortly after the Asian crisis, the index rose instead of dropped. In 1999, it reached a level of 0.7704. Since then, it dropped significantly to 0.4436 in 2000 and 0.3462 in 2001. The changes in the degree of intra-industry trade between the two countries over time can be explained in terms of the changes in the volumes of trade. Figure 1 shows the values of exports and imports in these years. The solid curve represents China’s export to the Philippines and the broken curve is China’s import from the Philippines. From 1996 to 1998, China had huge trade surpluses with the Philippines. The surplus narrowed a lot in 1999, mainly due to a great leap in China’s import from the Philippines. China’s import continued to climb in 2000 and 2001, and some time in 2000, the surplus switched to a deficit. In both 2000 and 2001, China’s deficit maintained at a certain level. Figure 1 suggests that the high degree of intra-industry trade between China and the Philippines can be partly explained by the huge trade surplus China had from 1996 to 1998. When the trade surplus turned to be trade deficits in 2000 and 2001, the index of intra-industry trade between the two countries dropped. 4. Implications of Trade Liberalization and Mutual Trade There have been a lot of concerns on the rivalry competition between China and ASEAN nations in the rest of the world, and such concerns have been signified by worries and fears. China’s accession to the WTO has the effect of amplifying these worries and fears. However, the rivalry competition between China and these Asian countries is only one side of the economic relations among these countries. What the previous section shows is that there is much mutual trade between China and these Asian countries. For the ASEAN countries, China is not only a competitor in the
16
rest of the world, but also an importer of the products from these countries and also a supplier of products these countries consume. The importance of trade dependence between China and ASEAN countries has been rising, and no one can neglect such dependence and the potential for further development in the future. What does the mutual trade between China and ASEAN countries imply? 4.1 China as a Market China’s accession to the WTO requires that China lowers its restrictions on the import of foreign products, and by the most-favored-nation clause of the WTO, ASEAN is getting the same trade concessions that China gives to other countries. What this means is that products of ASEAN can be exported to China under less and fewer trade restrictions. In the past two decades, the China economy has been growing with a compounded annual rate of around seven to eight percent. Many of the cities along the coastline had achieved even more spectacular growth rates of more than ten percent per year. With the growth of the economy was the growth of the appetite of local consumers for foreign products. The previous section shows that China imports large varieties of products, and that is why ASEAN countries could expect to be able to find markets for their products in China. 4.2 China as a Supplier of Intermediate and Final Products As China liberalizes foreign trade and allows more products from abroad, it can allocate some of its resources in the import competing industries to its exportable industries, enabling it to increase its exports. How can ASEAN countries benefit from this? ASEAN can import more from China. On the one hand, by importing more, ASEAN countries can allocate more of its resources to the industries in which they have a comparative advantage. As a result, ASEAN can improve the competitiveness of their products in the rest of the world. On the other hand, China has conditions that allow it to compete with the products from third countries. First, China has the labor cost advantage, as explained in Section 2 of this paper. Such advantage is even more profound as compared with the rest of world. Second, as China grows, so are its capital stocks and technological advantage. What this means is that there is a gradual change in the comparative advantage of China and also the mix of the products exported by China. Evidence suggests that China is gaining comparative advantage in skilled and high-technology products. China is also a good supplier of consumer products to ASEAN countries. As China liberalizes trade, it transfers some of its resources from the import-competing industries to export industries, allowing it to increase its export of products, including consumer products, to other countries. This can benefit the consumers in the ASEAN countries.
17
4.3 Price and Trade Effects of China’s Trade Liberalization To examine possible impacts of China’s WTO accession on ASEAN economies, I developed in a separate paper a theoretical model (Wong, 2003). The model, which has three countries (or three groups of countries) and four goods, is constructed to analyze how a tariff reduction by China may affect the prices of traded goods and the volumes of bilateral trade between any pair of countries.16 How China’s trade liberalization may affect the welfare of the ASEAN countries is also examined. The advantage of the model is that it recognizes the fact that the economic relations between China and ASEAN countries consist not only of competition between their products in the rest of the world, but also of mutual trade. To each other, each country is both a consumer of the exports of and a supplier of raw materials, intermediate components, and final products to the other countries. The model is thus constructed so that it can analyze simultaneously the exports of China and ASEAN products to the rest of the world, and also mutual trade between China and ASEAN. Although we are not able to repeat the Wong’s model here, we can still explain some of the results obtained in that paper. It is argued that when China lowers its trade barriers on the products from the United States, China-ASEAN trade could be affected. In particular, because the domestic prices of United States’ products in the Chinese markets tend to drop as a result of trade liberalization, consumers in China will likely shift their consumption from the products of ASEAN to the United States products. This will put a downward pressure on the prices of ASEAN products exported to China. Facing a drop in the prices of these products, ASEAN will want to allocate more of their resources to industries that produce products to be exported to the rest of the world. Such changes in the prices and volumes of ASEAN exports as a result of China’s trade liberalization will have effects on the welfare level of ASEAN. Wong (2003) argues that the change in the welfare level is ambiguous, and whether ASEAN will be hurt depends on, among other things, the initial export levels, substitution between consumption goods in ASEAN and China, and the extent of the price changes. However, to estimate how the welfare of ASEAN may change requires a lot of information, a task that can be the topic of future research.17 4.4 Intra-industry Trade between China and ASEAN
16 In the model, the three countries are labeled China, Thailand, and the United States, with the latter two
standing for ASEAN countries and the rest of the world, respectively. 17 The model in Wong (2003) is only a simplification of the real world. In particular, ASEAN is lumped
into one group of countries and the rest of the world lumped into another group, and all the goods exported by each country (or group of countries) are aggregated into two types of goods. Such simplification, which is needed so that the model is manageable for theoretical analysis, does not allow us to see more clearly how each industry of a country will be affected.
18
The previous section shows that China and ASEAN have large volumes of intra-industry trade in many products. One explanation provided by modern trade theory is the existence of varieties of products and (internal) economies of scale.18 The existence of varieties means that each industry consists of many types of products that are similar to each other but not identical; for example, varieties of cars, varieties of computers, and so on. Thus consumers regard them as close substitutes and consume a variety of these products, either because each consumer consumes a large variety of the products or because each consumer consumes only a limited varieties but all consumers as a whole consume a large variety of products.19 Economies of scale that are internal to firms mean that a firm realizes that it is able to more than double its output by doubling the quantities of all its inputs. Such economies of scale come from the technological structure of the firm and are industry specific. As a firm increases its scale of production, its output will increase by a greater proportion. If the costs of inputs remain fairly constant, the increase in output will pull down the average cost of production. Firms that are aware of this technological feature will take it into consideration in choosing its optimal output level and in competing with other firms. It is believed that economies of scale exist in many industries, especially manufacturing industries, over a large range of output levels. Intra-industry trade has two implications. First, no two firms will produce products that are exactly identical. The reason is that firms always want to increase its output level in order to exploit economies of scale. If there are two firms producing the same product, the one that has an advanced technology will definitely be the winner because it has a lower average cost of production, and will be able to capture a bigger and bigger share of the market by producing more. The market share of the technology-inferior firm will shrink, raising the firm’s average cost, making the firm even less competitive. If the two firms have the same technology, the one that can raise its output earlier will be able to win as its average cost of production drops. The second implication of economies of scale is that the society has a trade-off between the number of varieties and the scale of production. For the consumers, an increase in the number of varieties is welfare enhancing. For the producers, an increase in the scale of production (but then a small number of varieties due to given factor endowments) will lower the average cost of production. An equilibrium of the economy before trade depends on the interactions between the consumers and producers.
18 See, for example, Wong (1995) for a recent exposition of this theory. Another explanation of intra-
industry trade that is also widely used is the strategic behavior of oligopolistic firms in different countries.
19 The economic theory emphasizes two extreme cases: the love of variety approach in which each consumer demands all varieties, and the ideal variety approach in which each consumer consumers only one variety, his/her ideal variety when all varieties have the same market price, while all consumers will consumer all the existing varieties. For the society, qualitatively both approaches will have similar equilibria.

19
The above two points have an implication on foreign trade. Each economy can allocate its resources to a smaller number of firms/varieties, allowing the firms to exploit the economies of scale. The consumers, however, can expect to enjoy a larger number of varieties because they can buy products from domestic producers and from foreign producers.20 In terms of welfare, there are two effects of trade. First, by producing a smaller number of varieties, each economy is able to exploit economies of scale, thus lowering the average cost of product and the real price of each variety. The effect is positive to the welfare of consumers. Second, the consumers generally will be facing a different number of varieties under trade than before trade. If the number of varieties increases, the effect on their welfare is positive. If, however, the number of varieties decreases, consumers can be worse off with more intra-industry trade. Even though heoretically trade liberalization in the presence of intra-industry trade may benefit or hurt consumers, practically, it is widely believed that the net effect of an increase in intra-industry trade is positive, either because of an increase in the number of varieties, or because even if there is a drop in the number of varieties, the associated negative effect is not big enough to overcome the positive effect resulting from economies of scale. The previous section shows that China has been having significant volumes of intra-industry trade with five of the ASEAN countries, Indonesia, Malaysia, the Philippines, Singapore, and Thailand. The index of intra-industry trade dropped temporarily during the period of the Asian crisis, but in the recent years, as these ASEAN countries were recovering from the crisis, they were seeing increasing intra-industry trade with China. It is believed as China lowers its restrictions on imports as a condition for its becoming a member of the WTO, its intra-industry trade with other countries, including the ASEAN countries, will go up. This will well contribute to the welfare of most countries. 5. Concluding Remarks The accession of China into the WTO is one of the biggest events in world trade, partly because of the size of the Chinese economy, the size of trade liberalization China is planning to have, and the growth of the Chinese economy. It will bring many changes to many parts of the world markets. Obviously different countries and different economic agents will experience different effects, some being good and some being bad. This is why different countries and people will react differently to this event. The ASEAN countries, because of their proximity to China and their competition with China in many markets, have been having concerns about a growing China economy. In this paper, we addressed and analyzed some of these concerns. In this paper, we offered some remarks about these concerns. First, some of them are based on the characteristics of these economies. In particular, the products from China 20 In general, the number of varieties enjoyed by the consumers in an economy increases with trade and
trade liberalization. However, the opposite can happen. See, for example, Wong (1995, Chapter 6) for more discussion.
20
and ASEAN do compete in many common markets. A bigger China economy can become more competitive in many markets. Second, we have reservation about whether a more competitive China economy will necessarily squeeze products from ASEAN out of the third markets. For one thing, the advantage of China in terms of labor costs has been exaggerated, we believe. Countries like the Philippines and perhaps Vietnam and Cambodia as well do have even lower labor costs, while countries like Singapore and Malaysia have higher labor costs. Yet their products in the rest of the world remain as competitive as one may think, even for products like textiles and clothing. Third, while some of the concerns about China becoming too competitive may be justified, there are other sides of the economic relations between China and ASEAN countries that could bring enormous benefits to all countries; for example, mutual trade, including intra-industry trade, between China and ASEAN. However, these factors have not received enough of attention of economists and government officials. This paper raises the point that for ASEAN countries, China is not only a competitor in the third markets, but also a large market for the products of the ASEAN countries, and also a supplier of final and intermediate products that consumers and producers in the latter countries would want to buy.
21
Table 1 Factor Endowments of China and Selected Countries, 1997
China ASEAN Singapore Japan U. S. A.
as a percentage of the world endowment Land 9.0 3.5 0.0 0.3 12.8Unskilled labor 27.1 7.9 0.1 2.3 3.8Skilled labor 18.9 3.8 0.1 3.7 14.5Total labor 26.2 7.4 0.1 2.4 4.9Capital 2.6 1.5 0.7 18.5 22.1endowment ratios Capital/labor 2.9 6.0 363.7 222.7 131.7Land/labor 0.17 0.23 0.00 0.06 1.28
Source: Wang and Schuh (2002).
22
Table 2 Index of Commodity Overlap
between China and Selected Asian Countries Products in the United States, 1996 - 2001
Year Indonesia Malaysia Philippines Singapore Thailand
1996 0.5544 n.a. n.a. n.a. n.a. 1997 0.4529 0.4183 n.a. 0.3610 n.a. 1998 0.4032 0.4311 n.a. 0.3945 n.a. 1999 0.4829 0.4379 n.a. 0.4115 0.6038 2000 0.5861 0.4822 0.5072 0.4406 0.6194 2001 0.5810 0.5020 0.5388 0.4524 0.6380
Note: n.a. = not available Source: United Nations, Statistical Division, and author’s calculation.
23
Table 3 Top Five Destinations of Exports of China and
the Five ASEAN Countries, 2001
Destination Export Share
China
USA 20.4 China, Hong Kong SAR 17.5 Japan 16.9 Rep. of Korea 4.7 Germany 3.7
Indonesia Japan 24.2 USA 14.5 Singapore 10.0 Rep. of Korea 7.0 China 4.1
Malaysia USA 21.1 Singapore 17.7 Japan 13.9 Netherlands 4.8 China, Hong Kong SAR 4.8
Philippines USA 29.0 Japan 16.3 Netherlands 9.6 Singapore 7.4 China, Hong Kong SAR 5.1
Singapore Malaysia 18.3 USA 16.2 China, Hong Kong SAR 9.4 Japan 8.1 China 4.6 Thailand USA 20.3 Japan 15.3 Singapore 8.1 China, Hong Kong SAR 5.1 China 4.4
Source: United Nations, Statistical Division.
24
Table 4 Index of Geographic Overlap
between China and Five ASEAN Countries, 2001
Country Index
Indonesia 0.6598 Malaysia 0.7170 Philippines 0.6405 Singapore 0.7132 Thailand 0.7552
Source: United Nations, Statistical Division, and author’s calculation.
25
Table 5 Labor Costs in Selected Industries, 1998
US$/year
China Malaysia Philippines Singapore Thailand
textile $929 $5,041 $1,904 $15,532 $2,052 apparel n.a. $3,542 $1,662 $11,220 $2,108 leather $831 $3,398 $1,422a $14,368a $2,207 footwear n.a. $3,574 $1,927
Note: aThe figures include leather and footwear n.a. = not available Source: International Labor Organization, http://laborsta.ilo.org/ Pacific Exchange Rate Services, http://pacific.commerce.ubc.ca/xr/
26
Table 6 Index of Comparative Advantage of Selected Industries
of China and Selected ASEAN Countries with respect to the US, 2000
HS China Malaysia Philippines Singapore Thailand
50 0.9544 –1.0000 –0.6964 0.0619 0.9606 51 0.4337 0.6834 0.7349 –0.9784 –0.4859 52 0.4729 0.4106 –0.8564 –0.6586 –0.0182 53 0.9206 –1.0000 0.7416 –0.9825 –0.6337 54 –0.2165 0.8154 0.6092 –0.7480 0.3111 55 –0.2835 0.1233 –0.1053 –0.7874 0.7162 56 –0.3727 –0.8443 0.6771 –0.8532 –0.0583 57 0.9515 –0.9588 0.3870 –0.9368 0.8167 58 0.5632 –0.4482 –0.3150 –0.8158 0.5620 59 –0.1046 –0.6993 –0.8895 –0.8183 –0.2768 60 –0.5096 0.2577 –0.1427 –0.4078 0.2487 61 0.9989 0.9943 0.9917 0.9701 0.9980 62 0.9945 0.9875 0.9965 0.9100 0.9932 63 0.9935 –0.5841 0.7882 –0.3906 0.9608 64 0.9725 0.0956 0.8866 –0.7032 0.9516
Total 0.9230 0.8896 0.9302 0.8121 0.8818
Note: For the definitions of the HS codes, see Appendix A. Source: United Nations, Statistics Division and author’s calculation.
27
Table 7 Top Ten Products Traded between China and Malaysia, 2001
(a) China’s Export to Malaysia
Industry Value, US$ Share, %
Electrical, electronic equipment [85] $1,244,285,184 38.63 Nuclear reactors, boilers, machinery, etc [84] $552,885,184 17.16 Cereals [10] $149,784,016 4.65 Optical, photo, technical, medical, etc apparatus [90] $105,812,904 3.29 Inorganic chemicals, precious metal compound, isotopes [28] $67,608,544 2.10 Articles of iron or steel [73] $59,730,252 1.85 Articles of apparel, accessories, not knit or crochet [62] $50,696,660 1.57 Articles of apparel, accessories, knit or crochet [61] $47,832,784 1.48 Manmade staple fibres [55] $44,477,584 1.38 Vehicles other than railway, tramway [87] $44,370,400 1.38
(b) China’s Import from Malaysia
Industry Value, US$ Share, %
Electrical, electronic equipment [85] $2,738,264,064 44.14 Nuclear reactors, boilers, machinery, etc [84] $929,648,832 14.98 Mineral fuels, oils, distillation products, etc [27] $444,761,376 7.17 Wood and articles of wood, wood charcoal [44] $397,045,760 6.40 Animal, vegetable fats and oils, cleavage products, etc [15] $375,623,840 6.05 Plastics and articles thereof [39] $340,447,232 5.49 Organic chemicals [29] $185,845,648 3.00 Rubber and articles thereof [40] $101,265,056 1.63 Miscellaneous chemical products [38] $95,977,328 1.55 Optical, photo, technical, medical, etc apparatus [90] $75,034,712 1.21
Note: Numbers in parentheses are the corresponding HS1996 codes. Source: Statistics Division, United Nations and author’s calculation.
28
Table 8 Top Ten Industries of Intra-industry Trade
between China and Malaysia, 2001
Industry Index of IT
Manmade staple fibres [55] 0.9956 Wool, animal hair, horsehair yarn and fabric thereof [51] 0.9923 Iron and steel [72] 0.9811 Live trees, plants, bulbs, roots, cut flowers etc [06] 0.9523 Clocks and watches and parts thereof [91] 0.9268 Cotton [52] 0.8475 Optical, photo, technical, medical, etc apparatus [90] 0.8298 Pearls, precious stones, metals, coins, etc [71] 0.8132 Zinc and articles thereof [79] 0.8127 Paper & paperboard, articles of pulp, paper and board [48] 0.7549
Note: Numbers in parentheses are the corresponding HS1996 codes. Source: Statistics Division, United Nations and author’s calculation.
29
Table 9 Indices of Intra-industry Trade
Between China and Selected SE Asian Countries, 1996 – 2001
Year Malaysia Singapore Thailand Indonesia Philippines
1996 0.3183 0.5436 0.3302 0.2071 0.5004 1997 0.3423 0.4380 0.3279 0.2028 0.7721 1998 0.3168 0.5801 0.3294 0.1627 0.6718 1999 0.2537 0.6757 0.3706 0.2134 0.7704 2000 0.2970 0.7552 0.3855 0.2806 0.4436 2001 0.3736 0.7161 0.3832 0.3634 0.3462
Source: Statistics Division, United Nations and author’s calculation.
30
Table 10 Top Ten Products Traded between China and Singapore, 2001
(a) China’s Export to Singapore
Industry Value, US$ Share, %
Electrical, electronic equipment [85] $1,898,839,936 32.79 Nuclear reactors, boilers, machinery, etc [84] $1,065,048,896 18.39 Mineral fuels, oils, distillation products, etc [27] $542,661,760 9.37 Articles of apparel, accessories, knit or crochet [61] $220,747,424 3.81 Articles of apparel, accessories, not knit or crochet [62] $182,216,992 3.15 Aluminium and articles thereof [76] $155,814,464 2.69 Optical, photo, technical, medical, etc apparatus [90] $151,653,952 2.62 Zinc and articles thereof [79] $134,525,952 2.32 Articles of iron or steel [73] $103,954,744 1.80 Ships, boats and other floating structures [89] $73,102,016 1.26
(b) China’s Import from Singapore
Industry Value, US$ Share, %
Electrical, electronic equipment [85] $1,448,504,448 28.25 Nuclear reactors, boilers, machinery, etc [84] $1,231,188,096 24.01 Mineral fuels, oils, distillation products, etc [27] $780,386,880 15.22 Plastics and articles thereof [39] $652,412,032 12.72 Organic chemicals [29] $219,011,520 4.27 Optical, photo, technical, medical, etc apparatus [90] $150,683,952 2.94 Miscellaneous chemical products [38] $122,799,472 2.39 Tanning, dyeing extracts, tannins, derivs, pigments etc [32] $73,560,224 1.43 Commodities not elsewhere specified [99] $56,937,744 1.11 Paper & paperboard, articles of pulp, paper and board [48] $41,274,056 0.80
Note: Numbers in parentheses are the corresponding HS1996 codes. Source: Statistics Division, United Nations and author’s calculation.
31
Table 11 Top Ten Industries of Intra-industry Trade
Between China and Singapore, 2001
Industry Index of IT
Optical, photo, technical, medical, etc apparatus [90] 0.9968 Vegetable plaiting materials, vegetable products nes [14] 0.9506 Nuclear reactors, boilers, machinery, etc [84] 0.9276 Printed books, newspapers, pictures etc [49] 0.8797 Beverages, spirits and vinegar [22] 0.8743 Salt, sulphur, earth, stone, plaster, lime and cement [25] 0.8715 Electrical, electronic equipment [85] 0.8655 Essential oils, perfumes, cosmetics, toileteries [33] 0.8642 Mineral fuels, oils, distillation products, etc [27] 0.8203 Glass and glassware [70] 0.8123
Note: Numbers in parentheses are the corresponding HS1996 codes. Source: Statistics Division, United Nations and author’s calculation.
32
Table 12 Top Ten Products Traded between China and Thailand, 2001
(a) China’s Exports to Thailand
Industry Value, US$ Share, %
Nuclear reactors, boilers, machinery, etc [84] $631,523,776 27.02 Electrical, electronic equipment [85] $579,789,312 24.81 Inorganic chemicals, precious metal compound, isotopes [28] $97,769,928 4.18 Organic chemicals [29] $86,285,880 3.69 Manmade staple fibres [55] $83,568,624 3.58 Iron and steel [72] $66,160,076 2.83 Miscellaneous chemical products [38] $56,989,000 2.44 Cotton [52] $42,002,716 1.80 Optical, photo, technical, medical, etc apparatus [90] $33,854,804 1.45 Tanning, dyeing extracts, tannins, derivs, pigments etc [32] $32,771,796 1.40
(b) China’s Imports from Thailand
Industry Value, US$ Share, %
Nuclear reactors, boilers, machinery, etc [84] $965,758,464 20.49 Electrical, electronic equipment [85] $903,822,272 19.17 Plastics and articles thereof [39] $664,440,768 14.10 Rubber and articles thereof [40] $405,897,728 8.61 Mineral fuels, oils, distillation products, etc [27] $334,101,760 7.09 Edible vegetables and certain roots and tubers [07] $125,538,576 2.66 Wood and articles of wood, wood charcoal [44] $117,012,528 2.48 Iron and steel [72] $115,183,952 2.44 Sugars and sugar confectionery [17] $108,490,464 2.30 Paper & paperboard, articles of pulp, paper and board [48] $107,524,288 2.28
Note: Numbers in parentheses are the corresponding HS1996 codes. Source: Statistics Division, United Nations and author’s calculation.
33
Table 13 Top Ten Industries of Intra-industry Trade
between China and Thailand, 2001
Industry Index of IT
Organic chemicals [29] 0.9937 Aluminium and articles thereof [76] 0.9712 Clocks and watches and parts thereof [91] 0.9617 Lac, gums, resins, vegetable saps and extracts nes [13] 0.9418 Ceramic products [69] 0.9211 Wadding, felt, nonwovens, yarns, twine, cordage, etc [56] 0.9024 Oil seed, oleagic fruits, grain, seed, fruit, etc, nes [12] 0.8932 Dairy products, eggs, honey, edible animal product nes [04] 0.8830 Miscellaneous edible preparations [21] 0.8802 Knitted or crocheted fabric [60] 0.8769
Note: Numbers in parentheses are the corresponding HS1996 codes. Source: Statistics Division, United Nations and author’s calculation.
34
Table 14 Top Ten Products Traded between China and Indonesia, 2001
(a) China’s Exports to Indonesia Industry Value, US$ Share, %
Electrical, electronic equipment [85] $523,059,968 18.45 Nuclear reactors, boilers, machinery, etc [84] $385,261,856 13.59 Mineral fuels, oils, distillation products, etc [27] $339,982,336 11.99 Vehicles other than railway, tramway [87] $158,924,784 5.60 Inorganic chemicals, precious metal compound, isotopes [28] $120,135,168 4.24 Organic chemicals [29] $81,874,064 2.89 Cotton [52] $74,218,464 2.62 Manmade staple fibres [55] $64,734,464 2.28 Articles of iron or steel [73] $62,957,384 2.22 Edible vegetables and certain roots and tubers [07] $61,267,840 2.16
(b) China’s Imports from Indonesia
Industry Value, US$ Share, %
Wood and articles of wood, wood charcoal [44] $701,206,208 18.04 Mineral fuels, oils, distillation products, etc [27] $653,460,480 16.81 Pulp of wood, fibrous cellulosic material, waste etc [47] $415,094,912 10.68 Organic chemicals [29] $365,255,264 9.39 Electrical, electronic equipment [85] $302,470,112 7.78 Nuclear reactors, boilers, machinery, etc [84] $247,268,160 6.36 Paper & paperboard, articles of pulp, paper and board [48] $247,218,176 6.36 Plastics and articles thereof [39] $163,533,088 4.21 Animal, vegetable fats and oils, cleavage products, etc [15] $152,753,536 3.93 Rubber and articles thereof [40] $99,359,736 2.56
Note: Numbers in parentheses are the corresponding HS1996 codes. Source: Statistics Division, United Nations and author’s calculation.
35
Table 15 Top Ten Industries of Intra-industry Trade
between China and Indonesia, 2001
Industry Index of IT
Manmade staple fibres [55] 0.9121 Cotton [52] 0.9089 Coffee, tea, mate and spices [09] 0.8851 Glass and glassware [70] 0.8660 Lac, gums, resins, vegetable saps and extracts nes [13] 0.8230 Impregnated, coated or laminated textile fabric [59] 0.8119 Nuclear reactors, boilers, machinery, etc [84] 0.7818 Raw hides and skins (other than furskins) and leather [41] 0.7565 Electrical, electronic equipment [85] 0.7328 Meat, fish and seafood food preparations nes [16] 0.6875
Note: Numbers in parentheses are the corresponding HS1996 codes. Source: Statistics Division, United Nations and author’s calculation.
36
Table 16 Top Ten Products Traded between China and Philippines, 2001
(a) China’s Exports to Philippines
Industry Value, US$ Share, %
Electrical, electronic equipment [85] $322,383,360 19.91 Mineral fuels, oils, distillation products, etc [27] $159,131,984 9.83 Nuclear reactors, boilers, machinery, etc [84] $157,752,368 9.74 Vehicles other than railway, tramway [87] $54,390,816 3.36 Inorganic chemicals, precious metal compound, isotopes [28] $46,950,320 2.90 Cotton [52] $44,066,560 2.72 Footwear, gaiters and the like, parts thereof [64] $43,546,628 2.69 Plastics and articles thereof [39] $43,335,584 2.68 Manmade staple fibres [55] $40,952,868 2.53 Articles of apparel, accessories, knit or crochet [61] $39,056,528 2.41
(b) China’s Imports from Indonesia
Industry Value, US$ Share, %
Electrical, electronic equipment [85] $1,135,728,000 58.39 Nuclear reactors, boilers, machinery, etc [84] $407,316,096 20.94 Copper and articles thereof [74] $120,094,248 6.17 Edible fruit, nuts, peel of citrus fruit, melons [08] $64,180,212 3.30 Mineral fuels, oils, distillation products, etc [27] $53,911,828 2.77 Optical, photo, technical, medical, etc apparatus [90] $29,572,256 1.52 Animal,vegetable fats and oils, cleavage products, etc [15] $24,957,486 1.28 Plastics and articles thereof [39] $19,783,760 1.02 Paper & paperboard, articles of pulp, paper and board [48] $19,691,476 1.01 Ores, slag and ash [26] $9,431,023 0.48
Note: Numbers in parentheses are the corresponding HS1996 codes. Source: Statistics Division, United Nations and author’s calculation.
37
Table 17 Top Ten Industries of Intra-industry Trade
between China and Philippines, 2001
Industry Index of IT
Pearls, precious stones, metals, coins, etc [71] 0.9269 Paper & paperboard, articles of pulp, paper and board [48] 0.9236 Pulp of wood, fibrous cellulosic material, waste etc [47] 0.8599 Live trees, plants, bulbs, roots, cut flowers etc [06] 0.8521 Vegetable plaiting materials, vegetable products nes [14] 0.8470 Soaps, lubricants, waxes, candles, modelling pastes [34] 0.8256 Aircraft, spacecraft, and parts thereof [88] 0.7886 Optical, photo, technical, medical, etc apparatus [90] 0.7714 Manufactures of plaiting material, basketwork, etc. [46] 0.6533 Plastics and articles thereof [39] 0.6269
Note: Numbers in parentheses are the corresponding HS1996 codes. Source: Statistics Division, United Nations and author’s calculation.
38
Figure 1 China’s Trade with the Philippines, 1996 – 2001
$0
$500
$1,000
$1,500
$2,000
$2,500
1995 1996 1997 1998 1999 2000 2001 2002
Year
Valu
es o
f Tra
de, U
S$M
n
Export Import
39
Appendix A This appendix provides the definition of two-digit commodities according to the 1996 HS scale. 01 Live animals
02 Meat and edible meat offal
03 Fish, crustaceans, molluscs, aquatic invertebrates nes
04 Dairy products, eggs, honey, edible animal product nes
05 Products of animal origin, nes
06 Live trees, plants, bulbs, roots, cut flowers etc
07 Edible vegetables and certain roots and tubers
08 Edible fruit, nuts, peel of citrus fruit, melons
09 Coffee, tea, mate and spices
10 Cereals
11 Milling products, malt, starches, inulin, wheat gluten
12 Oil seed, oleagic fruits, grain, seed, fruit, etc, nes
13 Lac, gums, resins, vegetable saps and extracts nes
14 Vegetable plaiting materials, vegetable products nes
15 Animal,vegetable fats and oils, cleavage products, etc
16 Meat, fish and seafood food preparations nes
17 Sugars and sugar confectionery
18 Cocoa and cocoa preparations
19 Cereal, flour, starch, milk preparations and products
20 Vegetable, fruit, nut, etc food preparations
21 Miscellaneous edible preparations
22 Beverages, spirits and vinegar
23 Residues, wastes of food industry, animal fodder
24 Tobacco and manufactured tobacco substitutes
25 Salt, sulphur, earth, stone, plaster, lime and cement
26 Ores, slag and ash
27 Mineral fuels, oils, distillation products, etc
28 Inorganic chemicals, precious metal compound, isotopes
29 Organic chemicals
30 Pharmaceutical products
31 Fertilizers
32 Tanning, dyeing extracts, tannins, derivs,pigments etc
33 Essential oils, perfumes, cosmetics, toileteries
34 Soaps, lubricants, waxes, candles, modelling pastes
35 Albuminoids, modified starches, glues, enzymes
36 Explosives, pyrotechnics, matches, pyrophorics, etc
37 Photographic or cinematographic goods
38 Miscellaneous chemical products
39 Plastics and articles thereof
40 Rubber and articles thereof
41 Raw hides and skins (other than furskins) and leather
42 Articles of leather, animal gut, harness, travel goods
43 Furskins and artificial fur, manufactures thereof
40
44 Wood and articles of wood, wood charcoal
45 Cork and articles of cork
46 Manufactures of plaiting material, basketwork, etc.
47 Pulp of wood, fibrous cellulosic material, waste etc
48 Paper & paperboard, articles of pulp, paper and board
49 Printed books, newspapers, pictures etc
50 Silk
51 Wool, animal hair, horsehair yarn and fabric thereof
52 Cotton
53 Vegetable textile fibres nes, paper yarn, woven fabric
54 Manmade filaments
55 Manmade staple fibres
56 Wadding, felt, nonwovens, yarns, twine, cordage, etc
57 Carpets and other textile floor coverings
58 Special woven or tufted fabric, lace, tapestry etc
59 Impregnated, coated or laminated textile fabric
60 Knitted or crocheted fabric
61 Articles of apparel, accessories, knit or crochet
62 Articles of apparel, accessories, not knit or crochet
63 Other made textile articles, sets, worn clothing etc
64 Footwear, gaiters and the like, parts thereof
65 Headgear and parts thereof
66 Umbrellas, walking-sticks, seat-sticks, whips, etc
67 Bird skin, feathers, artificial flowers, human hair
68 Stone, plaster, cement, asbestos, mica, etc articles
69 Ceramic products
70 Glass and glassware
71 Pearls, precious stones, metals, coins, etc
72 Iron and steel
73 Articles of iron or steel
74 Copper and articles thereof
75 Nickel and articles thereof
76 Aluminium and articles thereof
78 Lead and articles thereof
79 Zinc and articles thereof
80 Tin and articles thereof
81 Other base metals, cermets, articles thereof
82 Tools, implements, cutlery, etc of base metal
83 Miscellaneous articles of base metal
84 Nuclear reactors, boilers, machinery, etc
85 Electrical, electronic equipment
86 Railway, tramway locomotives, rolling stock, equipment
87 Vehicles other than railway, tramway
88 Aircraft, spacecraft, and parts thereof
89 Ships, boats and other floating structures
90 Optical, photo, technical, medical, etc apparatus
91 Clocks and watches and parts thereof
92 Musical instruments, parts and accessories
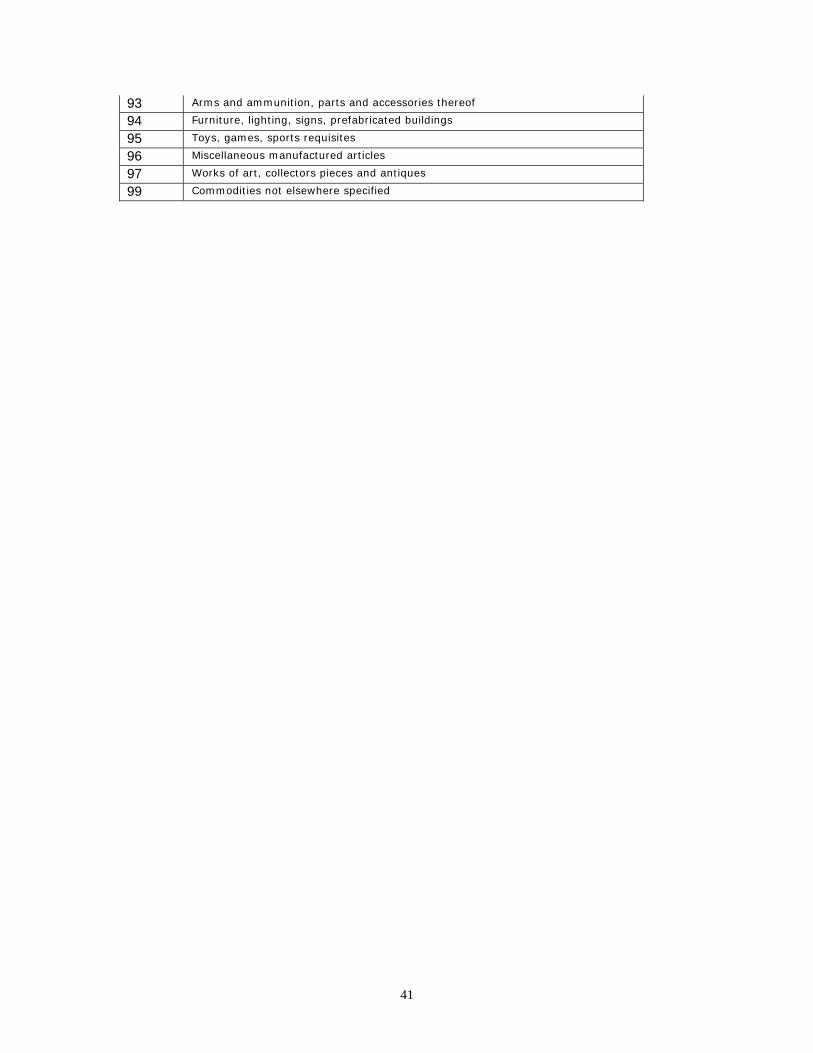
41
93 Arms and ammunition, parts and accessories thereof
94 Furniture, lighting, signs, prefabricated buildings
95 Toys, games, sports requisites
96 Miscellaneous manufactured articles
97 Works of art, collectors pieces and antiques
99 Commodities not elsewhere specified
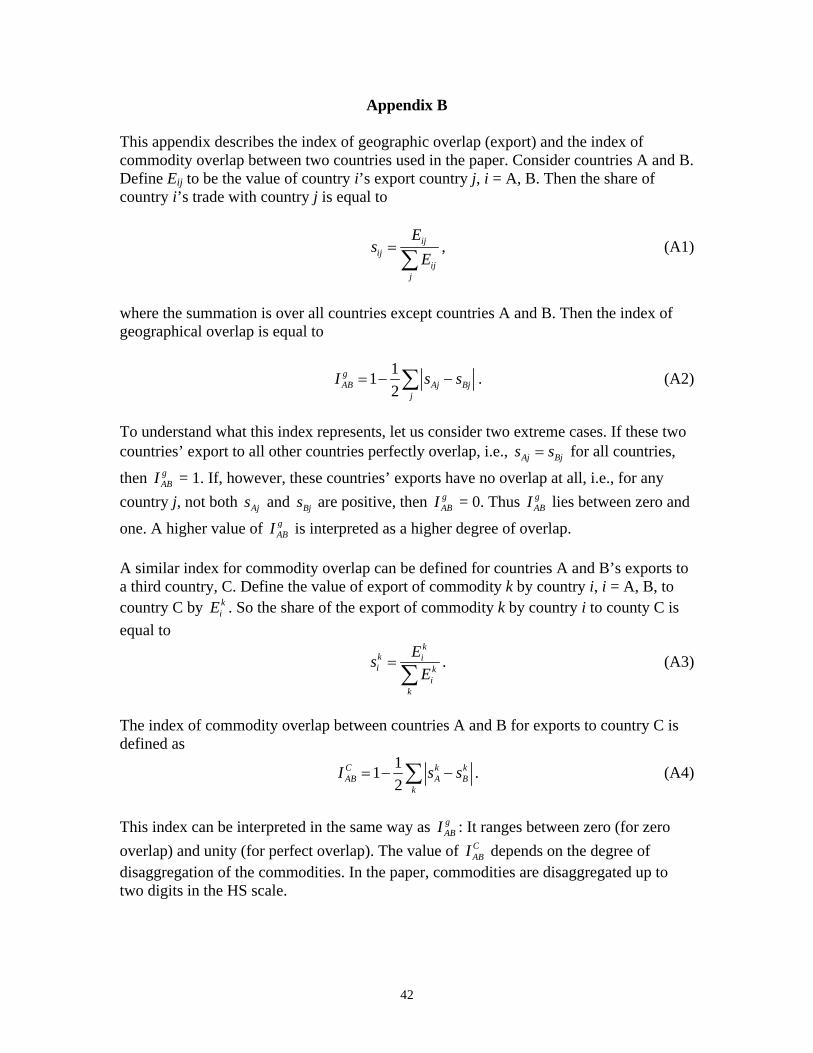
42
Appendix B
This appendix describes the index of geographic overlap (export) and the index of commodity overlap between two countries used in the paper. Consider countries A and B. Define Eij to be the value of country i’s export country j, i = A, B. Then the share of country i’s trade with country j is equal to
ijij
ijj
Es
E=∑
, (A1)
where the summation is over all countries except countries A and B. Then the index of geographical overlap is equal to
112
gAB Aj Bj
jI s s= − −∑ . (A2)
To understand what this index represents, let us consider two extreme cases. If these two countries’ export to all other countries perfectly overlap, i.e., Aj Bjs s= for all countries,
then gABI = 1. If, however, these countries’ exports have no overlap at all, i.e., for any
country j, not both Ajs and Bjs are positive, then gABI = 0. Thus g
ABI lies between zero and
one. A higher value of gABI is interpreted as a higher degree of overlap.
A similar index for commodity overlap can be defined for countries A and B’s exports to a third country, C. Define the value of export of commodity k by country i, i = A, B, to country C by k
iE . So the share of the export of commodity k by country i to county C is equal to
k
k ii k
ik
EsE
=∑
. (A3)
The index of commodity overlap between countries A and B for exports to country C is defined as
112
C k kAB A B
kI s s= − −∑ . (A4)
This index can be interpreted in the same way as g
ABI : It ranges between zero (for zero overlap) and unity (for perfect overlap). The value of C
ABI depends on the degree of disaggregation of the commodities. In the paper, commodities are disaggregated up to two digits in the HS scale.

43
References Grubel, Herbert G. and P. J. Lloyd (1975). Intra-industry Trade, New York: John Wiley
& Sons. Magarinos, Carlos A., and Francisco C. Sercovich (2002). “China’s Accession to the
WTO: an Overview of Domestic and External Implications,” in Carlos A. Magarinos, Long Yongtu, and Francisco C. Sercovich (eds.), China in the WTO, Palgrave MacMillan.
Wang, Zhi and Edward G. Schuh (2002). “The Emergence of a Greater China and Its
Impact on World Trade: A Computable General Equilibrium Analysis,” Journal of Comparative Economics, 30: 531-566.
Wong, Kar-yiu (1995). International Trade in Goods and Factor Mobility, Cambridge,
Mass.: MIT Press. Wong, Kar-yiu (2003). “Impacts of China’s WTO Accession on the Southeast Asian
Economies: A Theoretical Analysis,” China Economic Review, Nov., Vol. 14: 208 – 226.