China’s textile and clothing trade and 14 global...
21
303 China’s textile and clothing trade and global adjustment 14 Will Martin The year 2009 is proving to be a remarkable one in many respects. One of the most important of these from a trade perspective has received very little attention. This is the first year in half a century in which the world has not had a system of quotas to slow the growth of exports of textiles and clothing from developing countries in general, and particularly from China. That these quotas have been abolished seems remarkable given the intensity of the support for these quotas in earlier periods. Perhaps even more remarkable is the fact that they disappeared almost without trace in 2009, without evidence of the major disruption against which they were long seen as a bulwark. Have world textile-trade policymakers finally found the virtue they have long sought, but whose realisation they often seemed to defer (Reinert 2000)? Quotas against exports of textiles and clothing from developing countries were introduced on a large scale in the 1960s, based on precedents of quotas used to slow the seemingly inexorable growth in exports of textiles and clothing from Japan in the 1930s. The quotas of the 1960s were partial in coverage, focusing on only textiles and clothing made from cotton, and from a relatively limited set of countries. As is frequently the case with quantitative restrictions, one set of restrictions begot another. In this case, the restrictions on cotton textiles created incentives for suppliers to use synthetics and other fibres, including such previously—and since—obscure fibres as ramie. As a result of these spill- over effects, a complex web of quotas covering a wide range of textile fibres was introduced under the Multi-Fibre Arrangement (MFA) in the 1970s and progressively tightened during the 1980s and early 1990s. In principle, these quotas were intended to grow over time so that trade in textiles and clothing could return to a system regulated under World Trade Organisation (WTO) rules involving tariffs, rather than quotas. The quotas and rates of quota growth over time were negotiated under bilateral agreements that applied over extended periods. Because neither the level
Transcript of China’s textile and clothing trade and 14 global...

303
China’s textile and clothing trade and global adjustment14
Will Martin
The year 2009 is proving to be a remarkable one in many respects. One of the most important of these from a trade perspective has received very little attention. This is the first year in half a century in which the world has not had a system of quotas to slow the growth of exports of textiles and clothing from developing countries in general, and particularly from China. That these quotas have been abolished seems remarkable given the intensity of the support for these quotas in earlier periods. Perhaps even more remarkable is the fact that they disappeared almost without trace in 2009, without evidence of the major disruption against which they were long seen as a bulwark. Have world textile-trade policymakers finally found the virtue they have long sought, but whose realisation they often seemed to defer (Reinert 2000)?
Quotas against exports of textiles and clothing from developing countries were introduced on a large scale in the 1960s, based on precedents of quotas used to slow the seemingly inexorable growth in exports of textiles and clothing from Japan in the 1930s. The quotas of the 1960s were partial in coverage, focusing on only textiles and clothing made from cotton, and from a relatively limited set of countries. As is frequently the case with quantitative restrictions, one set of restrictions begot another. In this case, the restrictions on cotton textiles created incentives for suppliers to use synthetics and other fibres, including such previously—and since—obscure fibres as ramie. As a result of these spill-over effects, a complex web of quotas covering a wide range of textile fibres was introduced under the Multi-Fibre Arrangement (MFA) in the 1970s and progressively tightened during the 1980s and early 1990s.
In principle, these quotas were intended to grow over time so that trade in textiles and clothing could return to a system regulated under World Trade Organisation (WTO) rules involving tariffs, rather than quotas. The quotas and rates of quota growth over time were negotiated under bilateral agreements that applied over extended periods. Because neither the level

China’s New Place in a World in Crisis
304
of the quotas nor their rates of growth responded to shifts in supply and/or demand, the protective effect of these quotas varied considerably across suppliers and with time. The resulting export barriers were a particularly serious problem for countries such as China that had quotas that were low relative to productive potential, and grew at rates that were low relative to the underlying growth in export supply. In this situation, the prices of scarce quotas could become very large relative to the net value of these exports. Given the importance of labour-intensive manufactured exports in labour-intensive countries such as China (Lin 2009), these quotas posed particular problems for developing countries attempting to develop through the expansion of labour-intensive exports.
In this short chapter, we first consider the evolution of the quotas on exports of textiles and clothing from China. Then, we look at the evidence available on the protective impacts of these quotas. Finally, we consider some of the implications of their abolition for the markets for clothing and textiles, and for China’s balance of agricultural trade.
The quotas on textiles and clothing
The quotas implemented under the MFA, and the Uruguay Round Agreement on Textiles and Clothing that succeeded it, were imposed after bilateral consultations between the importer and the exporter for particular products. These negotiations covered the size of the initial quotas and their rate of growth. The quotas were administered by the exporter, which was—perhaps because of the initially grey-area status of ‘voluntary export restrictions’ under General Agreement on Tariffs and Trade (GATT) rules—allowed to keep any quota rents associated with the quotas. Importers could potentially have imposed quotas against non-members of the GATT/WTO and kept the quota rents themselves, but they generally chose to follow similar procedures for members and non-members.
Large countries such as China were more likely to attract attention as their exports grew and hence to find themselves with limits that were small relative to their production potential. Perhaps for the same reason, China’s exports of textiles and clothing were subjected to lower growth rates than most other developing-country exporters. Another factor contributing to differences in quota growth rates during the period after 1994 was the Agreement on Textiles and Clothing under the Uruguay Round, which phased out the quotas on some products and increased the growth rates of the remaining export quotas from 1995 to 2004, before their planned

China’s textile and clothing trade and global adjustment
305
elimination in 2005. As is evident from Table 14.1, China’s quota growth rates in the US market for the decade to 2004–05 were particularly low relative to those of other countries. The fact that China was not a member of the GATT/WTO until 2001 also meant that China lacked access to mechanisms for challenging decisions about restrictions on her exports of textiles and clothing.
Table 14.1 Quota enlargement under the Agreement on Textiles and Clothing, 2004–1994 (percentagechangeforthefullperiod)
Textiles Clothing
European Union United States European Union United States
Bangladesh n .a . 168 n .a . 168China 50 33 38 41Hong Kong, China 16 37 22 17India 50 141 79 116Indonesia 83 134 117 133South Korea 70 37 38 12Pakistan 79 139 119 150Sri Lanka 134 204 132Philippines 134 112 119Thailand 59 127 116 123Taiwan, China 34 22 24 4Total 62 93 54 67
n .a . not available
Note:Basedonquotasandgrowthratesineffectatthebeginningoftheimplementationperiod.
Source:InternationalTextileandClothingBureau,Geneva.
Since the textile and clothing export quotas were scarce, they became valuable assets. While quotas were allocated in a variety of ways, trade between enterprises was allowed, with prices quoted widely, including through web sites such as <www.chinaquota.com>. The tradability of these quotas ensured that the opportunity cost of using a quota to export was broadly similar across enterprises. Since a quota had to be purchased—or the opportunity to sell a quota forgone—the quotas acted like an export tax in raising the cost of exporting textiles and clothing. With data on the cost of quotas and the export quota-inclusive price of exports, it became possible to estimate meaningful export tax equivalents for these quotas. Given the dynamism of China’s underlying export growth, her limited and slow-growing quotas for textile and clothing exports frequently translated into very high, and rising, export tax equivalents of these quotas.

China’s New Place in a World in Crisis
306
Using data on the prices of quota and the (quota price-inclusive) export unit values for a range of developing-country suppliers, Martin et al. (2004) estimate the export tax equivalents of quotas on exports of clothing from China to the European Union to have averaged 54 per cent in 2002–03 and 36 per cent on exports to the United States. These are high rates of export tax equivalent and could be expected to divert exports from China to other, non-restricted markets and to reduce exports overall. Two other notable features of the table are that, first, many exporters had zero or very low export barriers; given the size of their quotas, they were essentially unrestricted. Another feature was that the lower-income developing countries, such as China, India and Pakistan, had much higher tariff equivalents than the newly industrialising countries, which had largely lost comparative advantage in these products.
Table 14.2 Estimated export tax equivalents of quotas in key supplying regions, 2002–03 (per cent)
Textiles Clothing
European Union
United States
European Union
United States
Bangladesha n .a . 0 .0 n .a . 20 .4India 1 .0 3 .0 20 20Pakistana 9 .4 9 .8 9 .2 10 .3Chinaa 1 .0 20 .0 54 .0 36 .0Hong Kong, Chinaa 2 .1 0 .0 12 .3 2 .3Sri Lanka 1 .0 0 .0 0 .0 7 .0OtherEastAsiab 1 .0 0 .0 3 .0 7 .0Newly industrialising economiesc
1 .0 0 .0 0 .3 2 .5
n .a . not availableadenotesanestimatebasedonquotapriceinformationb based on Indonesia, Philippines and Thailand c South Korea and Taiwan, China
Note: Otherestimatesinterpolatedfromquotautilisationdata.
A key feature of the export tax equivalents in Table 14.2 is the very high values on exports of clothing from China to the United States and the European Union. A surprising feature is the very low apparent barrier to exports of textiles from China to the European Union. Another important feature of the table is the apparently very high barriers on exports of clothing from Bangladesh to the United States and the relatively high barriers on textiles and clothing from Pakistan. The broad pattern of

China’s textile and clothing trade and global adjustment
307
export tax equivalents appears to be similar to that contained in the Global Trade Analysis Project (GTAP) model (Nordas 2004:25), except that the GTAP numbers show an export tax equivalent of 20 per cent on textile exports into the European Union. The overall similarity of the estimates is reassuring given that these are central to any analysis of the implications of liberalisation, and that the GTAP estimates are derived using a completely different methodology—the gravity-model approach used by Francois and Spinanger (2000).
The policies of quota phase-out and export quota expansion under the Agreement on Textiles and Clothing (WTO 1995) could have been key influences on the export tax equivalents. A major objective of this agreement was to progressively return these sectors to normal market disciplines by a combination of accelerated growth in quotas and progressive abolition of quotas during the phase-out period up to 1 January 2005. The phasing out of quotas was not generally regarded as successful in achieving significant liberalisation because the quotas phased out were largely those in which developing countries had no comparative advantage. Given the diversity of China’s textile and clothing industry, however, it would have provided opportunities from unrestricted expansion in some products.
The high growth rates of quotas in many suppliers after the acceleration in their growth rates under the Agreement on Textiles and Clothing (Table 14.1) undoubtedly contributed to the relatively low average export tax equivalents observed in countries such as Pakistan, Sri Lanka, the Philippines and Thailand. In contrast, the low growth of China’s export quotas contributed to the emergence of high export tax equivalents on these exports by restricting their growth relative to the underlying shift in the supply of these exports. Effectively, this stored up adjustment that could otherwise have occurred smoothly during the 10-year phase-out period to the end of the quota phase-out. The low growth rates in mature exporters such as Hong Kong and South Korea were sufficient because these economies were rapidly losing comparative advantage in these products.
The average export tax equivalents of the quotas presented in Table 14.2 have the advantage of having been built up from information about the prices of quotas for particular product categories and the quota premium-inclusive unit values of exports. This has the advantage of allowing us to examine the differences in the export tax equivalents of quotas across products and over time. The 36 per cent average export tax equivalent for China’s exports to the United States involved positive export taxes on

China’s New Place in a World in Crisis
308
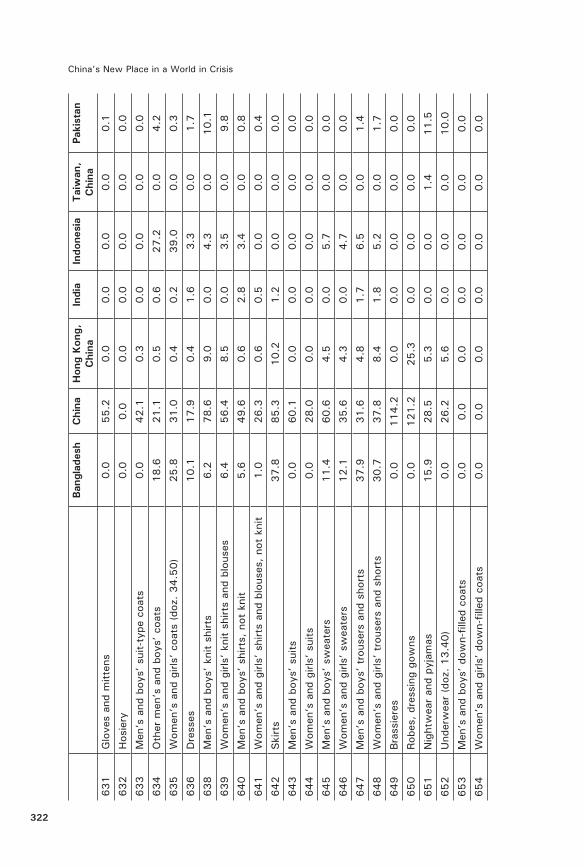
62 per cent of clothing products, with export tax equivalents ranging up to 192 per cent (on women’s knit shirts) (Martin et al. 2004). As shown in Appendix Table 14.1, many other popular clothing items, such as men’s and boys’ cotton trousers, also had very high export tax equivalents, making the impact of reform very sensitive to the treatment of individual categories—as well, of course, as raising the efficiency cost of the regime relative to a system involving more uniform rates of distortion.
The abolition of the export quotas on textile and clothing quotas imposed under the MFA was effective only for GATT members. This meant that quotas on China’s exports could have been continued, perhaps indefinitely. As part of China’s WTO accession package in 2001, China negotiated that the quotas against her exports would also be phased out by 2005. China was also to benefit from the abolition of quotas on some products and higher growth rates of quotas on products still under quotas. The accession agreement, however, introduced the possibility of these quotas being replaced by special textile ‘safeguard’ measures during the period 2005–08.
Under Paragraph 242 of the Report of the Working Party on China’s Accession to the WTO, other members were entitled to impose safeguard quotas against China during the period 2005–08. In mid-2005, the European Union reached an agreement with China that allowed the former to impose such quotas on selected products from China between 2005 and 2007 (EC 2005a, 2005b). In November 2005, the United States and China signed a memorandum of understanding allowing the United States to impose similar quotas against China between 2006 and 2008 (Governments of the United States of America and of the People’s Republic of China 2005). The European Commission made relatively minor revisions to its agreement in September 2005 to deal with unexpectedly large quantities of products in transit. The working party report allows all WTO members to impose these sanctions—irrespective of whether they previously imposed quotas—and some other countries have imposed quotas against China, although the European Union and the United States are by far the most important markets to have imposed these quotas.
The accession agreement specified that the special safeguard quotas were to be based on imports in 12 of the preceding 14 months and that the quotas should grow by at least 7.5 per cent per annum (WTO 2001). These quotas would have been very cumbersome to use, particularly because they could last no longer than one year at a time. Perhaps because of this,

China’s textile and clothing trade and global adjustment
309
the two major importers chose to negotiate larger quotas and higher growth rates than could potentially have been imposed under this provision of China’s accession agreement. The quotas imposed by the United States are compared with the levels of the corresponding quotas in 2004—the last year of the Agreement on Textiles and Clothing (Table 14.3).
A striking feature of Table 14.3 is just how much the quotas increased for the products that were covered by the post-Agreement on Textiles and Clothing safeguards imposed under the accession agreement. Many of these products—and particularly Category 338/339, 349/649 and 666—were subject to particularly high export tax equivalents, as is evident from Appendix Table 14.1. Much of the increase in the quotas shown in Table 14.3 is the result of the pent up need for adjustment associated with having low rates of quota growth in China—one of the most dynamic exporters in the world and the largest exporter whose exports were growing the most rapidly. Some of the quotas, however—on products such as knit fabric and special-purpose fabric, which had not previously been subject to tightly restrictive quotas—seemed to suggest the emergence of new sensitivities in the US market. The US agreement specified growth rates of 12.5 per cent for most products in 2007 and 2008, allowing significantly more than the minimum 7.5 per cent growth rate specified in China’s accession agreement.
The EC agreement with China also involved substantial increases in the levels of the quotas and in the growth rates for the products covered by the quotas (Table 14.4). In the case of the European Commission, the initial increases in the levels of the quotas averaged about 220 per cent, with increases in subsequent years of 10 or 12.5 per cent per annum. It appears likely that, as in the United States, in the European Commission, the increases between 2004 and 2006 would have been large enough to substantially reduce the adjustment pressures resulting from the low growth rates in China’s pre-accession textile and clothing export quotas.

China’s New Place in a World in Crisis
310
Tab
le 1
4.3
Quo
tas
impo
sed
by t
he U
nite
d Sta
tes
on e
xpor
ts f
rom
Chi
na
Cat
egor
yD
escr
iptio
nU
nits
2006 q
uota
2004 q
uota
Gro
wth
2006 v
s 2004 (
%)
200/301
Thr
ead
kg7 5
29 5
82
3 6
10 5
44
108 .5
222
Knitfabric
kg15 9
66 4
87
229
Special-purposefabric
kg33 1
62 0
19
332/432/632T
Cotton,wool,man-madefibresocks
DPR
64 3
86 8
41
42 4
33 9
90
51 .7
338/339
Cot
ton
knit
shirt
sdo
z .20 8
22 1
11
2 5
23 5
32
725 .1
340/640
Men
’s a
nd b
oys’
wov
en s
hirt
sdo
z .6 7
43 6
44
2 3
45 9
46
187 .5
345/645/646
Sw
eate
rsdo
z .8 1
79 2
11
1 0
30 3
48
693 .8
347/348
Men
’s a
nd b
oys’
cot
ton
trou
sers
doz .
19 6
66 0
49
2 4
21 9
22
712 .0
349/649
Brassieres
doz .
22 7
85 9
06
1 0
94 1
32
1982 .6
352/652
Underwear
doz .
18 9
48 9
37
5 2
76 7
45
259 .1
359S/659S
Sw
imw
ear
kg4 5
90 6
26
750 9
59
511 .3
363
Cot
ton
terr
y to
wel
sdo
z .103 3
16 8
73
24 7
73 1
09
317 .1
638/639
Men’sandboys’man-madefibreknitshirts
doz .
8 0
60 0
63
2 7
12 6
80
197 .1
647/648
Man-madefibretrousers
doz .
7 9
60 3
55
2 9
74 2
38
167 .6
666
Otherman-madefibrefurnishings
kg964 0
14
573 3
72
68 .1
847
Tro
user
s, s
hort
s, s
ilk,
etc .
doz .
17 6
47 2
55
1 4
52 9
72
1114 .6
Wei
ghte
d av
erag
e, 2
005 w
eigh
ts573
Not
e: G
row
th r
ate
wei
ghte
d by
impo
rt v
alue
sha
res .
Sou
rces
: <www.cpb.govwww.chinaquota.com>;<www.otexa.itc.gov>

China’s textile and clothing trade and global adjustment
311
Tab
le 1
4.4
Adj
ustm
ents
in C
hina
’s t
extil
e ex
port
quo
tas
to t
he E
urop
ean
Com
mun
ity
Cat
.Pr
oduc
tU
nit
2004 q
uota
*2005 q
uota
*2006 q
uota
*In
crea
se 2
006/0
4 (
%)
Gro
wth
rat
e (%
)
2Cottonfabric
tonn
e30 5
56
49 0
60
61 9
48
103
12 .5
4T-s
hirt
s1000
126 8
08
501 2
89
540 2
04
326
10
5Pu
llove
rs1000
39 4
22
231 0
47
189 7
19
381
10
6M
en’s
tro
user
s1000
40 9
13
336 3
72
338 9
23
728
10
7Blouses
1000
17 0
93
74 0
94
80 4
93
371
10
20
Bedlinen
tonn
e5681
14 0
28
15 7
95
178
12 .5
26
Dre
sses
1000
6645
24 6
49
27 0
01
306
10
31
Brassieres
1000
96 4
88
217 9
84
219 8
82
128
10
39
Tab
le li
nen
tonn
e5681
10 9
66
12 3
49
117
12 .5
115
Flax
yar
nto
nne
1413
4494
4740
235
10
Val
ue s
hare
wei
ghte
d to
tal
218
Sou
rces
: EuropeanCommission(EC)2005a,‘Commissionregulation(EC)no.1084/2005’,O
ffici
al J
ourn
al o
f th
e Eu
rope
an C
omm
issi
on,I.177/19,8
July2005;EuropeanCommission(EC)2005b,‘Commissionregulation(EC)no.1478/2005’,O
ffici
al J
ourn
al o
f th
e Eu
rope
an C
omm
issi
on,I.263/3,
12 S
epte
mbe
r 2005 .
China’s New Place in a World in Crisis
312
What has happened? Some key changes
As noted in Elbehri et al. (2003), one likely impact of quota abolition is an increase in the share of China and other quota-restricted exporters in the restricted markets. This reflects the fact that a primary effect of the quotas is to cause the more strongly restricted exporters to have low shares in the restricted markets and correspondingly high shares in unrestricted markets (Yang et al. 1997). Removal of highly restrictive export quotas can be expected to cause a large decline in the landed price of imports under these circumstances simply because exporters no longer have to use up expensive quotas whenever they export to restricted markets. The increase of imports in volume terms into the formerly restricted market is likely to be particularly sharp. The increase in value terms might be smaller because of the fall in the landed price of imports. As long as the demand for exports of an individual country is strongly price responsive, however, the value share of a country whose export quotas are being eliminated can be expected to increase. The share of China in the US market changed around the time of quota abolition (Table 14.5), as it did for the European Union-27 (Table 14.6).
Table 14.5 China’s value shares of US textile and clothing markets (per cent)
Year Textiles Clothing
Share Growth rate Share Growth rate
1999 11 .9 11 .9 13 .2 3 .92000 12 .2 15 .0 13 .3 15 .42001 12 .9 1 .7 14 .0 3 .92002 15 .8 35 .3 15 .1 8 .72003 19 .9 35 .3 16 .9 19 .22004 22 .3 27 .0 19 .0 19 .82005 26 .9 31 .8 26 .4 46 .92006 29 .6 14 .8 29 .4 15 .42007 31 .8 10 .1 33 .6 16 .92008 34 .1 2 .9 34 .7 0 .22009 35 .9 –14.9 39 .4 1 .6
Source: COMTRADE,exceptfor2009,whichwereestimatedusingOtexadataforthefirstquarterof2009.

China’s textile and clothing trade and global adjustment
313
Table 14.6 Changes in China’s value shares of EU-27 textile and clothing markets (per cent)
Year Textiles Clothing
China’s share Growth rate China’s share Growth rate
2001 12 .5 1 .2 21 .8 4 .42002 14 .5 16 .0 23 .8 15 .82003 16 .7 32 .4 25 .2 27 .62004 19 .1 36 .3 26 .9 25 .12005 23 .4 25 .3 35 .3 43 .42006 25 .6 21 .7 35 .0 12 .62007 27 .1 21 .0 38 .3 24 .02008 29 .8 12 .5 42 .8 23 .4
Source: ImportdatafromCOMTRADE.
A striking feature of Table 14.5 is the dramatic increase in China’s share of the US markets for textiles and apparel during the quota-abolition period. China’s share of imports began to grow in earnest in 2002, after China’s WTO accession, with the introduction of higher growth rates, the elimination of some quotas and with more rigorous multilateral disciplines on the introduction of new quotas. The rate of growth in China’s market share, however, increased substantially in 2005, when the quotas were initially lifted on all exports, but subsequently reimposed, at a higher level, as ‘safeguards’ against China’s exports. One factor contributing to the surge in exports in 2005 might have been the expectation that quotas would be reimposed in future years, combined with the expectation that quotas would be allocated within China based on the traditional system.1 With past performance playing a major role in quota allocation, firms had an incentive and an opportunity to expand their exports during the period that quotas did not apply so that they could earn quota allocations for future years. This growth in market share continued in subsequent years, with China’s share of clothing imports to the United States rising to almost 40 per cent in 2009. This increase was in the order of magnitude predicted by Nordas (2004), whose simulation modelling suggested that China’s share of the US market for apparel might reach 50 per cent.
Turning to the results for the European Union presented in Table 14.6, we also see large increases in China’s share of the import market. The results presented in Table 14.2 indicate that China’s share of the textile import market has increased to two and a half times its original level, while China’s import share in clothing has roughly doubled. These increases were much higher than the estimates of Nordas (2004), whose
China’s New Place in a World in Crisis
314
simulation estimates suggested only a marginal increase in China’s share of the EU textile market and an increase from 18 per cent to 29 per cent in its share of the clothing market.
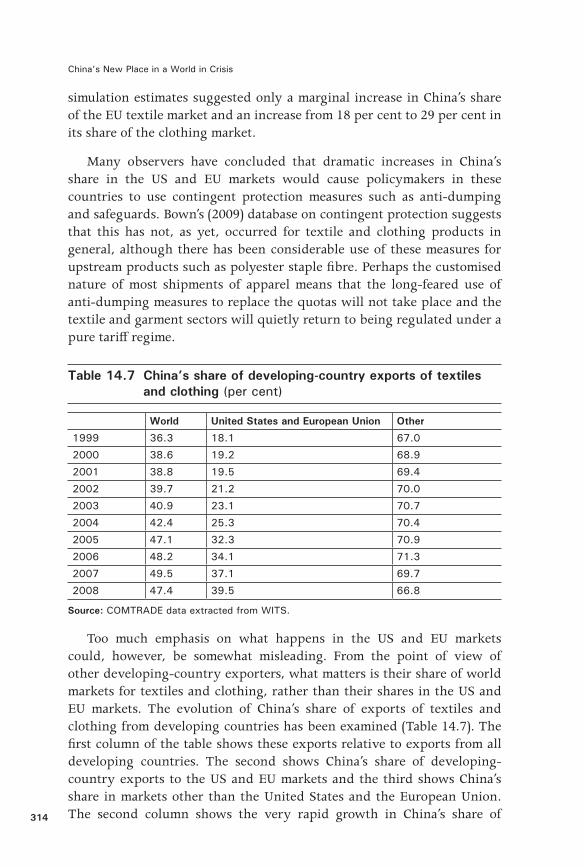
Many observers have concluded that dramatic increases in China’s share in the US and EU markets would cause policymakers in these countries to use contingent protection measures such as anti-dumping and safeguards. Bown’s (2009) database on contingent protection suggests that this has not, as yet, occurred for textile and clothing products in general, although there has been considerable use of these measures for upstream products such as polyester staple fibre. Perhaps the customised nature of most shipments of apparel means that the long-feared use of anti-dumping measures to replace the quotas will not take place and the textile and garment sectors will quietly return to being regulated under a pure tariff regime.
Table 14.7 China’s share of developing-country exports of textiles and clothing (per cent)
World United States and European Union Other
1999 36 .3 18 .1 67 .0
2000 38 .6 19 .2 68 .9
2001 38 .8 19 .5 69 .4
2002 39 .7 21 .2 70 .0
2003 40 .9 23 .1 70 .7
2004 42 .4 25 .3 70 .4
2005 47 .1 32 .3 70 .9
2006 48 .2 34 .1 71 .3
2007 49 .5 37 .1 69 .7
2008 47 .4 39 .5 66 .8
Source: COMTRADEdataextractedfromWITS.
Too much emphasis on what happens in the US and EU markets could, however, be somewhat misleading. From the point of view of other developing-country exporters, what matters is their share of world markets for textiles and clothing, rather than their shares in the US and EU markets. The evolution of China’s share of exports of textiles and clothing from developing countries has been examined (Table 14.7). The first column of the table shows these exports relative to exports from all developing countries. The second shows China’s share of developing-country exports to the US and EU markets and the third shows China’s share in markets other than the United States and the European Union. The second column shows the very rapid growth in China’s share of

China’s textile and clothing trade and global adjustment
315
exports seen in the previous tables. China’s share in markets other than the United States and the European Union has, however, been essentially static. Overall, China’s share of developing countries’ total exports has grown from 36 per cent to 47 per cent in the decade from 1999 to 2008. While this is a rapid increase in share, it seems likely to be considerably less alarming to competitors than the doubling of China’s share in the US and EU markets alone.
One key question underlying this table is whether the increase in China’s share reflects in part the extraordinary growth in China’s economy, and in overall exports, or whether it reflects something more specific to the textile sector. One measure that provides some insights into this question is the revealed comparative advantage (RCA) index. This measure adjusts for growth in overall exports by expressing the share of the good of interest in total exports of the country relative to the same good’s share in world exports, or the exports of another reference group. The RCA indexes for China relative to world exports (Table 14.8) reveal a steady downward trend in China’s RCA for textiles, clothing and for textiles and clothing combined. Given that abolition of the export quotas against China was essentially the only reduction in the trade barriers facing China brought about by China’s accession to the WTO (Ianchovichina and Martin 2004), one might have expected an increase in China’s RCA for textiles and clothing. The continuing downward trend in China’s RCA for these products suggests that other powerful forces—such as an accumulation of the factors used intensively in other exports or technological advances in other export sectors—are outweighing the effects of this liberalisation on China’s export mix. This is consistent with the observation in Dimaranan et al. (2007) that China’s list of top-25 exports is dominated by products such as computers and components and includes very few textile and clothing products. As noted by Martin and Manole (2008), however, and in the World Bank’s Global Economic Prospects 2004, many other developing countries have also been expanding their exports of non-traditional products very rapidly. When China’s RCA is calculated relative to exports from only developing countries other than China, as in the final column of Table 14.8, the decline in this RCA disappears.
The decline in the RCA for China’s clothing exports from 5 to 3 over 13 years translates into a decline of about 4 per cent per annum in the share of clothing exports in China’s total exports. Given the phenomenally high growth rate of China’s total exports for this period (19 per cent on average), even China’s exports of textiles and clothing are still growing

China’s New Place in a World in Crisis
316
extremely rapidly in absolute terms. If, however, the growth rate of China’s overall exports should decline, such a strong shift in comparative advantage would substantially reduce the growth rate in the volume of China’s exports.
Table 14.8 China’s revealed comparative advantage
Textilesa Clothinga Textiles and clothinga Textiles and clothingb
1995 2 .8 5 .0 3 .9 2 .6
1996 2 .6 5 .1 3 .9 2 .9
1997 2 .4 5 .0 3 .8 2 .8
1998 2 .3 4 .7 3 .6 2 .5
1999 2 .4 4 .6 3 .6 2 .5
2000 2 .4 4 .6 3 .6 2 .7
2001 2 .4 4 .2 3 .4 2 .5
2002 2 .4 3 .9 3 .2 2 .4
2003 2 .5 3 .7 3 .2 2 .3
2004 2 .5 3 .5 3 .1 2 .3
2005 2 .6 3 .5 3 .1 2 .5
2006 2 .6 3 .7 3 .2 2 .9
2007 2 .5 3 .6 3 .2 2 .8
2008 2 .5 3 .0 2 .8 2 .9
Notes: a calculatedrelativetoworldexports;b calculatedrelativetoexportsfromdevelopingcountries other than China .
One key feature of the expansion of China’s exports of textiles and clothing during the period of quota abolition has been rapid growth in China’s imports of fibres, textiles and clothing, particularly from developing countries. In the period from 1995 to 2008, China’s imports of these goods from developing countries grew by 14 per cent per annum, while imports of these goods from all sources rose by only 3.7 per cent per annum. Imports of cotton grew by 7 per cent per annum from all sources, but by 9.6 per cent per annum from developing countries. As noted by Martin et al. (2004), the growth of imports of inputs into the textile and clothing sector can be an important source of welfare gains to other developing countries, particularly to countries such as Pakistan, for which textile exports are hugely important, and for cotton exporters.

China’s textile and clothing trade and global adjustment
317
Conclusions
This study concludes that the quota regimes imposed under the MFA and the Agreement on Textiles and Clothing imposed very restrictive barriers against the expansion of textile and clothing exports from China. This restrictiveness was a consequence of the small initial quotas on China’s exports, the low rates of growth permitted under these arrangements and the fact that quota phase-out and quota growth increases allowed to other countries under the Uruguay Round agreement did not apply to China until after its accession to the WTO in 2001.
China’s WTO accession agreement allowed for textile safeguards that could apply between 2005 and 2008, after the quotas had been abolished for other WTO members. While many feared that these would be used in a very restrictive manner, their introduction appears to have involved a very substantial liberalisation of the market, with the quota levels and their growth rates both being much higher than under the earlier quota regimes.
China’s exports of textiles and clothing to the United States and the European Union increased rapidly after 2001, and particularly rapidly in 2005 and subsequent years. China’s shares of these markets grew dramatically—frequently doubling in less than a decade. China’s global export shares in textiles and clothing grew much less rapidly, since much of the expansion of these exports could arise from redirection of exports from other markets to the formerly restricted markets of the United States and the European Union. It turns out that China’s share of total global exports has also been growing, but much more slowly than her exports to the United States and the European Union. In fact, the evidence suggests that China’s underlying comparative advantage in textiles and clothing is declining relative to global exports because of China’s astoundingly successful expansion of other exports, particularly of products such as computers and components.

China’s New Place in a World in Crisis
318
References
Bown, C. 2009, Global Antidumping Database, Version 5.0 Beta, May, Brandeis University, The Brookings Institution and The World Bank (Development Research Group), <http://people.brandeis.edu/~cbown/global_ad/>
Dimaranan, B., Ianchovichina, E. and Martin, W. 2007, ‘Competing with giants: who wins, who loses?’, in L. A. Winters and S. Yusuf (eds), Dancing with Giants: China, India and the global economy, The World Bank and Institute of Policy Studies, Washington, DC, and Singapore.
Elbehri, A., Hertel, T. and Martin, W. 2003, ‘Estimating the impact of WTO and domestic reforms on the Indian cotton and textile sectors: a general equilibrium approach’, Review of Development Economics, vol. 7, no. 3, pp. 343–59.
European Commission (EC) 2005a, ‘Commission regulation (EC) no. 1084/2005’, Official Journal of the European Commission, I. 177/19, 8 July 2005.
—— 2005b, ‘Commission regulation (EC) no. 1478/2005’, Official Journal of the European Commission, I. 263/3, 12 September 2005.
Francois, J. F. and Spinanger, D. 2000, Hong Kong’s Textile and Clothing Industry: The impact of quotas, the UR and China’s WTO accession, Kiel Institute of World Economics, Kiel, Germany.
Governments of the United States of America and of the People’s Republic of China 2005, Memorandum of Understanding Between the Governments of the United States of America and of the People’s Republic of China Concerning Trade in Textiles and Apparel Products, Office of the US Trade Representative, Washington, DC, <www.ustr.gov>
Ianchovichina, E. and Martin, W. 2004, ‘Economic impacts of China’s accession to the WTO’, in D. Bhattasali, Shantong Li and W. Martin (eds), China and the WTO: Accession, policy reform and poverty reduction, Oxford University Press and The World Bank, Oxford and Washington, DC.
Lin, J. L. 2009, Economic Development and Transition: Thought, strategy and viability, Cambridge University Press, Cambridge.

China’s textile and clothing trade and global adjustment
319
Martin, W. and Manole, V. 2008, ‘China’s emergence as the workshop of the world’, in B. Fleisher, N. Hope, A. Pena and D. Yang (eds), Policy Reform and Chinese Markets: Progress and challenges, Edward Elgar, Northampton, Mass.
Martin, W., Manole, V. and van der Mensbrugghe, D. 2004, Dealing with diversity: analyzing the consequences of textile quota abolition, Paper presented to the Conference on Global Economic Analysis, Washington, DC, September, <https://www.gtap.agecon.purdue.edu/dresources/download/1845.pdf>
Nordas, H. 2004, The global textile and clothing industry post the Agreement on Textiles and Clothing, Discussion Paper no. 5, World Trade Organisation, Geneva.
Reinert, K. 2000, ‘Give us virtue, but not yet: safeguard actions under the Agreement on Textiles and Clothing’, World Economy, vol. 23, no. 1, pp. 25–54.
World Trade Organisation (WTO) 2001, Draft report of the working party on the accession of China, WT/MIN(01)/3, World Trade Organisation, Geneva.
Yang, Y., Martin, W. and Yanagishima, K. 1997, ‘Evaluating the benefits of abolishing the MFA in the Uruguay Round package’, in T. Hertel (ed.), Global Trade Analysis: Modelling and applications, Cambridge University Press, Cambridge.
Endnotes1. The system in use since the late 1990s involved allocating 70 per cent of the quota based on
past performance to restricted (70 per cent weight) and unrestricted (30 per cent weight) markets. The other 30 per cent of the quota was allocated through an auction system.

China’s New Place in a World in Crisis
320
App
endi
x 14.1
App
endi
x Tab
le 1
4.1
Exp
ort
tax
equi
vale
nts
of c
loth
ing
quot
as in
the
Uni
ted
Sta
tes
(per
cen
t)
Ban
glad
esh
Chi
naH
ong
Kon
g,
Chi
naIn
dia
Indo
nesi
aTai
wan
, C
hina
Paki
stan
237
Play
suits
, su
nsui
ts,
etc .
4 .2
3 .2
0 .0
0 .0
1 .1
0 .0
0 .0
239
Babies’garmentsandaccessories
0 .0
35 .8
0 .0
0 .0
0 .0
0 .0
0 .1
330
Handkerchiefs
0 .0
0 .0
0 .0
0 .0
0 .0
0 .0
0 .0
331
Glo
ves
and
mitt
ens
0 .0
112 .8
0 .0
0 .0
0 .0
0 .0
0 .3
332
Hos
iery
0 .0
0 .0
0 .0
14 .3
0 .0
0 .0
0 .0
333
Men
’s a
nd b
oys’
sui
t-ty
pe c
oats
0 .0
0 .0
0 .0
0 .0
0 .0
0 .0
0 .0
334
Othermen’sandboys’coats
22 .3
37 .3
0 .0
0 .6
7 .8
0 .0
3 .7
335
Wom
en’s
and
girl
s’ c
oats
9 .1
44 .4
0 .0
0 .2
7 .9
0 .3
0 .2
336
Dre
sses
11 .6
34 .3
0 .0
1 .8
4 .5
0 .0
2 .5
338
Men
’s a
nd b
oys’
kni
t sh
irts
43 .9
23 .2
0 .0
2 .2
9 .3
9 .4
11 .1
339
Wom
en’s
and
girl
s’ k
nit
shirt
s an
d bl
ouse
s44 .8
191 .4
0 .0
2 .5
10 .3
11 .8
8340
Men
’s a
nd b
oys’
shi
rts,
not
kni
t6 .7
60 .8
0 .0
2 .6
2 .7
0 .0
0 .6
341
Wom
en’s
and
girl
s’ s
hirt
s, n
ot k
nit
1 .9
68 .7
0 .0
1 .1
2 .8
0 .0
0 .3
342
Ski
rts
43 .7
143 .5
0 .0
1 .2
16 .5
0 .0
0 .2
345
Sw
eate
rs0 .0
42 .3
0 .0
0 .0
17 .5
0 .0
0 .0
347
Men
’s a
nd b
oys’
tro
user
s an
d sh
orts
73 .2
94 .2
0 .0
4 .5
17 .9
4 .8
31 .1
348
Wom
en’s
and
girl
s’ t
rous
ers
and
shor
ts74 .5
77 .2
0 .0
4 .6
17 .8
3 .8
36 .2
349
Brassieres
0 .0
0 .0
0 .0
0 .0
0 .0
0 .0
0 .0
350
Rob
es, dr
essi
ng g
owns
0 .0
0 .0
0 .0
0 .0
0 .0
0 .0
0 .0

China’s textile and clothing trade and global adjustment
321
Ban
glad
esh
Chi
naH
ong
Kon
g,
Chi
naIn
dia
Indo
nesi
aTai
wan
, C
hina
Paki
stan
351
Nig
htw
ear
and
pyja
mas
17 .0
57 .2
0 .0
1 .8
14 .5
0 .0
10 .4
352
Underwear
6 .6
47 .9
3 .0
0 .0
0 .0
0 .0
13 .0
353
Men’sandboys’down-filledcoats
0 .0
0 .0
0 .0
0 .0
0 .0
0 .0
0 .0
354
Women’sandgirls’down-filledcoats
0 .0
0 .0
0 .0
0 .0
0 .0
0 .0
0 .0
359
Othercottonapparel
0 .0
13 .5
3 .7
9 .0
0 .0
0 .0
0 .4
431
Glo
ves
and
mitt
ens
0 .0
0 .0
0 .0
0 .0
0 .0
0 .0
0 .0
432
Hos
iery
0 .0
0 .0
0 .0
0 .0
0 .0
0 .0
0 .0
433
Men
’s a
nd b
oys’
sui
t co
ats
0 .0
30 .1
0 .0
0 .0
0 .0
0 .0
0 .0
434
Othermen’sandboys’coats
0 .0
30 .5
3 .7
0 .0
0 .0
0 .0
0 .0
435
Wom
en’s
and
girl
s’ c
oats
0 .0
52 .0
1 .3
0 .0
0 .0
0 .0
0 .0
436
Dre
sses
0 .0
16 .2
0 .6
0 .0
0 .0
0 .0
0 .0
438
Kni
t sh
irts
and
blou
ses
0 .0
34 .7
0 .7
0 .0
0 .0
0 .0
0 .0
439
Babies’garmentsandaccessories
0 .0
0 .0
0 .0
0 .0
0 .0
0 .0
0 .0
440
Shi
rts
and
blou
ses,
not
kni
t0 .0
0 .0
0 .0
0 .0
0 .0
0 .0
0 .0
442
Ski
rts
0 .0
11 .9
1 .9
0 .0
0 .0
0 .0
0 .0
443
Men
’s a
nd b
oys’
sui
ts
0 .0
40 .2
0 .0
0 .0
0 .0
0 .0
0 .0
444
Wom
en’s
and
girl
s’ s
uits
0 .0
10 .7
0 .0
0 .0
0 .0
0 .0
0 .0
445
Men
’s a
nd b
oys’
sw
eate
rs0 .0
31 .0
10 .0
0 .0
0 .0
0 .0
0 .0
446
Wom
en’s
and
girl
s’ s
wea
ters
0 .0
35 .3
11 .2
0 .0
0 .0
0 .0
0 .0
447
Men
’s a
nd b
oys’
tro
user
s an
d sh
orts
0 .0
41 .6
4 .5
0 .0
0 .0
0 .0
0 .0
448
Wom
en’s
and
girl
s’ t
rous
ers
and
shor
ts
0 .0
22 .7
6 .6
0 .0
0 .0
0 .0
0 .0
459
Otherwoolapparel
0 .0
0 .0
0 .0
1 .7
0 .0
0 .0
0 .0
630
Handkerchiefs
0 .0
0 .0
0 .0
0 .0
0 .0
0 .0
0 .0
China’s New Place in a World in Crisis
322
Ban
glad
esh
Chi
naH
ong
Kon
g,
Chi
naIn
dia
Indo
nesi
aTai
wan
, C
hina
Paki
stan
631
Glo
ves
and
mitt
ens
0 .0
55 .2
0 .0
0 .0
0 .0
0 .0
0 .1
632
Hos
iery
0 .0
0 .0
0 .0
0 .0
0 .0
0 .0
0 .0
633
Men
’s a
nd b
oys’
sui
t-ty
pe c
oats
0 .0
42 .1
0 .3
0 .0
0 .0
0 .0
0 .0
634
Othermen’sandboys’coats
18 .6
21 .1
0 .5
0 .6
27 .2
0 .0
4 .2
635
Wom
en’s
and
girl
s’ c
oats
(do
z . 3
4 .5
0)
25 .8
31 .0
0 .4
0 .2
39 .0
0 .0
0 .3
636
Dre
sses
10 .1
17 .9
0 .4
1 .6
3 .3
0 .0
1 .7
638
Men
’s a
nd b
oys’
kni
t sh
irts
6 .2
78 .6
9 .0
0 .0
4 .3
0 .0
10 .1
639
Wom
en’s
and
girl
s’ k
nit
shirt
s an
d bl
ouse
s6 .4
56 .4
8 .5
0 .0
3 .5
0 .0
9 .8
640
Men
’s a
nd b
oys’
shi
rts,
not
kni
t5 .6
49 .6
0 .6
2 .8
3 .4
0 .0
0 .8
641
Wom
en’s
and
girl
s’ s
hirt
s an
d bl
ouse
s, n
ot k
nit
1 .0
26 .3
0 .6
0 .5
0 .0
0 .0
0 .4
642
Ski
rts
37 .8
85 .3
10 .2
1 .2
0 .0
0 .0
0 .0
643
Men
’s a
nd b
oys’
sui
ts0 .0
60 .1
0 .0
0 .0
0 .0
0 .0
0 .0
644
Wom
en’s
and
girl
s’ s
uits
0 .0
28 .0
0 .0
0 .0
0 .0
0 .0
0 .0
645
Men
’s a
nd b
oys’
sw
eate
rs11 .4
60 .6
4 .5
0 .0
5 .7
0 .0
0 .0
646
Wom
en’s
and
girl
s’ s
wea
ters
12 .1
35 .6
4 .3
0 .0
4 .7
0 .0
0 .0
647
Men
’s a
nd b
oys’
tro
user
s an
d sh
orts
37 .9
31 .6
4 .8
1 .7
6 .5
0 .0
1 .4
648
Wom
en’s
and
girl
s’ t
rous
ers
and
shor
ts30 .7
37 .8
8 .4
1 .8
5 .2
0 .0
1 .7
649
Brassieres
0 .0
114 .2
0 .0
0 .0
0 .0
0 .0
0 .0
650
Rob
es, dr
essi
ng g
owns
0 .0
121 .2
25 .3
0 .0
0 .0
0 .0
0 .0
651
Nig
htw
ear
and
pyja
mas
15 .9
28 .5
5 .3
0 .0
0 .0
1 .4
11 .5
652
Underwear(doz.13.40)
0 .0
26 .2
5 .6
0 .0
0 .0
0 .0
10 .0
653
Men’sandboys’down-filledcoats
0 .0
0 .0
0 .0
0 .0
0 .0
0 .0
0 .0
654
Women’sandgirls’down-filledcoats
0 .0
0 .0
0 .0
0 .0
0 .0
0 .0
0 .0

China’s textile and clothing trade and global adjustment
323
Ban
glad
esh
Chi
naH
ong
Kon
g,
Chi
naIn
dia
Indo
nesi
aTai
wan
, C
hina
Paki
stan
659
Otherman-madefibreapparel
0 .0
9 .2
2 .3
15 .7
0 .0
0 .0
0 .3
831
Glo
ves
and
mitt
ens
0 .0
0 .0
0 .0
0 .0
0 .0
0 .0
0 .0
832
Hos
iery
0 .0
0 .0
0 .0
0 .0
0 .0
0 .0
0 .0
833
Men
’s a
nd b
oys’
sui
t-ty
pe c
oats
0 .0
0 .0
0 .0
0 .0
0 .0
0 .0
0 .0
834
Othermen’sandboys’coats
0 .0
0 .0
0 .0
0 .0
0 .0
0 .0
0 .0
835
Wom
en’s
and
girl
s’ c
oats
0 .0
0 .0
0 .0
0 .0
0 .0
0 .0
0 .0
836
Dre
sses
(do
z .)
0 .0
0 .0
0 .0
0 .0
0 .0
0 .0
0 .0
838
Kni
t sh
irts
and
blou
ses
0 .0
0 .0
0 .0
0 .0
0 .0
0 .0
0 .0
839
Babies’garmentsandaccessories
0 .0
0 .0
0 .0
0 .0
0 .0
0 .0
0 .0
840
Shi
rts
and
blou
ses,
not
kni
t0 .0
0 .0
0 .0
0 .0
0 .0
0 .0
0 .0
842
Ski
rts
(doz
.)0 .0
0 .0
0 .0
0 .0
0 .0
0 .0
0 .0
843
Men
’s a
nd b
oys’
sui
ts
0 .0
0 .0
0 .0
0 .0
0 .0
0 .0
0 .0
844
Wom
en’s
and
girl
s’ s
uits
0 .0
47 .4
0 .0
0 .0
0 .0
0 .0
0 .0
845
Sweaters,non-cottonvegetablefibres
0 .0
13 .4
1 .0
0 .0
0 .0
0 .0
0 .0
846
Sweaters,ofsilkblends
0 .0
2 .7
0 .5
0 .0
0 .0
0 .0
0 .0
847
Tro
user
s an
d sh
orts
22 .5
0 .0
0 .0
0 .0
0 .0
0 .0
0 .0
850
Rob
es, dr
essi
ng g
owns
, et
c .0 .0
0 .0
0 .0
0 .0
0 .0
0 .0
0 .0
851
Nig
htw
ear
and
pyja
mas
0 .0
0 .0
0 .0
0 .0
0 .0
0 .0
0 .0
852
Underwear
0 .0
0 .0
0 .0
0 .0
0 .0
0 .0
0 .0
858
Nec
kwea
r 0 .0
0 .0
0 .0
0 .0
0 .0
0 .0
0 .0
859
Otherapparel
0 .0
0 .0
0 .0
0 .0
0 .0
0 .0
0 .0
Ave
rage
20 .4
36 .1
2 .3
1 .9
6 .4
0 .8
10 .3
Mem
o: %
with
pos
itive
exp
ort
tax
equi
vale
nts
31 .4
61 .6
34 .9
34 .9
27 .9
8 .1
32 .6