CHINA'S NEXT 100 GLOBAL GIANTS (2020 EDITION)
40
CHINA'S NEXT 100 GLOBAL GIANTS (2020 EDITION)
Transcript of CHINA'S NEXT 100 GLOBAL GIANTS (2020 EDITION)

CHINA'S NEXT 100 GLOBAL GIANTS (2020 EDITION)

2
Contents
1. Abstract 4
2. Evaluation System 7
3. How China’s Next 100 Global Giants (2020 Edition) were Ranked 13
4. A Review of the 2018 Ranking 18
5. Geographical Distribution of the Next 100 Global Giants 22
6. Distribution of Industries in the Next 100 Global Giants 23
7. Listing Locations of the Next 100 Global Giants 25
8. Future Outlook 26
9. Cases of Next 100 Global Giants 28
10. Appendix: Participating companies and data sources 34
11. Ranking of China’s Next 130 Global Giants (Enterprises Above the Designated Size) 36
3
CHINA’S NEXT 100 GLOBAL GIANTS (2020 EDITION)
Abstract
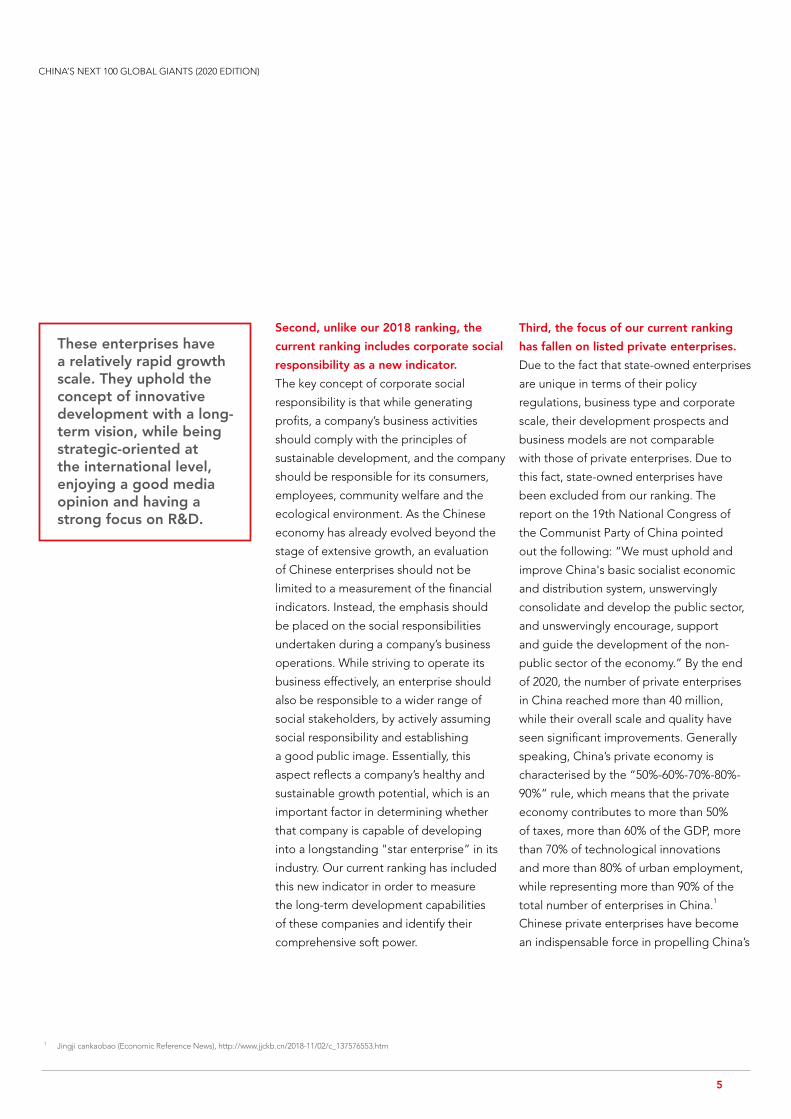
Through the effective implementation of strategic plans, many companies included in the ranking have obtained great potential to become the future leader in the sector after seizing market opportunities successfully and achieving effective growth over the past few years.
Since the publication of China’s Next
100 Global Giants (2018 Edition), a series
of major uncertainties have emerged
that have led to upheavals in world
politics and the economic environment.
The global outbreak of COVID-19 has
directly impacted the production and
operations of various enterprises, while
Sino-U.S. relations are experiencing an
unprecedented period of difficulty, which
has created growth constraints for certain
Chinese companies in key technological
areas. Faced with the impact of these
uncertainties, some companies have been
struggling to survive, while others have
proactively taken solid steps to grow into
world-class enterprises by continuously
improving their market competitiveness.
Some of the companies included in our
2018 ranking, such as CVTE and LY iTECH,
have become industry leaders and entered
a stage of steady development; therefore,
they should no longer remain among the
“Next 100 Global Giants” which is forward-
looking in nature. In addition, through the
effective implementation of strategic plans,
many companies that were not previously
included in the ranking have proven
themselves by successfully seizing market
opportunities and achieving effective
growth over the past few years, thus
demonstrating their significant potential
to become future industry leaders and
satisfying the criteria for inclusion on the
2020 list of China’s Next 100 Global Giants.
In order to discover China’s next generation
of top companies with the largest growth
potential in an ever-changing market,
while ensuring the timeliness and validity
of the list, ACCA has entered into a
collaboration with the Shenzhen Finance
Institute to conduct research and analyses
on nearly 4,000 private enterprises listed
in mainland China or abroad. On the basis
of these findings, we have compiled the
ranking of China’s Next 100 Global Giants
(2020 Edition). This report also includes a
review of the market performance of the
companies included on our 2018 list, which
reveals that the return on equity of these
companies has generally outperformed
the market standards – evidence of the
scientific validity of our ranking system.
We have followed the structure of our
2018 report and created our ranking by
employing the criteria described below:
First of all, the current ranking is based
on a number of diverse indicators.
The factors considered include the
company’s size, growth, profitability,
innovativeness, level of internationalisation
and others. Besides including a diverse set
of indicators in the evaluation system, our
research team has also adopted a machine
learning-based natural language analytical
method and designed a specialised
indicator to measure the media opinion of
each company. By utilising cutting-edge
technology, we can now make better use of
the publicly available sources in the market
and conduct a more in-depth analysis.
4
Second, unlike our 2018 ranking, the
current ranking includes corporate social
responsibility as a new indicator.
The key concept of corporate social
responsibility is that while generating
profits, a company’s business activities
should comply with the principles of
sustainable development, and the company
should be responsible for its consumers,
employees, community welfare and the
ecological environment. As the Chinese
economy has already evolved beyond the
stage of extensive growth, an evaluation
of Chinese enterprises should not be
limited to a measurement of the financial
indicators. Instead, the emphasis should
be placed on the social responsibilities
undertaken during a company’s business
operations. While striving to operate its
business effectively, an enterprise should
also be responsible to a wider range of
social stakeholders, by actively assuming
social responsibility and establishing
a good public image. Essentially, this
aspect reflects a company’s healthy and
sustainable growth potential, which is an
important factor in determining whether
that company is capable of developing
into a longstanding "star enterprise” in its
industry. Our current ranking has included
this new indicator in order to measure
the long-term development capabilities
of these companies and identify their
comprehensive soft power.
Third, the focus of our current ranking
has fallen on listed private enterprises.
Due to the fact that state-owned enterprises
are unique in terms of their policy
regulations, business type and corporate
scale, their development prospects and
business models are not comparable
with those of private enterprises. Due to
this fact, state-owned enterprises have
been excluded from our ranking. The
report on the 19th National Congress of
the Communist Party of China pointed
out the following: “We must uphold and
improve China's basic socialist economic
and distribution system, unswervingly
consolidate and develop the public sector,
and unswervingly encourage, support
and guide the development of the non-
public sector of the economy.” By the end
of 2020, the number of private enterprises
in China reached more than 40 million,
while their overall scale and quality have
seen significant improvements. Generally
speaking, China’s private economy is
characterised by the “50%-60%-70%-80%-
90%” rule, which means that the private
economy contributes to more than 50%
of taxes, more than 60% of the GDP, more
than 70% of technological innovations
and more than 80% of urban employment,
while representing more than 90% of the
total number of enterprises in China.1
Chinese private enterprises have become
an indispensable force in propelling China’s
These enterprises have a relatively rapid growth scale. They uphold the concept of innovative development with a long-term vision, while being strategic-oriented at the international level, enjoying a good media opinion and having a strong focus on R&D.
Jingji cankaobao (Economic Reference News), http://www.jjckb.cn/2018-11/02/c_137576553.htm 1
CHINA’S NEXT 100 GLOBAL GIANTS (2020 EDITION)
5
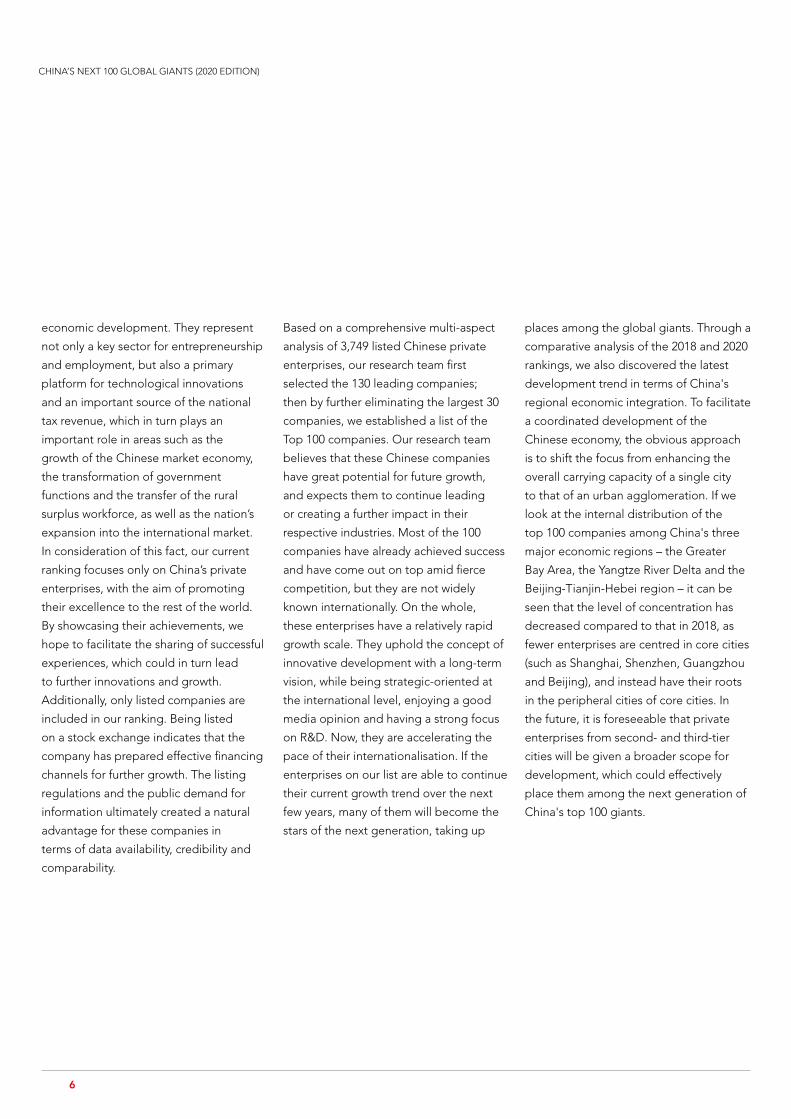
Based on a comprehensive multi-aspect
analysis of 3,749 listed Chinese private
enterprises, our research team first
selected the 130 leading companies;
then by further eliminating the largest 30
companies, we established a list of the
Top 100 companies. Our research team
believes that these Chinese companies
have great potential for future growth,
and expects them to continue leading
or creating a further impact in their
respective industries. Most of the 100
companies have already achieved success
and have come out on top amid fierce
competition, but they are not widely
known internationally. On the whole,
these enterprises have a relatively rapid
growth scale. They uphold the concept of
innovative development with a long-term
vision, while being strategic-oriented at
the international level, enjoying a good
media opinion and having a strong focus
on R&D. Now, they are accelerating the
pace of their internationalisation. If the
enterprises on our list are able to continue
their current growth trend over the next
few years, many of them will become the
stars of the next generation, taking up
places among the global giants. Through a
comparative analysis of the 2018 and 2020
rankings, we also discovered the latest
development trend in terms of China's
regional economic integration. To facilitate
a coordinated development of the
Chinese economy, the obvious approach
is to shift the focus from enhancing the
overall carrying capacity of a single city
to that of an urban agglomeration. If we
look at the internal distribution of the
top 100 companies among China's three
major economic regions – the Greater
Bay Area, the Yangtze River Delta and the
Beijing-Tianjin-Hebei region – it can be
seen that the level of concentration has
decreased compared to that in 2018, as
fewer enterprises are centred in core cities
(such as Shanghai, Shenzhen, Guangzhou
and Beijing), and instead have their roots
in the peripheral cities of core cities. In
the future, it is foreseeable that private
enterprises from second- and third-tier
cities will be given a broader scope for
development, which could effectively
place them among the next generation of
China's top 100 giants.
CHINA’S NEXT 100 GLOBAL GIANTS (2020 EDITION)
economic development. They represent
not only a key sector for entrepreneurship
and employment, but also a primary
platform for technological innovations
and an important source of the national
tax revenue, which in turn plays an
important role in areas such as the
growth of the Chinese market economy,
the transformation of government
functions and the transfer of the rural
surplus workforce, as well as the nation’s
expansion into the international market.
In consideration of this fact, our current
ranking focuses only on China’s private
enterprises, with the aim of promoting
their excellence to the rest of the world.
By showcasing their achievements, we
hope to facilitate the sharing of successful
experiences, which could in turn lead
to further innovations and growth.
Additionally, only listed companies are
included in our ranking. Being listed
on a stock exchange indicates that the
company has prepared effective financing
channels for further growth. The listing
regulations and the public demand for
information ultimately created a natural
advantage for these companies in
terms of data availability, credibility and
comparability.
6
Evaluation System
The evaluation system we used for our ranking of the companies is based on analyses of the historical performance and future growth, where both are considered as indispensable.
The evaluation system we used for our
ranking of the companies is based on
analyses of the historical performance and
future growth, where both are considered
as indispensable. The company’s historical
performance represents its past business
achievement. It also shows the market’s
recognition of the company’s operations,
corporate strategy and business model,
and serves as a basis for the company’s
future growth. By reviewing a company’s
historical indicators, its future growth can be
predicted to some extent, but an analysis
that solely considers the historical indicators
undoubtedly has some limitations. In
particular, the company's ability to grasp
future market opportunities is what will
determine its future growth potential.
With regard to the historical performance,
our research team designed the following 5
indicators: corporate scale (sales revenue),
growth, rate of return, earnings quality and
cash flow. For the company’s future growth,
our research team designed a further 7
indicators: R&D investment, investable
index, CapEx (capital expenditure),
overseas strategy, industry prospects,
media opinion and social responsibility.
Compared with the evaluation system
employed in 2018, the 2020 ranking
has added "social responsibility" as a
new indicator for the domestic listed
companies, with an emphasis on
measuring the comprehensive soft power
of their business operations in driving
sustainable development. Furthermore, in
order to avoid discrepancies in the ranking
due to volatility of the raw data within any
particular year, the current ranking only
includes listed private enterprises that
have raw data available for two or more
consecutive years between 2018 and 2020.
Based on each individual indicator, our
research team arranged all 3,749 selected
companies into 100 equal groups, and
assigned them with scores in order from
1 to 100. A score of 1 meant the company
belonged to the group with the lowest rank
for that individual indicator; while a score
of 100 meant the company belonged to
the group with the highest rank. Then, our
company evaluation system took the simple
average of each company’s scores in all 12
indicators as the final score, and our ranking
was entirely based on this score.
Specific details of the indicators are
as follows.
1. Corporate scale. Our research team
measured the size of each company by
considering its sales revenue, which allowed
for a better measurement of the company’s
development dynamics. The corporate
scale of a company reflects its market
position, and also represents the market
recognition of its business operations, to
a certain extent. A sustainable and stable
sales revenue is the basis for a company to
maintain its existing market presence and to
seize future market opportunities.
CHINA’S NEXT 100 GLOBAL GIANTS (2020 EDITION)
7
2. Growth. The growth rate of the sales
revenue is an indicator of the company’s
ability to grow. When the company’s
products are increasingly competitive and
its business model creates more economic
added value, it will enjoy better market
prospects. In general, the higher the
company’s growth rate, the stronger its
competitiveness in its respective industry.
3. Rate of return. The rate of return on
the net assets represents the ratio of a
company’s net profit to its ownership
interest, and it is one of the key indicators
for the ongoing survival of the company.
The basis for the development of
an enterprise is its profitability and
comparative advantages. Good profitability
means the business model, long-
term and short-term strategy and core
competitiveness can bring added value
to the company, as well as providing a
competitive edge over its competitors in
the future.
4. Earnings quality. The profit level of a
company reflects its profitability; however,
due to the presence of the practice of
earnings manipulation, it is especially
important to consider the quality of
the earnings. A better earnings quality
means that the metrics for measuring a
company’s growth are more credible and
predictive, while the earnings are also more
sustainable. At the same time, companies
with a higher earnings quality carry less
risk, representing a stronger commitment
to their investors and other stakeholders as
well as better sustainability of their existing
development models. A company could
manipulate its earnings data in the books
mainly through transactions that involve
Our research team have designed 12 indicators, 5 for historical performance and 7 for future growth of the company.
CHINA’S NEXT 100 GLOBAL GIANTS (2020 EDITION)
8
non-cash settlements, such as accounts
receivable, accounts payable and other
corresponding transactions. Our research
team considers such accounting profits
as the accounting accruals, which is a
company’s net profit minus the net cash
flow from its operating activities; while
the earnings quality is determined by
calculating the ratio of the accounting
accruals to the total assets. According
to contemporary academic findings,
corporate earnings with higher accruals
tend to have lower sustainability, and thus
a lower earnings quality. As a result, a
higher value in this indicator resulted in a
lower score in our ranking.
5. Cash flow. This indicator shows the ratio
of the cash flow generated by a company’s
operating activities to total assets, and
represents the ability of a company to
generate cash through its main business.
The higher the ratio, the greater is the
cash flow from the company’s operating
activities. An abundant cash flow indicates
the ability of the company to solve any
financial constraints related to its future
development with internal funds. At the
same time, since the surplus reported by a
company could possibly be manipulated,
the cash flow, to a certain extent, should be
considered together with the sales revenue
to obtain a better picture of the company's
actual surplus funds.
6. R&D investment. This indicator
shows the proportion of a company’s
corporate R&D investment compared
to its sales revenue. An improvement
in a company’s technological research
capability represents an enhancement of
its core competitiveness, which also means
it has a better ability to learn and make
use of new technological advancements.
Therefore, the importance and implications
of the internal R&D investment to develop
technological innovations are self-evident.
Companies with a larger R&D investment
will tend to adopt a differentiated strategy
for the future, in order to gain economic
added value and a better growth potential.
7. Investable index. Our investable index
takes the form of an F-score, based on
a set of investment strategy metrics that
were designed and developed by Joseph
Piotroski from Stanford University in 20002.
A company’s satisfactory performance
in these metrics will help to boost its
ROI. There are 9 financial fundamentals
of a company that are embedded in the
investable index, which include profitability,
solvency, sources of capital and operating
efficiency, among others.
Specifically, with 9 points as the full score,
a company scores 1 point if it satisfies each
of the following conditions: positive return
on assets, positive operating cash flow,
Through machine learning and natural language processing, our research team constructed a text-based method to measure the evaluation variables for the level of corporate social responsibility.
Piotroski, J.. 2000. Value Investing: The Use of Historical Financial Statement Information to Separate Winners from Losers. Journal of Accounting Research Vol 38: 1-41.2
CHINA’S NEXT 100 GLOBAL GIANTS (2020 EDITION)
9

CHINA’S NEXT 100 GLOBAL GIANTS (2020 EDITION)
positive asset income growth, negative
difference between the net profit and
operating cash flow, decreasing long-
term debt ratio, increasing liquidity
ratio, no new issuing of ordinary shares,
increasing gross profit margin, and an
increasing asset turnover. This indicator
comprehensively reflects a company’s
financial fundamentals, and having good
fundamentals at present is the basis
for its future development prospects.
Nonetheless, this indicator also has certain
overlaps with the other indicators in the
current evaluation system. By including
this indicator in the evaluation system, our
research team has effectively increased
the weight of the relevant indicators that
investors should focus on.
8. CapEx. This indicator shows the
ratio of a company’s current investment
in fixed assets to its total assets at the
beginning of the period, which represents
the maintenance or expansion of the
company’s business scale. A rational
expansion indicates that the company
is capable of seizing investment
opportunities and also reflects the
development and enlargement of its
business activities and operations – which
are necessary ingredients for a company’s
organic growth. As such, this indicator can
be used to define the future growth of the
company.
9. Overseas strategy. We used this
indicator to evaluate a company’s overseas
strategy in a holistic manner. Accordingly,
our research team calculated the
percentage of a company’s overseas sales
revenue in terms of its total sales revenue,
and established a score based on the
result. The highest score was 95 points.
A score of 1 was given if the company’s
financial report did not disclose its
overseas sales revenue. Additionally, we
understood that overseas financing is an
important part of a company’s overseas
strategy, and many companies listed
overseas rely on this very status in order
to expand their overseas operations and
to position themselves for future overseas
development. Therefore, taking this into
account, if a company was listed overseas
10
CHINA’S NEXT 100 GLOBAL GIANTS (2020 EDITION)
but did not disclose the specific amount of
its overseas sales, 5 points were added.
10. Industry prospects. This indicator
shows the development prospects of the
industry to which the company belongs.
Our research team established the
average sales growth rate and average
return on assets per industry for all the
listed companies, which also represents
the growth of the individual industries. The
companies were given a score based on
these rates and were ranked accordingly.
It must be noted that the growth of an
individual industry is not only driven by
the industry’s inherent development
potential, but is also influenced by the
relevant policy support, and therefore our
research team also included government
support as one of the factors to consider.
For the companies that belong to certain
key industries highlighted for support
in the "Outline of the 14th Five-Year
Plan for National Economic and Social
Development of the People's Republic
of China and the Long-Range Objectives
Through the Year 2035", a score of 100 was
given to the policy support. To determine
the final score of the industry prospects,
a simple average was calculated from
the scores of the industry growth and the
policy support.
11. Media opinion. This indicator
represents how the media, as an
information agency, reports on the
company. While public information such
as financial reports and announcements
from a company are readily available,
news reports often contain additional
information beyond these documents,
as well as private information from
other sources; therefore, we considered
the analysis of the media opinion of a
company as an important supplement to
the aforementioned financial indicators. By
making full use of other public information
sources available in the market, an
enterprise’s development prospects and
potential issues can be explored. In this
regard, our research team considered
the relevant news opinions and media
coverage of the companies, and these
two aspects were matched, analysed
and evaluated together to examine the
forward-looking role that media opinion
plays in the development of a company. To
examine the opinions of the news media,
specifically with regards to their taking
positions, our research team cooperated
with DataGo – an independent database
developer. Through machine learning
and natural language processing, we
sorted, analysed and verified the collected
original news items meticulously and
quantified each news opinion. Specifically,
the quantification process utilised machine
learning to label every sentence in a news
report as positive, negative or neutral.
The value of the news opinion for the
entire piece of news was determined
based on the proportion of positive
sentences to negative sentences therein,
calculated using the formula (number of
positive sentences – number of negative
sentences) / (number of positive sentences
+ number of negative sentences + 1),
which is a continuous and comparable
value, ranging from -1 to 1 (with 1 being
the most positive and -1 being the most
negative). For the purpose of our report,
we established the average value of the
company’s news opinions over the past
three years. A higher score indicates the
market’s affirmation of the company’s
current business model and its optimism
about the company’s future. On the other
hand, to examine the media coverage,
our research team counted the number
of news reports related to the company
during the past three years, which served
as a supplement to the analysis of the
news opinion. It should be noted that
our research team adjusted the value
of the media coverage based on the
general sentiment shown by the news
(with the aforementioned average value
being positive or negative). If the general
sentiment was negative, the value of the
media coverage was then calculated by
the number of relevant news reports x
-1. Our consideration here was that if
negative news attracts the attention of
many investors and is widely reported, it
could mean the company is facing more
serious issues. Conversely, if positive news
attracts more recognition and coverage,
the growth potential of the company could
become more convincing. Finally, our
research team calculated the final score
of the media opinion by taking the simple
average of the values of the news opinion
and the media coverage.
In our research, we analysed news articles
published in print media from 2018 to
2020, covering 111 media companies
including the China Business Journal,
Economic Daily, Shanghai Securities
Journal and others. Among these
articles, positive news reports accounted
for 79.6% of all reports, while negative
news reports accounted for 20.2% and
neutral reports accounted for only 0.3%.
During the three-year period, each
media company published an average
of 239.1 news reports, with the median
being 65. Nonetheless, there were certain
limitations in this indicator, which were
mainly reflected by the different levels
of media attention towards different
industries. Specifically, some industries
11
The seed terms related to stakeholders were: stakeholders, respect, health, employees' rights and interests, congress of workers, trade union organisations and communication (7 in total); the seed terms related to environmental protection were: sustainable, green, ecological, environmental, pollution, prevention, resource, conservation, emissions, sewage and waste (11 in total); and the seed terms related to social responsibility were: community welfare, disaster relief, poverty alleviation, public welfare, social responsibilities, pair assistance, poverty-stricken areas and employment (8 in total).
3
Due to limitations on the availability and comparability of the text-based data, only the corporate social responsibility indicators of the listed companies in the SSE and SZSE were measured in this report.
4
CHINA’S NEXT 100 GLOBAL GIANTS (2020 EDITION)
possess certain "eye-catching" features,
or their products or services are directly
oriented towards the end customers,
which encourages the company executives
to pay more attention to marketing and
the management of public opinion,
thereby generating more media coverage.
For example, a typical company in the
air transportation industry was featured
in an average of 2,292.7 news reports;
while a company associated with the
radio, television, film and video recording
sector was only featured in an average of
681.5 news reports. The media coverage
of certain industries was even lower,
especially the traditional manufacturing
industries that are not oriented towards
the end customers. As a result, a typical
company in the non-metallic mining
and dressing industry was only reported
24 times on average, while there were
only 47 articles featuring instrument
manufacturers.
12.Social responsibility. Corporate social
responsibility (CSR) refers to the fact
that, in addition to generating profits,
a company’s business activities should
conform to the principles of sustainable
development, as well as being responsible
to the consumers, company employees,
community welfare and the ecological
environment. Essentially, a company’s
healthy growth potential is evidenced
by its initiative in actively assuming
social responsibilities and establishing
a good public image. A good rating in
this indicator not only reveals the better
potential of a company to develop in
a stable manner over a longer period
of time, but also represents the fact a
particular company has fewer potential
risks. Generally speaking, corporate
social responsibility is an important
foundation for promoting the healthy,
orderly, large-scale and diversified
development of China's economy,
particularly as it plays an essential
role in enhancing the understanding,
promotion and implementation of the
concept of sustainable development. As
a result, corporate social responsibility
has become a mainstream indicator
for many companies in their long-term
capital investment strategies. Evidence-
based research also shows that a good
balance between the pursuit of a strong
short-term performance and sustainable
development can bring long-term benefits
to the company, as well as to investors and
the wider circle of stakeholders. Active
disclosures of the activities relevant to
corporate social responsibility can help
companies attract long-term capital and
establish a good public image, so the
company’s management should focus on
improving the efficiency and effectiveness
in communicating these activities, in order
to maximise the benefits.
Through machine learning and natural
language processing, our research team
constructed a text-based method to
measure the evaluation variables for the
level of corporate social responsibility.
Specifically, the method involved two
separate steps. The first step was to
construct a specific dictionary related
to corporate social responsibility. In
accordance with the description in
Chapter 8 "Stakeholders, Environmental
Protection and Social Responsibility"
of the Code of Corporate Governance
for Listed Companies issued by the
China Securities Regulatory Commission
in 2018, we divided corporate social
responsibility into three aspects – namely
stakeholders, environmental protection
and social responsibility – and proceeded
to select relevant seed words from the
text and group them under these three
aspects.3 We then used the “Management
Discussion and Analysis” sections of the
corporate financial reports from 1999
to 2019 as the text corpus to train our
Word2vec model, in order to expand the
aforementioned three categories of seed
terms. 100 seed terms with the highest
level of average similarity were selected
from each category to construct the final
corporate social responsibility dictionary.
The second step involved measuring the
frequency of occurrence of all the terms in
the dictionary against the "Management
Discussion and Analysis" sections of each
company's 2018 and 2019 financial reports,
which was then further divided by the
total length of the text. The resulting ratio
was then used to evaluate the aspect of
corporate social responsibility.4
12
How China’s Next 100 Global Giants (2020 Edition) were Ranked
For the 3,749 non-financial private listed companies, our research team measured their final scores by summing up their indicator scores, and the companies were ranked based on these final scores.
For the 3,749 non-financial private listed
companies, our research team measured
their final scores by summing up their
indicator scores, and the companies were
ranked based on these final scores. First,
our research team identified the Top 130
Chinese companies, which were ranked as
the Top 130 in our evaluation system. On
this basis, our research team finalised the
ranking of China’s Next 100 Global Giants
by eliminating the 30 largest companies.
This was done because the intention of our
ranking is to discover the future business
giants from China, and if a company makes
it to our list just because of its business
scale, it indicates that the company has
already undergone effective development
and has become an industry leader, or a
“unicorn”. Eliminating these companies
from our ranking does not mean we have
doubts about their future growth; instead,
our research team would like to promote
the companies that have equal or greater
growth potential, but have yet to grow to the
scale of the other giants. These companies
could very possibly become the flagship
enterprises in their respective industries.
Overall, among the companies included
in our list, the highest score was 82.25
and the lowest score was 69.25, indicating
that there is a certain gap between the
companies, as well as highlighting the
importance of ranking all the selected
companies in this manner. Based on the
results from our evaluation system, the
companies on our list are of a high quality
in general, but their corporate scale is not
large enough, which in turn represents
a lot of room for future growth. Most of
the companies on our list showed various
shortcomings in 1-3 indicators (with a score
of 50 or lower), with very few companies
having shortcomings in 4 or more
indicators, and rarely there were companies
showing an all-around performance with
no shortcomings at all.
This represents the fact that different
companies have various focal points during
their development, which in turn indicates
the diverse nature of the development
models among the companies on our
list. It should also be noted that, even if a
certain company is included, a lot of effort
must be put into improving the company’s
quality holistically and to overcome its
current shortcomings, if it is to evolve into
a star enterprise of the future.
The companies on our list have certain
features in common. First, they scored
relatively high in terms of their cash flow,
with an average of 91.8 points, which was
CHINA’S NEXT 100 GLOBAL GIANTS (2020 EDITION)
13
the highest average score among the 12
indicators. Among the top 100 companies,
only 9 scored less than 90 points for
their cash flow. In addition, the standard
deviation of the companies’ cash flow
scores was only 8.86, which was also the
smallest standard deviation among the 12
indicators. From a company’s perspective,
its cash flow is the capital that keeps its
operations going, which represents the
“blood” of the company’s “circulatory
system” and plays an even more important
role than revenue or profit. Companies
with abundant cash flow often occupy
important positions in the entire value
chain, where they are better positioned
to enter into cooperation with upstream
and downstream companies. Having a
sustainable and stable cash flow is also
an important criterion for companies to
achieve success in global competition
and respond to sudden crises. Second,
the companies also scored high in the
categories of capital expenditure and
growth, with more than 80 points for both
indicators. These two indicators measure
the extent of a company’s expansion
of its business operations, as a rational
expansion is inseparable from the timely
ability to grasp investment opportunities.
As such, a higher capital expenditure
implies that the company is in a stage of
rapid development. From the perspective
of revenue, a steady increase in sales
revenue means that the company's
products or services are highly competitive,
where the capital expenditure is bringing
tangible financial returns to the company.
Since the intention of our list is to discover
private enterprises that are in a stage
of robust expansion, a high score in the
growth category is an important indicator
of a company’s significant development
potential. Third, the companies generally
had higher scores for their rate of return,
which indicates that they are able to provide
good financial returns to their investors.
These high scores were also evidenced by
their return on equity in the stock market.
From January 2018 to June 2021, the
average cumulative abnormal return rate
of shares from the top 100 companies on
our list was as high as 142.16%, beating the
market average of -0.34% by a significant
margin. Robust profitability is a sign of a
company’s success, while also indicating
that its business model, long- and short-
term strategies and core competitiveness
have successfully created economic
added value.
In terms of the earnings quality, social
responsibility, R&D investment and
industry prospects, there were significant
differences in performance among the
companies on our list. First of all, though
the earnings quality is an effective indicator
in measuring the credibility, predictability
In terms of the earnings quality, social responsibility, R&D investment and industry prospects, there were significant differences in performance among the companies on our list.
CHINA’S NEXT 100 GLOBAL GIANTS (2020 EDITION)
14
CHINA’S NEXT 100 GLOBAL GIANTS (2020 EDITION)
and sustainability of the corporate
profitability, earnings management could
be implemented differently across the
companies in various industries as well as
those in different development stages.
Most of the expanding enterprises
involved in traditional manufacturing are
weakly positioned in the upstream and
downstream capital chain of the industry;
thus, their cash settlement process is often
longer, resulting in a poor earnings quality.
For example, Flat Glass Group, a company
included in our list of China's Next 100
Global Giants, has established a relatively
comprehensive industrial chain in the
fields of solar photovoltaic glass and high-
quality float glass, and has undergone
a rapid expansion in recent years. Its
revenue and capital investment have been
significant, but most of its profits fall under
accounts receivable which are yet to be
recovered. Also, as was discussed before,
social responsibility is an indicator that
measures the willingness of a company
to be responsible to its stakeholders,
including its employees, the community
and the ecological environment. Since
the corporate investment in social
responsibility cannot be quickly converted
into financial returns, most companies
tended to neglect their investment in this
aspect of operations before now. However,
as the public has become increasingly
aware of environmental protection,
community welfare, employee welfare
and other relevant issues, corporate social
responsibility will inevitably become
an important means for enterprises
to secure a positive public opinion at
the earliest opportunity. Some of the
companies on our list, such as H&T, Victory
Giant Technology, Goodix and Sunlord
Electronics, scored high in all other
indicators, only to be dragged down by a
low score in social responsibility. Therefore,
the management of these companies
should take this into account and consider
assuming more social responsibility and
adopting a policy of active disclosure.
Corporate social responsibility is one
of the cornerstones in maintaining a
company's reputation, as well as being
essential in improving the company's
competitiveness and attractiveness to
stakeholders. Promoting a higher level
of corporate social responsibility and
governance is by no means routine;
however, it is only by integrating this
issue into the business strategy and daily
operations that a company can truly
embark on the journey towards becoming
a socially responsible enterprise. In
addition, the gap in the level of R&D
investment between the companies on
our list was notably obvious, mainly due
to different circumstances among the
industries in which the companies operate.
For example, Aier Eye Hospital, which
placed 5th in our overall ranking, operates
ophthalmic hospitals as its main business;
while KUKA Home, ranked 13th on our list,
mainly deals with the production and sale
of furniture; and Country Garden Services,
ranked 84th, focuses on property
management. The competitiveness of
these industries can hardly be reflected in
R&D innovations. On the other hand, R&D
innovation is an important battleground
for industries such as computer software
manufacturing, internet services and
pharmaceutical development, where the
companies must embrace innovation
to avoid being overtaken. Finally, the
industry prospects of the companies
also varied significantly, which was a
result of the uneven distribution of
the industries on our list. The fact that
companies from unfavourable industries
with negative prospects can also make it
onto our list implies that, regardless of the
development potential of any particular
industry, a company with a superb overall
performance can eventually take up
the chance to evolve into a juggernaut.
Notable examples include: Huafon
Chemical, from the traditional chemical
fibre manufacturing industry and Chifeng
Jilong Gold Mining, from the non-ferrous
metal mining and dressing industry.
15
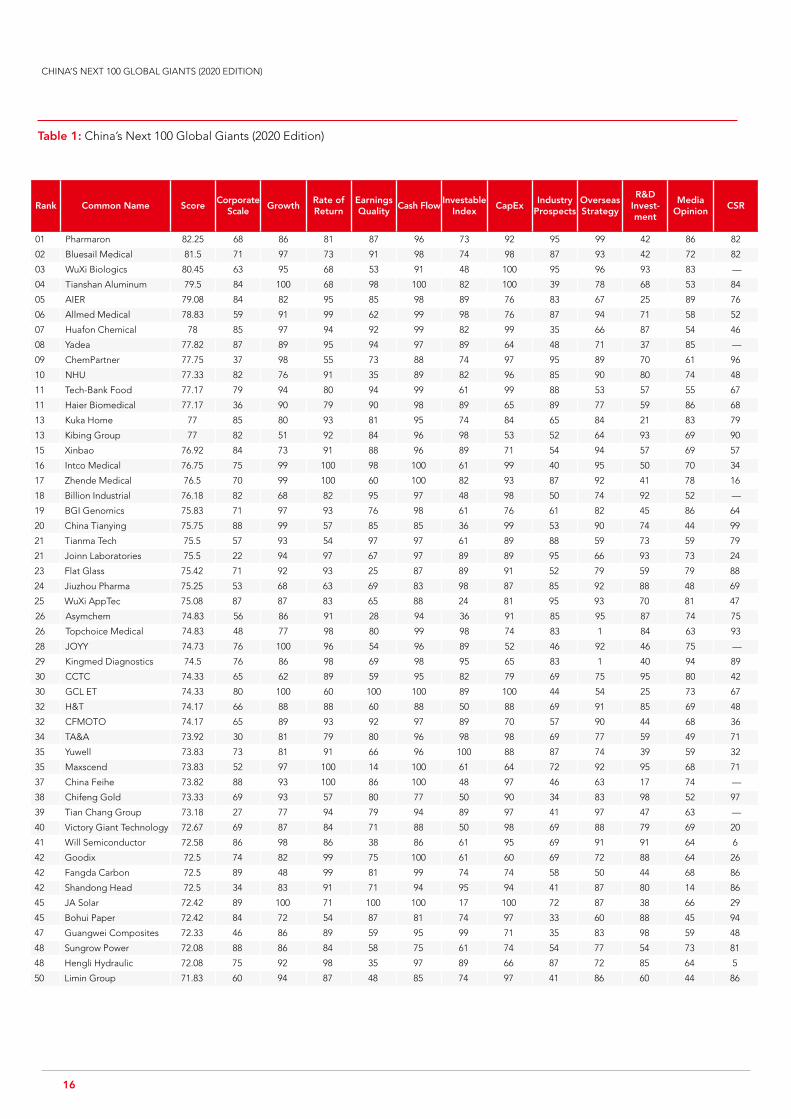
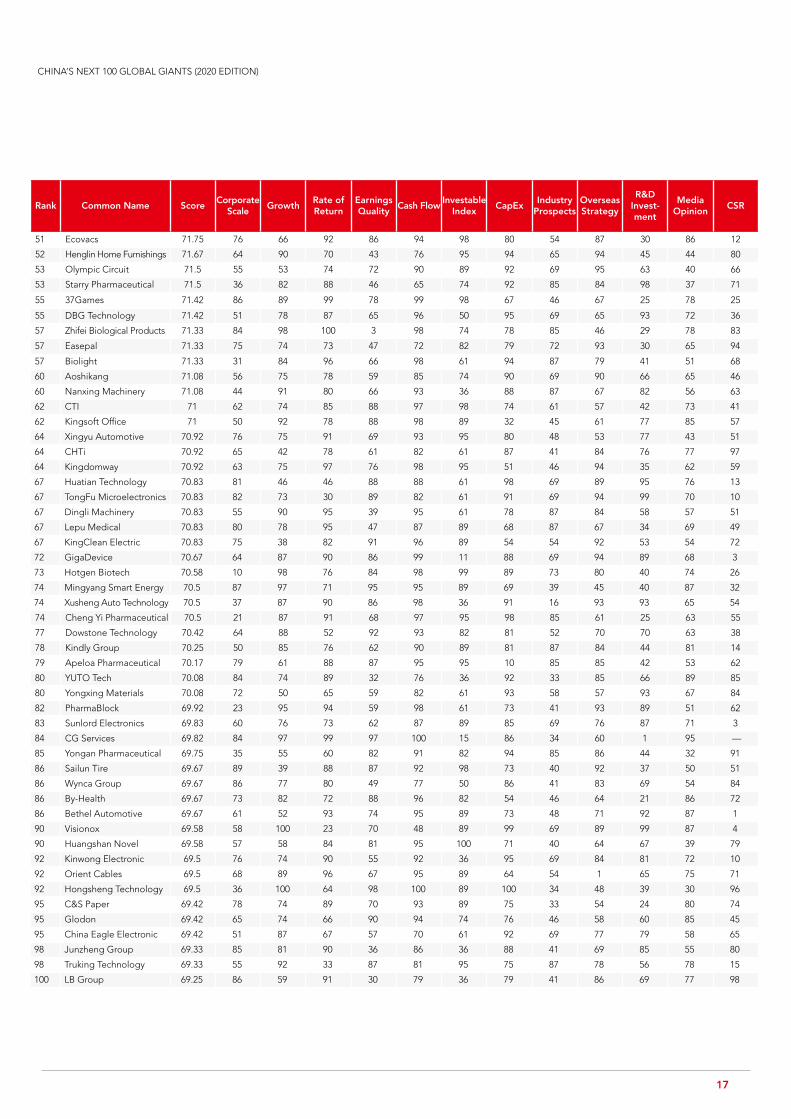
Table 1: China’s Next 100 Global Giants (2020 Edition)
CHINA’S NEXT 100 GLOBAL GIANTS (2020 EDITION)
Rank Common Name ScoreCorporate
ScaleGrowth
Rate of Return
Earnings Quality
Cash FlowInvestable
IndexCapEx
Industry Prospects
Overseas Strategy
R&D Invest-ment
Media Opinion
CSR
01 Pharmaron 82.25 68 86 81 87 96 73 92 95 99 42 86 82
02 Bluesail Medical 81.5 71 97 73 91 98 74 98 87 93 42 72 82
03 WuXi Biologics 80.45 63 95 68 53 91 48 100 95 96 93 83 —
04 Tianshan Aluminum 79.5 84 100 68 98 100 82 100 39 78 68 53 84
05 AIER 79.08 84 82 95 85 98 89 76 83 67 25 89 76
06 Allmed Medical 78.83 59 91 99 62 99 98 76 87 94 71 58 52
07 Huafon Chemical 78 85 97 94 92 99 82 99 35 66 87 54 46
08 Yadea 77.82 87 89 95 94 97 89 64 48 71 37 85 —
09 ChemPartner 77.75 37 98 55 73 88 74 97 95 89 70 61 96
10 NHU 77.33 82 76 91 35 89 82 96 85 90 80 74 48
11 Tech-Bank Food 77.17 79 94 80 94 99 61 99 88 53 57 55 67
11 Haier Biomedical 77.17 36 90 79 90 98 89 65 89 77 59 86 68
13 Kuka Home 77 85 80 93 81 95 74 84 65 84 21 83 79
13 Kibing Group 77 82 51 92 84 96 98 53 52 64 93 69 90
15 Xinbao 76.92 84 73 91 88 96 89 71 54 94 57 69 57
16 Intco Medical 76.75 75 99 100 98 100 61 99 40 95 50 70 34
17 Zhende Medical 76.5 70 99 100 60 100 82 93 87 92 41 78 16
18 Billion Industrial 76.18 82 68 82 95 97 48 98 50 74 92 52 —
19 BGI Genomics 75.83 71 97 93 76 98 61 76 61 82 45 86 64
20 China Tianying 75.75 88 99 57 85 85 36 99 53 90 74 44 99
21 Tianma Tech 75.5 57 93 54 97 97 61 89 88 59 73 59 79
21 Joinn Laboratories 75.5 22 94 97 67 97 89 89 95 66 93 73 24
23 Flat Glass 75.42 71 92 93 25 87 89 91 52 79 59 79 88
24 Jiuzhou Pharma 75.25 53 68 63 69 83 98 87 85 92 88 48 69
25 WuXi AppTec 75.08 87 87 83 65 88 24 81 95 93 70 81 47
26 Asymchem 74.83 56 86 91 28 94 36 91 85 95 87 74 75
26 Topchoice Medical 74.83 48 77 98 80 99 98 74 83 1 84 63 93
28 JOYY 74.73 76 100 96 54 96 89 52 46 92 46 75 —
29 Kingmed Diagnostics 74.5 76 86 98 69 98 95 65 83 1 40 94 89
30 CCTC 74.33 65 62 89 59 95 82 79 69 75 95 80 42
30 GCL ET 74.33 80 100 60 100 100 89 100 44 54 25 73 67
32 H&T 74.17 66 88 88 60 88 50 88 69 91 85 69 48
32 CFMOTO 74.17 65 89 93 92 97 89 70 57 90 44 68 36
34 TA&A 73.92 30 81 79 80 96 98 98 69 77 59 49 71
35 Yuwell 73.83 73 81 91 66 96 100 88 87 74 39 59 32
35 Maxscend 73.83 52 97 100 14 100 61 64 72 92 95 68 71
37 China Feihe 73.82 88 93 100 86 100 48 97 46 63 17 74 —
38 Chifeng Gold 73.33 69 93 57 80 77 50 90 34 83 98 52 97
39 Tian Chang Group 73.18 27 77 94 79 94 89 97 41 97 47 63 —
40 Victory Giant Technology 72.67 69 87 84 71 88 50 98 69 88 79 69 20
41 Will Semiconductor 72.58 86 98 86 38 86 61 95 69 91 91 64 6
42 Goodix 72.5 74 82 99 75 100 61 60 69 72 88 64 26
42 Fangda Carbon 72.5 89 48 99 81 99 74 74 58 50 44 68 86
42 Shandong Head 72.5 34 83 91 71 94 95 94 41 87 80 14 86
45 JA Solar 72.42 89 100 71 100 100 17 100 72 87 38 66 29
45 Bohui Paper 72.42 84 72 54 87 81 74 97 33 60 88 45 94
47 Guangwei Composites 72.33 46 86 89 59 95 99 71 35 83 98 59 48
48 Sungrow Power 72.08 88 86 84 58 75 61 74 54 77 54 73 81
48 Hengli Hydraulic 72.08 75 92 98 35 97 89 66 87 72 85 64 5
50 Limin Group 71.83 60 94 87 48 85 74 97 41 86 60 44 86
16
Rank Common Name ScoreCorporate
ScaleGrowth
Rate of Return
Earnings Quality
Cash FlowInvestable
IndexCapEx
Industry Prospects
Overseas Strategy
R&D Invest-ment
Media Opinion
CSR
51 Ecovacs 71.75 76 66 92 86 94 98 80 54 87 30 86 12
52 Henglin Home Furnishings 71.67 64 90 70 43 76 95 94 65 94 45 44 80
53 Olympic Circuit 71.5 55 53 74 72 90 89 92 69 95 63 40 66
53 Starry Pharmaceutical 71.5 36 82 88 46 65 74 92 85 84 98 37 71
55 37Games 71.42 86 89 99 78 99 98 67 46 67 25 78 25
55 DBG Technology 71.42 51 78 87 65 96 50 95 69 65 93 72 36
57 Zhifei Biological Products 71.33 84 98 100 3 98 74 78 85 46 29 78 83
57 Easepal 71.33 75 74 73 47 72 82 79 72 93 30 65 94
57 Biolight 71.33 31 84 96 66 98 61 94 87 79 41 51 68
60 Aoshikang 71.08 56 75 78 59 85 74 90 69 90 66 65 46
60 Nanxing Machinery 71.08 44 91 80 66 93 36 88 87 67 82 56 63
62 CTI 71 62 74 85 88 97 98 74 61 57 42 73 41
62 Kingsoft Office 71 50 92 78 88 98 89 32 45 61 77 85 57
64 Xingyu Automotive 70.92 76 75 91 69 93 95 80 48 53 77 43 51
64 CHTi 70.92 65 42 78 61 82 61 87 41 84 76 77 97
64 Kingdomway 70.92 63 75 97 76 98 95 51 46 94 35 62 59
67 Huatian Technology 70.83 81 46 46 88 88 61 98 69 89 95 76 13
67 TongFu Microelectronics 70.83 82 73 30 89 82 61 91 69 94 99 70 10
67 Dingli Machinery 70.83 55 90 95 39 95 61 78 87 84 58 57 51
67 Lepu Medical 70.83 80 78 95 47 87 89 68 87 67 34 69 49
67 KingClean Electric 70.83 75 38 82 91 96 89 54 54 92 53 54 72
72 GigaDevice 70.67 64 87 90 86 99 11 88 69 94 89 68 3
73 Hotgen Biotech 70.58 10 98 76 84 98 99 89 73 80 40 74 26
74 Mingyang Smart Energy 70.5 87 97 71 95 95 89 69 39 45 40 87 32
74 Xusheng Auto Technology 70.5 37 87 90 86 98 36 91 16 93 93 65 54
74 Cheng Yi Pharmaceutical 70.5 21 87 91 68 97 95 98 85 61 25 63 55
77 Dowstone Technology 70.42 64 88 52 92 93 82 81 52 70 70 63 38
78 Kindly Group 70.25 50 85 76 62 90 89 81 87 84 44 81 14
79 Apeloa Pharmaceutical 70.17 79 61 88 87 95 95 10 85 85 42 53 62
80 YUTO Tech 70.08 84 74 89 32 76 36 92 33 85 66 89 85
80 Yongxing Materials 70.08 72 50 65 59 82 61 93 58 57 93 67 84
82 PharmaBlock 69.92 23 95 94 59 98 61 73 41 93 89 51 62
83 Sunlord Electronics 69.83 60 76 73 62 87 89 85 69 76 87 71 3
84 CG Services 69.82 84 97 99 97 100 15 86 34 60 1 95 —
85 Yongan Pharmaceutical 69.75 35 55 60 82 91 82 94 85 86 44 32 91
86 Sailun Tire 69.67 89 39 88 87 92 98 73 40 92 37 50 51
86 Wynca Group 69.67 86 77 80 49 77 50 86 41 83 69 54 84
86 By-Health 69.67 73 82 72 88 96 82 54 46 64 21 86 72
86 Bethel Automotive 69.67 61 52 93 74 95 89 73 48 71 92 87 1
90 Visionox 69.58 58 100 23 70 48 89 99 69 89 99 87 4
90 Huangshan Novel 69.58 57 58 84 81 95 100 71 40 64 67 39 79
92 Kinwong Electronic 69.5 76 74 90 55 92 36 95 69 84 81 72 10
92 Orient Cables 69.5 68 89 96 67 95 89 64 54 1 65 75 71
92 Hongsheng Technology 69.5 36 100 64 98 100 89 100 34 48 39 30 96
95 C&S Paper 69.42 78 74 89 70 93 89 75 33 54 24 80 74
95 Glodon 69.42 65 74 66 90 94 74 76 46 58 60 85 45
95 China Eagle Electronic 69.42 51 87 67 57 70 61 92 69 77 79 58 65
98 Junzheng Group 69.33 85 81 90 36 86 36 88 41 69 85 55 80
98 Truking Technology 69.33 55 92 33 87 81 95 75 87 78 56 78 15
100 LB Group 69.25 86 59 91 30 79 36 79 41 86 69 77 98
CHINA’S NEXT 100 GLOBAL GIANTS (2020 EDITION)
17

A Review of the 2018 Ranking
Among those 20 remaining companies, Eleven of these companies are engaged in computer or internet-related businesses, which is a clear illustration that China’s internet industry is still in a state of steady development.
CHINA’S NEXT 100 GLOBAL GIANTS (2020 EDITION)
By reviewing our 2018 list of China’s Next
100 Global Giants and comparing it with
the 2020 edition, it can be seen that 18
companies successfully remained among
the top 100, while two companies (CVTE
and LY iTECH) were listed among the
top 130 in the latest analysis due to a
substantial growth in their sales scale,
which rendered them ineligible for the
top 100 list. All in all, 20 companies were
included in both the 2018 and 2020
rankings, demonstrating the fact that a
certain extent of sustainability and stability
exists in the growth of a number of private
enterprises. On the other hand, 80 new
companies made their first appearance on
our 2020 list – an indication that Chinese
private enterprises in general are still
undergoing a stage of rapid change, with
a relatively low level of robustness and
predictability in terms of their performance.
Among those 20 remaining companies, 18
are listed on the SSE/SZSE, one is listed on
the NASDAQ and another one is listed on
the SSE/SZSE and SEHK simultaneously. The
below list shows the names of the companies
and the related industries. Eleven of these
companies are engaged in computer or
internet-related businesses, which is a clear
illustration that China’s internet industry is still
in a state of steady development, with some
companies having risen to become leaders
in the sector. These tech companies are
currently undergoing further developments
in terms of internet applications in aspects
such as industrial manufacturing and
industrial collaboration, while the more
traditional companies, including those from
the manufacturing and service industries, will
soon move forward to explore the possibility
of organic integration with the internet
industry and information technology.
18
CHINA’S NEXT 100 GLOBAL GIANTS (2020 EDITION)
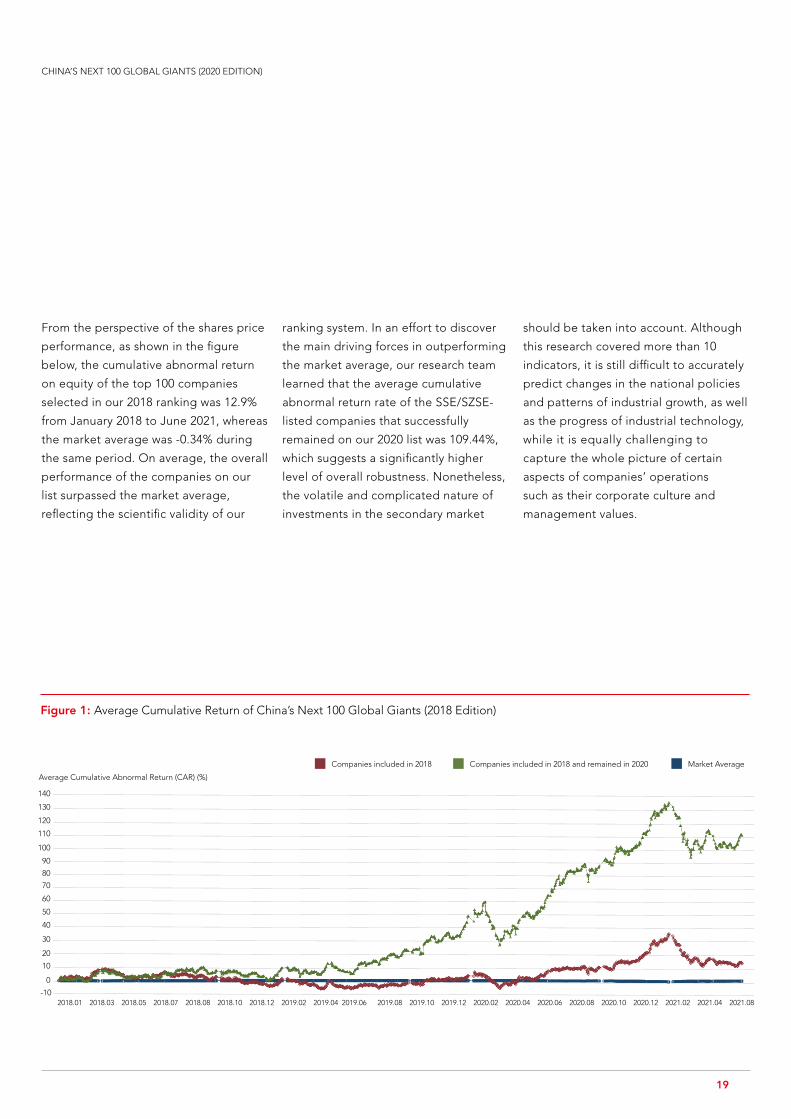
Figure 1: Average Cumulative Return of China’s Next 100 Global Giants (2018 Edition)
Average Cumulative Abnormal Return (CAR) (%)
2018.01 2018.03 2018.05 2018.07 2018.08 2018.10 2018.12 2019.02 2019.04 2019.06 2019.08 2019.10 2019.12 2020.02 2020.04 2020.06 2020.08 2020.10 2020.12 2021.02 2021.04 2021.08-10
140
130
120
110
100
90
80
70
60
50
40
30
20
10
0
Companies included in 2018 Market AverageCompanies included in 2018 and remained in 2020
From the perspective of the shares price
performance, as shown in the figure
below, the cumulative abnormal return
on equity of the top 100 companies
selected in our 2018 ranking was 12.9%
from January 2018 to June 2021, whereas
the market average was -0.34% during
the same period. On average, the overall
performance of the companies on our
list surpassed the market average,
reflecting the scientific validity of our
ranking system. In an effort to discover
the main driving forces in outperforming
the market average, our research team
learned that the average cumulative
abnormal return rate of the SSE/SZSE-
listed companies that successfully
remained on our 2020 list was 109.44%,
which suggests a significantly higher
level of overall robustness. Nonetheless,
the volatile and complicated nature of
investments in the secondary market
should be taken into account. Although
this research covered more than 10
indicators, it is still difficult to accurately
predict changes in the national policies
and patterns of industrial growth, as well
as the progress of industrial technology,
while it is equally challenging to
capture the whole picture of certain
aspects of companies’ operations
such as their corporate culture and
management values.
19

The overall profitability of the current 100 future giants has increased significantly compared to those in 2018, but the gap between these giants has also widened.
By measuring the indicator scores and
comparing the overall performance
between the companies on the 2018 list
and those on the 2020 list, we found that
with the exception of the average level of
sales scale, the scores of all other indicators
increased from 2018 to 2020, implying more
robust fundamentals of the companies
selected in 2020. In terms of the sales scale,
the sales of the companies on the current
2020 list reached an average of CNY 5.69
billion, with a median of CNY 4.41 billion,
while the figures for the companies included
on the 2018 list were CNY 6.78 billion and
CNY 5.96 billion, respectively. The overall
decline in the sales scale was mainly due
to the impact of the COVID-19 outbreak.
However, as the world comes out of the
pandemic, the sales revenue is expected
to rebound. In terms of the annual rate of
sales growth, the medians of the companies
included on the 2020 list and the 2018
list were 30.5% and 30.4% respectively,
showing a slight but steady growth over
the years. The annualised rate of return of
the companies on the 2020 list was 17.2%
on average, with a median of 15.8% and
a standard deviation of 0.09. In contrast,
the average annualised rate of return in
2018 was 10.0%, while the median and the
standard deviation were 9.4% and 0.05,
respectively. Judging from these figures, it
can be seen that the overall profitability of
the current 100 future giants has increased
significantly compared to those in 2018,
but the gap between these giants has also
widened. For the growing enterprises,
profitability has become increasingly
important as the key to success. The relative
cash flow ratio of the companies included
on the 2020 list was 0.21 on average, with
a median of 0.18, while these figures were
CHINA’S NEXT 100 GLOBAL GIANTS (2020 EDITION)
20
CHINA’S NEXT 100 GLOBAL GIANTS (2020 EDITION)
0.13 and 0.12 (respectively) among the
companies named on the 2018 list. In
the face of constant external shocks, the
importance of having a sufficient cash flow
has become more and more prominent, as
it determines the survival and growth of a
company. The overall performance in terms
of the capital expenditure has also seen
improvement, with a median of 0.06 in 2020
compared to 0.02 in 2018.
With regards to the companies that
failed to remain on our list, we found
that the performances of some of these
companies were severely affected due
to the COVID-19 pandemic, resulting
in a significant decrease in their scores.
These companies included YOFC, HC
SemiTek, PaiSheng Intelligent Technology,
Wanda Cinema and Ellassay. Other
companies, such as Yihua Lifestyle and
Anysoft Information Technology, have
been involved in disclosure violations
and were subject to investigations by
the regulatory authorities. All in all, the
shortcomings of these companies mainly
lay in an inadequate performance in terms
of their investable index, growth and
social responsibility, reflected by relatively
low scores in the respective indicators.
Corporate social responsibility is a new
indicator featured in our 2020 ranking of
China’s Next 100 Global Giants, which
measures a company’s comprehensive
capability in actively assuming social
responsibilities and provides a non-
financial evaluation of its sustainability. As
a result, some companies failed to remain
on our list in 2020 due to a low score in
sustainability, including Tuopu Group,
Everwin Precision, Fuyao Glass, Risen
Energy, Autobio Diagnostics and Sunward
Intelligent Equipment.
By comparing the 2018 and 2020
rankings, we discovered that there are
certain limitations to our ranking system.
First, it is not possible to predict major
events such as sales and purchases of a
company’s business or violations of the
disclosure regulations by the company’s
management. For example, although
JOYY managed to remain on our list in
2020, our analysis of the financial data for
the fiscal years from 2018 to 2020 could
not reflect the negative impact caused
by the sale of its pillar business – YY – to
Baidu Group in November 2020. Some
other companies that were included
on our 2018 list also experienced major
negative events, which resulted in a drastic
drop in their rank so they failed to remain
on our 2020 list. Let’s take Tuandai.com, a
company that went public with a reverse
takeover (it is currently named Paisheng
Intelligent Technology), as an example:
due to a scandal in March 2019 involving
the company controllers illegally taking
public deposits, which resulted in their
arrest, the company scored only 44.67
points in our 2020 ranking and dropped
out of the top 100. Taking these facts into
account, the research team admits that a
ranking on the basis of the market scale
will unavoidably lead to misjudgments
about the company. As a result, some
good companies may not be included in
our ranking, while certain companies that
are included may not be as outstanding
as they seem. Nonetheless, to maintain
the objectivity and fairness of the
ranking, as well as the consistency and
reproducibility of our evaluation system,
our research team has opted not to
make manual adjustments to the ranks of
companies that have faced unexpected
circumstances after the systemic
compilation of our ranking.
21
Geographical Distribution of the Next 100 Global Giants
CHINA’S NEXT 100 GLOBAL GIANTS (2020 EDITION)
Figure 2: Geographical Distribution of the Next 100 Global Giants (by HQ Location)
Hubei(2):Qianjiang(1),Zhijiang(1)
Jiangsu (17): Changzhou (2), Jiangyin (1), Nanjing (2), Nantong (2), Suzhou (4), Wuxi (4), Xinyi (1), Zhenjiang (1)
Anhui (4): Hefei (1), Huangshan (1), Wuhu (2)
Zhejiang (19): Dongyang (1), Hangzhou (4), Huzhou (3), Jiaxing (1), Ningbo (3), Shaoxing (2), Taizhou (3), Wenzhou (2)
Hunan (4): Changsha (2), Yiyang (1), Zhuzhou (1)
Guangdong(23):Chaozhou (1), Dongguan (1), Foshan (2), Guangzhou (2), Heshan (1), Huizhou (3), Jiangmen (2), Shenzhen (7), Zhongshan (2), Zhuhai (2)
Fujian(3):Fuqing(1),Xiamen(2)
Gansu(2):Jiayuguan(1),Tianshui(1)
Shandong (7): Qingdao (2), Weihai (1), Zibo (4)
Henan(2):Jiaozuo(1),Zhengzhou(1)
Inner Mongolia(2):Chifeng(1),Wuhai(1)
Beijing(9)
Chongqing(1)
Tianjin(1)
Shanghai(2)
Jiangxi(1)
Qinhuang Island(1)Inner Mongolia(2)
Gansu(2)
Shandong(7)
Henan(2)Jiangsu(17)
Anhui(4)Hubei(2)
Hunan(4)
Guangdong(23)
Fujian(3)
Zhejiang(19)
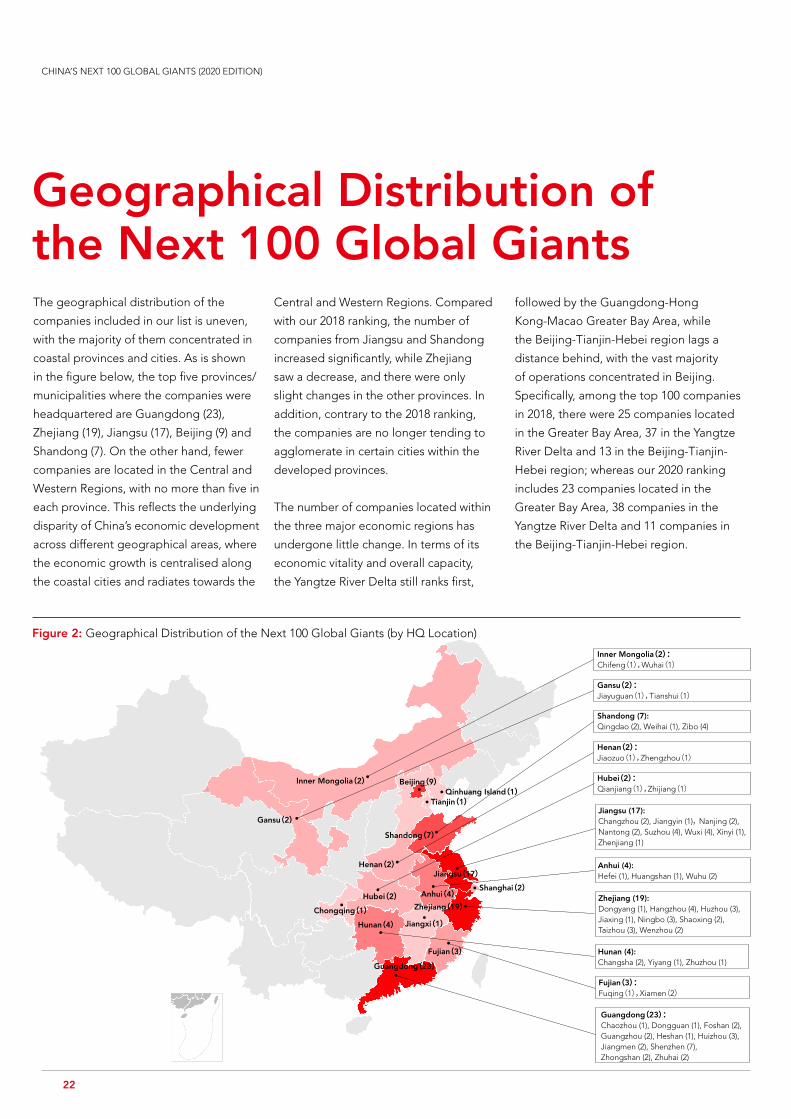
The geographical distribution of the
companies included in our list is uneven,
with the majority of them concentrated in
coastal provinces and cities. As is shown
in the figure below, the top five provinces/
municipalities where the companies were
headquartered are Guangdong (23),
Zhejiang (19), Jiangsu (17), Beijing (9) and
Shandong (7). On the other hand, fewer
companies are located in the Central and
Western Regions, with no more than five in
each province. This reflects the underlying
disparity of China’s economic development
across different geographical areas, where
the economic growth is centralised along
the coastal cities and radiates towards the
Central and Western Regions. Compared
with our 2018 ranking, the number of
companies from Jiangsu and Shandong
increased significantly, while Zhejiang
saw a decrease, and there were only
slight changes in the other provinces. In
addition, contrary to the 2018 ranking,
the companies are no longer tending to
agglomerate in certain cities within the
developed provinces.
The number of companies located within
the three major economic regions has
undergone little change. In terms of its
economic vitality and overall capacity,
the Yangtze River Delta still ranks first,
followed by the Guangdong-Hong
Kong-Macao Greater Bay Area, while
the Beijing-Tianjin-Hebei region lags a
distance behind, with the vast majority
of operations concentrated in Beijing.
Specifically, among the top 100 companies
in 2018, there were 25 companies located
in the Greater Bay Area, 37 in the Yangtze
River Delta and 13 in the Beijing-Tianjin-
Hebei region; whereas our 2020 ranking
includes 23 companies located in the
Greater Bay Area, 38 companies in the
Yangtze River Delta and 11 companies in
the Beijing-Tianjin-Hebei region.
22
Distribution of Industries in the Next 100 Global Giants
CHINA’S NEXT 100 GLOBAL GIANTS (2020 EDITION)
Figure 3: Distribution of Industries in the Next 100 Global Giants
Computers, Telecommunications and Other Electronic Equipment
Specialised Equipment
Pharmaceuticals
Chemical Materials and Products
Ecological Protection and Environmental Management
Electrical Machinery and Equipment
Research and Experimental Development
Food Manufacturing
Papermaking and Paper Products
Chemical Fibres
Rubber and Plastic Products
Non-Metallic Mineral Products
Car Manufacturing
Health
Agricultural Products and Non-Staple Food Processing
Internet and Related Services
Furnitures
General Equipment
Ferrous Metal Smelting and Calendering
Software and IT Services
Real Estate
Professional Technical Services
Non-Ferrous Metal Mining and Dressing
Textile
Non-Ferrous Metal Smelting and Calendering
Railways, Shipbuilding, Aerospace and Other Transportation Equipment
0 2 4 6 8 10 12 14 16 18
17
14
9
8
5
5
3
3
3
3
3
3
2
2
3
1
1
1
1
1
2
2
2
2
2
2
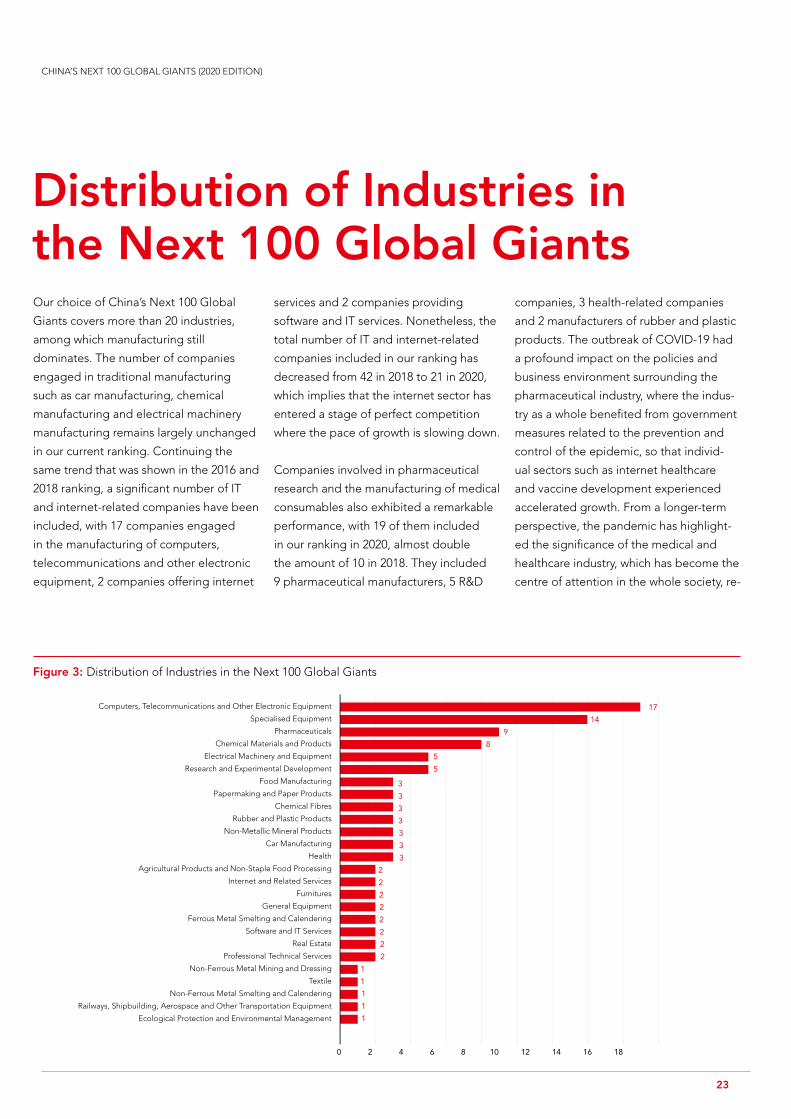
Our choice of China’s Next 100 Global
Giants covers more than 20 industries,
among which manufacturing still
dominates. The number of companies
engaged in traditional manufacturing
such as car manufacturing, chemical
manufacturing and electrical machinery
manufacturing remains largely unchanged
in our current ranking. Continuing the
same trend that was shown in the 2016 and
2018 ranking, a significant number of IT
and internet-related companies have been
included, with 17 companies engaged
in the manufacturing of computers,
telecommunications and other electronic
equipment, 2 companies offering internet
services and 2 companies providing
software and IT services. Nonetheless, the
total number of IT and internet-related
companies included in our ranking has
decreased from 42 in 2018 to 21 in 2020,
which implies that the internet sector has
entered a stage of perfect competition
where the pace of growth is slowing down.
Companies involved in pharmaceutical
research and the manufacturing of medical
consumables also exhibited a remarkable
performance, with 19 of them included
in our ranking in 2020, almost double
the amount of 10 in 2018. They included
9 pharmaceutical manufacturers, 5 R&D
companies, 3 health-related companies
and 2 manufacturers of rubber and plastic
products. The outbreak of COVID-19 had
a profound impact on the policies and
business environment surrounding the
pharmaceutical industry, where the indus-
try as a whole benefited from government
measures related to the prevention and
control of the epidemic, so that individ-
ual sectors such as internet healthcare
and vaccine development experienced
accelerated growth. From a longer-term
perspective, the pandemic has highlight-
ed the significance of the medical and
healthcare industry, which has become the
centre of attention in the whole society, re-
23
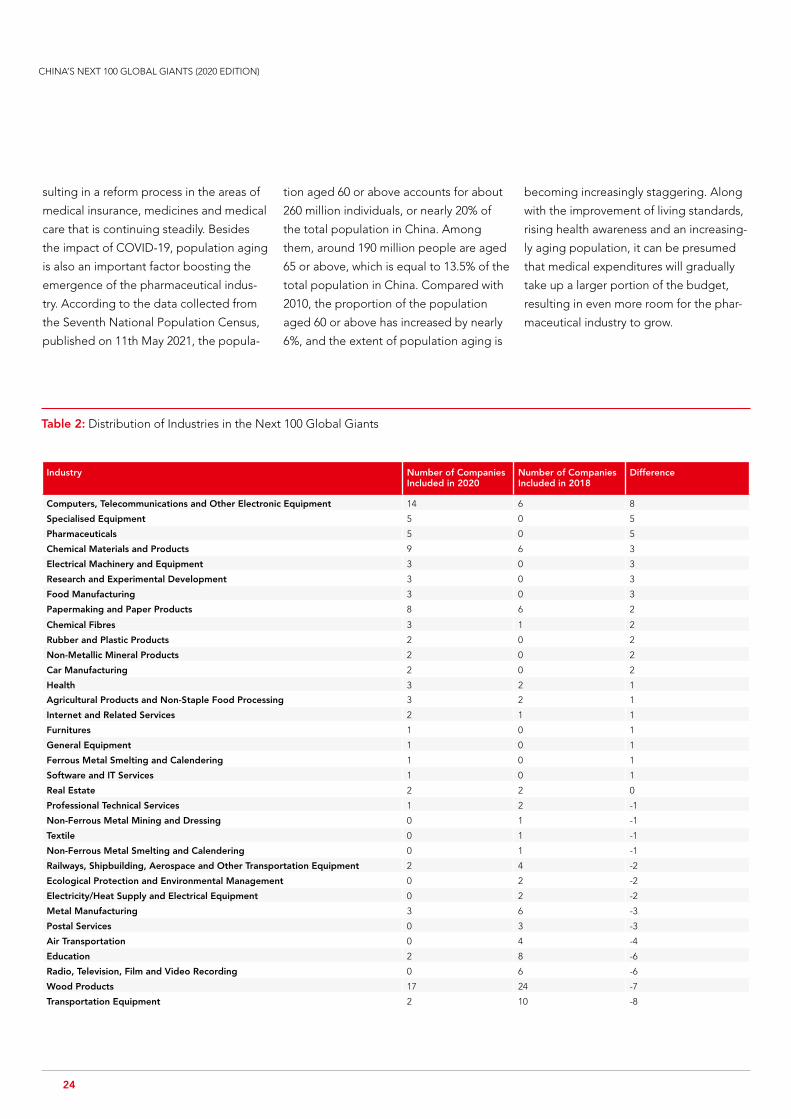
Table 2: Distribution of Industries in the Next 100 Global Giants
Industry Number of Companies Included in 2020
Number of Companies Included in 2018
Difference
Computers, Telecommunications and Other Electronic Equipment 14 6 8
Specialised Equipment 5 0 5
Pharmaceuticals 5 0 5
Chemical Materials and Products 9 6 3
Electrical Machinery and Equipment 3 0 3
Research and Experimental Development 3 0 3
Food Manufacturing 3 0 3
Papermaking and Paper Products 8 6 2
Chemical Fibres 3 1 2
Rubber and Plastic Products 2 0 2
Non-Metallic Mineral Products 2 0 2
Car Manufacturing 2 0 2
Health 3 2 1
Agricultural Products and Non-Staple Food Processing 3 2 1
Internet and Related Services 2 1 1
Furnitures 1 0 1
General Equipment 1 0 1
Ferrous Metal Smelting and Calendering 1 0 1
Software and IT Services 1 0 1
Real Estate 2 2 0
Professional Technical Services 1 2 -1
Non-Ferrous Metal Mining and Dressing 0 1 -1
Textile 0 1 -1
Non-Ferrous Metal Smelting and Calendering 0 1 -1
Railways, Shipbuilding, Aerospace and Other Transportation Equipment 2 4 -2
Ecological Protection and Environmental Management 0 2 -2
Electricity/Heat Supply and Electrical Equipment 0 2 -2
Metal Manufacturing 3 6 -3
Postal Services 0 3 -3
Air Transportation 0 4 -4
Education 2 8 -6
Radio, Television, Film and Video Recording 0 6 -6
Wood Products 17 24 -7
Transportation Equipment 2 10 -8
CHINA’S NEXT 100 GLOBAL GIANTS (2020 EDITION)
sulting in a reform process in the areas of
medical insurance, medicines and medical
care that is continuing steadily. Besides
the impact of COVID-19, population aging
is also an important factor boosting the
emergence of the pharmaceutical indus-
try. According to the data collected from
the Seventh National Population Census,
published on 11th May 2021, the popula-
tion aged 60 or above accounts for about
260 million individuals, or nearly 20% of
the total population in China. Among
them, around 190 million people are aged
65 or above, which is equal to 13.5% of the
total population in China. Compared with
2010, the proportion of the population
aged 60 or above has increased by nearly
6%, and the extent of population aging is
becoming increasingly staggering. Along
with the improvement of living standards,
rising health awareness and an increasing-
ly aging population, it can be presumed
that medical expenditures will gradually
take up a larger portion of the budget,
resulting in even more room for the phar-
maceutical industry to grow.
24
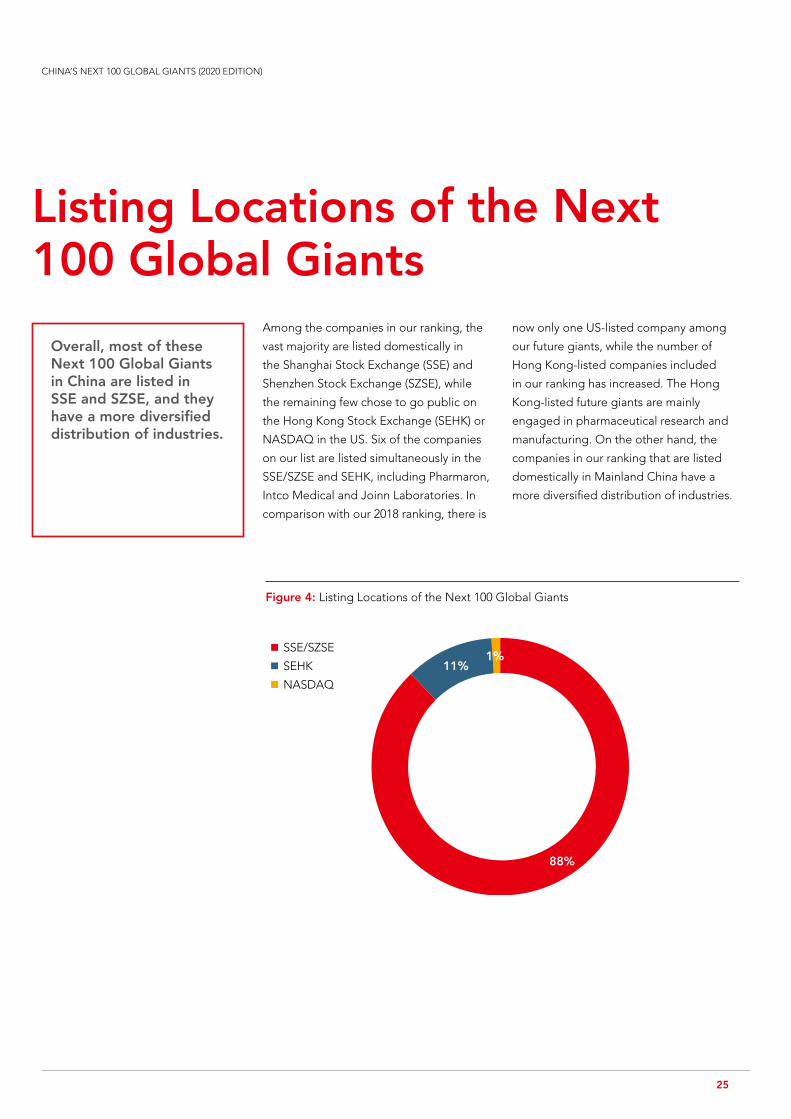
Overall, most of these Next 100 Global Giants in China are listed in SSE and SZSE, and they have a more diversified distribution of industries.
Among the companies in our ranking, the
vast majority are listed domestically in
the Shanghai Stock Exchange (SSE) and
Shenzhen Stock Exchange (SZSE), while
the remaining few chose to go public on
the Hong Kong Stock Exchange (SEHK) or
NASDAQ in the US. Six of the companies
on our list are listed simultaneously in the
SSE/SZSE and SEHK, including Pharmaron,
Intco Medical and Joinn Laboratories. In
comparison with our 2018 ranking, there is
now only one US-listed company among
our future giants, while the number of
Hong Kong-listed companies included
in our ranking has increased. The Hong
Kong-listed future giants are mainly
engaged in pharmaceutical research and
manufacturing. On the other hand, the
companies in our ranking that are listed
domestically in Mainland China have a
more diversified distribution of industries.
Listing Locations of the Next 100 Global Giants
CHINA’S NEXT 100 GLOBAL GIANTS (2020 EDITION)
�
�
�
88%
11%1%
Figure 4: Listing Locations of the Next 100 Global Giants
SSE/SZSE
SEHK
NASDAQ
25
Compared with our 2018 ranking, the top 100 giants from our current 2020 ranking show more robust financial fundamentals. Growth has been achieved in both qualitative and quantitative terms, reflecting the transformation and upgrading of the Chinese economy and its capital market.
Compared with our 2018 ranking, the top 100
giants from our current 2020 ranking show
more robust financial fundamentals, with
improvements in almost every indicator. This
points to the fact that the Chinese companies
are observing higher standards of excellence,
with continuous enhancements not only in
terms of their business performance, but also
in relation to governance and innovation.
Growth has been achieved in both qualitative
and quantitative terms, reflecting the
transformation and upgrading of the Chinese
economy and its capital market.
According to the “Report on the Integration of
China’s Urban Agglomeration” published by
the China Development Research Foundation,
the three major urban agglomerations in the
Yangtze River Delta, Beijing-Tianjin-Hebei
region and the Greater Bay Area make up
more than 40% of China’s economy, and
this phenomenon is also well-represented
in our study: 72% of the companies in our
2020 ranking come from these three major
economic areas, which is more or less the
same ratio as was observed in our 2018
ranking. As for the internal distribution of
Future Outlook
CHINA’S NEXT 100 GLOBAL GIANTS (2020 EDITION)
26
new stage of high-quality development, the
previous model where each city “fights on
its own and competes with one another” has
become unsustainable, and it has become
a matter of utmost urgency to seek a new
model of coordinated regional development.
Against this backdrop, the obvious approach
is for China to facilitate the coordinated
development of its economy by shifting the
focus from enhancing the overall carrying
capacity of a single city to supporting that
of an urban agglomeration. In the future,
private enterprises from second- and third-
tier cities will be given a broader scope for
development, where it will be necessary
for them to seize the opportunity for “new
urbanisation” on the basis of an urban
agglomeration, while making effective
use of the industrial chains, supply chains,
the future giants among China’s three major
economic regions, the companies have now
become more scattered within their respective
regions than in 2018, and this is especially
true for companies from the Beijing-Tianjin-
Hebei region. In 2018, all 13 companies from
the region that were included in our ranking
were from Beijing, with none from other cities.
However, our 2020 ranking shows that one
company from Hebei Province and another
from Tianjin are included among our top
100. A similar development can be observed
in the Yangtze River Delta and the Greater
Bay Area, where there are fewer companies
from the core cities (such as Shanghai,
Shenzhen and Guangzhou) included in our
ranking, while there is a significant increase
in the number of companies from peri-urban
areas. As China’s social economy enters a
innovation chains and value chains distributed
across their respective regions by allocating
their own resources accordingly, in order to
grow into leading enterprises. Looking to
the future, private enterprises must tap into
their technical expertise, uphold the spirit of
craftsmanship and work diligently with their
products, while setting up higher barriers
to entry and engaging in the development
of industrial ecosystem. These conditions
are essential to facilitate better and faster
growth that will allow a company to evolve
into a juggernaut for the new generation. At
the same time, It is also important to actively
open up new business opportunities and
increase the value of the company, all while
maintaining a good level of fundamentals and
a suitable cash flow to withstand the risks and
unexpected impacts from the market.
CHINA’S NEXT 100 GLOBAL GIANTS (2020 EDITION)
27
maceutical industry – that is in a stage of rapid development. In addition, it has close ties with industry-leading companies over-sea and has shown its brilliance in global competition, as well as actively pursuing corporate social responsibility and also performed well in terms of the media opin-ion. The relatively low score for R&D invest-ment (42 points) was mainly due to the fact that the company is mainly engaged in R&D services, so the related expenditures for R&D are considered as operating costs for its main business instead of an R&D investment during the accounting. Accord-ing to its 2021 interim report, Pharmaron has met or even exceeded the market expectations by achieving an operating income of CNY 3.286 billion, or a year-on-year increase of 49.81%, while its net profit after deducting the non-recurring profit and loss attributable to the owners of the parent company was CNY 583 million, or a year-on-year increase of 61.16%. This is a spectacular result that further proves the effectiveness of our ranking system. In the words of the company’s manage-ment, the key to Pharmaron’s success lies in attaching importance to technological innovation, while seizing every available opportunity to make advancement in terms of future technologies. To verify this, our research team conducted interviews with the management and analysed the compa-ny’s development trajectory, and it found that Pharmaron has indeed made sufficient preparations in terms of capitalising on the market opportunities and positioning itself strategically for future growth.
Pharmaron Beijing Co., Ltd. (hereinafter referred to as “Pharmaron”, 300759.SZ/3759.HK) ranks first among China’s next 100 global giants, with a score of 82.25. Founded in 2004, Pharmaron is a global leading life sciences R&D service company that was listed on the Shenzhen Stock Exchange ChiNext and the Hong Kong Stock Exchange Main Board in 2019. After more than a decade of rapid growth, Pharmaron has established a comprehensive, integrated platform for drug R&D, covering synthetic/medicinal chemistry, biology, drug metabolism and pharmacokinetics, pharmacology, drug safety evaluations, radiolabelled chemistry, radiolabelled metabolism, clinical pharmacology, clinical analysis, process optimization and production of active pharmaceutical ingredients and finished pharmaceuticals, clinical contract research organisation (CRO) as well as other areas. The company has entities operating in China, the US and the UK, with a workforce of more than 12,000 employees, as well as top research personnel offering high-quality R&D services. Highly-acclaimed in the global pharmaceutical industry, the company maintains long-term and stable cooperative relationships with various pharmaceutical companies and institutions across North America, Europe, Japan and China.
Pharmaron showed almost no shortcom-ings in any of the indicators used in our current ranking. The company performed superbly in the financial indicators such as historical growth, rate of return, earnings quality, cash flow and capital expenditures, while belonging to an industry – the phar-
Case Study 1: Pharmaron Inc. – A one-of-a-kind leader in global pharmaceutical R&D service integration
The company has adopted a steady ap-proach to its business expansion. At the beginning of its operations, Pharmaron made use of its capabilities in laboratorial chemistry to establish its place in the pharmaceutical industry, where an empha-sis was put on drug discoveries and other relevant areas. Its business scope was later expanded to cover additional aspects such as biological sciences, CMC (Chemical Manufacturing and Control), clinical CRO, macromolecules, and cell and gene ther-apy services. To elaborate, the company’s laboratory services mainly include labo-ratorial chemistry and biological science services, as laboratorial chemistry is the cornerstone of drug R&D - which was also the starting point of Pharmaron’s business growth. As such, the company has already spent a considerable amount of time on developing its comprehensive laboratory services to a sophisticated level, and these services represent the core driving force of the company’s current performance, from which its steady future growth can be derived and maintained. In 2008, Pharma-ron began to engage in the CMC business, in which it achieved rapid growth thanks to business leads from its existing front-end operations in laboratorial chemistry and biological sciences. As the company’s early-stage CMC projects gradually shifted from front-end to back-end innovations, the continuous expansion and release of its production capacity allowed substan-tial results to be delivered, leading to an overall acceleration of its business growth in the CMC business. On the other hand,
Cases of Next 100 Global Giants
CHINA’S NEXT 100 GLOBAL GIANTS (2020 EDITION)
28

chemical reaction screening platforms, fluid chemistry and biological enzyme catalysis in chemical synthesis and produc-tion technologies. In terms of new drug discoveries and biological sciences, the company has established and improved a series of technology platforms that cover the DNA-encoded compound library (DEL), chemical proteomics, in-vivo imaging, 3D cell microspheres and organoid screening. In addition, the company has built a lead-ing full-process integrated pharmaceutical R&D service platform. With this platform, the company can provide the full range of R&D services required for any particular stage of innovative drug development, while allowing for better exchanges of business leads between the different business platforms of the company and facilitating their deeper understanding of the R&D process. In return, this benefits the customer by shortening the R&D timeline and reducing risks. In 2020, more than 90% of the company’s revenue came from repeat customers. In addition, more than 80% of the revenue concerning in-vivo and in-vitro bioscience services in the drug discovery phase came from existing laboratorial chemistry customers, while 77% of the CMC services revenue came from existing customers of drug discovery services. There was also an increase in the number of R&D personnel: from 6,401 in 2019 (representing 87% of the entire com-pany) to 9,827 in 2020 (representing 89% of the entire company). After the company went public, it launched three equity incen-tive plans in 2019, 2020 and 2021, in which restricted shares were granted to key exec-
Pharmaron’s clinical research services include clinical laboratory services, on-site management, regulatory bioanalysis and radiolabelling sciences services. These services were launched relatively late com-paring to other areas, with an early-stage focus on acquisitions in the UK and the US. By 2019, the company had begun to be en-gaged in the domestic clinical CRO market in China and successfully acquired CR Medicon and Beijing Linkstart. At present, Pharmaron’s clinical CRO business network covers China, the US and the UK, and it is expected that further rapid growth will be realised from the company’s increasing cultivation of the Chinese domestic market. Furthermore, Pharmaron also expanded into the areas of macromolecules and cell and gene therapy services in 2019, which have since undergone significant growth as a business platform, both internally and via acquisitions. The company acquired Absorption System and Allergan Biologics Limited in 2020 and 2021 respectively (the latter is mainly engaged in CDMO (Contract Development and Manufacturing Organisation) services for cell and gene therapy products), and its macromolecules and cell and gene therapy services have been treated as an independent module in the company’s accounting since 2021. It is foreseeable that the company will continue to strive for advancement in this sector.
As a provider of R&D services, Pharma-ron’s research capabilities and technical expertise have always been the basis of its competitiveness. In recent years, the company has focused on strengthening the applications for high-throughput
utives, mid-level and low-level managers, as well as to key technical personnel and other technicians. These plans have helped to incentivise the company’s core employees and bind their personal inter-ests with the company’s overall prospect, which is an additional factor in driving its long-term development.
Pharmaron has placed great importance to the establishment of an ESG management system, which resulted in a high score of 82 points for social responsibility. The com-pany also performed exceptionally in the areas of environmental protection, employ-ee rights, charity assistance and others, while professional funding was organised for universities and research institutes at home and abroad. Pharmaron adheres to the concept of sustainable development by integrating sustainability and green practices into its daily operations, as well as promoting employee development and actively participating in charity activities. This has allowed the company to establish a good public image and will ultimately create benefits for its long-term growth.
As one of the leaders in the integration of global pharmaceutical R&D services (CXO), Pharmaron is relying on its com-petitive R&D services to grow into a key participant of the industry. By actively positioning itself in new growth segments, the company has laid a solid foundation for its future development. Having ranked first among China’s next 100 global giants, our research team believes that Pharma-ron has a bright future ahead.
CHINA’S NEXT 100 GLOBAL GIANTS (2020 EDITION)
29
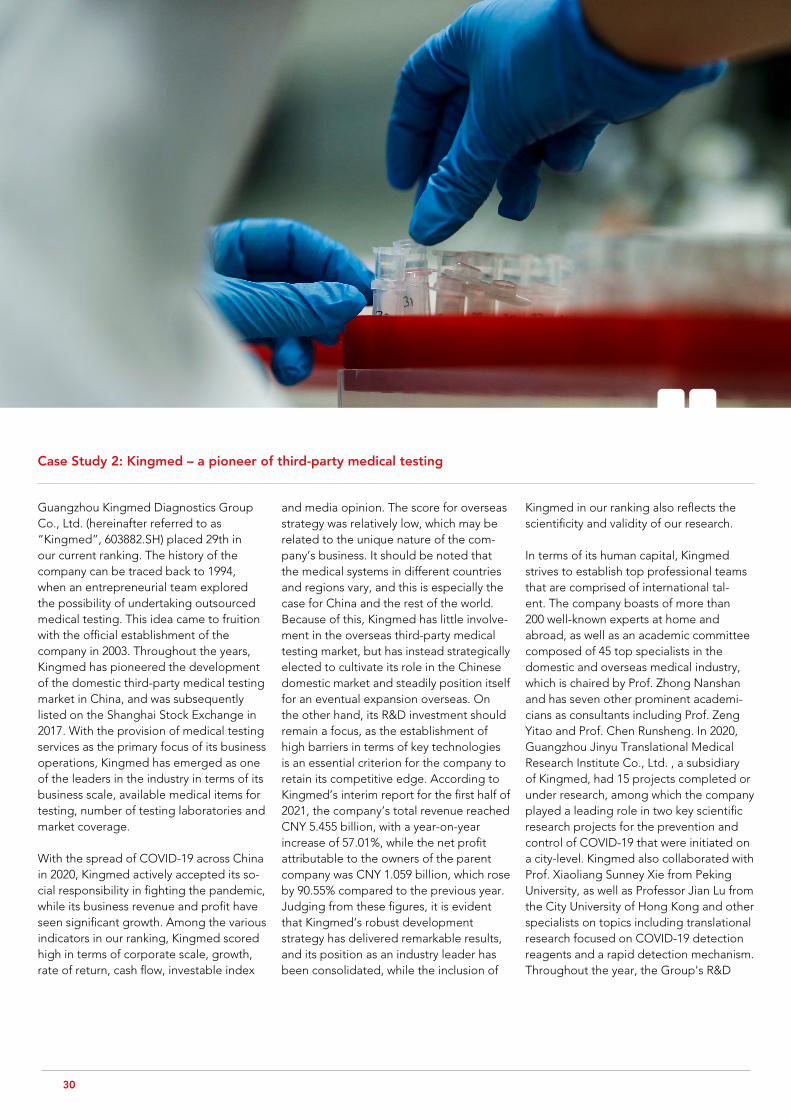
and media opinion. The score for overseas strategy was relatively low, which may be related to the unique nature of the com-pany’s business. It should be noted that the medical systems in different countries and regions vary, and this is especially the case for China and the rest of the world. Because of this, Kingmed has little involve-ment in the overseas third-party medical testing market, but has instead strategically elected to cultivate its role in the Chinese domestic market and steadily position itself for an eventual expansion overseas. On the other hand, its R&D investment should remain a focus, as the establishment of high barriers in terms of key technologies is an essential criterion for the company to retain its competitive edge. According to Kingmed’s interim report for the first half of 2021, the company’s total revenue reached CNY 5.455 billion, with a year-on-year increase of 57.01%, while the net profit attributable to the owners of the parent company was CNY 1.059 billion, which rose by 90.55% compared to the previous year. Judging from these figures, it is evident that Kingmed’s robust development strategy has delivered remarkable results, and its position as an industry leader has been consolidated, while the inclusion of
Guangzhou Kingmed Diagnostics Group Co., Ltd. (hereinafter referred to as “Kingmed”, 603882.SH) placed 29th in our current ranking. The history of the company can be traced back to 1994, when an entrepreneurial team explored the possibility of undertaking outsourced medical testing. This idea came to fruition with the official establishment of the company in 2003. Throughout the years, Kingmed has pioneered the development of the domestic third-party medical testing market in China, and was subsequently listed on the Shanghai Stock Exchange in 2017. With the provision of medical testing services as the primary focus of its business operations, Kingmed has emerged as one of the leaders in the industry in terms of its business scale, available medical items for testing, number of testing laboratories and market coverage.
With the spread of COVID-19 across China in 2020, Kingmed actively accepted its so-cial responsibility in fighting the pandemic, while its business revenue and profit have seen significant growth. Among the various indicators in our ranking, Kingmed scored high in terms of corporate scale, growth, rate of return, cash flow, investable index
Case Study 2: Kingmed – a pioneer of third-party medical testing
Kingmed in our ranking also reflects the scientificity and validity of our research.
In terms of its human capital, Kingmed strives to establish top professional teams that are comprised of international tal-ent. The company boasts of more than 200 well-known experts at home and abroad, as well as an academic committee composed of 45 top specialists in the domestic and overseas medical industry, which is chaired by Prof. Zhong Nanshan and has seven other prominent academi-cians as consultants including Prof. Zeng Yitao and Prof. Chen Runsheng. In 2020, Guangzhou Jinyu Translational Medical Research Institute Co., Ltd. , a subsidiary of Kingmed, had 15 projects completed or under research, among which the company played a leading role in two key scientific research projects for the prevention and control of COVID-19 that were initiated on a city-level. Kingmed also collaborated with Prof. Xiaoliang Sunney Xie from Peking University, as well as Professor Jian Lu from the City University of Hong Kong and other specialists on topics including translational research focused on COVID-19 detection reagents and a rapid detection mechanism. Throughout the year, the Group's R&D
30
nities to optimise its scientific research and innovation mechanism, which is centred on the Group’s R&D Centre and Translational Medical Research Institute. In addition, the company is making continuous efforts to keep track of the latest technologies in medical diagnoses and seeks to stay ahead of the market, while putting more resourc-es into translational research, thus estab-lishing the basis for its key technologies to drive future growth.
Since the outbreak of COVID-19, Kingmed has been making effective use of its professional advantages in relation to its detection capabilities and logistics network to assist the provinces and cities across China in carrying out nucleic acid testing for prevention and control of the epidemic, which resulted in a significant boost to its corporate image. The company has successively carried out nucleic acid tests across 31 provinces and municipalities including Hubei, Guangdong, Jilin and Beijing, as well as the Hong Kong and Macau Special Administrative Regions. As of the end of September 2021, the total number of tests conducted exceeded 172 million, while the testing capacity per day reached 1.1 million. Under the guidance of the Guangzhou laboratory, the company has launched a joint operations task force comprised of the central laboratories,
centre concluded the development of 184 new projects and upgraded key solutions concerning its whole exome sequencing tests and solid tumour panel tests (that cover 529 genes), which have effectively improved the detection capabilities and testing standards of key disease lines.
As for its key technologies, Kingmed has established 38 central laboratories across Mainland China, Hong Kong and Macau, which can undertake more than 2,800 types of outsourced test items while also providing scientific research and technical services. In terms of innovations, Kingmed takes an independent, collaborative and open approach by continuously enhancing its key technologies and innovation plat-form. At present, the company possesses comprehensive diagnostic technologies and a corresponding service platform that covers nucleic acid testing, protein and metabolite testing, as well as tissue, pathogenic microbial cells and subcellular morphology testing. At the same time, Kingmed is striving to meet the demands of clinicians and patients by establishing a number of clinical and disease-oriented, lab-based comprehensive diagnostic centres, which has also allowed for the creation of a network that makes use of the company’s key technologies. By mak-ing practical use of these new innovations, Kingmed is constantly exploring opportu-
“Falcon” air film laboratories and the “Falcon” mobile testing vehicles. The task force is responsible for actively assisting the government in tackling issues related to sampling site management, information management, cold chain logistics and the test report upload system. In the long run, as the government and all sectors of the society are becoming much more aware of Kingmed and the third-party medical testing industry it represents, there will be more room for growth for the company and the industry as a whole.
Following management interviews and a company analysis, our research team be-lieves that Kingmed already possesses the technologies and products that will allow the company to be a leader in the industry. With a wide-ranging and sophisticated service network, as well as a diversified and professional workforce, Kingmed should undoubtedly be considered as a “unicorn” in the third-party medical testing industry. Our research team further believes that such an achievement is inextricably linked to the company’s long-term cultivation within the industry, which is necessary for mastering the key technologies and achieving a strong domestic market posi-tion. It is foreseeable that the substantial growth that we have witnessed in the past year will be sustained in the future.
CHINA’S NEXT 100 GLOBAL GIANTS (2020 EDITION)
31

capital expenditure, overseas strategy and media opinion. However, its scores for R&D investment and social responsibility fell slightly behind. In this regard, it should be noted that the score for R&D investment in our analysis is measured by dividing the R&D expenses by the sales expenses. Ecovacs scored 30 points in terms of its R&D investment, which is not unrelated to the nature of the company, as Ecovacs is a technology manufacturer that is orient-ed directly towards the end consumers. Compared with a traditional manufacturing company, its marketing expenses are relatively higher, which results in a bigger denominator in the abovementioned calculation, leading in turn to a lower score for its R&D investment. Nonetheless, it can be seen that Ecovacs is highly efficient in its R&D activities, which is evident from the fact that its new sweeping robots and “Tineco” floor scrubbers, designed and developed by the company itself, achieved a good sales performance and consumer reputation right after being launched in the market – an accomplishment that could not be realised without a high level of sophisti-cation and flexibility in R&D. In the first half of 2021, Ecovacs consistently increased its input into R&D, which exceeded CNY
Ecovacs Robotics Co., Ltd. (hereinafter referred to as “Ecovacs”, 603486.SH) ranked 51st on our list, with an overall score of 71.75. Founded in 1998, the company was primarily a vacuum cleaner ODM at the start of its operations. With a continuous R&D investment as well as by strengthening of its market position, Ecovacs gradually gained the capability to launching its self-developed products. As the company grew, its product lines were constantly expanded and optimised, and new household cleaning robotic products were regularly launched to replace older models. After having achieved great renown as a manufacturer of service robots, Ecovacs was listed on the Shanghai Stock Exchange in 2018. At present, the company has successfully developed and launched a complete product line of household robots, which includes the sweeping robots “Deebot”, window cleaning robots “Winbot” and the air purification robots “Atmobot”, as well as a series of robots for commercial purposes.
Among all the indicators in our analysis, Ecovacs showed an outstanding perfor-mance in terms of its rate or return, earn-ings quality, cash flow, investable index,
Case Study 3: Ecovacs – a successful transformation from ODM to launching its own brands
200 million, representing a year-on-year increase of 45.8%. These resourceful efforts in R&D have allowed Ecovacs to consolidate its technological advantages against its competitors. According to the interim report published by the company, its operating income was CNY 5.359 billion in the first half of 2021, representing a year-on-year increase of 123.11%, while its net profit attributable to the owners of the parent company reached CNY 850 million, or a year-on-year increase of 543.25%. These positive figures justify the inclusion of Ecovacs in our current ranking.
Ecovac’s spectacular results can be at-tributed to the strategic, forward-looking mindset of its management. In 2019, the company’s management chose the right moment to take the initiative and make some strategic adjustments. Specifically, the company withdrew from ODM and phased out the production of its older models (where robots follow a random route when cleaning), while increasing its R&D investment and putting significant ef-forts into developing its own brands, which resulted in the launch of the two smart life appliance brands “Tineco” and “Ecovacs”. Despite a decline in 2019, the company
32
Ecovacs has adopted a holistic marketing strategy, covering both online and offline channels. On the internet, the company established a presence on emerging traffic platforms (e.g. Douyin, Kuaishou and Xiaohongshu) for the purpose of customer acquisition and marketing, while in terms of its brick-and-mortar locations, the company is actively establishing brand experience stores with a digitalised and contextualised approach to improve the ef-ficiency of the store operations, in addition to maintaining cooperation with platforms including Suning, Gome, Sam’s Club and Costco. Furthermore, the company is optimising its position globally, having established a business network centred on the US, Germany and Japan to cover the major international markets. In the first half of 2021, the overseas business revenue of the Ecovacs brand achieved a year-on-year increase of 134.8%, while an increase of 452.8% year-on-year has been recorded for the Tineco brand.
In terms of social responsibility, Ecovacs has organised and undertaken a series of community projects, and it has the capacity to do more in the future. In the management interview conducted by our research team, it was mentioned that the founder of the company, Mr Qian Dongqi, has set up a scholarship and research fund for his alma mater, Nanjing University, in
regained its footing and achieved substan-tial growth in the following years. High-end newer models (where robots follow a pre-designated path that can cover the entire floor) now account for a much higher portion of the company’s total revenue, and the “Tineco” brand is far ahead of its competitors in terms of the market share, occupying 76.5% of the domestic scrubber market in China. These accomplishments showcase the effectiveness of the compa-ny’s strategic transformation.
In terms of technological innovations and product development, Ecovacs possesses complete and comprehensive research capabilities in high-precision sensors, mod-ules, high-performance motors and other smart hardware core components, as well as an extraordinary degree of foresight that is essential for the creation of new products. Supported by a broad range of sophisticated technologies, Ecovacs’ cleaning robots underwent rapid changes with the newer models launched in quick succession. At the same time, the company began to expand into the cooking and personal care markets with the launch of a series of new products, including the well-acclaimed Tineco “Chiere” intelligent cooking machine. A noteworthy achieve-ment is that on the first day of the Tmall 618 shopping festival, “Chiere 2.0” ranked first in the sales of cooking machines.
his own name. At the company level, a robot education fund has been set up to help children from poverty-stricken areas, and training centres has been founded to cultivate innovative and technological talents. A robot museum was also built in Suzhou and is open to the public. As a manufacturing enterprise that is directly oriented towards the end consumers, such an investment in social responsibility is conducive to the sustainable development of the company and the establishment of a good company image.
Our research team believes that the com-pany’s management has made a bold but correct decision in retiring from the tradi-tional ODM operations, while re-adjusting its strategic focus toward technological de-velopment and launching its own brands, thus providing a solid foundation for the company’s long-term growth in the future. Our team also expects that Ecovacs will go much further on this path to become one of the leaders in the thriving household cleaning industry.
CHINA’S NEXT 100 GLOBAL GIANTS (2020 EDITION)
33
Appendix: Participating companies and data sources
CHINA’S NEXT 100 GLOBAL GIANTS (2020 EDITION)
The ranking of China’s Next 100 Global
Giants focused on listed Chinese private
enterprises. Specifically, they include
private companies that are listed on the
stock exchanges of China (SSE, SZSE and
GEM) or those in other countries/regions
such as the HKEX, NASDAQ, NYSE and
SGX. Our decision on the companies to be
included was based on the following four
considerations:
First, the availability and authenticity
of the data. Subject to mandatory
disclosures and requirements from the
regulators, listed companies regularly
disclose financial statements that are
signed and audited by certified public
accountants each year. This requirement
ensures the availability of the data which
is necessary to produce our ranking. More
importantly, the authenticity and credibility
of the data can be reasonably guaranteed.
In contrast, the financial data from non-
listed companies might not be complete
or available in a continuous manner. A
lack of competent regulators and audit
requirements also means the data quality
cannot be guaranteed. Therefore, if our
ranking includes non-listed companies
based on their own data, the objectivity
and authenticity of the ranking can no
longer be fully assured.
Second, the comparability of the data
among different enterprises. To provide
an effective basis for our ranking, our
research team analysed the companies
based on their public information (financial
data and statements, etc.) and assigned
them a score accordingly. The premise of
such a data analysis is the comparability of
the corporate information. Due to a lack
of standardised disclosure requirements
and consistency in the preparatory basis
of such information, the data obtained
from non-listed companies is often not
comparable. It is indeed true that the
information disclosed in the annual reports
from companies listed on different stock
exchanges might differ due to the fact
that the regulatory requirements among
different capital markets are not entirely
consistent, but the basic principles of the
information disclosures tend to be aligned
to the international accounting standards
and this can offset the impact from such
differences to some extent. This means
that for companies listed on different
stock exchanges, their disclosed data is
still largely comparable. Using the same
or similar types of information as the basis
of the measurement allows our scores and
rankings to reflect the differences in the
performance of the companies in a fair and
objective manner.
Third, the source of the media opinion.
Our research team believes that mandatory
disclosures of financial data serve only
as part of the rationale for an investment
decision. In addition to such disclosures,
the media’s reports and analyses of
company events should not be neglected,
as the news reports will often contain
information not included in the official
financial reports and reveal risks which
a company is not willing to disclose. A
comprehensive examination of various
information sources is conducive to an
accurate evaluation of the development
of a company. In comparison with
the regular disclosures, the analytical
information conveyed by the news media
can reflect the strengths and hidden risks
of a company’s daily operations in a more
timely and dynamic manner.
Fourth, the importance of listed
companies to China’s economic growth.
Being the mainstay of China’s economy,
the listed companies play a decisive role
in its growth. According to a survey, the
total operating income of China’s listed
companies in 2020 was valued at CNY
53.07 trillion, accounting for 52% of the
GDP in the same period. The net profit
was CNY 3.99 trillion, equivalent to 62%
of the total profit of industrial enterprises
34
CHINA’S NEXT 100 GLOBAL GIANTS (2020 EDITION)
above the designated size (with an annual
main business revenue of CNY 20 million
or more) in China. As such, the listed
companies have become the backbone
of the Chinese economy. Companies
with good development prospects and
technological advantages often go
public in order to broaden their financing
channels, and it is therefore viable to
produce a ranking based on an analysis of
the listed companies.
Based on the above considerations, the
survey data for this ranking was mainly
collected from the GTA CSMAR, WIND
and COMPUSTAT Global databases,
which include data related to the finances
and corporate governance of companies
listed in China and overseas, such as their
assets and liabilities, operating income,
fixed assets, cash flow, accruals, overseas
income and R&D investment, as well as
the companies’ ownership, time of listing,
location of listing, industry, domicile and
other corporate governance and basic
information. Other data and information
provided in the “Management Discussion
and Analysis" sections of the companies’
annual reports were also taken into
account. During our research, we also
collected and organised news reports
concerning the companies by utilising
the quantitative media opinion data
platform of DataGo Technology Ltd. On
the basis of relevant academic research,
this data platform is jointly developed by
researchers from the Chinese University of
Hong Kong, Stanford University, University
of Southern California and other institutes.
Machine learning and natural language
processing is adopted to conduct the
meticulous sorting, analysis and verification
of thousands of collected original new
items (relevant news of all listed companies
published by the newspapers since 1998),
and a quantitative sentiment orientation
of any listed company can be calculated
with stringent academic standards.
The sentiment value generated by the
platform is a continuous and comparable
score, which lies between -1 and 1 (with
1 being the most positive and -1 being
the most negative). Our research team
also performed cross-checking with the
aforementioned databases to ensure the
authenticity and credibility of the data.
The first criteria in the selection of the
listed companies for our ranking was that
they must have raw financial data available
for two consecutive years from 2018 to
2020. We believe that three years is a
sufficient amount of time to reflect whether
a company’s performance is sustainable,
and the values shown in the indicators
are also more consistent than those
representing a shorter period of time.
To match the corresponding data, our
report excluded the relevant incomplete
values, which included the company data
of specific years where the financial and
corporate governance information was
missing or incomplete. We also excluded
ST-Type companies (companies under
Special Treatment) and companies from
the finance industry; the former was due
to the fact that the financials of ST-Type
companies tend to be unusual, which could
affect the credibility of the conclusion of
our research, and the latter was because
the development model and ways of
disclosing financial data in the finance
industry is significantly different from that
in other sectors, which results in a lack of
comparability. In addition, the size of the
entire finance industry is comparatively
huge, and any inclusion of financial
companies in our ranking would result in
a bias due to the size difference. For the
companies that are listed in both China
and Hong Kong, we only considered the
data from China’s stock exchange in our
analysis. As was mentioned before, state-
owned enterprises were excluded as our
report as we aimed to focus on the future
giants among private enterprises. Based
on these considerations and data selection
methods, our research team determined
3,749 listed companies for the analysis.
35
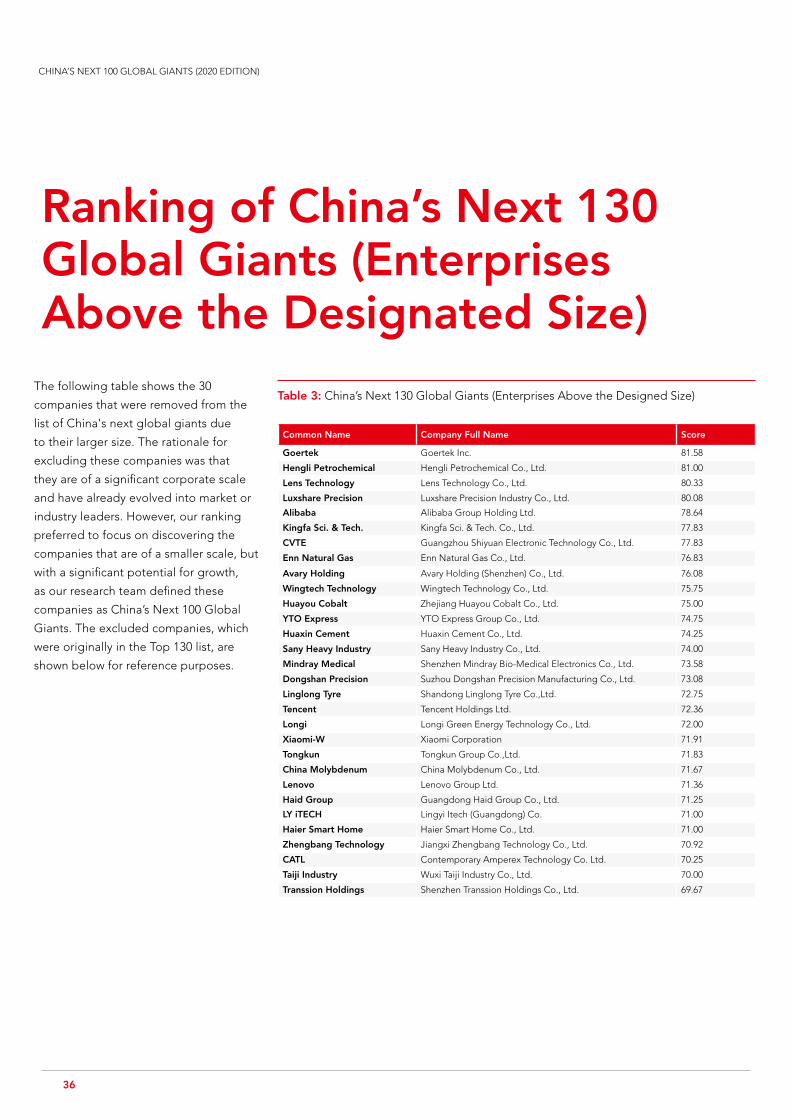
The following table shows the 30
companies that were removed from the
list of China's next global giants due
to their larger size. The rationale for
excluding these companies was that
they are of a significant corporate scale
and have already evolved into market or
industry leaders. However, our ranking
preferred to focus on discovering the
companies that are of a smaller scale, but
with a significant potential for growth,
as our research team defined these
companies as China’s Next 100 Global
Giants. The excluded companies, which
were originally in the Top 130 list, are
shown below for reference purposes.
Ranking of China’s Next 130 Global Giants (Enterprises Above the Designated Size)
Common Name Company Full Name Score
Goertek Goertek Inc. 81.58
Hengli Petrochemical Hengli Petrochemical Co., Ltd. 81.00
Lens Technology Lens Technology Co., Ltd. 80.33
Luxshare Precision Luxshare Precision Industry Co., Ltd. 80.08
Alibaba Alibaba Group Holding Ltd. 78.64
Kingfa Sci. & Tech. Kingfa Sci. & Tech. Co., Ltd. 77.83
CVTE Guangzhou Shiyuan Electronic Technology Co., Ltd. 77.83
Enn Natural Gas Enn Natural Gas Co., Ltd. 76.83
Avary Holding Avary Holding (Shenzhen) Co., Ltd. 76.08
Wingtech Technology Wingtech Technology Co., Ltd. 75.75
Huayou Cobalt Zhejiang Huayou Cobalt Co., Ltd. 75.00
YTO Express YTO Express Group Co., Ltd. 74.75
Huaxin Cement Huaxin Cement Co., Ltd. 74.25
Sany Heavy Industry Sany Heavy Industry Co., Ltd. 74.00
Mindray Medical Shenzhen Mindray Bio-Medical Electronics Co., Ltd. 73.58
Dongshan Precision Suzhou Dongshan Precision Manufacturing Co., Ltd. 73.08
Linglong Tyre Shandong Linglong Tyre Co.,Ltd. 72.75
Tencent Tencent Holdings Ltd. 72.36
Longi Longi Green Energy Technology Co., Ltd. 72.00
Xiaomi-W Xiaomi Corporation 71.91
Tongkun Tongkun Group Co.,Ltd. 71.83
China Molybdenum China Molybdenum Co., Ltd. 71.67
Lenovo Lenovo Group Ltd. 71.36
Haid Group Guangdong Haid Group Co., Ltd. 71.25
LY iTECH Lingyi Itech (Guangdong) Co. 71.00
Haier Smart Home Haier Smart Home Co., Ltd. 71.00
Zhengbang Technology Jiangxi Zhengbang Technology Co., Ltd. 70.92
CATL Contemporary Amperex Technology Co. Ltd. 70.25
Taiji Industry Wuxi Taiji Industry Co., Ltd. 70.00
Transsion Holdings Shenzhen Transsion Holdings Co., Ltd. 69.67
Table 3: China’s Next 130 Global Giants (Enterprises Above the Designed Size)
CHINA’S NEXT 100 GLOBAL GIANTS (2020 EDITION)
36

About Shenzhen Finance InstituteIn response to the national “Belt and Road” initiative and the demand for a high-level
educational research institution driven by the Guangdong-Hong Kong/Shenzhen-Hong
Kong cooperation and Shenzhen’s economic and social development, and with the
aim to meet the expectations from global mainstream academia and industry towards
a research and exchange platform with an “international height and Chinese depth”,
as well as to address the opportunities and challenges brought about by the profound
adjustment of the world’s financial and economic landscape, the Shenzhen Municipal
Government appointed the Chinese University of Hong Kong (Shenzhen) to establish the
Shenzhen Finance Institute, which is set to become an internationally influential base for
innovative talent training in the fields of finance and the economy, as well as being an
international high-level research platform, an international high-tier academic exchange
platform and a highly-qualified decision-making think tank.
For more information, please visitsfi.cuhk.edu.cn
About ACCAACCA (the Association of Chartered Certified Accountants) is the global
professional body for professional accountants.
We’re a thriving global community of 233,000 members and 536,000 future members
based in 178 countries and regions, who work across a wide range of sectors and
industries. We uphold the highest professional and ethical values.
We offer everyone everywhere the opportunity to experience a rewarding career in
accountancy, finance and management. Our qualifications and learning opportunities
develop strategic business leaders, forward-thinking professionals with the financial,
business and digital expertise essential for the creation of sustainable organisations and
flourishing societies.
Since 1904, being a force for public good has been embedded in our purpose. We
believe that accountancy is a cornerstone profession of society and is vital in helping
economies, organisations and individuals to grow and prosper. It does this by creating
robust trusted financial and business management, combating corruption, ensuring
organisations are managed ethically, driving sustainability, and providing rewarding
career opportunities.
And through our cutting-edge research, we lead the profession by answering today’s
questions and preparing for the future. We’re a not-for-profit organisation.
Find out more about us at www.accaglobal.com
Research Team
Researchers
Tianyu ZHANG
Danling SONG
Shubo ZHANG
Shenzhen Finance Institute
ACCA
Yuki QIAN
Head of Policy, ACCA China
Expert Adviser
Xiaohu ZHANG
Head of Risk Management, ZTE Venture Capital Management Co., Ltd.


Copyright 2021 ACCA. Reproduction in whole or in part without prior permission is prohibited. While every effort has been made to ensure accuracy, ACCA is not responsible for any errors. Views expressed in this report are not necessarily those of ACCA.