Performance Analysis of Gas Burner Using Producer Gas For ...
China’s leading
independent gas
producer
Oil Council – Beijing
September 15, 2015
“18 Years of CBM in China”
www.greendragongas.com
LSE: GDG.LN
This presentation does not constitute an invitation to underwrite, subscribe for, or otherwise acquire or dispose of any shares of Green Dragon Gas Ltd. (the
“Company”) in any jurisdiction. The Company’s shares have not been and will not be registered under the US Securities Act of 1933 (the “Securities Act”) and
may not be offered or sold within the United States absent registration under the Securities Act or an exemption from registration.
The information contained in this presentation is given in good faith but no representation or warranty is made in relation to the accuracy or completeness of the
information, or any oral information provided in connection therewith, or the data it generates and no responsibility, obligation or liability is or will be accepted by
the Company or its affiliates or advisors or by any of their respective officers, employees or agents in relation to it.
This presentation contains certain forward looking statements with respect to the financial condition, results, operations and businesses of the Company. The
statements and forecasts involve risk and uncertainty because they relate to events and depend on circumstances that will occur in the future. There are a
number of factors that could cause actual results or developments to differ materially from those expressed or implied by these forward looking statements and
forecasts.
Past performance is no guide to future performance and persons needing advice should consult an independent financial advisor.
This presentation and the information contained in it are confidential and should not be distributed, published or reproduced, in whole or in part, or disclosed by
recipients directly or indirectly to any other person.
Disclaimer
2

The Long Unconventional March
contributing to energy independence
3
0
1 year
2 years
3 years
4 years
5 years
6 years
7 years
8 years
9 years
10 years
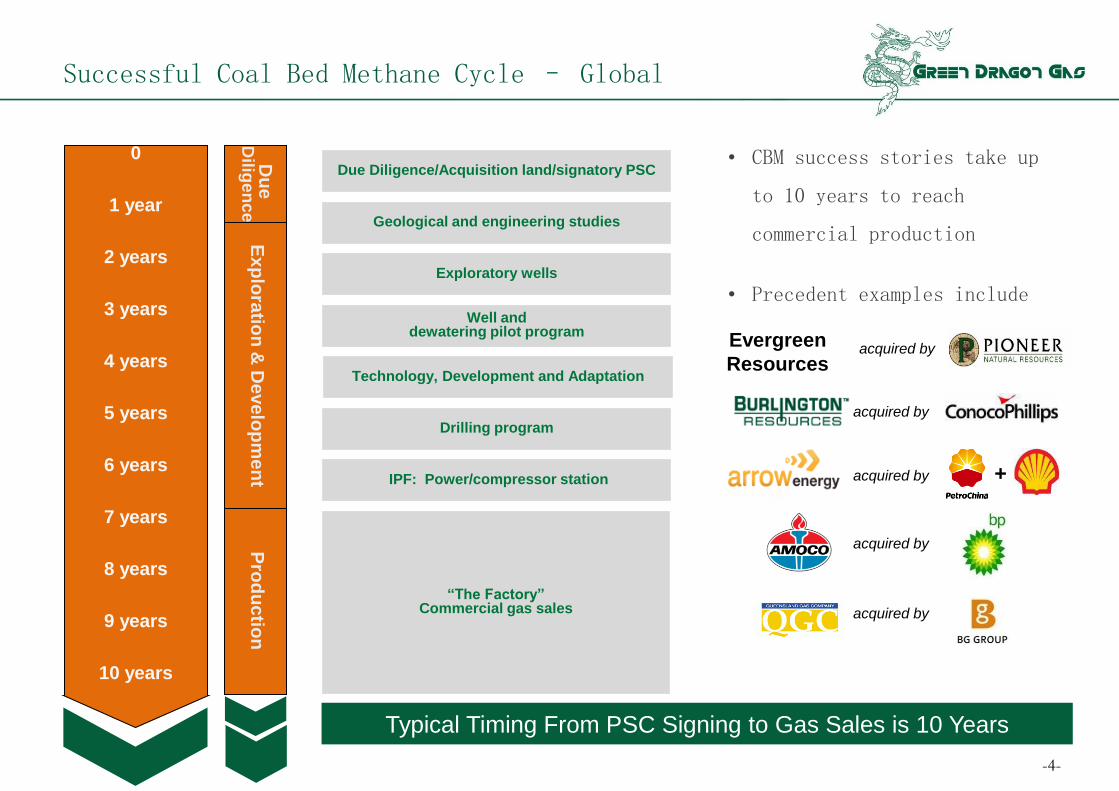
“The Factory” Commercial gas sales
Pro
du
ctio
n
Ex
plo
ratio
n &
De
ve
lop
me
nt
Exploratory wells
Drilling program
IPF: Power/compressor station
Well and dewatering pilot program
Due Diligence/Acquisition land/signatory PSC
Geological and engineering studies
Successful Coal Bed Methane Cycle – Global
-4-
Technology, Development and Adaptation
Typical Timing From PSC Signing to Gas Sales is 10 Years
• CBM success stories take up
to 10 years to reach
commercial production
• Precedent examples include
acquired by
acquired by
acquired by +
acquired by
Evergreen
Resources
acquired by
Du
e
Dilig
en
ce
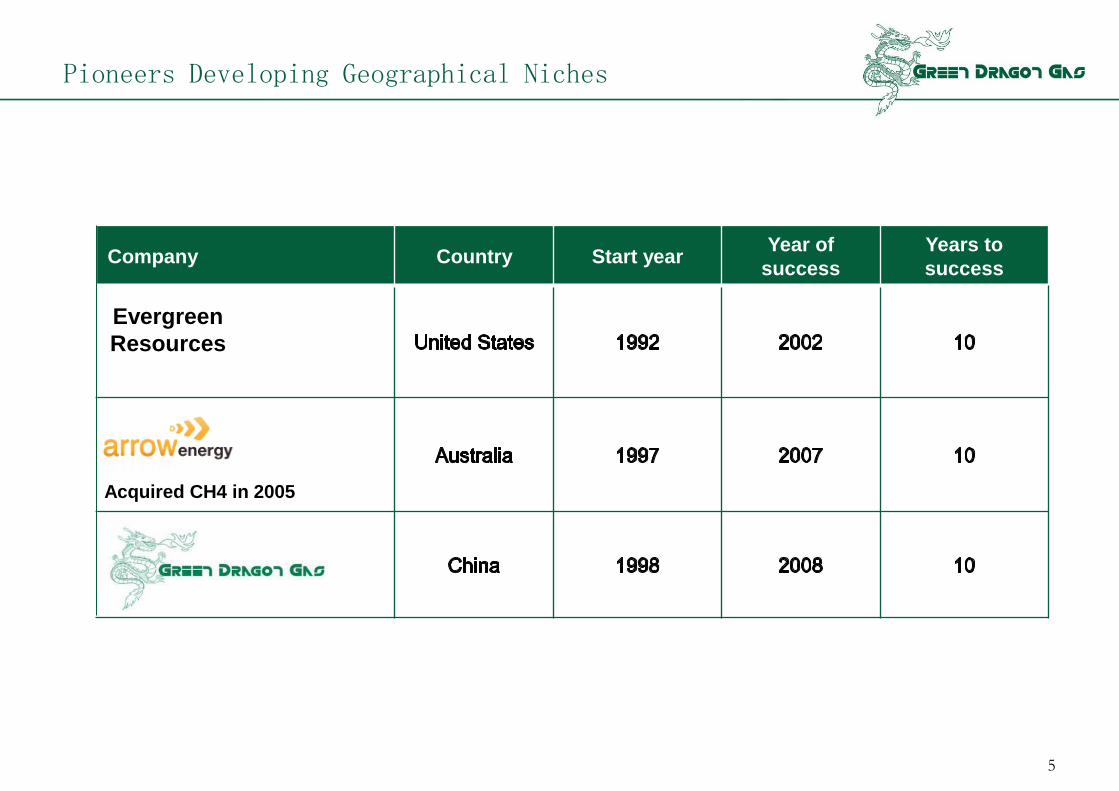
Pioneers Developing Geographical Niches
5
Company Country Start year Year of
success
Years to
success
Evergreen
Resources
Acquired CH4 in 2005
6
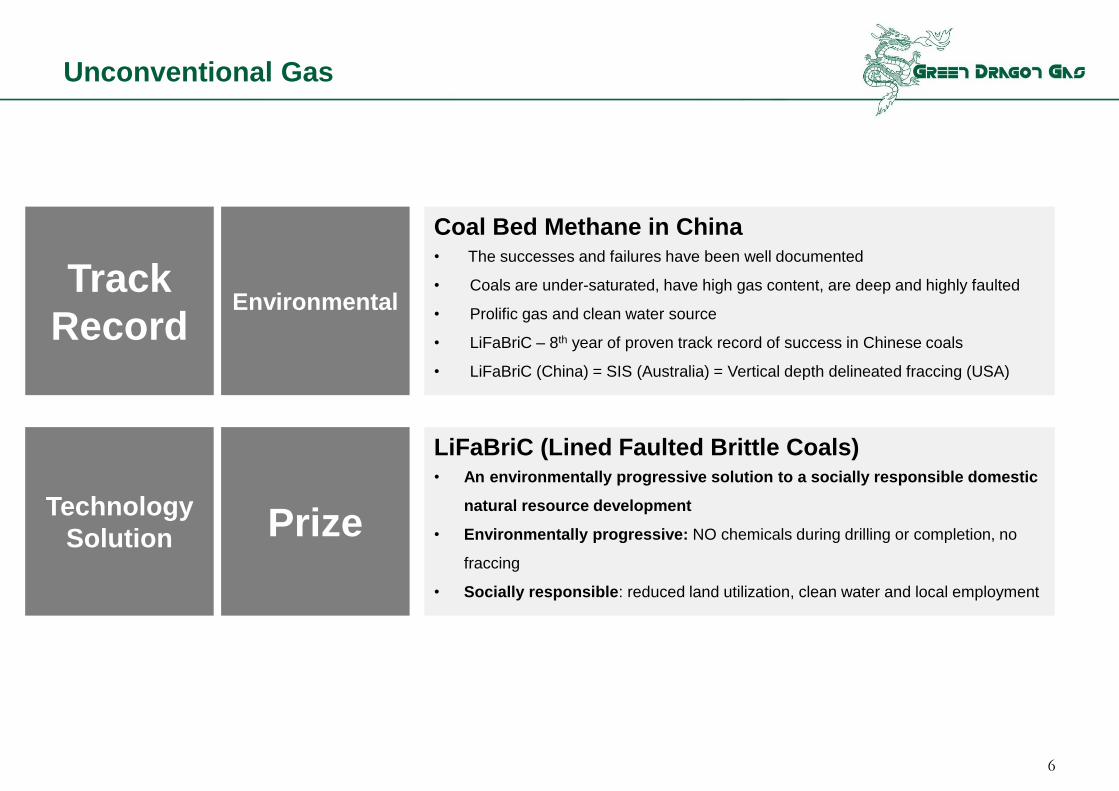
Unconventional Gas
Coal Bed Methane in China • The successes and failures have been well documented
• Coals are under-saturated, have high gas content, are deep and highly faulted
• Prolific gas and clean water source
• LiFaBriC – 8th year of proven track record of success in Chinese coals
• LiFaBriC (China) = SIS (Australia) = Vertical depth delineated fraccing (USA)
LiFaBriC (Lined Faulted Brittle Coals) • An environmentally progressive solution to a socially responsible domestic
natural resource development
• Environmentally progressive: NO chemicals during drilling or completion, no
fraccing
• Socially responsible: reduced land utilization, clean water and local employment
Track
Record Environmental
Prize Technology
Solution
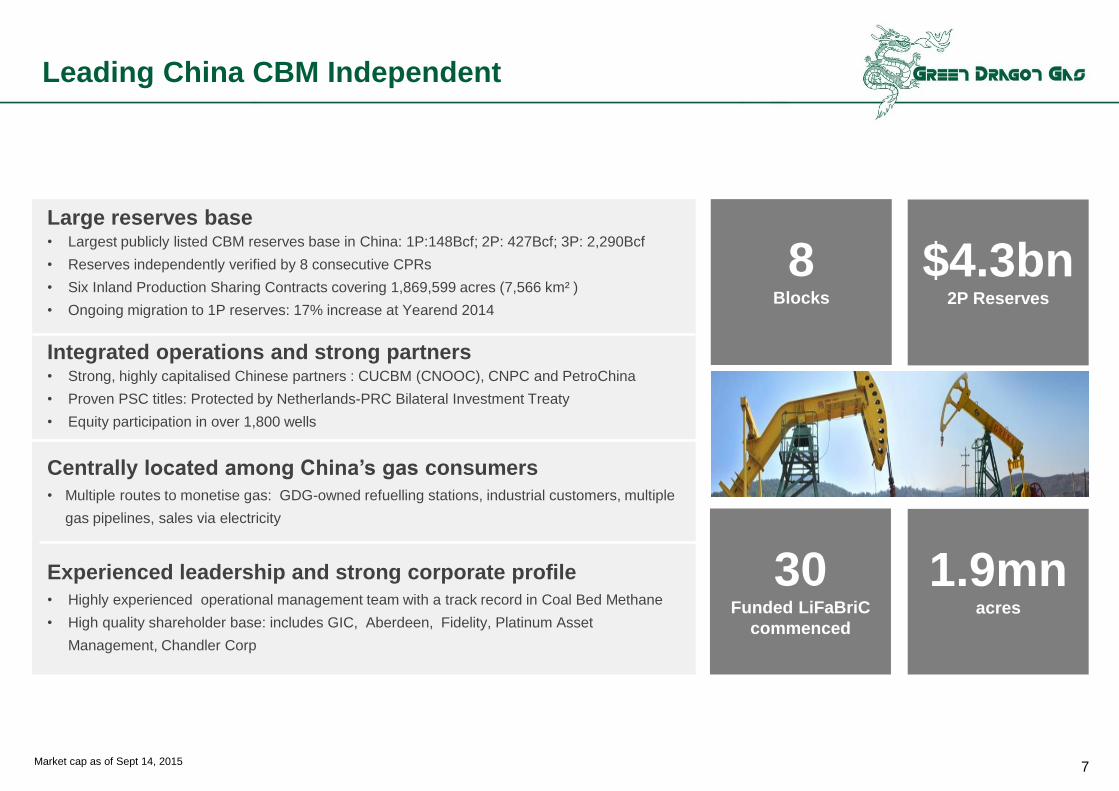
Leading China CBM Independent
Large reserves base • Largest publicly listed CBM reserves base in China: 1P:148Bcf; 2P: 427Bcf; 3P: 2,290Bcf
• Reserves independently verified by 8 consecutive CPRs
• Six Inland Production Sharing Contracts covering 1,869,599 acres (7,566 km² )
• Ongoing migration to 1P reserves: 17% increase at Yearend 2014
Integrated operations and strong partners • Strong, highly capitalised Chinese partners : CUCBM (CNOOC), CNPC and PetroChina
• Proven PSC titles: Protected by Netherlands-PRC Bilateral Investment Treaty
• Equity participation in over 1,800 wells
Centrally located among China’s gas consumers
• Multiple routes to monetise gas: GDG-owned refuelling stations, industrial customers, multiple
gas pipelines, sales via electricity
Experienced leadership and strong corporate profile
• Highly experienced operational management team with a track record in Coal Bed Methane
• High quality shareholder base: includes GIC, Aberdeen, Fidelity, Platinum Asset
Management, Chandler Corp
8 Blocks
$4.3bn 2P Reserves
30 Funded LiFaBriC
commenced
1.9mn acres
Market cap as of Sept 14, 2015 7

History and Corporate Milestones
1997 -1999
2000-2002
Technological
Breakthrough
• MWD (Measurement While Drilling) and LWD (Logging While Drilling) facilitate LiFaBriC development
Public
Floating on AIM
2003
First License
• GDG commences Chinese operations
• First PSC signed on the GFC block
Acquisition of four
additional licenses
• Commenced operations on the ground
• Signing of four other licenses including Shizhuang South
2006
2008
LiFaBriC
2009
Greka Engineering
and Technology
Dividend
2010
Greka Drilling
Dividend
• 8th March demerger of Greka Drilling
• Addition of 2 CNG stations in Pindingshan
• Upgrade of Infrastructure Production Facilities to support 28 new wells of gas production
2011
2012
Landmark
Government Ruling
• Chinese Gov’t rules in favor of Green Dragon on validity of PSC
2013
Binding Agreements
with CNOOC and
PetroChina
2014
Production Ramp-up
• Launch 150 LiFaBriC drilling program
First Gas
• Gas production commences at GSS
• Landmark agreements lead to shareholder participation in over 1,800 wells
• 30th Sept demerger of Greka Engineering
• Zhengzhou Greka Gas Co Ltd entered into a 20-year agreement with PetroChina Huabei Oilfield
• The Company listed on the Alternative Investment Market (“AIM”) in London on August 17, 2006
• “Lined Faulted Brittle Coal”
• improved drainage factor
FTSE 250
8

Upstream Asset Portfolio: 6 PSCs over 8 Blocks
Xinjiang
Tibet
Qinghai
Inner Mongolia
Heilongjiang
Jilin
Liaoning
Beijing
Hebei
ShandongNingxia
Gansu
Shanxi
Shaanxi
Jiangsu
HubeiShanghai
Zhejiang
Fujian
Jiangxi
Guizhou
Sichuan
YunnanGuangxi Guangdong
Hong Kong
Anhui
Hunan
Chongqing
Tianjin
Qinyuan PSC
(GQY PSC)
3,665km2
Baotian-
Qingshan
PSC (GGZ
PSC) 947km2
Fengcheng PSC
(GFC PSC)
1,541km2
Shizhuang South
PSC (GSS PSC)
388km2
Shizhuang
North PSC
(GSN PSC)
375km2
Chengzhuang
Block (GCZ
Block) 67km2
Existing main gas pipelines
CNG mother stations
Group CBM blocks
Capital of province
Henan
Panxie East PSC
(GPX PSC)
584km2
P Production
D Development / Pilot stage
EA Exploration & Appraisal
P
P
D
EA
EA
EA
EA
Both included under ShizhuangSouth PSC
GSS GDG interest: 60%
Partner: CUCBM (CNOOC)
Operator: GDG
1P/2P/3P: 132/372/1,299 bcf
LiFaBriC/vertical wells: 78/183
Total: 1,649 wells*
GCZ GDG interest: 47%
Partner: PetroChina
Operator: PetroChina
1P/2P/3P: 15.6 /28.5/45.3 bcf
LiFaBriC/vertical wells: 0/0
Total: 114 wells*
GSN GDG interest: 50%
Partner: CUCBM (CNOOC)
Operator: CUCBM (CNOOC)
1P/2P/3P: N/A / N/A / 706 Bcf
LiFaBriC/vertical wells: 3/10
Total: 201 wells*
GQY (A) GDG interest: 10%
Partner: CUCBM (CNOOC)
Operator: CUCBM (CNOOC)
1P/2P/3P: N/A
LiFaBriC/vertical wells: N/A / NA
Total: 7 wells*, 18 coal holes
GQY (B) GDG interest: 60%
Partner: CUCBM (CNOOC)
Operator: GDG
2C: 22.8Bcf
LiFaBriC/vertical wells: 14/30
Total: 59 wells*
GFC GDG interest: 49%
Partner: CUCBM (CNOOC)
Operator: GDG
1P/2P/3P: N/A / 27 / 240 Bcf
LiFaBriC/vertical wells: 2/26
Total: 32 wells*
GPX GDG interest: 60%
Partner: CUCBM (CNOOC)
Operator: GDG
1P/2P/3P: N/A
LiFaBriC wells/ vertical wells: 2/10
Total: 14 wells*, 14 coal holes
GGZ GDG interest: 60%
Partner: PetroChina
Operator: GDG
Best Prospective: 443 Bcf
LiFaBriC wells/vertical wells : 5/30
Total: 30 wells*, 30 coal holes
* Total wells is inclusive of non operated wells
Reserves by Netherland, Sewell & Associates, Inc as of December 31, 2014 9
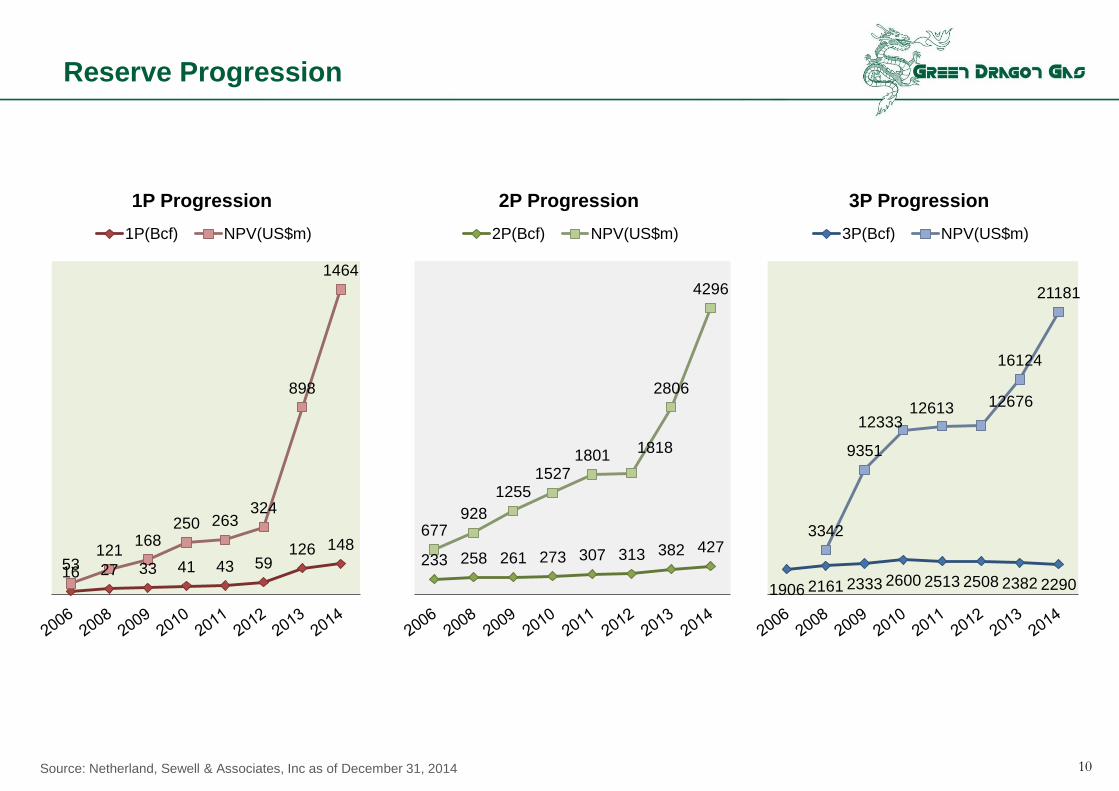
Reserve Progression
16 27 33 41 43 59 126 148
53 121
168 250 263
324
898
1464
1P Progression
1P(Bcf) NPV(US$m)
233 258 261 273 307 313 382 427 677
928
1255 1527
1801 1818
2806
4296
2P Progression
2P(Bcf) NPV(US$m)
1906 2161 2333 2600 2513 2508 2382 2290
3342
9351
12333 12613 12676
16124
21181
3P Progression
3P(Bcf) NPV(US$m)
Source: Netherland, Sewell & Associates, Inc as of December 31, 2014 10
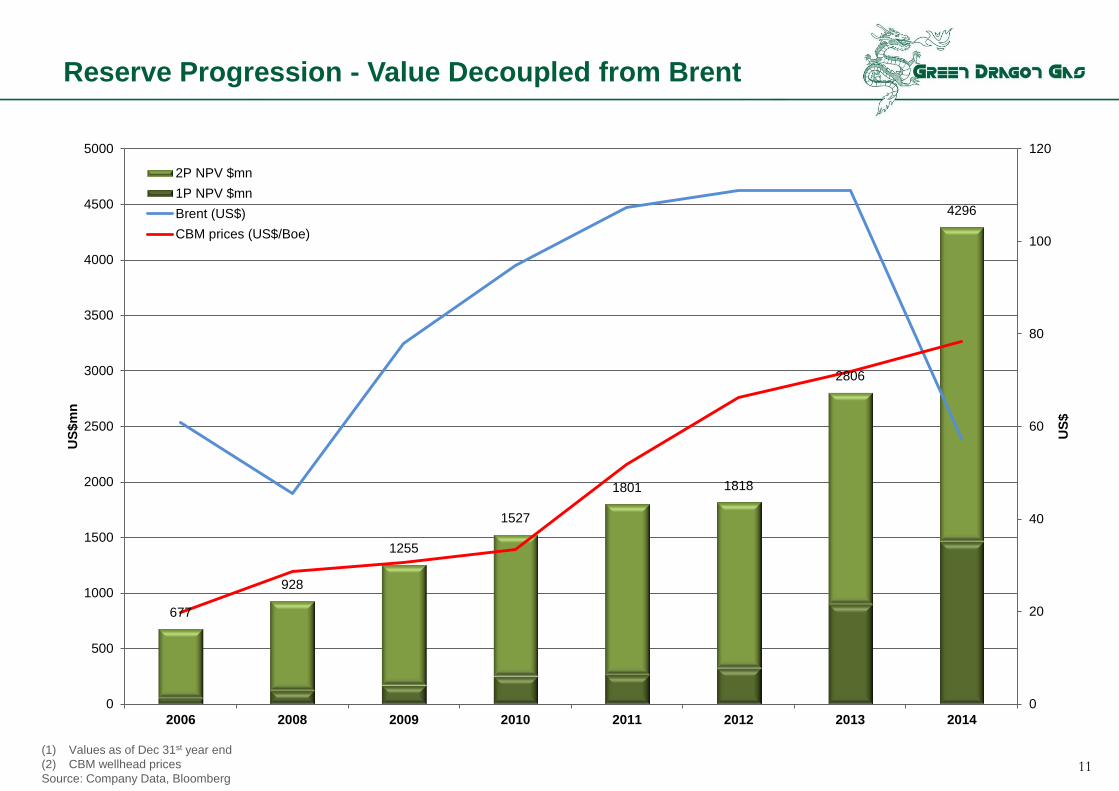
Reserve Progression - Value Decoupled from Brent
11
(1) Values as of Dec 31st year end
(2) CBM wellhead prices
Source: Company Data, Bloomberg
677
928
1255
1527
1801 1818
2806
4296
0
20
40
60
80
100
120
0
500
1000
1500
2000
2500
3000
3500
4000
4500
5000
2006 2008 2009 2010 2011 2012 2013 2014
US
$
US
$m
n
2P NPV $mn
1P NPV $mn
Brent (US$)
CBM prices (US$/Boe)
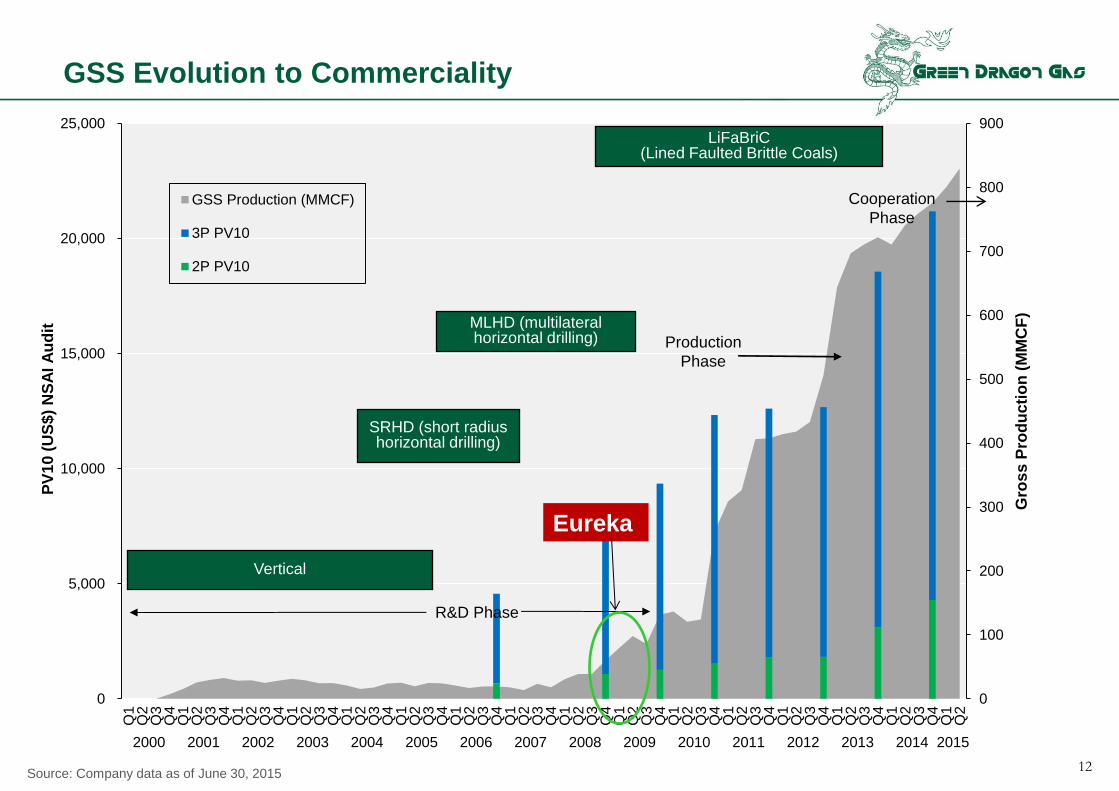
GSS Evolution to Commerciality
Source: Company data as of June 30, 2015 12
0
100
200
300
400
500
600
700
800
900
0
5,000
10,000
15,000
20,000
25,000Q
1Q
2Q
3Q
4Q
1Q
2Q
3Q
4Q
1Q
2Q
3Q
4Q
1Q
2Q
3Q
4Q
1Q
2Q
3Q
4Q
1Q
2Q
3Q
4Q
1Q
2Q
3Q
4Q
1Q
2Q
3Q
4Q
1Q
2Q
3Q
4Q
1Q
2Q
3Q
4Q
1Q
2Q
3Q
4Q
1Q
2Q
3Q
4Q
1Q
2Q
3Q
4Q
1Q
2Q
3Q
4Q
1Q
2Q
3Q
4Q
1Q
2
2000 2001 2002 2003 2004 2005 2006 2007 2008 2009 2010 2011 2012 2013 2014 2015
Gro
ss
Pro
du
cti
on
(M
MC
F)
PV
10
(U
S$
) N
SA
I A
ud
it
GSS Production (MMCF)
3P PV10
2P PV10
Production
Phase
Vertical
Eureka
R&D Phase
LiFaBriC (Lined Faulted Brittle Coals)
SRHD (short radius horizontal drilling)
MLHD (multilateral horizontal drilling)
Cooperation
Phase
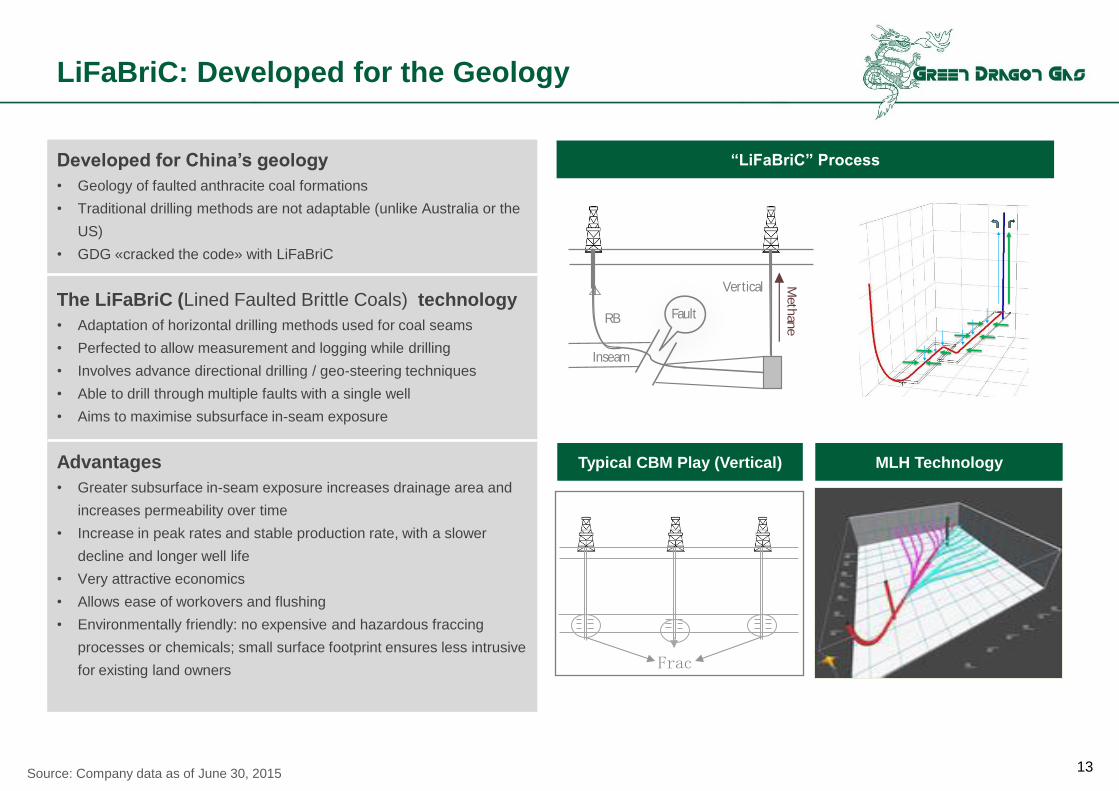
LiFaBriC: Developed for the Geology
Developed for China’s geology
• Geology of faulted anthracite coal formations
• Traditional drilling methods are not adaptable (unlike Australia or the
US)
• GDG «cracked the code» with LiFaBriC
The LiFaBriC (Lined Faulted Brittle Coals) technology
• Adaptation of horizontal drilling methods used for coal seams
• Perfected to allow measurement and logging while drilling
• Involves advance directional drilling / geo-steering techniques
• Able to drill through multiple faults with a single well
• Aims to maximise subsurface in-seam exposure
Advantages
• Greater subsurface in-seam exposure increases drainage area and
increases permeability over time
• Increase in peak rates and stable production rate, with a slower
decline and longer well life
• Very attractive economics
• Allows ease of workovers and flushing
• Environmentally friendly: no expensive and hazardous fraccing
processes or chemicals; small surface footprint ensures less intrusive
for existing land owners
Meth
ane
Inseam
RB
Vertical
Fault
SIS Technology “LiFaBriC” Process
13 Source: Company data as of June 30, 2015
Typical CBM Play
Frac
Typical CBM Play (Vertical) MLH Technology
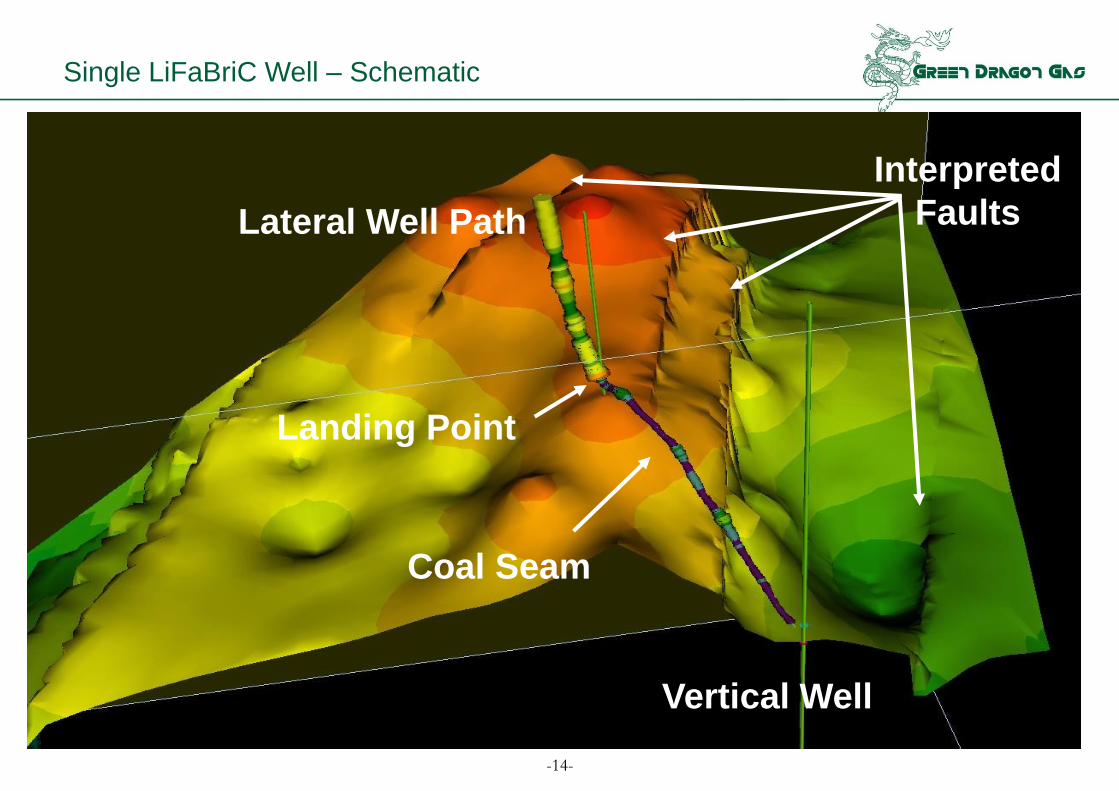
Vertical Well
Lateral Well Path
Landing Point
Coal Seam
Interpreted
Faults
Single LiFaBriC Well – Schematic
-14-
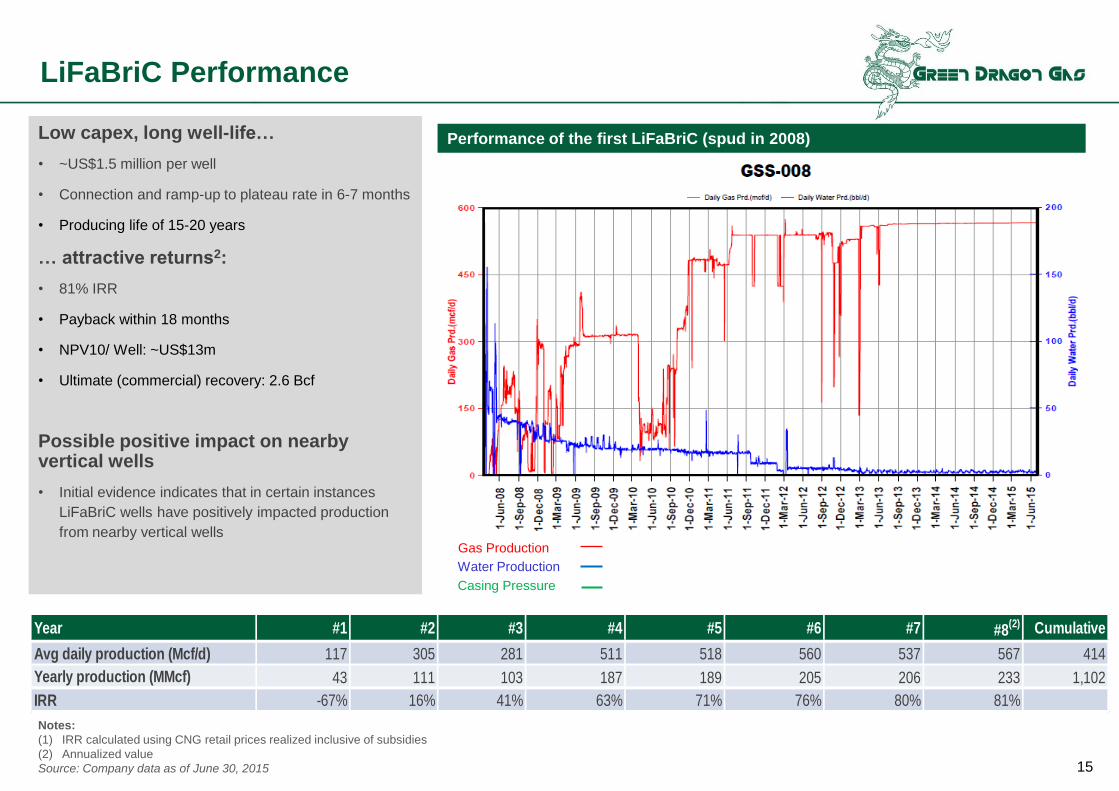
LiFaBriC Performance
Notes:
(1) IRR calculated using CNG retail prices realized inclusive of subsidies
(2) Annualized value
Source: Company data as of June 30, 2015
Low capex, long well-life…
• ~US$1.5 million per well
• Connection and ramp-up to plateau rate in 6-7 months
• Producing life of 15-20 years
… attractive returns2:
• 81% IRR
• Payback within 18 months
• NPV10/ Well: ~US$13m
• Ultimate (commercial) recovery: 2.6 Bcf
Possible positive impact on nearby vertical wells
• Initial evidence indicates that in certain instances
LiFaBriC wells have positively impacted production
from nearby vertical wells
Gas Production
Water Production
Casing Pressure
Performance of the first LiFaBriC (spud in 2008)
15
Year #1 #2 #3 #4 #5 #6 #7 #8(2) Cumulative
Avg daily production (Mcf/d) 117 305 281 511 518 560 537 567 414
Yearly production (MMcf) 43 111 103 187 189 205 206 233 1,102
IRR -67% 16% 41% 63% 71% 76% 80% 81%
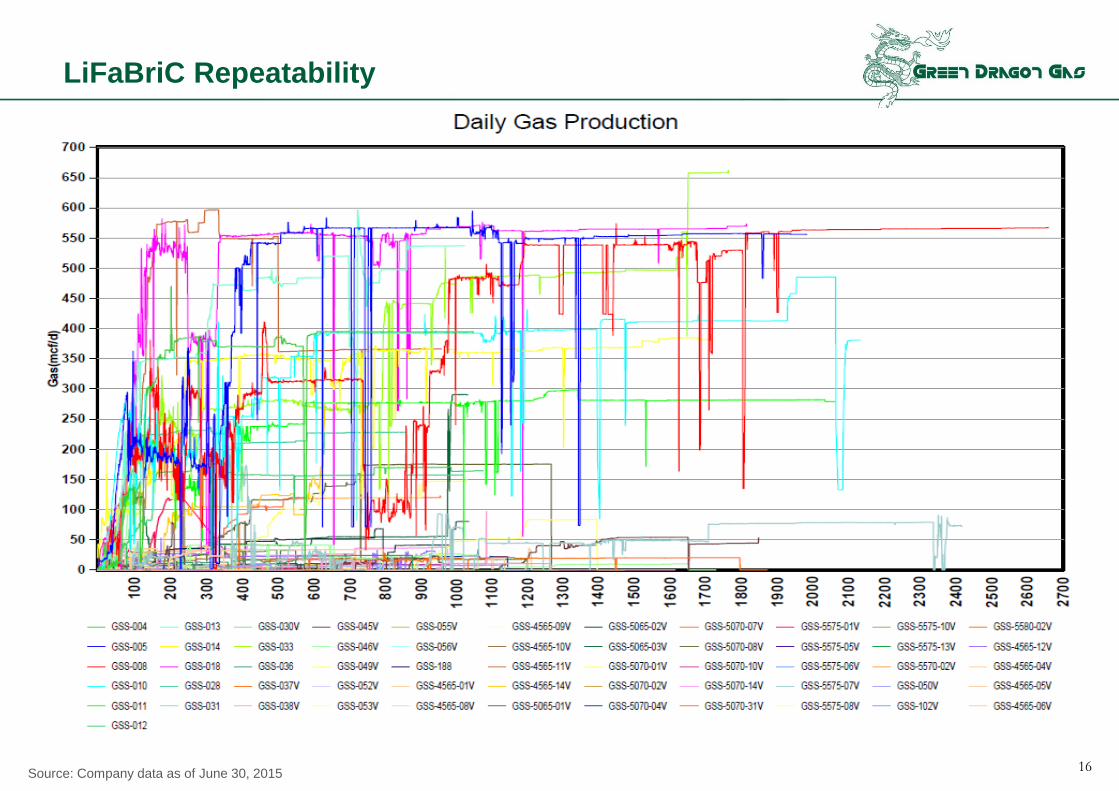
LiFaBriC Repeatability
Source: Company data as of June 30, 2015
Daily Gas Production
16
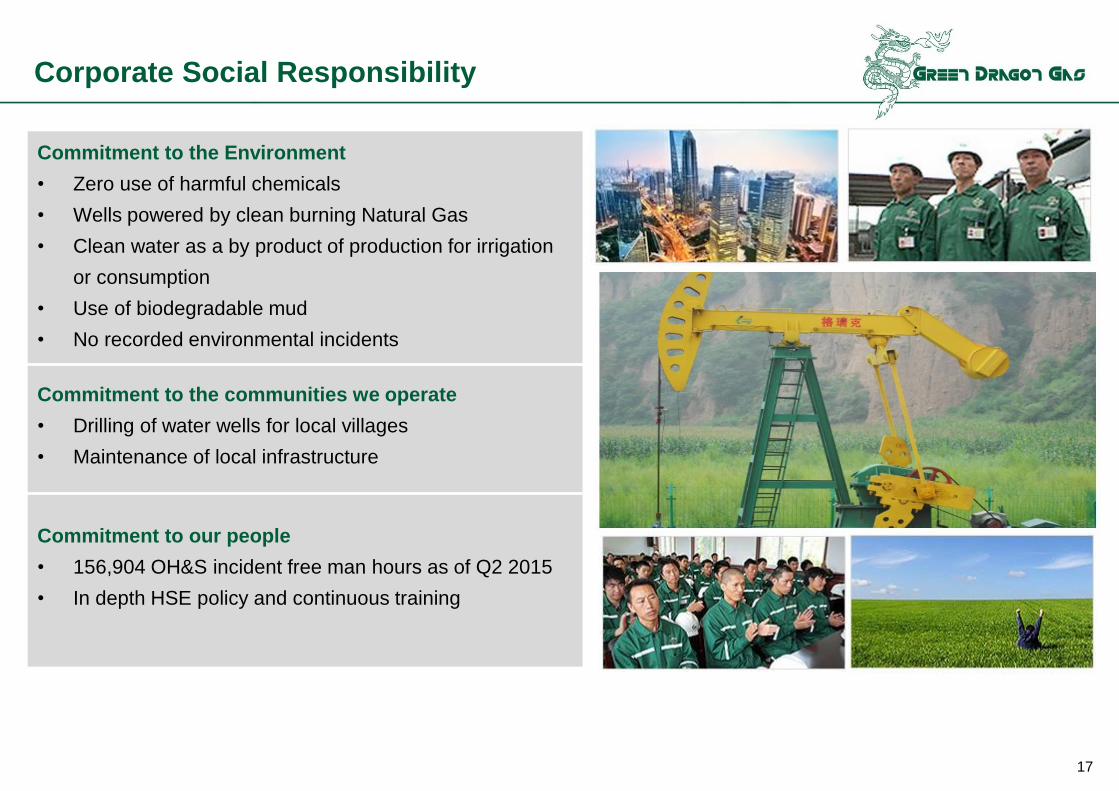
Corporate Social Responsibility
Commitment to the Environment
• Zero use of harmful chemicals
• Wells powered by clean burning Natural Gas
• Clean water as a by product of production for irrigation
or consumption
• Use of biodegradable mud
• No recorded environmental incidents
Commitment to the communities we operate
• Drilling of water wells for local villages
• Maintenance of local infrastructure
Commitment to our people
• 156,904 OH&S incident free man hours as of Q2 2015
• In depth HSE policy and continuous training
17

Energy consumption per person
(million people) Growth rate (%) (energy consumption per person – toe) (gas consumption per person - toe)
Supportive Chinese market dynamics
• Largest population in the world
• One of the highest GDP growth rates (2014: 7.3%; projected 7% p.a. to 2020)
• Currently very low energy consumption per capita – projected to increase with a rising middle class
• Extremely low proportion of gas in the energy mix – expected to grow to 10% by 2020E with strong support from the government
Population 2014A GDP growth rate
China - Solid Fundamentals for Gas Demand Growth
Source: BP Statistical Review, June 2015; IMF World Economic Outlook Database, April 2015
Gas consumption per person
64
127
143
198
316
1243
1361
0 500 1000 1500
U.K
Japan
Russia
Brazil
U.S.A
India
China
18
0.5
1.5
2.2
2.9
3.6
4.7
7.2
- 2.0 4.0 6.0 8.0
India
Brazil
China
U.K
Japan
Russia
USA
0.04
0.11
0.17
0.80
1.02
2.12
2.59
- 1.00 2.00 3.00
India
China
Brazil
Japan
U.K
U.S.A
Russia
0%
1%
2%
3%
3%
7%
7%
0% 2% 4% 6% 8%
Brazil
Russia
U.S.A
Japan
U.K
India
China
N atural Gas4%
Crude Oil19%
Coal68%
Hydro9%
N atural Gas10%
Crude Oil13%
Coal62%
Hydro & Nuclear
9%
Wind, Solar,
Biomas6%
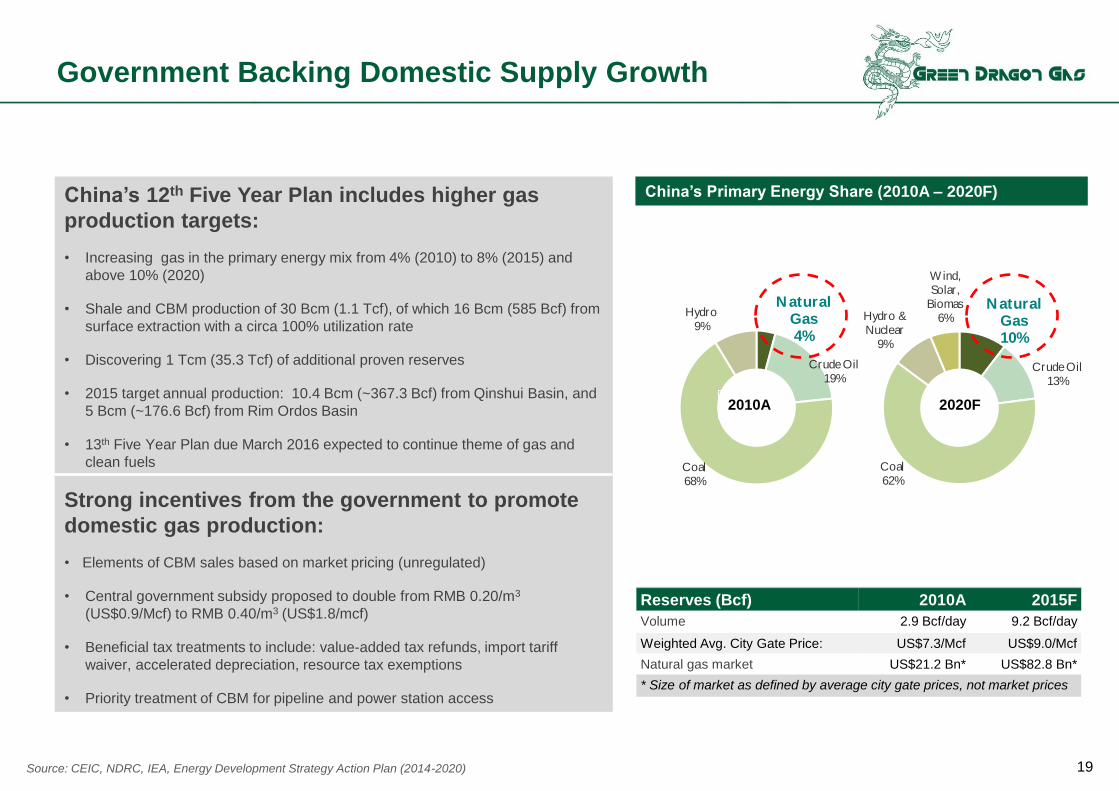
Government Backing Domestic Supply Growth
China’s 12th Five Year Plan includes higher gas
production targets:
• Increasing gas in the primary energy mix from 4% (2010) to 8% (2015) and
above 10% (2020)
• Shale and CBM production of 30 Bcm (1.1 Tcf), of which 16 Bcm (585 Bcf) from
surface extraction with a circa 100% utilization rate
• Discovering 1 Tcm (35.3 Tcf) of additional proven reserves
• 2015 target annual production: 10.4 Bcm (~367.3 Bcf) from Qinshui Basin, and
5 Bcm (~176.6 Bcf) from Rim Ordos Basin
• 13th Five Year Plan due March 2016 expected to continue theme of gas and
clean fuels
Strong incentives from the government to promote
domestic gas production:
• Elements of CBM sales based on market pricing (unregulated)
• Central government subsidy proposed to double from RMB 0.20/m3
(US$0.9/Mcf) to RMB 0.40/m3 (US$1.8/mcf)
• Beneficial tax treatments to include: value-added tax refunds, import tariff
waiver, accelerated depreciation, resource tax exemptions
• Priority treatment of CBM for pipeline and power station access
China’s Primary Energy Share (2010A – 2020F)
2010A 2020F
Source: CEIC, NDRC, IEA, Energy Development Strategy Action Plan (2014-2020)
Reserves (Bcf) 2010A 2015F
Volume 2.9 Bcf/day 9.2 Bcf/day
Weighted Avg. City Gate Price: US$7.3/Mcf US$9.0/Mcf
Natural gas market US$21.2 Bn* US$82.8 Bn*
* Size of market as defined by average city gate prices, not market prices
19
-
50
100
150
200
250
300
350
Demand Pipeline import Production
0
50
100
150
200
250
300
350
20
08A
20
09A
20
10A
20
11A
20
12A
20
13A
20
14A
20
15E
20
16E
20
17E
20
18E
20
19E
20
20E
Billio
n c
ub
ic M
ete
rs
Residential Industry Power Generation Transportation (NGV, EV) Others
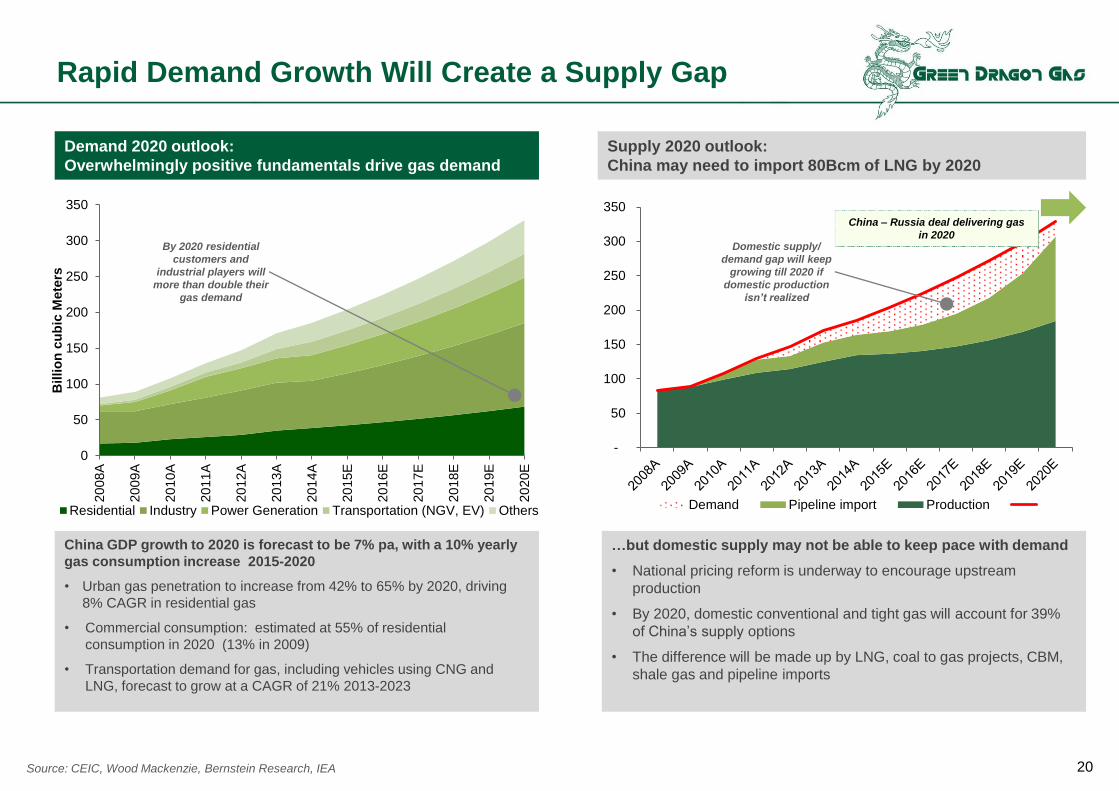
Rapid Demand Growth Will Create a Supply Gap
Demand 2020 outlook:
Overwhelmingly positive fundamentals drive gas demand
Supply 2020 outlook:
China may need to import 80Bcm of LNG by 2020
China GDP growth to 2020 is forecast to be 7% pa, with a 10% yearly
gas consumption increase 2015-2020
• Urban gas penetration to increase from 42% to 65% by 2020, driving
8% CAGR in residential gas
• Commercial consumption: estimated at 55% of residential
consumption in 2020 (13% in 2009)
• Transportation demand for gas, including vehicles using CNG and
LNG, forecast to grow at a CAGR of 21% 2013-2023
…but domestic supply may not be able to keep pace with demand
• National pricing reform is underway to encourage upstream
production
• By 2020, domestic conventional and tight gas will account for 39%
of China’s supply options
• The difference will be made up by LNG, coal to gas projects, CBM,
shale gas and pipeline imports
Domestic supply/
demand gap will keep
growing till 2020 if
domestic production
isn’t realized
China – Russia deal delivering gas
in 2020 By 2020 residential
customers and
industrial players will
more than double their
gas demand
Source: CEIC, Wood Mackenzie, Bernstein Research, IEA 20
-21-
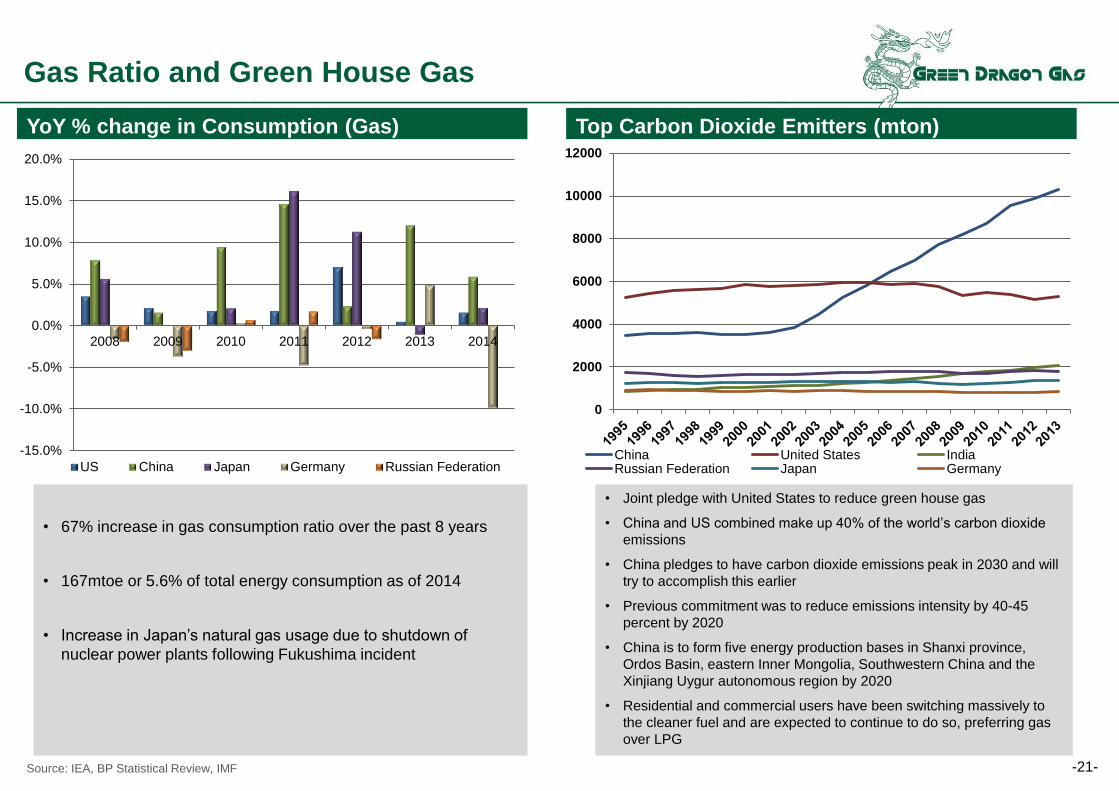
Top Carbon Dioxide Emitters (mton)
0
2000
4000
6000
8000
10000
12000
China United States IndiaRussian Federation Japan Germany
• Joint pledge with United States to reduce green house gas
• China and US combined make up 40% of the world’s carbon dioxide
emissions
• China pledges to have carbon dioxide emissions peak in 2030 and will
try to accomplish this earlier
• Previous commitment was to reduce emissions intensity by 40-45
percent by 2020
• China is to form five energy production bases in Shanxi province,
Ordos Basin, eastern Inner Mongolia, Southwestern China and the
Xinjiang Uygur autonomous region by 2020
• Residential and commercial users have been switching massively to
the cleaner fuel and are expected to continue to do so, preferring gas
over LPG
Source: IEA, BP Statistical Review, IMF
Gas Ratio and Green House Gas
YoY % change in Consumption (Gas)
• 67% increase in gas consumption ratio over the past 8 years
• 167mtoe or 5.6% of total energy consumption as of 2014
• Increase in Japan’s natural gas usage due to shutdown of
nuclear power plants following Fukushima incident
-15.0%
-10.0%
-5.0%
0.0%
5.0%
10.0%
15.0%
20.0%
2008 2009 2010 2011 2012 2013 2014
US China Japan Germany Russian Federation

22
What’s Next?
• Monetize the 18 year track record, inclusive of the decade long technology development
• Government policy and pricing has been stable and consistent for the last 18 years and is expected to be
going forward
• The Government provided subsidy is a recognition of the challenges faced in CBM development
• The Government has clearly defined goals for the domestic gas consumption
• Resources must be imported if domestic production lags behind objectives
• While CBM can’t provide all the needed domestic gas demand, it certainly is a vital domestic component of
the solution alongside conventional gas

Energy Independence
Innovate
Transparent
Support
Entrepreneurial
Cooperate
Invest
23
Chinese Independents

Source: Company presentation 24
Global CBM Resources