China’s Green Cities - World...
28
1 China’s Green Cities Matthew E. Kahn UCLA and NBER Institute of the Environment Departments of Economics and Public Policy Mek1966.googlepages.com
Transcript of China’s Green Cities - World...

1
China’s Green Cities
Matthew E. Kahn
UCLA and NBER
Institute of the Environment
Departments of Economics and Public Policy
Mek1966.googlepages.com

Introduction
• Much of my work focuses on;
• 1. Factors determining urban pollution levels
• 2. Measuring how much urbanites value living
in “green cities”
• My empirical work started in the U.S and now
has branched out into China.

The “Supply” of Urban Pollution
• Pollution as an emergent byproduct of three
factors within a city;
• 1. scale, 2. composition, 3. technique
• Two Examples:
• Total Urban Vehicle Emissions =
• Population*pr(own a car)*Miles*Emissions
per Mile
• Total Industrial Emissions = ∑ Emissions Per
$ of output*output produce
What is a “Green City”?
• 1. Local environmental criteria such as air
quality and water quality
• 2. Global criteria such as greenhouse gas
emissions
• Index Weights Issues similar to HDI issues
• 3. A weakness of my 2006 Brookings book is
that it is “too U.S” focused.

Consumer City as the New
“Golden Goose”
• Cities are capitalism’s growth engine
• Human capital is the key to sustainable
economic growth
• Where do the footloose urban skilled want to
live and work? Glaeser’s work on “Consumer
City”
• Environment an important part of “quality of
life” (QOL)
• The skilled will vote with their feet and
migrate away if urban QOL is low

Transition to China’s Cities
• Some Themes in my U.S based empirical work
are relevant for thinking about China’s future:
• 1. educational attainment correlates with
support for environmental regulation (Kahn
2002)
• 2. Deindustrialization Green Cities (Kahn
1999, 2003)
• 3. Old capital is dirty capital (Kahn 1995,
Kahn and Schwartz 2008, Kahn and Davis
2010)

More Themes
• 4. demand for non-market local public goods
rises with income (Costa and Kahn 2003,
2004)
• 5. Public transit is not used when people live
and work in the suburbs (Glaeser and Kahn
2004)

My Past China Research Projects
• 1. Land and Residential Property Markets in a
Booming Economy: New Evidence from
Beijing (joint with Siqi Zheng) Journal of
Urban Economics, 63(2), 2008, Pages 743-
757
• 2. Towards a System of Open Cities in China:
Home Prices, FDI Flows and Air Quality in 35
Major Cities (joint with Siqi Zheng and
Hongyu Liu) Regional Science and Urban
Economics, 2010
Ranking Carbon Footprints
• 3. THE GREENNESS OF CHINA: HOUSEHOLD
CARBON DIOXIDE EMISSIONS AND
URBAN DEVELOPMENT (SIQI ZHENG, RUI
WANG, ED GLAESER AND KAHN, 2010
JOURNAL OF ECONOMIC GEOGRAPHY)
Project #1 Zheng and Kahn 2008
• We use unique GIS geocoded real estate
transaction data and land auction data to
examine:
• 1. urban monocentric features of Beijing
• 2. capitalization of local public goods
including; pollution, crime, universities,
access to public transit

Beijing’s Environmental Amenities

Within BeijingTable Five. Hedonic Capitalization Estimates of Local Public Goods
Dependent variable: Log(P_PRICE)
(1) (2) (3) (4) (5) (6)
Constant 8.491***
(110.15)
8.805***
(127.39)
9.843***
(19.95)
10.046***
(30.13)
10.252***
(43.60)
8.945***
(19.12)
D_CENTER
(in kilometers)
-0.019***
(-7.67)
-0.011***
(-4.81)
-0.008***
(-4.01)
-0.007***
(-3.55)
-0.007***
(-3.82)
-0.007***
(-3.98)
UNIT_SIZE
(in square meters)
0.003***
(4.46)
0.003***
(4.78)
0.002***
(3.74)
0.002***
(2.67)
0.002**
(2.65)
0.002**
(2.52)
UNIT_SIZE2 -2.09E-6***
(-1.03)
-1.24E-6***
(-0.72)
2.53E-7
(0.10)
4.40E-7***
(0.18)
1.60E-7
(0.06)
8.93E-7
(0.38)
PRO_SIZE
(in 000 units)
-0.164***
(-4.32)
-0.132***
(-4.07)
-0.131***
(-3.36)
-0.110***
(-3.64)
-0.115***
(-3.56)
-0.100***
(-3.63)
PRO_SIZE2 0.025**
(2.15)
0.022**
(2.27)
0.022***
(4.40)
0.018***
(4.16)
0.020***
(4.76)
0.017***
(3.75)
SOE -0.091**
(-3.64)
-0.077**
(-3.64)
-0.100***
(-3.46)
-0.098***
(-3.21)
-0.100**
(-2.87)
-0.087**
(-2.88)
Log(D_SUBA)
(in kilometers)
-0.161***
(-14.25)
-0.113**
(-3.25)
-0.089**
(-2.70)
-0.082**
(-2.54)
-0.108***
(-3.80)
Log(D_SUBB)
(in kilometers)
-0.038***
(-3.43)
-0.014
(-0.90)
-0.014
(-0.67)
0.021
(0.84)
0.023
(1.11)
Log(D_BUS)
(in kilometers)
-0.079***
(-5.21)
-0.074**
(-2.43)
-0.074*
(-2.13)
-0.051*
(-1.94)
-0.035
(-1.01)
Log(D_PARK)
(in kilometers)
-0.104***
(-3.46)
-0.086**
(-2.51)
-0.041
(-1.57)
-0.057*
(-2.06)
AIRBAD
(ug/m3)
-0.0041**
(-2.44)
-0.0049***
(-4.40)
-0.006***
(-6.93)
-0.005***
(-5.85)
Log(D_SCHOOL)
(in kilometers)
-0.065**
(-2.56)
-0.066**
(-2.87)
-0.054**
(-2.45)
CRIME -0.024
(-0.64)
-0.055
(-1.19)
-0.051
(-1.55)
Log (D_UNIV) -0.104***
(-3.68)
UNIV_3KM 0.106***
(3.60)
UNIV_SCORE 0.002***
(3.28)
Quarter dummies yes yes Yes yes yes yes
R2 0.356 0.533 0.569 0.578 0.597 0.601
N. of Obs. 900 900 900 900 900 900
Open Research Questions
• 1. pollution exposure across income groups
• 2. Does the monitoring system (with roughly
20 monitors) truly capture the exposure?
• 3. As Beijing’s vehicle fleet grows, which
indicators of pollution such as carbon
monoxide grow worse?
• 4. Evidence from infant mortality statistics of
increased deaths? Or economic growth
offsets?

Across Chinese City Comparisons
• Zheng, Kahn and Liu (2010)
• Using excellent real estate price data, we
explain cross-sectional variation in real estate
prices across 35 major Chinese Cities at
multiple points in time
• Test for the presence of a EKC curve and the
“turning point”
• Test for the role of city specific FDI on air
pollution

Understanding Cross-City Ambient
Pollution Differentials in China
Trend regressions Log(PM) Log(SO2)
Log(PM) Log(SO2)
(1) (2) (3) (4) (5) (6)
Log (POP) 0.148 0.258 0.18 0.199 0.406 0.423
[1.54] [1.75]* [3.89]*** [2.29]** [3.00]*** [2.98]***
INC 0.125 0.372 0.399 0.607
[1.41] [3.21]*** [2.16]** [2.25]**
INC2 -0.004 -0.012 -0.013 -0.019
[-1.48] [-3.01]*** [-2.09]** [-2.22]**
Manuf 0.945 1.779 -0.061 0.64
[1.37] [2.82]*** [-0.04] [0.49]
Log(CFDIPC) -0.113 -0.414 -0.394 -0.647
[-1.77]* [-4.00]*** [-3.39]*** [-2.14]**
Log(RAIN) -0.227 -0.041 -0.072 0.084
[-3.98]*** [-0.37] [-0.54] [0.32]
YEAR2004 -0.052 0.008
[-2.54]** [0.18]
YEAR2005 -0.122 0.032
[-6.49]*** [0.49]
YEAR2006 -0.099 0.006
[-4.02]*** [0.08]
Constant -2.966 -4.444 -1.95 -3.143 -4.697 -5.702
[-5.34]*** [-5.12] [-4.00]*** [-4.05]*** [-3.86]*** [-3.14]***
Observations 120 120 120 120 120 120
R-squared 0.13 0.09 0.596 0.162 0.424 0.344
Year Fixed
Effects Yes Yes Yes Yes Yes Yes
Estimation OLS OLS OLS IV OLS IV

Foreign Direct Investment as
“Friend or Foe” of Green Cities?
• The “old” pollution havens logic would posit
that FDI is a foe as rich countries outsource
dirty industries to the LDC.
• More optimistic hypothesis is that FDI causes
cleaner technology to be adopted and is
correlated with technology transfer.

Key Empirical Findings from this
Research
• Evidence of Compensating differentials (for
ambient pollution, and proximity to rail transit
stations) apparent in cross-section and this
premium appears to be growing over time
• Cities that receive more FDI inflows enjoy
improved air quality --- contradicts the
pollution haven claims
• Evidence that several of China’s cities have
passed the “Turning Point” for the
Environmental Kuznets Curve
Politicians and Green Cities
• In 2011, do China’s urban politicians have the
right incentives to pursue “green cities”?
• Politicians and competition to maximize land
tax revenue provides strong incentives to
provide valued public goods?

Ranking Cities with Respect to
their Household Carbon Footprint
• Where would Al Gore want a standardized
household to live?
• To minimize carbon emissions, compact city
with cool summers and temperature winters
and clean electric utilities

Methodological Details
• Equation (1)
• Carbon Dioxide Emissions =
γ1*Transportation + γ2 *Electricity +
γ3*Heating
• Emissions factor γ2 varies by a city’s region

Methodological Details II
• Using household level geocoded data
• For household consumption of 1.
transportation, 2. electricity, 3. heating we
estimate OLS regressions of the form:
• Take the OLS estimates and predict energy
consumption for each city for a “standardized
household”, plug these estimates into equation
(1)
ijijijjij UcsDemographibIncomebcEnergy ** 21
Details
• Zheng, Wang, Glaeser, and Kahn use the 2006
Chinese Urban Household Survey Micro data
• Detailed information on household
consumption of electricity, transportation,
home heating
• We estimate separate regressions by city, by
energy category to predict consumption for a
standardized household
• We plug in the predictions to an aggregation
formula to rank cities

Example of Transport in Beijing
• estimate a logit model:
• Ln (Prob(Owning a car)/(1- Prob(Owning a
car))) = -15.57 + 1.43*Log(Income) +
0.005*Household Size - 0.025*Age
• Estimate a gasoline consumption model:
log(Car Fuel Use)= -10.41+1.46*Log(Income)
+ 0.12*Household Size - 0.02*Age
• Car fuel consumption = .179 *86.67 = 15.5
Liters
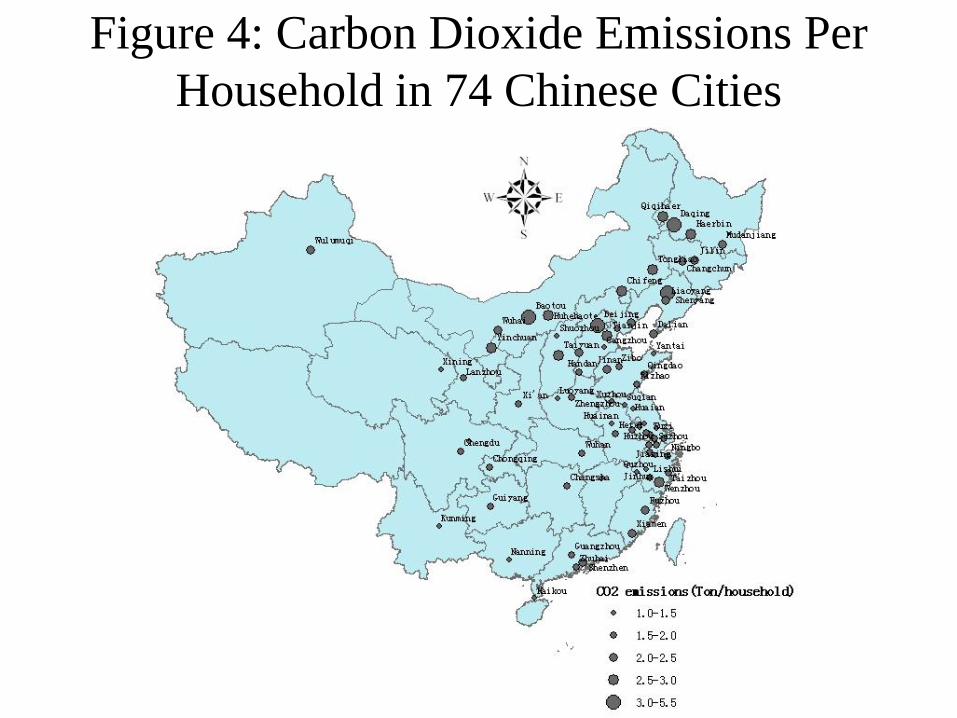
Figure 4: Carbon Dioxide Emissions Per
Household in 74 Chinese Cities

Implications
• These rankings are useful for understanding
the unintended environmental consequences of
government policies that favor growth of
specific cities and regions
• Environmental costs of cold Northern China’s
growth
• Caveat: Emissions factors are not a law of
physics; the case of the natural gas pipeline

A Preview of a New Beijing
Project
• Over the last 8 years in Beijing, there have
been several improvements in local public
goods;
• 1. New subway lines
• 2. Construction of the Olympic Village for the
2008 games
• For each of these spatial “treatments”, we are
investigating how SOE developers and private
sector real estate developers respond

Conclusion
• I am optimistic about China’s cities’pollution
progress
• “Battle” between Scale, Composition and
Technique
• Coal fired power plants and “co-benefits”
• Manufacturing in China
• The induced innovation hypothesis
• “Green City” benefits of energy intensity
reductions