China’s Electric Power Industry and Its Trendseneken.ieej.or.jp/en/data/pdf/326.pdf · IEEJ:April...
33
IEEJ:April 2006 China’s Electric Power Industry and Its Trends Chun Chun Ni Electric Power, Nuclear Power & Coal Group Industrial Research Unit The Institute of Energy Economics, Japan
-
Upload
duongthuan -
Category
Documents
-
view
218 -
download
0
Transcript of China’s Electric Power Industry and Its Trendseneken.ieej.or.jp/en/data/pdf/326.pdf · IEEJ:April...
IEEJ:April 2006
China’s Electric Power Industry and Its Trends
Chun Chun NiElectric Power, Nuclear Power & Coal Group
Industrial Research UnitThe Institute of Energy Economics, Japan
2
IEEJ:April 2006
Contents1. Structure of China’s electric power industry2. Power supply/demand and future outlook3. Future power development plans4. Regulation reform trends 5. Retail electricity rate trends6. Issues and points to be checked
3
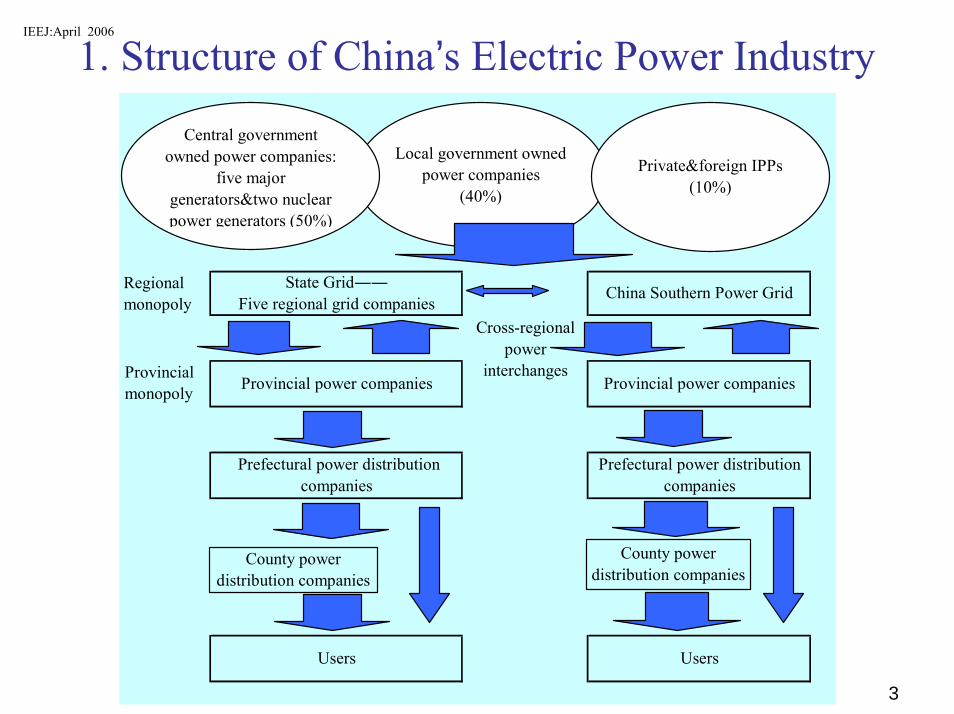
1. Structure of China’s Electric Power IndustryIEEJ:April 2006
State Grid――Five regional grid companies
Provincial power companies
China Southern Power Grid
Provincial power companies
Cross-regionalpower
interchanges
Users
Prefectural power distributioncompanies
Prefectural power distributioncompanies
Users
Local government ownedpower companies
(40%)
Private&foreign IPPs(10%)
Central governmentowned power companies:
five majorgenerators&two nuclearpower generators (50%)
County powerdistribution companies
Regionalmonopoly
Provincialmonopoly
County powerdistribution companies
4
IEEJ:April 2006
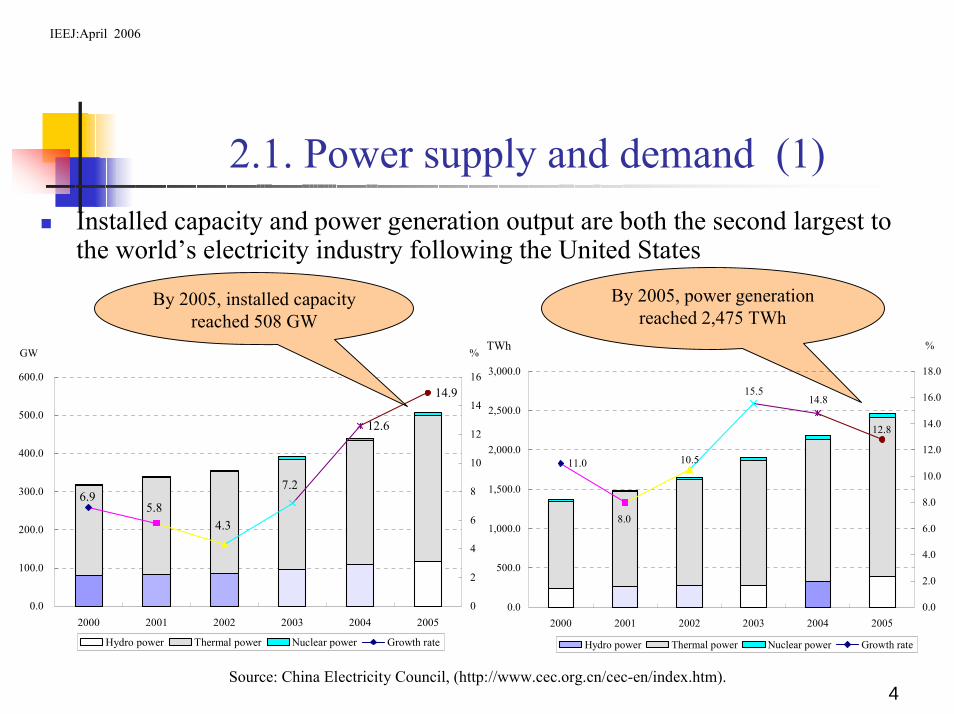
2.1. Power supply and demand (1)Installed capacity and power generation output are both the second largest to the world’s electricity industry following the United States
12.6
14.9
7.2
4.35.8
6.9
0.0
100.0
200.0
300.0
400.0
500.0
600.0
2000 2001 2002 2003 2004 2005
%GW
0
2
4
6
8
10
12
14
16
Hydro power Thermal power Nuclear power Growth rate
By 2005, power generation reached 2,475 TWh
By 2005, installed capacity reached 508 GW
11.0
12.8
14.815.5
10.5
8.0
0.0
500.0
1,000.0
1,500.0
2,000.0
2,500.0
3,000.0
2000 2001 2002 2003 2004 2005
%TWh
0.0
2.0
4.0
6.0
8.0
10.0
12.0
14.0
16.0
18.0
Hydro power Thermal power Nuclear power Growth rate
Source: China Electricity Council, (http://www.cec.org.cn/cec-en/index.htm).

5
IEEJ:April 2006
2.1. Power supply and demand (2)
1,288
13,120
8,612
2,578
0
2,000
4,000
6,000
8,000
10,000
12,000
14,000
kWh/year/person
China U.S. Japan World Total
China U.S. Japan World Total
Installed capacity (GW) 356.6 979.6 266.1 3,372.8(% of world total) (9.6%) (26.4%) (7.2%) (100%)Power generation (TWh) 1,654.2 3,858.5 1,097.2 15,614.1(% of world total) (10.6%) (24.7%) (7.0%) (100%)Power generation per capita(kWh/person) 1,288 13,120 8,612 2,578
Power generation per capita is one-tenth that of the United states, one-seventh of Japan and less than half of the world’s average amount (2002 figures)
Source: Japan Electric Power Information Center (2005), Overseas Electric Power Industry Statistics.
6
IEEJ:April 2006
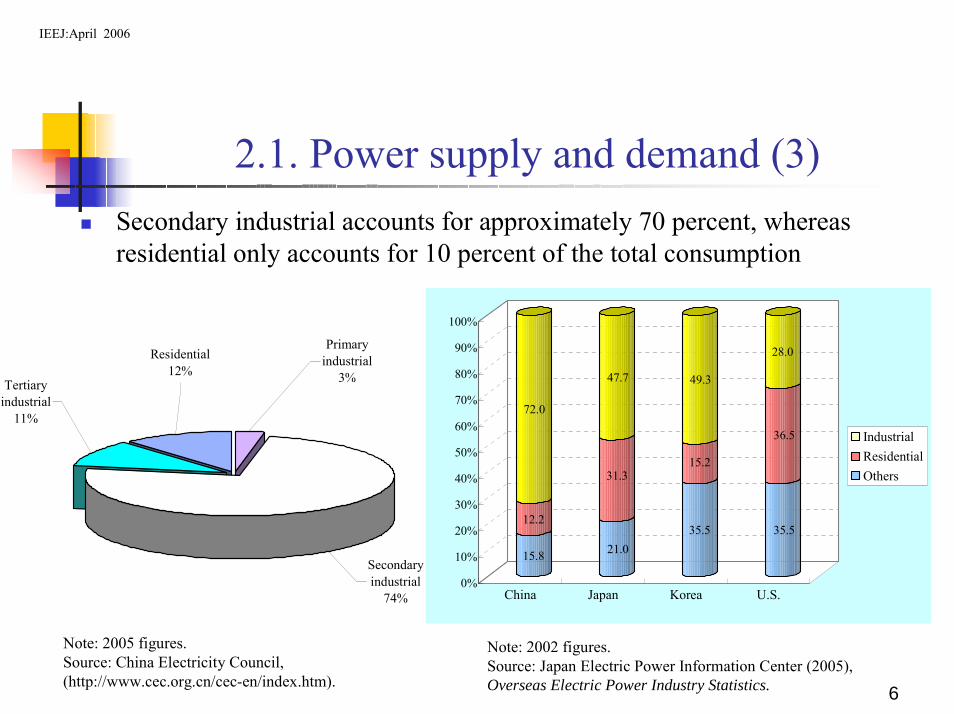
2.1. Power supply and demand (3)Secondary industrial accounts for approximately 70 percent, whereas residential only accounts for 10 percent of the total consumption
15.8
12.2
72.0
21.0
31.3
47.7
35.5
15.2
49.3
35.5
36.5
28.0
0%
10%
20%
30%
40%
50%
60%
70%
80%
90%
100%
China Japan Korea U.S.
IndustrialResidentialOthers
Secondaryindustrial
74%
Tertiaryindustrial
11%
Residential12%
Primaryindustrial
3%
Note: 2005 figures.Source: China Electricity Council, (http://www.cec.org.cn/cec-en/index.htm).
Note: 2002 figures.Source: Japan Electric Power Information Center (2005), Overseas Electric Power Industry Statistics.

7
IEEJ:April 2006
2.1. Power supply and demand (4)
In 1997, balance between power demand and supply was first maintainedPower shortages since 1980s
Since 2002, severe power shortages has ocurrednationwide
200212
Provinces(Autonomous&Municipalities)
200322
Provinces(Autonomous&Municipalities)
200424
Provinces(Autonomous&Municipalities)
Economy lossaround 1 trillion Yuan
200526
Provinces(Autonomous&Municipalities)

8
IEEJ:April 2006
(Appendix) Rolling Blackouts in China
Rolling blackouts implemented in China (2002 – Aug. 2005)
Region2002
(12 provinces/municipalities/autonomies)
2003(22 provinces/municipalities
/autonomies)
2004(24 provinces/municipalities
/autonomies)
Jan.-Aug., 2005(26 provinces/municipalities
/autonomies)
North China Hebei, Shanxi, InnerMongolia
Hebei, Shanxi, InnerMongolia
Tianjin, Hebei, Shanxi, InnerMongolia, Shandong
Tianjin, Hebei, Shanxi, InnerMongolia, Shandong, Beijing
Northeast China - - Liaoning
East China Shanghai, Jiangsu, Zhejiang Shanghai, Jiangsu, Zhejiang,Anhui, Fujian
Shanghai, Jiangsu, Zhejiang,Anhui, Fujian
Shanghai, Jiangsu, Zhejiang,Anhui, Fujian
Central China Henan, Hubei, Sichuan,Chongqing
Henan, Hubei, Sichuan,Chongqing, Jiangxi, Hunan
Henan, Hubei, Sichuan,Chongqing, Jiangxi, Hunan
Henan, Hubei, Sichuan,Chongqing, Jiangxi, Hunan
NorthewestChina - Gansu, Qinghai, Ningxia Gansu, Qinghai, Ningxia,
ShanxiGansu, Qinghai, Ningxia,
Shanxi
South China Guangdong, Guizhou Guangdong, Guangxi,Guizhou, Yunnan, Hainan
Guangdong, Guangxi,Guizhou, Yunnan, Hainan
Guangdong, Guangxi,Guizhou, Yunnan, Hainan
Nation widepower shortages 35 GW 25-30 GW
Source: China Electricity Council, (http://www.cec.org.cn/cec-en/index.htm).

9
IEEJ:April 2006
2.2. Causes of power shortages (1)Responsible entityResponsible entity:
Central government: Power generation development plan was downwardly revised in the later of the “Ninth-Five Year Plan (1996-2000)” – “the construction of new thermal power plants is being suspended for the next three years”
Others major factorsOthers major factors:Rapid demand growth (driving by rapid economic growth, soaring demand from large electric power consumers, and the diffusion of household electrical appliances)
6.4%
9.6%
12.8%
9.2%7.5%8.0%
9.8%
6.6%
5.0%
6.0%7.0%
8.0%
9.0%10.0%
11.0%
12.0%13.0%
14.0%
1980-1987 1988-1995 1996-2000 2001-2005Source: State Power Information Network, (http://www.sp.com.cn/).
Growth rate of powerconsumption
Growth rate of installed capacity
Growth rate of power consumption and installed capacity

10
IEEJ:April 2006
2.2. Causes of power shortages (2)
Others major factors (continued):Others major factors (continued):Issues based on coal industry:- imblance between coal supply and demand & transport bottlenecks- escalating coal prices and decreased quality of coal
Climatic influences (droughts and heat weaves):- power shortages in provinces such as Hunan, Fujian and Qinghai where there are many hydro power plants
History of coal price (Unit:Yuan/ton)
Type 2001 2002 2003 2004 2005
Planned price* 144.7(-0.9%)
152.2(5.2%)
155.8(2.4%)
220.2(41.3%)
240-less than 8% from Sept. 2004 base
Market price 141.9(1.9%)
168.8(18.3%)
173.8(3.6%)
302.0(73.8%)
Note: planned price is the price only for generators.Source: Japan Electric Power Information Center.

11
IEEJ:April 2006
2.3. Countermeasures against power shortages
Demand countermeasuresDemand countermeasures:Peak shift: nighttime and weekend factory operations (expand TOU rate differentials and so on)Peak cut: equipment inspections and load interrupts (“rolling shutdowns”, and “three days on, four days off”)
Supply countermeasuresSupply countermeasures:Moving up of power generation development (promotion of nuclear power generation)Power network improvements
12
IEEJ:April 2006
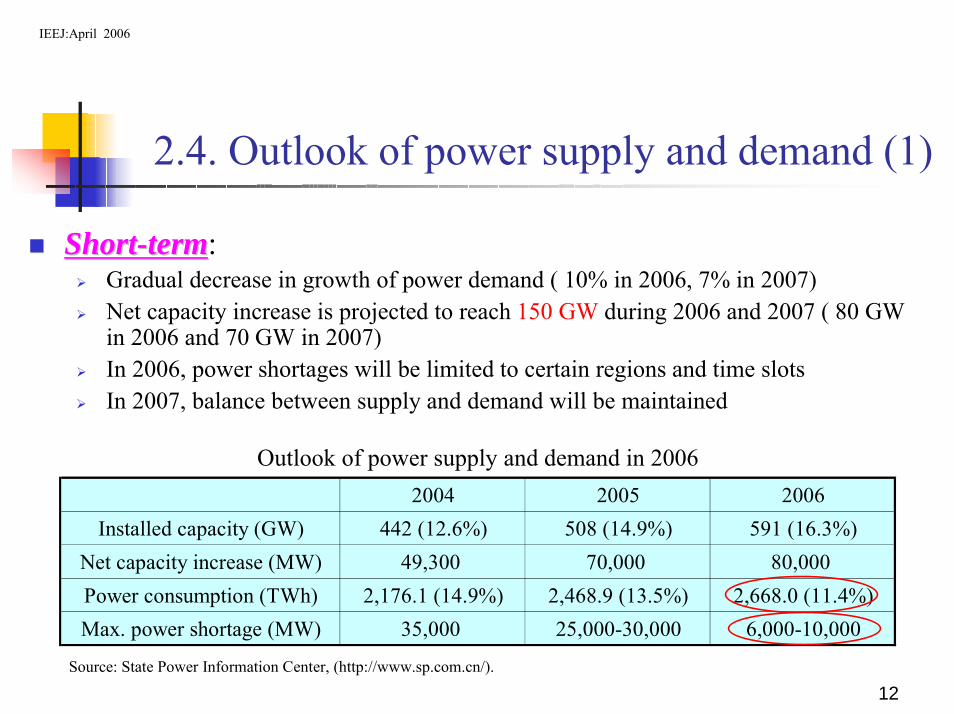
2.4. Outlook of power supply and demand (1)
ShortShort--termterm:Gradual decrease in growth of power demand ( 10% in 2006, 7% in 2007)Net capacity increase is projected to reach 150 GW during 2006 and 2007 ( 80 GW in 2006 and 70 GW in 2007)In 2006, power shortages will be limited to certain regions and time slots In 2007, balance between supply and demand will be maintained
Outlook of power supply and demand in 20062004 2005 2006
Installed capacity (GW) 442 (12.6%) 508 (14.9%) 591 (16.3%)Net capacity increase (MW) 49,300 70,000 80,000Power consumption (TWh) 2,176.1 (14.9%) 2,468.9 (13.5%) 2,668.0 (11.4%)Max. power shortage (MW) 35,000 25,000-30,000 6,000-10,000
Source: State Power Information Center, (http://www.sp.com.cn/).

13
IEEJ:April 2006
2.4. Outlook of power supply and demand (2)
LongLong--termterm:At the end of 2010, installed capacity is projected to reach 560 GW and 950 GWby the end of 2020At the end of 2010, power demand is projected to reach 3,000 TWh, and 4,600 TWh by the end of 2020
2010 2020Total
installed capacity 543-559 (100%) 865-947 (100%)
Coal 338-384 (62-69%) 509-661 (56-69%)Oil 3-4 (1%) 1-6 (1%)
Natural gas 25-28 (5%) 43-46 (5%)Hydro power 132-154 (24-28%) 191-240 (22-25%)
Nuclear power 9-15 (2-3%) 31-40 (3-4%)Renewable sources 3-7 (1%) 11-30 (1-3%)
Outlook of generation component from 2010 to 2020 Unit: GW
Source: Development Research Center of State Council R.R. China(2004), China's Energy Development Strategy and Policy Study, p.197.
Unit 2000 2005 2010 2015 2020Low case TWh 1,350.8 2,222.2 2,917.9 3,558.2 4,324.4
Growth rate % 10.5 5.1 3.2 2.6Reference case TWh 1,350.8 2,278.8 3,044.4 3,798.8 4,630.8
Growth rate % 11.0 6.0 4.5 4.0High case TWh 1,350.8 2,336.6 3,246.9 4,219.9 5,152.4
Growth rate % 11.6 7.3 6.7 6.3
Outlook of power demand from 2010 to 2020
Source: State Power Economic Research Center.
Power generation will continually be based on
coal-fired thermal power!
14
IEEJ:April 2006
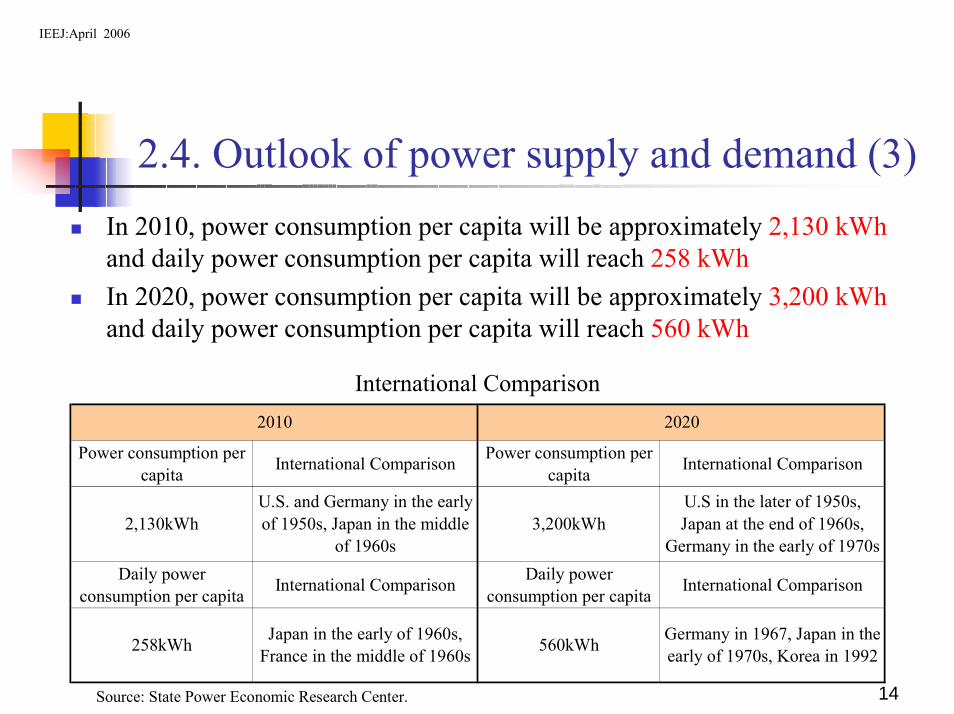
2.4. Outlook of power supply and demand (3)In 2010, power consumption per capita will be approximately 2,130 kWhand daily power consumption per capita will reach 258 kWhIn 2020, power consumption per capita will be approximately 3,200 kWhand daily power consumption per capita will reach 560 kWh
International Comparison
Power consumption percapita International Comparison Power consumption per
capita International Comparison
Daily powerconsumption per capita International Comparison Daily power
consumption per capita International Comparison
2010 2020
U.S. and Germany in the earlyof 1950s, Japan in the middle
of 1960s2,130kWh
U.S in the later of 1950s,Japan at the end of 1960s,
Germany in the early of 1970s
Germany in 1967, Japan in theearly of 1970s, Korea in 1992
Japan in the early of 1960s,France in the middle of 1960s258kWh
3,200kWh
560kWh
Source: State Power Economic Research Center.

15
IEEJ:April 2006
3. Future power development plans (2006-2010)
Generation sectorGeneration sector:Proactively work on the development of hydropower Implement large-scale expansions of coal-fired thermal power, and upgrade technologyProactive development of nuclear power Appropriate introduction of natural gas power generation Introduce renewable energy Intensify energy conservation, and improve the efficiency of energy utilization
Network sectorNetwork sector:Pace of power generation construction and power grid construction (power generation, transmission and distribution investment ratio in 1990s was:1:0.2:0.2)Realize nationwide interconnection based on “West-East Power Transmission”and “South-North Power Transmission”Optimize power resources allocation based on renewal and construction of regional transmission and distribution networks

16
IEEJ:April 2006
(Appendix) West-East Power Transmission Project
West-East Power Transmission:North Route:7,000 MW by 200518 GW by 201040 GW by 2020
Middle Route:7,000 MW by 200521.8 GW by 201040 – 45 GW by 2020
South Route:11 GW by 200515 GW by 201020 – 25 GW by 2020
North routeNorth route
Middle routeMiddle route
South routeSouth route
台湾
17
IEEJ:April 2006
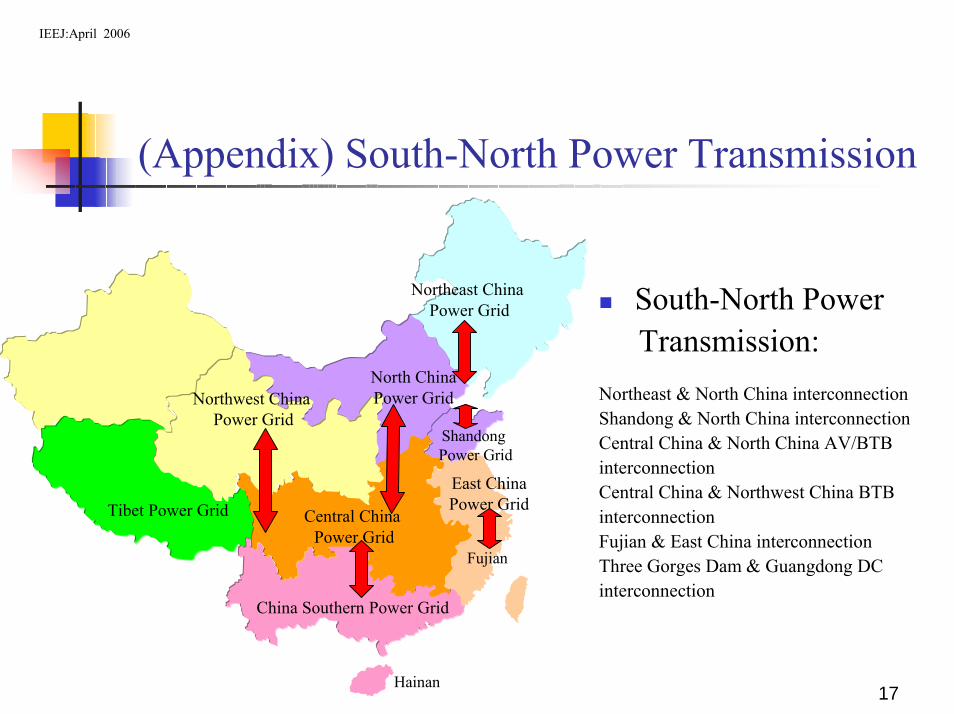
(Appendix) South-North Power Transmission
Northeast China Power Grid
Northwest China Power Grid
Tibet Power Grid
North China Power Grid
East China Power Grid
Central China Power Grid
China Southern Power Grid
South-North Power Transmission:
Northeast & North China interconnectionShandong & North China interconnectionCentral China & North China AV/BTB interconnectionCentral China & Northwest China BTB interconnectionFujian & East China interconnection Three Gorges Dam & Guangdong DC interconnection
Shandong Power Grid
Fujian
Hainan
18
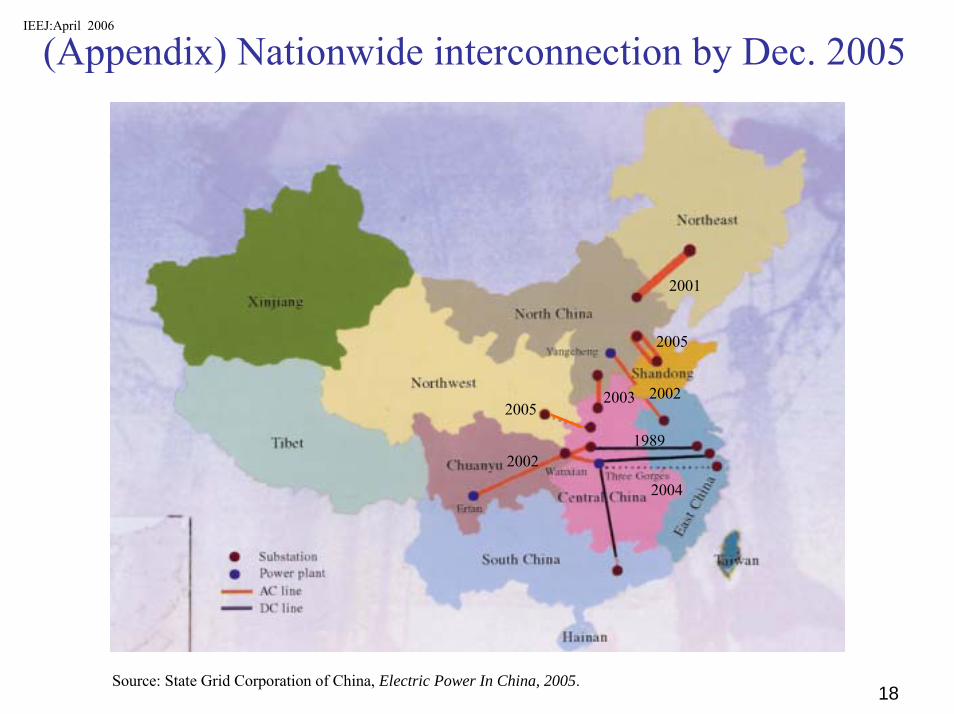
(Appendix) Nationwide interconnection by Dec. 2005IEEJ:April 2006
1989
2001
2002
2003
2004
20052002
2005
Source: State Grid Corporation of China, Electric Power In China, 2005.

19
IEEJ:April 2006
4. Regulation reform trends (1)
Restructuring of the State PowerCorporation of China
December 2002
“introduce competition and break the market monopolyintroduce competition and break the market monopoly”- separation of generation and transmission sectors
Generators:
System operators:
China Southern Power GridCorporation
China Huaneng Group
China Datang Corporation
China Huadian Corporation
China Guodian Corporation
China Power Investment Corporation
State Grid Corporation of China
generationassests
transmissionassets
SPCC

20
IEEJ:April 2006
4. Regulation reform trends (2)
By Dec. 2002Generation sectorGeneration sector:
1. Power Grids(in the purpose of ancillary service and funding for network construction)
2. Five major power generators
Note: Each company’s market share is less than 20% in each region and less than10% in nationwide.
AssetsHydro Thermal Nuclear power Billion Yuan
Huaneng 38.0GW 18% 82% - 126.5Datang 32.5GW 21% 79% - 71.6Huadian 31.3GW 19% 81% - 71.2Guodian 30.8GW 15% 85% - 73.3Chian Power Investment 30.2GW 26% 70% 3.8% 76.9
Power componentsFive major generators Installed
capacity
Northeast ChinaGrid Company
North ChinaGrid Company
East ChinaGrid Company
Central ChinaGrid Company
Northwest ChinaGrid Company
40,500 MW 74,700 MW 76,000 MW 74,300 MW 27,000 MWChina Southern Power Grid Corporation 63,500 MW
State Grid Corporation of China
21
IEEJ:April 2006
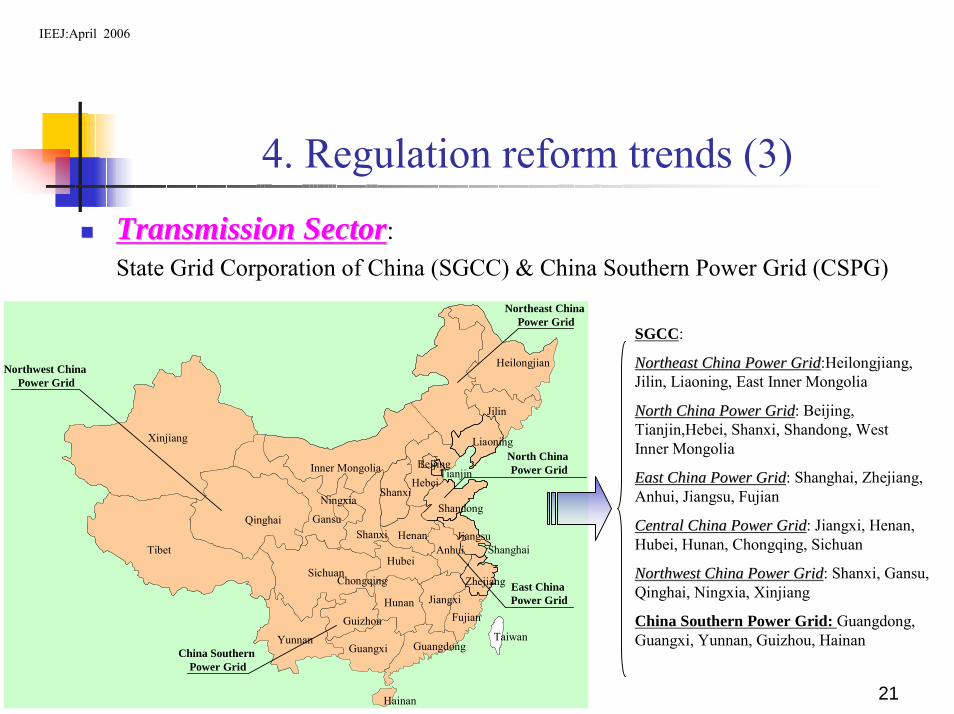
4. Regulation reform trends (3)
Transmission SectorTransmission Sector:State Grid Corporation of China (SGCC) & China Southern Power Grid (CSPG)
Beijing
HebeiTianjin
Heilongjian
Liaoning
Jilin
Shandong
Xinjiang
Jiangsu
Fujian
ShanghaiHenan
Jiangxi
Anhui
Zhejiang
Hubei
Hunan
GuangdongGuangxi
Inner Mongolia
Taiwan
Qinghai
Tibet
Yunnan
Sichuan
Guizhou
Ningxia
ShanxiGansu
Hainan
Chongqing
Northeast China Power Grid
North China Power Grid
East China Power Grid
China Southern Power Grid
Northwest China Power Grid
Shanxi
SGCC:
Northeast China Power GridNortheast China Power Grid:Heilongjiang, Jilin, Liaoning, East Inner Mongolia
North China Power GridNorth China Power Grid: Beijing, Tianjin,Hebei, Shanxi, Shandong, West Inner Mongolia
East China Power GridEast China Power Grid: Shanghai, Zhejiang, Anhui, Jiangsu, Fujian
Central China Power GridCentral China Power Grid: Jiangxi, Henan, Hubei, Hunan, Chongqing, Sichuan
Northwest China Power GridNorthwest China Power Grid: Shanxi, Gansu, Qinghai, Ningxia, Xinjiang
China Southern Power Grid: Guangdong, Guangxi, Yunnan, Guizhou, Hainan

22
Northeast China Power GridNortheast China Power GridInstalled capacity: 41.3 GW
Max. load: 30.0 GW
Northwest China Power GridNorthwest China Power GridInstalled capacity: 25.8 GW
Max. load: 18.5 GW
Tibet Power Grid(temporarily run by the SGCC)
Installed capacity: 240 MW
North China Power GridNorth China Power GridInstalled capacity: 75.5 GW
Max. load: 65.8 GW
East China Power GridEast China Power GridInstalled capacity: 77.1 GW
Max. load: 65.2 GW
Central China Power GridCentral China Power GridInstalled capacity: 69.9 GW
Max. load: 52.8 GW
China Southern Power GridChina Southern Power GridInstalled capacity: 52.4 GW
Max. load: 44.6 GW
Hainan
(Appendix) Installed capacity and load in each regional power grid company by Feb. 2005
IEEJ:April 2006
Source: State Power Corporation of China, (http://www.sgcc.com.cn/).

23
IEEJ:April 2006
4. Regulation reform trends (4)
Establishment of the State Electricity Regulatory Commission (SERC) in March 2003Major responsibilities:- Develop laws and regulations; - Monitor electricity operations, - Propose tariff and adjustments to governmental pricing authority, - Investigate any possible violations of laws and regulations, - Supervise the implementation of universal service provisions, etc.
Taiyuan Office
Jinan Office
North China Bureau Northeast China Bureau
Lanzhou Office
Northwest China Bureau
Hangzhou Office
Nanjing Office
Fuzhou Office
East China Bureau
Zhengzhou Office
Changsha Office
Chengdu Office
Central China Bureau
Kunming Office
Guiyang Office
South China Bureau
SERC

24
IEEJ:April 2006
Northwest China Second half of 2006
5Tibet
1-6:地域市場建設の順序
Short-term goal (2006-2010): Separation of transmission and distribution sectors, partial liberalization Long-term goal (2010-): full liberalization
South China 2005.11 3
Implementation of pilot program of wholesale power market since April 2004
North China Second half of 20065
Central China First half of 2006 4
Northeast China 2004.1
1
East China 2004.5
2
4. Regulation reform trends (5)

25
IEEJ:April 2006
5. Retail electricity rate trends
History of retail electricity ratesHistory of retail electricity rates:
In January 2004, whole sale prices were uniformly raised 0.007 Yuan/kWh, and industrial rates were uniformly raised 0.008 Yuan/kWh
In June 2004, industrial power rates were raised an average of 0.022 Yuan/kWh in China’s Northern, Eastern, Central and Southern regions
In May 2005, national average retail prices were raised 0.0252 Yuan/kWh due to the introduction of the fuel costs adjustment system

26
IEEJ:April 2006
6.1. Issues
equity, fairness and transparency of networkoperators?
Transmission operators hold their own generationcapacities
security and stablity of coal supply?Negotiation between coal suppliers and generators for coalprice has became onerous since 2004
Transmission
promotion of investments in power networks?Debt percentages for power network companies rangedfrom 70% – 80%
Industrial power rates are high in comparison to householdrates create a rational electricity rates system?
Retail sector:
Fuel sector:
Generation
Regualtion
control of excess investment in generationsector?
In 2004, unauthorized construction/project totaled to 120GW
promotion of desulfurization system?At the end of 2004, power generating facilities withdesulfurizing apparatuses totaled a mere 6% of facilities

27
IEEJ:April 2006
6.2. Points to be checked (1)
Generation sector:
During the 11th Five-year Plan: 300 MW and above thermal plants will account for 50% of the total; only 600 MW and above new thermal plants will be allowed to be
built; the building of supercritical and ultra-supercritical power units will be encouraged; by 2020, nuclear power will be 40 GW
International ordering & bidding for supercritical, ultra-supercritical and large-scale gas-turbine plants, nuclear power plants will be expanded
28
IEEJ:April 2006
6.2. Points to be checked (2)
Generation sector:
During the 11th Five-year plan: 3,000 MW new wind power plantswill be installed; more than 70% of the wind power units will be domestically produced
Domestic production of wind power plants will be accelerated

29
IEEJ:April 2006
6.2. Points to be checked (3)
Generation sector:
“Regulated power rate system” and introduction of wholesale power market
The withdrawal of foreign IPPs will accelerate (for example: Siemens, Vattenfall, American Electric Power, Alston, etc.)
30
IEEJ:April 2006
6.2. Points to be checked (4)
Generation sector:
During the 11th Five-year plan: SO2 emission:12 million-13 million tons/year(10% reduction from 2005); soot emission: 3 million tons/year
(more than 25% reduction from 2005); coal consumption/kWh: less than 360 g; transmission loss rate: less than 7 %; consolidated usage rate of particulates: 70%, etc.
The latent potential of energy conservation and environmental countermeasures in power generation sector is quite great, consequently in the future, increased international(governmental and private sector) activity can be anticipated in concerned sectors

31
IEEJ:April 2006
6.2. Points to be checked (5)
Transmission sector:
During the 11th Five-year plan: construction of 330 kV and above power grids will reach 75,00 km; transformer capacity will reach 360 million kVA;
investment scale will be around1.5 trillion Yuan
Overseas orders of medium, high and ultra-high voltage transmission (1,000 kV) and transformer facilities will be expanded; technological collaborations (private sector)
will be invigorated in regards to network security and stable operations

32
IEEJ:April 2006
6.2. Points to be checked (6)
Retail sector:
Introduction of Renewable Energy Law & revision of electricity rate system
Retail prices tend to continually increased

33
IEEJ:April 2006
6.2. Points to be checked (7)
Market liberalization:
Power supply and demand is projected to be maintained in 2007
Implementation of regional power market will be accelerated and it isanticipated that small generators will exit and major generators will
concentrate on the market due to fierce market competition