China’s Cards and Payments Market · PDF file4.3 Online Buying Behaviour ... 5...
19
www.timetric.com Emerging Opportunities in China’s Cards and Payments Market Market Size, Trends and Drivers, Strategies, Products and Competitive Landscape Product Code: VR0861MR Published Date: October 2012
Transcript of China’s Cards and Payments Market · PDF file4.3 Online Buying Behaviour ... 5...

www.timetric.com
Emerging Opportunities in
China’s Cards and Payments
Market
Market Size, Trends and Drivers,
Strategies, Products and Competitive
Landscape
Product Code: VR0861MR
Published Date: October 2012

TABLE OF CONTENTS
Emerging Opportunities in the China’s Cards and Payments Industry Page 2
© Timetric. This product is licensed and is not to be photocopied Published: October 2012
TABLE OF CONTENTS
1 Executive Summary ..................................................................................................................... 7 2 Market Attractiveness and Future Prospects of Cards and Payments Industry ........................... 9 3 Analysis of Cards and Payments Market Drivers ....................................................................... 13
3.1 Macroeconomic Fundamentals ..................................................................................................... 13
3.1.1 GDP growth ................................................................................................................................ 14
3.1.2 Low Unemployment Rate ............................................................................................................. 15
3.1.3 Growth of Per-Capita GDP ........................................................................................................... 16
3.1.4 Loose Monetary Policy ................................................................................................................. 16
3.1.5 Growth Oriented Fiscal Policy....................................................................................................... 17
3.2 Infrastructure Drivers ................................................................................................................... 18
3.2.1 Dual Interface Cards .................................................................................................................... 18
3.2.2 Bank Card Testing Laboratory ...................................................................................................... 18
3.2.3 Digital Wallet ............................................................................................................................... 18
3.2.4 Neal Field Communication (NFC).................................................................................................. 18
3.3 Business Drivers .......................................................................................................................... 19
3.3.1 Retail Spending ........................................................................................................................... 19
3.3.2 Growth of Remittances ................................................................................................................. 19
3.3.3 Growth of Gift Cards and Closed Loop Prepaid Cards .................................................................... 20
3.3.4 Growth of Online Commerce ........................................................................................................ 20
3.4 Consumer Drivers ........................................................................................................................ 21
3.4.1 Urbanization ................................................................................................................................ 21
3.4.2 Emerging middle class segments .................................................................................................. 21
3.4.3 Growth of luxury spending ............................................................................................................ 22
3.4.4 Customs and Practices ................................................................................................................ 22
3.5 Card Fraud Statistics ................................................................................................................... 23
3.5.1 By channel .................................................................................................................................. 24
3.5.2 By scheme .................................................................................................................................. 25
3.6 Regulatory Framework in China.................................................................................................... 27
3.6.1 Payment Guidelines by China Union Pay according to Electronic Payment Guidelines, CUP ............ 27
3.6.2 CBRC risk management framework .............................................................................................. 29
3.6.3 CBRC credit card regulation relating to protection of consumer's personal data ............................... 29
3.6.4 Rules governing foreign bank entry and establishment ................................................................... 30
3.6.5 Regulation pertaining to Know Your Customer (KYC) ..................................................................... 30
3.6.6 Anti-money laundering legislation ................................................................................................. 30
3.6.7 Central bank regulations related to prepaid cards........................................................................... 31
3.6.8 Prepaid card market entry rule ...................................................................................................... 31
4 Emerging Consumer Atti tudes and Trends................................................................................ 32
4.1 Market Segmentation and Targeting ............................................................................................. 32
4.2 Consumer Preference .................................................................................................................. 34
4.2.1 Price ........................................................................................................................................... 35
4.2.2 Brand.......................................................................................................................................... 35
4.2.3 Convenience ............................................................................................................................... 35

TABLE OF CONTENTS
Emerging Opportunities in the China’s Cards and Payments Industry Page 3
© Timetric. This product is licensed and is not to be photocopied Published: October 2012
4.2.4 Services ...................................................................................................................................... 35
4.3 Online Buying Behaviour .............................................................................................................. 36
4.4 Preferred Payment Methods ......................................................................................................... 40
5 Competitive Landscape and Industry Dynamics........................................................................ 41
5.1 Market Share Analysis by Payment Channels ................................................................................ 41
5.1.1 Overview of payment channels ..................................................................................................... 41
5.2 Debit Cards Market Share ............................................................................................................ 45
5.2.1 By Bank ...................................................................................................................................... 45
5.2.2 By Scheme.................................................................................................................................. 46
5.3 Prepaid Cards Market Share ........................................................................................................ 47
5.3.1 By Closed Loop Cards ................................................................................................................. 47
5.4 Credit Cards Market Share ........................................................................................................... 48
5.4.1 By Bank ...................................................................................................................................... 48
5.4.2 By Scheme.................................................................................................................................. 49
5.5 Charge Cards Market Share ......................................................................................................... 50
5.5.1 By Scheme.................................................................................................................................. 50
6 Strategies Adopted by Key Players ........................................................................................... 51
6.1 Market Entry Strategies ................................................................................................................ 51
6.2 Marketing / Product Strategy ........................................................................................................ 52
6.2.1 Debit Cards ................................................................................................................................. 52
6.2.2 Credit Cards ................................................................................................................................ 54
6.2.3 Prepaid Cards ............................................................................................................................. 55
6.3 Pricing Strategies ........................................................................................................................ 56
7 Market Size and Growth Potential of Payment Card Industry .................................................... 57
7.1 Market Share Analysis by Type of Card......................................................................................... 57
7.2 Total Market Size and Forecast of Card Industry ............................................................................ 59
7.2.1 Analysis by number of cards ......................................................................................................... 59
7.2.2 Analysis by transaction value........................................................................................................ 60
7.2.3 Analysis by transaction volume ..................................................................................................... 61
7.3 Credit Card Market Size and Forecast........................................................................................... 62
7.3.1 Analysis by number of cards ......................................................................................................... 62
7.3.2 Analysis by transaction value........................................................................................................ 63
7.3.3 Analysis by transaction volume ..................................................................................................... 64
7.3.4 Other key performance indicators ................................................................................................. 65
7.4 Debit Card Market Size and Forecast ............................................................................................ 68
7.4.1 Analysis by number of cards ......................................................................................................... 68
7.4.2 Analysis by transaction value........................................................................................................ 69
7.4.3 Analysis by transaction volume ..................................................................................................... 70
7.4.4 Other key performance indicators ................................................................................................. 71
7.5 Prepaid Card Market Size and Forecast ........................................................................................ 73
7.5.1 Analysis by number of cards ......................................................................................................... 73
7.5.2 Analysis by segments – open loop and closed loop cards ............................................................... 74
7.6 Charge Card Market Size and Forecast......................................................................................... 77

TABLE OF CONTENTS
Emerging Opportunities in the China’s Cards and Payments Industry Page 4
© Timetric. This product is licensed and is not to be photocopied Published: October 2012
7.6.1 Analysis by number of cards ......................................................................................................... 77
7.6.2 Analysis by transaction value........................................................................................................ 78
7.6.3 Analysis by Transaction Volume ................................................................................................... 79
8 Company Profiles, Product, and Marketing Strategies .............................................................. 80
8.1 Shanghai Rural Commercial Bank (SRCB) .................................................................................... 80
8.1.1 Strategies .................................................................................................................................... 80
8.1.2 Debit Cards offered...................................................................................................................... 81
8.1.3 Credit Cards offered..................................................................................................................... 82
8.2 Bank of China.............................................................................................................................. 83
8.2.1 Strategies .................................................................................................................................... 83
8.2.2 Debit Cards offered...................................................................................................................... 84
8.2.3 Credit Cards Offered .................................................................................................................... 85
8.2.4 Prepaid Cards Offered ................................................................................................................. 85
8.3 Industrial and Commercial Bank of China Limited .......................................................................... 86
8.3.1 Strategies .................................................................................................................................... 86
8.3.2 Debit Cards Offered ..................................................................................................................... 87
8.3.3 Credit Cards Offered .................................................................................................................... 88
9 Appendix ................................................................................................................................... 89
9.1 Methodology................................................................................................................................ 89
9.2 Contact Us .................................................................................................................................. 89
9.3 About Timetric ............................................................................................................................. 89
9.4 Disclaimer ................................................................................................................................... 90
TABLE OF CONTENTS
Emerging Opportunities in the China’s Cards and Payments Industry Page 5
© Timetric. This product is licensed and is not to be photocopied Published: October 2012
LIST OF FIGURES
Figure 1: Current and Future Prospects of Various Cards in China .............................................................................................................. 9 Figure 2: Grow th Potential of The China Cards And Payments Market by Area of Usage ........................................................................... 10 Figure 3: Macroeconomic Climate Index in China ........................................................................................................................................ 13 Figure 4: Gross Domestic Product at Constant Price Growth (%), 2007-2016 ............................................................................................. 14 Figure 5: China Unemployment Rate (%), 2007–2011................................................................................................................................. 15 Figure 6: Retail Sales Growth in China (CNY Billion), 2007-2011................................................................................................................ 19 Figure 7: Grow th Rate of Urban and Rural Population (%), 2007-2011 ....................................................................................................... 21 Figure 8: Card Fraud Statistics by Region (US$ Million), 2007–2011 .......................................................................................................... 23 Figure 9: China Card Fraud Statistics by Channel (CNY Million), 2007–2011 ............................................................................................. 24 Figure 10: China Card Fraud Statistics at POS By Scheme (CNY Million), 2007–2011............................................................................... 25 Figure 11: China Card Fraud Statistics at ATM By Scheme (CNY Million), 2007–2011............................................................................... 26 Figure 12: China Cards and Payments Market Segmentation by Card Type ............................................................................................... 32 Figure 13: Market Segmentations of Major Banks by Card Type ................................................................................................................. 33 Figure 14: Consumer Preferences for Various Types of Card...................................................................................................................... 34 Figure 15: Online Retail Market in China, 2008-2011 (CNY Billion) ............................................................................................................. 36 Figure 16: Internet Users in China (Million), 2006-2011 ............................................................................................................................... 37 Figure 17: Mode Of Access to Online-Commerce (%), China ...................................................................................................................... 37 Figure 18: Market Share of Online Shopping Categories (%), 2011 ............................................................................................................ 38 Figure 19: Top Reasons to Buy Online ........................................................................................................................................................ 39 Figure 20: Preferred Online Payment Methods (%), 2007 ........................................................................................................................... 40 Figure 21: Value and Growth of Cash-Based Transactions in China (CNY Trillion), 2007–2011 ................................................................. 41 Figure 22: Value and Growth of Check-Based Transactions in China (CNY Trillion), 2007–2011 ............................................................... 42 Figure 23: Value and Growth of Credit Transfers in China (CNY Trillion), 2007–2011................................................................................. 43 Figure 24: Value and Growth of Card Transactions in China (CNY Trillion), 2007–2011 ............................................................................. 44 Figure 25: China Debit Card Market Share by Banks (%), 2011 .................................................................................................................. 45 Figure 26: China Debit Card Market Share by Schemes (%), 2011 ............................................................................................................. 46 Figure 27: China Closed Loop Prepaid Card Market Share (%), 2011......................................................................................................... 47 Figure 28: China Credit Card Market Share by Banks (%), 2011................................................................................................................. 48 Figure 29: China Credit Card Market Share by Scheme (%), 2011.............................................................................................................. 49 Figure 30: China Charge Card Market Share by Card Type (%), 2011 ........................................................................................................ 50 Figure 31: Card Marketing Strategies of Banks............................................................................................................................................ 52 Figure 32: Card Industry in China by Type of Cards (%), 2007–2016 .......................................................................................................... 58 Figure 33: Market Size by Volume of China Card Industry (Million), 2007–2016 ......................................................................................... 59 Figure 34: Market Size of Card Industry in China by Transaction Value (CNY Billion), 2007–2016 ............................................................. 60 Figure 35: Card Industry Market Size in China by Transaction Volume (Million), 2007–2016 ...................................................................... 61 Figure 36: Credit Card Industry Market Size in China by Volume (Million), 2007–2016 ............................................................................... 62 Figure 37: Credit Card Industry Market Size in China by Transaction Value (CNY Billion), 2007–2016 ...................................................... 63 Figure 38: Credit Card Industry Market Size in China by Transaction Volume (Million), 2007–2016 ........................................................... 64 Figure 39: Credit Card Industry Market Size in China by Frequency of Use (Transaction/Card/Year),, 2007– ............................................ 65 Figure 40: Credit Card Industry Market Size in China by Average Transaction Value (CNY), 2007–2016................................................... 66 Figure 41: Credit Card Usage ATM and POS (Million), 2007–2016 ............................................................................................................. 67 Figure 42: Debit Card Industry Market Size in China (Million), 2007–2016 .................................................................................................. 68 Figure 43: Debit Card Industry Market Size in China by Transaction Value (CNY Billion), 2007–2016........................................................ 69 Figure 44: Debit Card Industry Market Size in China by Transaction Volume (Million), 2007–2016............................................................. 70 Figure 45: Debit Card Industry Market Size in China by Frequency of Use (Transaction/Card/Year), 2007– .............................................. 71 Figure 46: Debit Card Usage at ATM and POS (Million), 2007–2016 .......................................................................................................... 72 Figure 47: Prepaid Card Industry Market Size in China ( Million), 2007–2016 ............................................................................................. 73 Figure 48: Open Loop Prepaid Card Industry Market Size in China (Million), 2007–2016 ........................................................................... 74 Figure 49: Closed Loop Prepaid Card Industry Market Size in China (Mil lion), 2007–2016 ........................................................................ 75 Figure 50: Prepaid Card Industry Market Size in China (CNY Billion), 2007–2016 ...................................................................................... 76 Figure 51: Charge Card Industry Market Size in China (Million), 2007–2016............................................................................................... 77 Figure 52: Card Industry Market Size in China by Transaction Value (CNY Billion), 2007–2016 ................................................................ 78 Figure 53: Charge Card Industry Market Size in China by Transaction Volume (Million), 2007–2016 ......................................................... 79 Figure 54: Shanghai Rural Commercial Bank (SRCB), Segmentation of Cards Offered.............................................................................. 80 Figure 55: Bank of China, Segmentation of Cards Offered .......................................................................................................................... 83 Figure 56: Industrial and Commercial Bank of China Limited, Segmentation of Cards Offered ................................................................... 86

TABLE OF CONTENTS
Emerging Opportunities in the China’s Cards and Payments Industry Page 6
© Timetric. This product is licensed and is not to be photocopied Published: October 2012
LIST OF TABLES
Table 1: Interest Rate Changes by People’s Bank of China, 2008–2012..................................................................................................... 16 Table 2: Market Entry Strategies of Various Foreign Corporate and Retail Bank......................................................................................... 51 Table 3: Debit Card Fee of Selected Banks ................................................................................................................................................. 56 Table 4: Card Industry in China by Type of Cards (Millions), 2007–2016 .................................................................................................... 57 Table 5: Market Size by Volume of China Card Industry (Million), 2007–2016 ............................................................................................ 59 Table 6: Market Size of Card Industry in China by Transaction Value (CNY Billion), 2007–2016 ................................................................ 60 Table 7: Market Size of Card Industry in China by Transaction Value (US$ Billion), 2007–2016................................................................. 60 Table 8: Card Industry Market Size in China by Transaction Volume (Million), 2007–2016 ......................................................................... 61 Table 9: Credit Card Industry Market Size in China by Volume (Million), 2007–2016 .................................................................................. 62 Table 10: Credit Card Industry Market Size in China by Transaction Value (CNY Billion), 2007–2016........................................................ 63 Table 11: Credit Card Industry Market Size in China by Transaction Value(US$ Billion), 2007–2016 ......................................................... 63 Table 12: Credit Card Industry Market Size in China by Transaction Volume (Million), 2007–2016............................................................. 64 Table 13: Credit Card Industry Market Size in China by Frequency of Use (Transaction/Card/Year), 2007–2016 ...................................... 65 Table 14: Credit Card Industry Market Size in China by Average Transaction Value (CNY), 2007–2016 .................................................... 66 Table 15: Credit Card Industry Market Size in China by Average Transaction Value (US$), 2007–2016..................................................... 66 Table 16: Debit Card Industry Market Size in China (Million), 2007–2016 ................................................................................................... 68 Table 17: Debit Card Industry Market Size in China by Transaction Value (CNY Million), 2007–2016 ........................................................ 69 Table 18: Debit Card Industry Market Size in China by Transaction Value (US$ Million), 2007–2016 ......................................................... 69 Table 19: Debit Card Industry Market Size in China by Transaction Volume (Million), 2007–2016.............................................................. 70 Table 20: Debit Card Industry Market Size in China by Frequency of Use (Transaction/Card/Year), 2007–2016........................................ 71 Table 21: Prepaid Card Industry Market Size in China ( Million), 2007–2016 .............................................................................................. 73 Table 22: Open Loop Prepaid Card Industry Market Size in China (Million), 2007–2016............................................................................. 74 Table 23: Closed Loop Prepaid Card Industry Market Size in China (Million), 2007– 2016 ........................................................................ 75 Table 24: Prepaid Card Industry Market Size in China (CNY Billion), 2007–2016 ....................................................................................... 76 Table 25: Prepaid Card Industry Market Size in China (US$ Billion), 2007–2016 ........................................................................................ 76 Table 26: Charge Card Industry Market Size in China (Million), 2007–2016................................................................................................ 77 Table 27: Charge Card Industry Market Size in China by Transaction Value (CNY Billion), 2007–2016 ..................................................... 78 Table 28: Charge Card Industry Market Size in China by Transaction Value (US$ Billion), 2007–2016 ...................................................... 78 Table 29: Charge Card Industry Market Size in China by Transaction Volume (Million), 2007–2016 .......................................................... 79 Table 30: Specif ic Discounts That Can be Availed by Yintong Card Users.................................................................................................. 84

EXECUTIVE SUMMARY
Emerging Opportunities in the China’s Cards and Payments Industry Page 7
© Timetric. This product is licensed and is not to be photocopied Published: October 2012
1 Executive Summary
The cards and payments market in China registered positive growth during the review period. Double -digit
growth was registered in both volume and value-terms during the review period, a situation which is
anticipated to continue over the forecast period. There is scope within the industry to expand card payment
mechanisms to cover low-value transactions.
Debit and credit cards grow positively in both value and volume terms
The card market in China recorded double-digit growth both in value and volume terms during the review
period. The debit card market grew at a CAGR of XX.XX% in value terms and by XX.XX% in volume terms.
The credit card market grew at a CAGR of XX.XX% in value terms and XX.XX% in volume terms. Both the
debit and credit card markets are expected to grow in value and volume terms over the forecast period.
Debit and credit cards are used for making high-value transactions
A notable tendency in the card market is that the consumers use credit and debit cards to make high-value
transactions. This has generated a growth in value terms in both the debit and credit card markets. Debit and
credit cards are expected to be used over the forecast period. The debit and credit card market is expected to
grow at respective CAGRs of XX.XX% and XX.XX% in value terms over the forecast period. As the market is
traditionally associated with high-value t ransactions, this growth represents a chance to expand into daily low-
value transactions.
Central bank tightens rules to regulate money laundering and reduce non-performing loan ratios
The People's Bank of China (PBC) has tightened rules in the credit and prepaid card market. The prepaid gift
card market is allegedly used for money laundering and tax evasion by corporates. To counter this, the central
bank has introduced legislation regarding the validity of prepaid cards. Registration is compulsory if the holder
purchases cards worth more than CNYXX,XXX. In the credit card market stringent rules have been prescribed
to reduce the number of non-performing loans. The ‘credit worthiness’ of the card holder is monitored and
revisions of credit limits are subject to closer supervision.
Marketing strategies and value-added services give an edge to domestic banks over foreign
competitors
The domestic banks have an edge in the debit and credit card market as they have partnered with domestic
service providers to bundle card products with a range of value -added services targeting different customer
demographics. The restrictions placed on foreign competitors have limited the extent to which they can adopt
similar marketing and promotional strategies.
Government initiatives support the use of debit and credit cards
The efforts of the Chinese government to increase card issuance supported card use during the review
period. The Chinese government has launched an ambitious project to issue social security cards to
beneficiaries as part of its 12th five-year plan. These cards can be used by beneficiaries to withdraw cash,
deposit cash and make payments at POS terminals. The project has popularized cards among the large
number of the Chinese population who are the recipients of social security benefits. In another similar
initiative, China Union Pay (CUP) has ventured to increase the issuance of charge cards to businesses. CUP
labeled standard charge cards were issued in XX provinces and municipalities to advocate budget
management and transparency in business practices.
Rural infrastructure and variety of card products offered by rural banks improves card literacy among
the rural population
The Central Bank and CUP partnered to issue card products and install infrastructure in rural markets. Many
rural banks now offer advanced card products which are customized for the individual user segment. These
are accompanied by a range of value-added services and have had the effect of improving card literacy in
rural markets.
EXECUTIVE SUMMARY
Emerging Opportunities in the China’s Cards and Payments Industry Page 8
© Timetric. This product is licensed and is not to be photocopied Published: October 2012
The gift card market is a driver of closed-loop prepaid cards
A key driver of the cards and payments market in China is the gift card category. The annual expenditure on
gift cards in 2011 was US$XXX billion. Gift cards have the potential for growth as demand is rising from the
both retail and corporate categories. Despite the central bank tightening rules on gift cards, the market has
grown significantly and is expected to continue this momentum over the forecast period.
Luxury consumption, urbanization and growth of middle class population encourages shift to card-
based transactions
Numerous dynamics in the Chinese market has positively influenced the cards and payments market. The
demand for luxury consumption from the middle class population has supported high-value card-based
transactions. Urbanization has improved living standards and retail expenditure which in turn has positively
impacted the market.
Development of e-commerce infrastructure
An important driver of growth in the cards and payments market is the developm ent of e-commerce
infrastructure. Many transactions made online are paid for using cards. E-commerce firms such as Taobao,
are launching dedicated payment platforms for facilitating secure card-based payments.

MARKET ATTRACTIVENESS AND FUTURE PROSPECTS
OF CARDS AND PAYMENTS INDUSTRY
Emerging Opportunities in the China’s Cards and Payments Industry Page 9
© Timetric. This product is licensed and is not to be photocopied Published: October 2012
2 Market Attractiveness and Future Prospects of Cards and Payments
Industry
The Chinese card market grew pos it ively in volume and value terms during the review period. The
market grew at a CAG R of XX. XX% in volume terms and is expected to register a CAG R of
XX. XX% over the forecast period. In value terms, the market grew at a CA GR of XX. XX% and is
anticipated to grow at a CAG R of XX. XX% over the forecast period. Traditionally, card-based
payments are used for making high-value payments. This reflects the fact that there is a large
untapped market potent ial and card-based payments could be extended to facilitate low-value
transactions. Among the different card categories, c redit and charge cards are expect ed to
regis ter the highest growth with respect ive CAG Rs of XX. XX% and XX. XX% over the forecast
period. The debit card category is expected to grow at a CA GR of XX. XX% in value terms. This
again reveals the potential of expanding card-based paym ents to low-value t ransact ions. The
debit card market is relatively mature and accounted for XX% of the overall market in volume
terms in 2011. In contrast, the market share of c redit cards comprised only X. XX%. The charge
and prepaid card categories also had a very nominal market share.
Figure 1: Current and Future Prospects of Various Cards in China
Source: Timetric Analysis © Timetric
Debit Card
Credit Card
Prepaid Card
Charge Cards
0%
5%
10%
15%
20%
25%
30%
35%
0% 10% 20% 30% 40% 50% 60%
CA
GR
2012
–2016
CAGR 2007–2011
Debit Card
Credit Card
Prepaid Card
Charge Cards
0%2%4%6%8%
10%12%14%16%18%20%22%24%26%
28%30%32%34%
0% 10% 20% 30% 40% 50% 60%
CA
GR
2012
–2016
CAGR 2007–2011
Emerging Opportunities
>Credit cards for low value transactions
>Debit cards for low value transactions
>Charge Cards for businesses
>Prepaid close-loop gift cards
Existing Opportunties
>Debit Card for high-value
transactions >Credit Card for high-value
transactions >Prepaid Gift Cards

MARKET ATTRACTIVENESS AND FUTURE PROSPECTS
OF CARDS AND PAYMENTS INDUSTRY
Emerging Opportunities in the China’s Cards and Payments Industry Page 10
© Timetric. This product is licensed and is not to be photocopied Published: October 2012
The growth potent ial of cards in China − based on their area of usage − is depic ted in the following
figure. Debit cards have positive growth potent ial in the mobile commerce, online shopping,
tradit ional retail, entertainment , uti lity payment and government welfare categories. Prepaid cards
represent potent ial growth in areas t radit ional retail, gifts, entertainment, ut ility bil ls, food meal,
payroll and procurement. Credit cards have the potential for growth in the mobile commerce,
online shopping, t raditional retail, entertainment, procurem ent and t ravel categories . Charge cards
represent potential in the online shopping, util ity bi ll payments, procurement and t ravel categories.
Figure 2: Growth Potential of The China Cards And Payments Market by Area of Usage
Source: Timetric analysis © Timetric
Debit Cards Prepaid Cards Credit Cards Charge Cards
Area of Usage
Mobile Commerce
Online Shopping
Traditional Retail
Gifts
Entertainment
Utility Bills
Food/Meal
Payroll
Procurement
Travel
Government Welfare Schemes
Financial Products
Employee Incentives
High Growth Potential
Medium Growth Potential
Low Growth Potential
EMERGING CONSUMER ATTITUDES AND TRENDS
Emerging Opportunities in the China’s Cards and Payments Industry Page 11
© Timetric. This product is licensed and is not to be photocopied Published: October 2012
3 Analysis of Cards and Payments Market Drivers
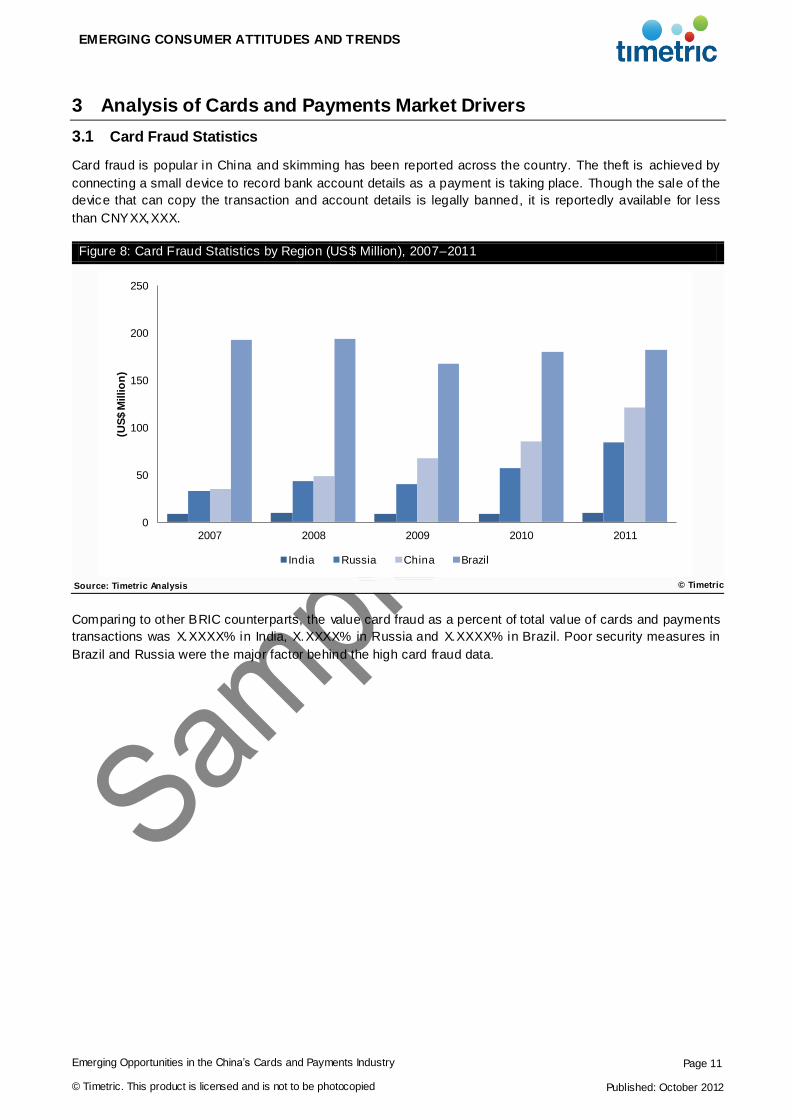
3.1 Card Fraud Statistics
Card fraud is popular in China and skimming has been reported across the country. The theft is achieved by
connecting a small device to record bank account details as a payment is taking place. Though the sale of the
device that can copy the transaction and account details is legally banned, it is reportedly available for less
than CNYXX,XXX.
Figure 8: Card Fraud Statistics by Region (US$ Million), 2007–2011
Source: Timetric Analysis © Timetric
Comparing to other BRIC counterparts, the value card fraud as a percent of total value of cards and payments
transactions was X.XXXX% in India, X.XXXX% in Russia and X.XXXX% in Brazil. Poor security measures in
Brazil and Russia were the major factor behind the high card fraud data.
0
50
100
150
200
250
2007 2008 2009 2010 2011
(US
$ M
illio
n)
India Russia China Brazil

EMERGING CONSUMER ATTITUDES AND TRENDS
Emerging Opportunities in the China’s Cards and Payments Industry Page 12
© Timetric. This product is licensed and is not to be photocopied Published: October 2012
3.1.1 By channel
The card fraud reported at POS terminals was greater than that reported at ATMs. The card fraud at POS
terminals amounted for CNYXXX.X million during 2011. The fraud at POS terminals grew at a CAGR of
XX.XX% during the review period and fraud at ATMs was relatively less and amounted to CNYXXX.X million
during 2011. The card fraud at ATMs grew at a CAGR of XX.XX% during the review period.
Figure 9: China Card Fraud Statistics by Channel (CNY Million), 2007–2011
Source: Timetric Analysis © Timetric
0
50
100
150
200
250
300
350
400
2007 2008 2009 2010 2011
RM
B M
illio
n
Fraud at ATM Fraud at POS

STRATEGIES ADOPTED BY KEY PLAYERS
Emerging Opportunities in the China’s Cards and Payments Industry Page 13
© Timetric. This product is licensed and is not to be photocopied Published: October 2012
4 Competitive Landscape and Industry Dynamics
There are more than 100 commercial banks operating in China. The Chinese card market is dominated by
four leading banks: the China Construction Bank (CCB), the Agricultural Bank of China (ABC), the Industrial &
Commercial Bank of China (ICBC) and Bank of China (BOC). These four banks together occupy more than
XX% of the card market share. Despite liberalization in the banking industry, banks have largely remained
under the control of the government. Foreign banks are subject to strict restrictions and were not permitted to
venture into the credit card market as standalone issuers, until mid -2012.
Popular payment channels include checks, cash transactions, credit cards and credit transfers. Despite the
fact that XX% of transactions are made in cash, the country has attempted to channelize these transactions to
cards. The PBC and the CUP launched efforts to ensure card penetration in rural markets. The card market
registered a CAGR of XX.X% in 2011.
4.1 Market Share Analysis by Payment Channels
This section explores the market shares of various payment channels and details how these channels have
grown during the review period. The popular payment channels were checks, cash transaction, credit cards
and credit transfers.
4.1.1 Overview of payment channels
In 2011, nearly XX% of payments were made in cash. Despite the concerted efforts to shift the economy to
card-based payments, the share of cash transactions registered a X.XX% increase during the review period.
The market share of cash payments decreased from XX.X% in 2007 to XX% in 2011. It is apparent from the
chart below that China does not have a large user base for payment cards. In 2007, card payments
constituted only X.X% of the total payments through various payment channels. It grew marginally to X.X% in
2011. The share of credit transfers also increased marginally from X.XX% in 2007 to X.XX% in 2011. The
share of check-based transactions decreased from X.XX% in 2007 to X% in 2011.
COMPANY PROFILE, PRODUCTS AND MARKETING
STRATEGIES
Emerging Opportunities in the China’s Cards and Payments Industry Page 14
© Timetric. This product is licensed and is not to be photocopied Published: October 2012
5 Market Size and Growth Potential of Payment Card Industry
The following chapter contains an overview of the market size and growth potential of the cards and payments
market in China. The section is divided into six sections. Section one covers market share analysis by type of
card, section two discusses the market share and future growth of the overall card industry by value and
volume, section three provides the market size of the country’s credit card market , section four discusses the
market size of debit cards in the US, while sections five and six respectively cover the market size and growth
potential of the prepaid and charge card market.
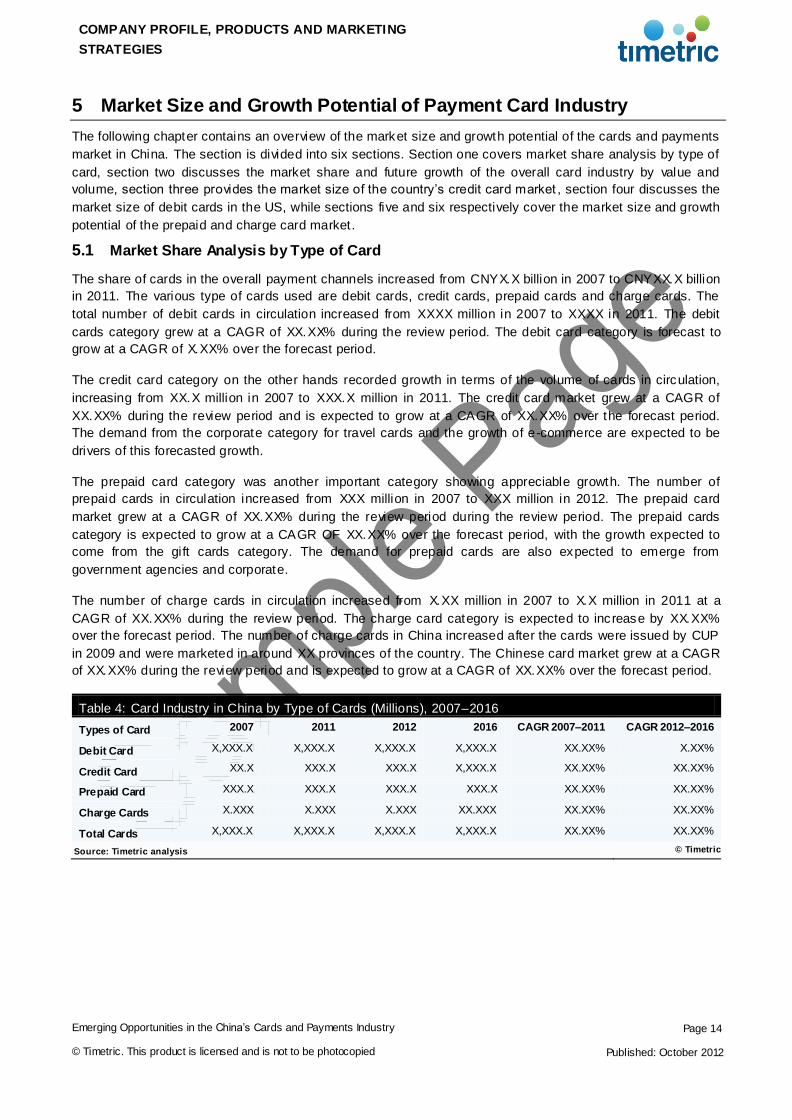
5.1 Market Share Analysis by Type of Card
The share of cards in the overall payment channels increased from CNYX.X billion in 2007 to CNYXX.X billion
in 2011. The various type of cards used are debit cards, credit cards, prepaid cards and charge cards. The
total number of debit cards in circulation increased from XXXX million in 2007 to XXXX in 2011. The debit
cards category grew at a CAGR of XX.XX% during the review period. The debit card category is forecast to
grow at a CAGR of X.XX% over the forecast period.
The credit card category on the other hands recorded growth in terms of the volume of cards in circulation,
increasing from XX.X million in 2007 to XXX.X million in 2011. The credit card market grew at a CAGR of
XX.XX% during the review period and is expected to grow at a CAGR of XX.XX% over the forecast period.
The demand from the corporate category for travel cards and the growth of e-commerce are expected to be
drivers of this forecasted growth.
The prepaid card category was another important category showing appreciable growth. The number of
prepaid cards in circulation increased from XXX million in 2007 to XXX million in 2012. The prepaid card
market grew at a CAGR of XX.XX% during the review period during the review period. The prepaid cards
category is expected to grow at a CAGR OF XX.XX% over the forecast period, with the growth expected to
come from the gift cards category. The demand for prepaid cards are also expected to emerge from
government agencies and corporate.
The number of charge cards in circulation increased from X.XX million in 2007 to X.X million in 2011 at a
CAGR of XX.XX% during the review period. The charge card category is expected to increase by XX.XX%
over the forecast period. The number of charge cards in China increased after the cards were issued by CUP
in 2009 and were marketed in around XX provinces of the country. The Chinese card market grew at a CAGR
of XX.XX% during the review period and is expected to grow at a CAGR of XX.XX% over the forecast period.
Table 4: Card Industry in China by Type of Cards (Millions), 2007–2016
Types of Card 2007 2011 2012 2016 CAGR 2007–2011 CAGR 2012–2016
Debit Card X,XXX.X X,XXX.X X,XXX.X X,XXX.X XX.XX% X.XX%
Credit Card XX.X XXX.X XXX.X X,XXX.X XX.XX% XX.XX%
Prepaid Card XXX.X XXX.X XXX.X XXX.X XX.XX% XX.XX%
Charge Cards X.XXX X.XXX X.XXX XX.XXX XX.XX% XX.XX%
Total Cards X,XXX.X X,XXX.X X,XXX.X X,XXX.X XX.XX% XX.XX%
Source: Timetric analysis © Timetric

COMPANY PROFILE, PRODUCTS AND MARKETING
STRATEGIES
Emerging Opportunities in the China’s Cards and Payments Industry Page 15
© Timetric. This product is licensed and is not to be photocopied Published: October 2012
5.2 Total Market Size and Forecast of Card Industry
The overall Chinese card market grew in both value and volume terms during the review period. In volume
terms the card market grew at a CAGR of XX.XX% during the review period during the review period. In value
terms the card market grew at a CAGR of XX.XX% during the review period.
5.2.1 Analysis by number of cards
The total number of cards in circulation increased from XXXX million in 2007 to XXXX million in 2011. The
overall card market grew at a CAGR of XX.XX% during the review period. The total number of cards in
circulation is expected to increase from XXXX million in 2012 to XXXX million in 2016. The card market as a
whole is forecast to grow at XX.XX% over the forecast period. The growth is expected to be driven mainly by
the credit card category, prepaid cards and charge cards. Corporate customers are expected to drive the
demand for credit and charge cards. The demand for prepaid cards is expected to emerge from both retail
and corporate and government agencies.
Table 5: Market Size by Volume of China Card Industry (Million), 2007–2016
2007 2008 2009 2010 2011 CAGR 2007–2011
Total Cards – Historical X,XXX.X X,XXX.X X,XXX.X X,XXX.X X,XXX.X XX.XX%
2012 2013 2014 2015 2016 CAGR 2012–2016
Total Cards – Forecast X,XXX.X X,XXX.X X,XXX.X X,XXX.X X,XXX.X XX.XX%
Source: Timetric analysis © Timetric
Figure 33: Market Size by Volume of China Card Industry (Million), 2007–2016
Source: Timetric analysis © Timetric
0%
3%
6%
9%
12%
15%
18%
21%
0
1,000
2,000
3,000
4,000
5,000
6,000
2007 2008 2009 2010 2011 2012 2013 2014 2015 2016
Gro
wth
Rate
(%
)
Nu
mb
er o
f C
ard
s (M
illio
n)

COMPANY PROFILE, PRODUCTS AND MARKETING
STRATEGIES
Emerging Opportunities in the China’s Cards and Payments Industry Page 16
© Timetric. This product is licensed and is not to be photocopied Published: October 2012
5.2.2 Analysis by transaction value
The transaction value through cards increased substantially from CNYX,XXX billion in 2007 to CNYXX,XXX
billion in 2011. The card market in terms of transaction value grew at a CAGR of XX.XX% during the review
period. The transaction value made through cards is expected to grow from CNYXX,XXX billion in 2012 to
CNYXXX,XXX billion in 2016. The transaction value through cards is expected to grow at a CAGR of XX.XX%
over the forecast period. A reason for this trend would be the increase in high-value transactions through
credit cards and charge cards.
Table 6: Market Size of Card Industry in China by Transaction Value (CNY Billion), 2007–2016
2007 2008 2009 2010 2011
CAGR 2007–
2011
Total Cards – Historical X,XXX.X X,XXX.X XX,XXX.X XX,XXX.X XX,XXX.X XX.XX%
2012 2013 2014 2015 2016
CAGR 2012–
2016
Total Cards – Forecast XX,XXX.X XX,XXX.X XX,XXX.X XXX,XXX.X XXX,XXX.X XX.XX%
Source: Timetric analysis © Timetric
Table 7: Market Size of Card Industry in China by Transaction Value (US$ Billion), 2007–2016
2007 2008 2009 2010 2011
CAGR 2007–
2011
Total Cards – Historical XXX.X XXXX.X XXXX.X XXXX.X XXXX.X XX.X%
2012 2013 2014 2015 2016
CAGR 2012–
2016
Total Cards – Forecast XXXX.X XXXX.X XXXXX.X XXXXX.X XXXXX.X XX.X%
Source: Timetric analysis © Timetric
Figure 34: Market Size of Card Industry in China by Transaction Value (CNY Billion), 2007–2016
Source: Timetric analysis © Timetric
0%
5%
10%
15%
20%
25%
30%
35%
40%
45%
50%
0
20,000
40,000
60,000
80,000
100,000
120,000
140,000
160,000
180,000
2007 2008 2009 2010 2011 2012 2013 2014 2015 2016
Gro
wth
Rate
(%
)
Valu
e o
f T
ran
sacti
on
s (R
MB
Billio
n)

COMPANY PROFILE, PRODUCTS AND MARKETING
STRATEGIES
Emerging Opportunities in the China’s Cards and Payments Industry Page 17
© Timetric. This product is licensed and is not to be photocopied Published: October 2012
5.2.3 Analysis by transaction volume
The transaction volume through cards is expected to increase from XXXX million in 2007 to XX,XXX million in
2011. The transaction volume grew at a CAGR of XX.XX% during the review period. The t ransaction volume
through cards is expected to increase from XX,XXX million in 2012 to XX,XXX million in 2016, representing a
CAGR of XX.XX% over the forecast period.
Table 8: Card Industry Market Size in China by Transaction Volume (Million), 2007 –2016
2007 2008 2009 2010 2011
CAGR 2007–
2011
Total Cards – Historical X,XXX.X X,XXX.X X,XXX.X XX,XXX.X XX,XXX.X XX.XX%
2012 2013 2014 2015 2016
CAGR 2012–
2016
Total Cards – Forecast XX,XXX.X XX,XXX.X XX,XXX.X XX,XXX.X XX,XXX.X XX.XX%
Source: Timetric analysis © Timetric
Figure 35: Card Industry Market Size in China by Transaction Volume (Million), 2007 –2016
Source: Timetric analysis © Timetric
0%
3%
6%
9%
12%
15%
18%
21%
24%
27%
30%
33%
36%
39%
0
10,000
20,000
30,000
40,000
50,000
60,000
70,000
2007 2008 2009 2010 2011 2012 2013 2014 2015 2016G
row
th R
ate
(%
)
Nu
mb
er o
f T
ran
sacti
on
s (M
illion
)
APPENDIX
Emerging Opportunities in the China’s Cards and Payments Industry Page 18
© Timetric. This product is licensed and is not to be photocopied Published: October 2012
6 Appendix
6.1 Methodology
Timetric’s dedicated research and analysis teams consist of experienced professionals with an industry
background in marketing, market research, consulting and advanced statistical expertise.
Timetric adheres to the Codes of Practice of the Market Research Society ( www.mrs.org.uk) and the Society
of Competitive Intelligence Professionals (www.scip.org).
All Timetric databases are continuously updated and revised.
6.2 Contact Us
If you have any queries about this report, or would like any further information, please contact
6.3 About Timetric
Timetric is an independent economic and business research firm that provides critical intelligence on
emerging economies and key global industries. The company offers detailed economic and sector
intelligence, business insights and independent and authoritative commentary.
Underpinning all Timetric’s research services is a belief that data – i f gained following the right technologies
and analytic frameworks – can provide unique and powerful economic and business insights.
The Timetric economic and industry intelligence centers are premium decision tools that provide access to
comprehensive research, data and expert analysis. They provide invaluable decision support, presented in an
easily digestible format and grounded in rich, proprietary data and data analysis frameworks.
Each year, Timetric produces hundreds of high-quality research reports across countries, industries and
companies. These reports draw on in-depth primary and secondary research, proprietary data and high-
quality modeling and analysis to give its readers a deep insight into global market dynamics and economic
trends.
Timetric helps its clients to:
Gain an unbiased, expert insight from a genuinely independent and trusted source
Save time in researching, visualizing and comparing economic and industry data
Access the latest and most useful data sets, indices and forecasts
Gain access to a unique methodology for understanding economic trends
Forecast and predict trends more accurately
Economic Research Services
Timetric’s economic research services are founded on three key goals:
1. To provide the strongest base data:
The most accurate data
The most timely and frequently updated data sets
The best data curation methodologies and standardizations
Unique data sets and forward-looking indicators

APPENDIX
Emerging Opportunities in the China’s Cards and Payments Industry Page 19
© Timetric. This product is licensed and is not to be photocopied Published: October 2012
Industry-specific, premium data sets
2. To develop the best data analysis frameworks:
Unique economic indices and data analysis frameworks
Forward-looking indicators
Proprietary indices and surveys
Data analysis frameworks, scorecards and models
3. To provide authoritative independent economic insights:
To give a uniquely local perspective on developing markets
Truly expert, independent economic analysis and commentary
Proprietary analysis techniques and frameworks
Unique forecasts
Timetric believes that world-class content delivery should be the enabling factor across all it does. All its
research services follow the principle that data and research should be easy to access, visualize and
consume.
All economic research products are built on the Timetric economic research software plat form, which has four
layers:
1. Unique, proprietary aggregation and curation software for pulling together the world’s
data
2. A cloud time-series database filled with top-quality statistics from across the globe
3. Web-delivered search, discovery and research software to allow customized data
searches
4. World-class browser-based display to visualize the data searched
6.4 Disclaimer
All rights reserved.
No part of this publication may be reproduced, stored in a retrieval system or transmitted in any form by any
means, electronic, mechanical, photocopying, recording or otherwise, without the prior permission of the
publisher, Timetric.
The facts of this report are believed to be correct at the time of publication but cannot be guaranteed. Please
note that the findings, conclusions and recommendations that Timetric delivers will be based on information
gathered in good faith from both primary and secondary sources, the accuracy of which Timetric is not always
in a position to guarantee. Timetric will accept no liability whatsoever for actions taken based on any
information that may subsequently prove to be incorrect.