Planting Seeds Annual Report - 2015 China - Peoples Republic of
THIS REPORT CONTAINS ASSESSMENTS OF COMMODITY AND TRADE ISSUES MADE BY
USDA STAFF AND NOT NECESSARILY STATEMENTS OF OFFICIAL U.S. GOVERNMENT
POLICY
Voluntary - Public
Date: 12/22/2009
GAIN Report Number: CH9137
China - Peoples Republic of
Post: Beijing
Fishery Products Annual
Report
Report Categories:
Fishery Products
Approved By:
Mike Woolsey
Prepared By:
Chanda Beckman, Wu Xinping, and Angie Han
Report Highlights:
China's aquatic production in 2010 is forecast at 51.9 MMT, up three percent over the estimated 50.4 MMT in
2009. Production growth is driven by strong domestic consumption resulting from growing disposable incomes,
and export-oriented aquatic processing. As a result of the slow-down in the world economy, total aquatic trade
value is expected to decline for the first time in five years to an estimated at $12.9 billion in 2009, down from
$13.3 billion the previous year. The United States continues to be the second largest seafood supplier to China
and the second largest buyer of China's processed aquatic products with fish fillet as the largest category in
2009. Bilateral aquatic trade is likely to grow in 2010 along with the anticipated recovery of the global economy.
Executive Summary:
China’s 2010 aquatic production is forecast to reach 51.9 MMT, up three percent from the estimated 50.4 MMT
in 2009. Much of this production growth is due to the continued expansion of aquaculture production, which
accounted for 70 percent of total aquatic production in 2008. The increase in China’s aquatic production is tied
both to China’s growing domestic demand as well as a strong export market. China’s rapid economic growth has
resulted in increasing disposable incomes, which has encouraged greater aquatic product consumption among
China’s consumers. The expansion of aquaculture area in both coastal seawater and freshwater contributed
greatly to China’s aquatic production growth, while aquatic catch production remains stable with the chance of a
slight decline over the next few years. The aquatic processing sector, which is mainly export-driven, is also
expected to expand further in the coming years.
Aquatic trade is forecast to grow in 2010 with China’s trade surplus expected to increase from the estimated $6.3
billion in 2009. Despite anticipated weak demand by major importing countries as a result of the current financial
crisis, export-oriented aquaculture and the processing trade are likely to recover in 2010. The United States
continues to be the second largest recipient of China’s processed aquatic exports, and also ranks as the second
largest supplier of seafood to China. Aquatic trade between China and the United States is forecast to grow in
2010 with the “Fish/Frozen” category (HS Code 0303) continuing to be the major category imported from the
United States. The export product mix to the United States is diversified with seasoning, cuts, and valued-added
products. Controlling streptococcus disease remains a new challenge for export-oriented tilapia production. The
opening of the U.S. Food and Drug Administration (FDA) offices in China is expected to strengthen the
confidence of Chinese aquatic product exports and help facilitate smooth trade in 2010 and beyond.
Sustained high GDP and disposable income growth rates will continue to boost domestic consumption of aquatic
products in 2010. However, imports for domestic consumption are growing at a slow pace. Nevertheless, high
quality natural aquatic products from the United States, including salmon, are expected to steadily increase in
volume and value.
Definition of terms: Aquatic products are both defined as cultured (farm raised) and wild caught aquatic products;
including fish, shrimp/prawn/crab, shellfish, algae, and other. Aquatic catch production is total volume of both
fresh and seawater caught wild aquatic products. Aquatic culture production is the total volume of both fresh and
seawater cultured (farmed) aquatic products. This report will use Chinese terminology to maintain consistency
between Chinese statistics and product categories.
General Information:
Production
Aquatic production is forecast to reach 51.9 MMT in 2010
China’s aquatic production in 2010 is forecast to reach 51.9 MMT, up three percent from the estimated 50.4
MMT in 2009. China remains the world’s largest aquaculture producer. The increase in production is attributed
to the country’s rapid economic growth, rising disposable incomes and greater consumption of aquatic products,
together with strong aquatic exports. While official statistics are not yet available, 2009 aquatic production is
estimated to increase by three percent over the 48.9 MMT in 2008. According to China’s Ministry of
Agriculture (MOA), aquatic production from January - August 2009 reached 27.8 MMT, up more than four
percent over the previous year-to-date figure. Production growth is mainly attributable to cultured production at
19.8 MMT, up more than seven percent over the previous year. Based on an MOA survey, both the cultured
water area and inputs increased in the first eight months of 2009. Driven by strong demand for aquatic products
in the domestic market and reduced prices for inputs, the profit margin for fish farmers has
increased. Additionally, production efficiency improved because of adoption of advanced technologies, and
financial support from the central government to renovate aquaculture infrastructures (pond reconstruction,
etc.). Ocean catch production, however, declined to 6.7 MMT, down four percent over the previous year. MOA
attributed the extended half-month fishing ban in the summer and deteriorated marine fishing resources to this
year’s smaller catch production. According to the National Statistics Bureau (NSB), the yearly growth rate of
China’s aquatic production averaged four percent from 2004 through 2008. However, it showed a declining
trend from four percent in 2004 to three percent in 2008.
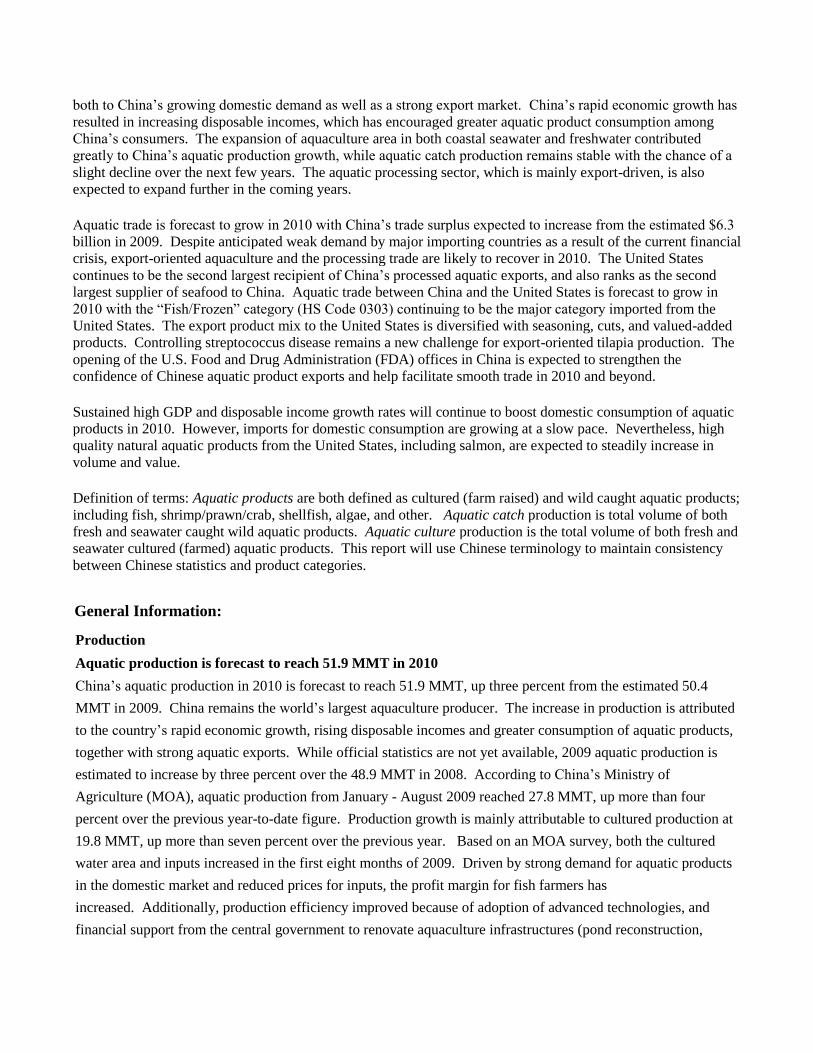
Table 1 China’s aquatic production (Unit: 1000 Metric Tons)
Category/Year 2005 2006 2007 2008 2009* Total Aquatic Production 44,199 45,836 47,475 48,956 50,400
-Seawater Aquatic Production 24,659 25,096 25,509 25,983 26,000
---Seawater Catch 12,551 12,455 12,435 12,580 12,400
---Seawater Culture 12,108 12,642 13,073 13,403 13,600
-Freshwater Aquatic Production 19,540 20,740 21,966 22,973 24,400
---Freshwater Catch 2,210 2,204 2,256 2,248 2,000
---Freshwater Culture 17,330 18,536 19,710 20,725 22,400
Source: 2009 China Statistics Yearbook/Table 12-20;* Estimated by FAS/Beijing
China’s continued aquatic production increase is fueled by aquaculture expansion which is estimated to account
for 70 percent of total aquatic production in 2008. As mentioned above, NSB’s data show the yearly aquatic
production growth rate from 2004 to 2008 averaged four percent. During this same period, the annual cultured
(farmed) aquatic production growth rate grew at more than six percent. Aquatic catch production remained
stagnant from 14.3 MMT in 2001 to 14.7 MMT for 2008. This trend is likely to continue both domestically and
worldwide in the foreseeable future and will only be limited by declining wild fishery resources. In contrast,
aquaculture production will be driven by the further exploitation of water resources along with higher
yields. Freshwater and seawater culture production both increased in 2008, up five percent and three percent
over the previous year, respectively. Total cultured aquatic production reached 32.8 MMT, accounting for 70
percent of total aquatic production in 2008.
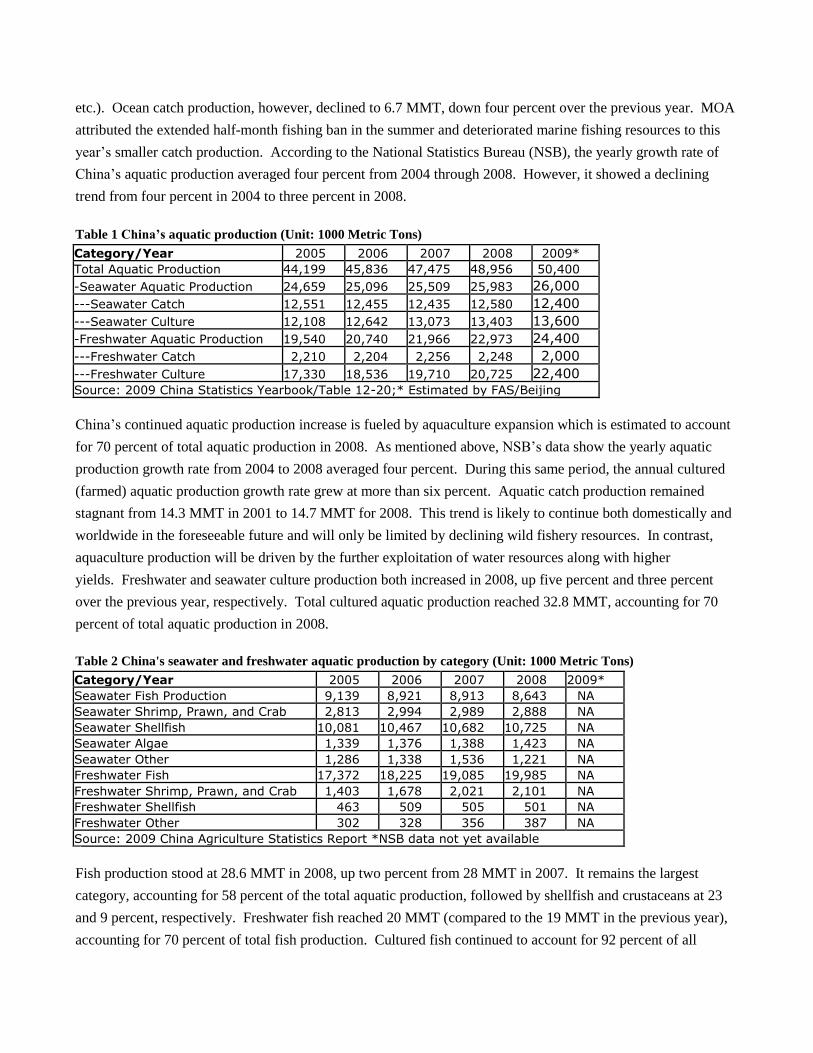
Table 2 China's seawater and freshwater aquatic production by category (Unit: 1000 Metric Tons)
Category/Year 2005 2006 2007 2008 2009* Seawater Fish Production 9,139 8,921 8,913 8,643 NA Seawater Shrimp, Prawn, and Crab 2,813 2,994 2,989 2,888 NA Seawater Shellfish 10,081 10,467 10,682 10,725 NA Seawater Algae 1,339 1,376 1,388 1,423 NA Seawater Other 1,286 1,338 1,536 1,221 NA Freshwater Fish 17,372 18,225 19,085 19,985 NA Freshwater Shrimp, Prawn, and Crab 1,403 1,678 2,021 2,101 NA Freshwater Shellfish 463 509 505 501 NA Freshwater Other 302 328 356 387 NA Source: 2009 China Agriculture Statistics Report *NSB data not yet available
Fish production stood at 28.6 MMT in 2008, up two percent from 28 MMT in 2007. It remains the largest
category, accounting for 58 percent of the total aquatic production, followed by shellfish and crustaceans at 23
and 9 percent, respectively. Freshwater fish reached 20 MMT (compared to the 19 MMT in the previous year),
accounting for 70 percent of total fish production. Cultured fish continued to account for 92 percent of all

freshwater fish production in 2008. Carp is the most popular cultured freshwater fish with total production at
13.5 MMT in 2008 (up from 12.9 MMT in 2007), accounting for 73 percent of total freshwater cultured fish
production. Tilapia production remained generally stable in 2008 at 1,110,000 MT, compared to the 1,134,000
MT in 2007. Industry sources reported that tilapia production in 2009 is estimated at 1,150,000 MT. The slow
growth in production reflected the weak demand from major tilapia importing markets resulting from the global
economic decline since 2008. Tilapia production is expected to continue growing in the near future in response
to recovering demands for China’s tilapia products by foreign markets in particular the United States, together
with increasing domestic consumption. Catfish production is likely to reach 250,000 MT in 2009, up from
224,000 MT in 2008. Shellfish continued to be the largest group of sea-cultured species with 2008 production
exceeding 10 MMT, and accounting for 75 percent of total sea cultured production. Cultured crustacean
production in 2008 exceeded 2.7 MMT, of which freshwater production represented 65 percent of the total
cultured crustacean production in 2008. Cultured Penaeus vannamei (also known as white shrimp) production
reached 1,063,000 MT in 2008, accounting for 39 percent of total cultured crustacean production.
In 2009, Shandong, Guangdong, and Fujian Provinces are expected to remain the three largest aquatic product
producers, mainly because of their large sea cultured production. Hubei, Guangdong, and Jiangsu Provinces
rank as the top three in freshwater production due to their high freshwater cultured production and abundant
freshwater resources in the area.
Table 3 China's top-8 aquatic producing provinces in 2008 (Unit: Metric Tons)
Province Total production Sea production Freshwater production Total 48,956,000 25,983,000 22,973,000 Shandong 7,303,000 6,095,000 1,208,000 Guangdong 6,804,000 3,768,000 3,036,000 Fujian 5,420,000 4,761,000 659,000 Zhejiang 4,188,000 3,376,000 812,000 Jiangsu 4,250,000 1,253,000 2,998,000 Liaoning 3,777,000 3,161,000 615,000 Hubei 3,134,000 0 3,134,000 Guangxi 2,500,000 1,441,000 1,059,000 Other 11,580,000 2,128,000 9,452,000 Source: 2009 China Statistics Yearbook
Freshwater aquaculture exists nationwide, particularly for carp. However, production of some species is limited
to certain regions due to available resources and climactic conditions. For example, tilapia production is
dominated by four provinces: Guangdong, Guangxi, Hainan, and Fujian, accounting for 89 percent of the total
1,110,000 MT in 2008. Catfish production, on the other hand, is primarily located in Sichuan, Hubei, Jiangsu
and Jiangxi, collectively producing 61 percent of the national total. Production in Hunan and Anhui also
approached 20,000 MT in 2008, respectively. The largest producers of both fresh and seawater shrimp and
prawn are Guangdong, Guangxi, Jiangsu, Zhejiang, and Shandong Provinces. Guangdong continued to be the
largest shrimp producer in 2008, with total cultured production at 502,000 MT (507,000 MT), of which Penaeus
vannamei production at 402,000 MT (395,900 MT in 2007). Eel production is concentrated in Fujian,
Guangdong, and Jiangxi Provinces, with much of it destined for the Japanese market. The combined cultured
shellfish production of Shandong, Fujian, Guangdong, and Liaoning Provinces continued to dominate,
accounting for 78 percent of the 2008 total.
Tilapia production faces disease challenge
The rapid growth of tilapia production in recent years faced a new challenge in 2009. According to industry
sources, an outbreak of streptococcus occured from July through September 2009 in some parts of major tilapia
producing provinces, and impacted production. After careful analysis, China’s tilapia experts deduced that
animal excrement contamination could be the reason for the outbreak of the disease. A vaccine has been
developed to prevent future outbreaks. However, the disease resulted in tight supply of raw fish at increased
price for export-processing facilities in late 2009. Some processors complained that if the export price does not
increase facilities may have to suspend operations because their profit margin will be negative. Some industry
insiders, however, believe that the impact of the disease is limited only to the short term, and the disease can be
prevented if the culture environment can be properly controlled with the assistance of vaccines.
Aquatic catch production is shrinking
Total 2010 catch production is forecast to be unchanged from the estimated 2009 production of 14.4 MMT, but
down from 14.8 MMT in 2008. According to NSB, annual seawater catch between 2005 and 2008 ranged from
12.4 to 12.6 MMT and accounted for 85 percent of China’s total catch. Freshwater catch production has
remained small at about 2.2 MMT in the past few years. According to MOA, total sea catch production in the
first eight months of 2009 was 6.7 MMT, four percent lower than the previous year. MOA acknowledged that
the deterioration of marine fishing resources, coupled with the extended half-month fishing ban in 2009 reduced
sea catch production. MOA also claimed that the summer fishing ban implemented 15 years ago protects marine
fish resources and improves the ecological environment. As a result of this ban, catch production of some fish
species such as ribbon fish and croaker, increased rapidly compared to 1994. Industry sources report that total
catch is unlikely to increase in the foreseeable future due to limited freshwater and seawater natural resource
availability. Though seawater catch data for other territorial seas is not officially released, most industry insiders
believe it is difficult to increase production significantly.
Aquaculture farmed area expansion continues
The total aquaculture area expanded rapidly in 2008, exceeding 6.5 MHA, up more than 14 percent over
2007. The combined freshwater and seawater areas increased by 804,000 HA, with 558,000 HA for freshwater
and 248,000 HA for seawater in 2008. Liaoning Province added 158,000 HA of aquaculture area with 117,000
HA of seawater and 41,000 HA of freshwater area, respectively. Zhejiang and Shanxi Provinces also increased
aquaculture area by 118,000 HA and 106,000 HA, respectively. The expansion of aquaculture area in inland
provinces such as Shanxi and Henan is mainly the result of making use of existing lakes and reservoirs. Industry
insiders opined that this rapid growth of aquaculture area not sustainable beyond 2009. However, both seawater
and freshwater culture area is likely to grow moderately in the coming years. Freshwater culture area is also
expected to increase because some reservoirs/lakes will be utilized for aquaculture purposes along with
improvement of transportation and technical services. However, MOA indicated that limited water resources
and environmental concerns pose new challenges to the expansion of aquaculture areas and additional
production gains will be achieved through technology dissemination and innovation.
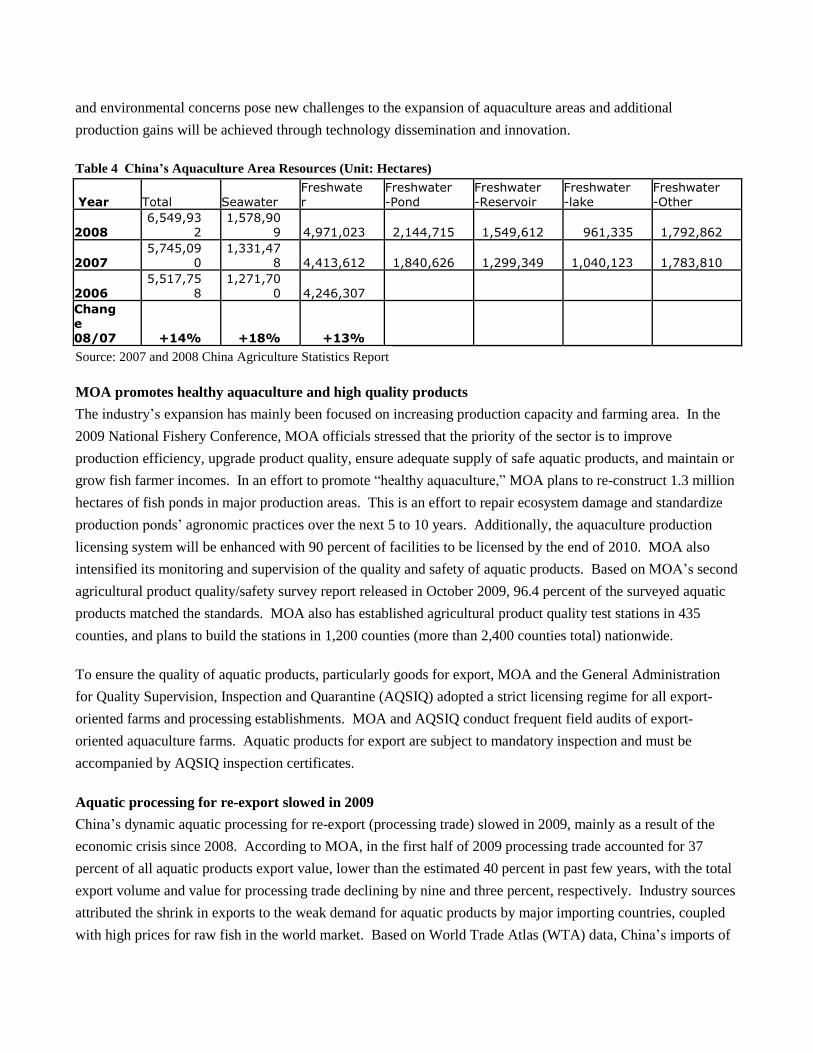
Table 4 China’s Aquaculture Area Resources (Unit: Hectares)
Year Total Seawater Freshwater
Freshwater-Pond
Freshwater-Reservoir
Freshwater-lake
Freshwater-Other
2008 6,549,93
2 1,578,90
9 4,971,023 2,144,715 1,549,612 961,335 1,792,862
2007 5,745,09
0 1,331,47
8 4,413,612 1,840,626 1,299,349 1,040,123 1,783,810
2006 5,517,75
8 1,271,70
0 4,246,307
Change 08/07 +14% +18% +13%
Source: 2007 and 2008 China Agriculture Statistics Report
MOA promotes healthy aquaculture and high quality products
The industry’s expansion has mainly been focused on increasing production capacity and farming area. In the
2009 National Fishery Conference, MOA officials stressed that the priority of the sector is to improve
production efficiency, upgrade product quality, ensure adequate supply of safe aquatic products, and maintain or
grow fish farmer incomes. In an effort to promote “healthy aquaculture,” MOA plans to re-construct 1.3 million
hectares of fish ponds in major production areas. This is an effort to repair ecosystem damage and standardize
production ponds’ agronomic practices over the next 5 to 10 years. Additionally, the aquaculture production
licensing system will be enhanced with 90 percent of facilities to be licensed by the end of 2010. MOA also
intensified its monitoring and supervision of the quality and safety of aquatic products. Based on MOA’s second
agricultural product quality/safety survey report released in October 2009, 96.4 percent of the surveyed aquatic
products matched the standards. MOA also has established agricultural product quality test stations in 435
counties, and plans to build the stations in 1,200 counties (more than 2,400 counties total) nationwide.
To ensure the quality of aquatic products, particularly goods for export, MOA and the General Administration
for Quality Supervision, Inspection and Quarantine (AQSIQ) adopted a strict licensing regime for all export-
oriented farms and processing establishments. MOA and AQSIQ conduct frequent field audits of export-
oriented aquaculture farms. Aquatic products for export are subject to mandatory inspection and must be
accompanied by AQSIQ inspection certificates.
Aquatic processing for re-export slowed in 2009
China’s dynamic aquatic processing for re-export (processing trade) slowed in 2009, mainly as a result of the
economic crisis since 2008. According to MOA, in the first half of 2009 processing trade accounted for 37
percent of all aquatic products export value, lower than the estimated 40 percent in past few years, with the total
export volume and value for processing trade declining by nine and three percent, respectively. Industry sources
attributed the shrink in exports to the weak demand for aquatic products by major importing countries, coupled
with high prices for raw fish in the world market. Based on World Trade Atlas (WTA) data, China’s imports of
flatfish decreased by 13 percent, and cod imports declined 61 percent in volume from January - October 2009
compared with the previous year. The increased price for cod and reduced catch in major supplying countries
such as Russia encouraged Chinese traders to switch to the more profitable salmon processing business.
Aquatic processing for domestic consumption grew slowly
Processed aquatic products using domestic raw material (mostly cultured products) are mainly driven by
exports. Domestic consumption of processed aquatic products remains relatively small compared to the total
annual domestic aquatic product consumption. Although some consumers in large cities have begun purchasing
processed aquatic products, most Chinese consumers still prefer live or fresh aquatic goods. Despite complaints
of foreign trade barriers on Chinese aquatic products, MOA acknowledged that the barriers also forced the sector
to invest more in producing value-added, higher quality products.
According to MOA, the total number of aquatic processing facilities continued to increase in 2008, reaching
9,971, up by 175 over the previous year. Processing capacity also rose to 22 MMT from 21 MMT in 2007. The
number of cold storage facilities increased over 2007 by 582 to 7,439. Total aquatic products processed in 2008
was 16.4 MMT compared to the 16.8 MMT in the previous year. This accounted for about 34 percent of the
total aquatic production in 2008. Total processed aquatic product volume stood at 13.7 MMT, of which 8.5
MMT was frozen or frozen processed goods. Industry sources indicate that this situation reflects domestic
consumers enduring preference for live aquatic products. The processing sector’s capacity to expand is mainly
driven by export market demand, which has led to the construction of new production facilities.
Aquatic processing bases are located within or near major aquatic production regions. Out of the total 9,971
processing facilities, 6,904, or 69 percent are concentrated in Zhejiang, Shandong, Fujian, and Guangdong
Provinces. These provinces are also major aquaculture producers and are equipped with port and cold storage
facilities. Many foreign traders have also entered the processing trade industry in these provinces.
Consumption
China’s per capita aquatic product consumption is forecast to continue increasing in 2010. Based on NSB’s
information, per capita consumption for urban dwellers in 2007 was 14 Kg, up from 13 Kg in the previous year,
while for rural residents it was 5.4 Kg, up 0.4Kg. NSB did not provide consumption of aquatic products for
urban dwellers in 2008 (Post estimated this at 14.3 Kg) but for rural resident it was 5.2 Kg, slightly lower than
the previous year. Chinese industry insiders expect that consumption of aquatic products in 2009 is higher than
the previous year mainly because of adequate supply at relatively lower prices, and the continued growth in
consumer incomes. Per capita consumption is expected to increase steadily with stronger growth potential in the
rural sector than the urban sector because the rural consumption is relatively low at present.
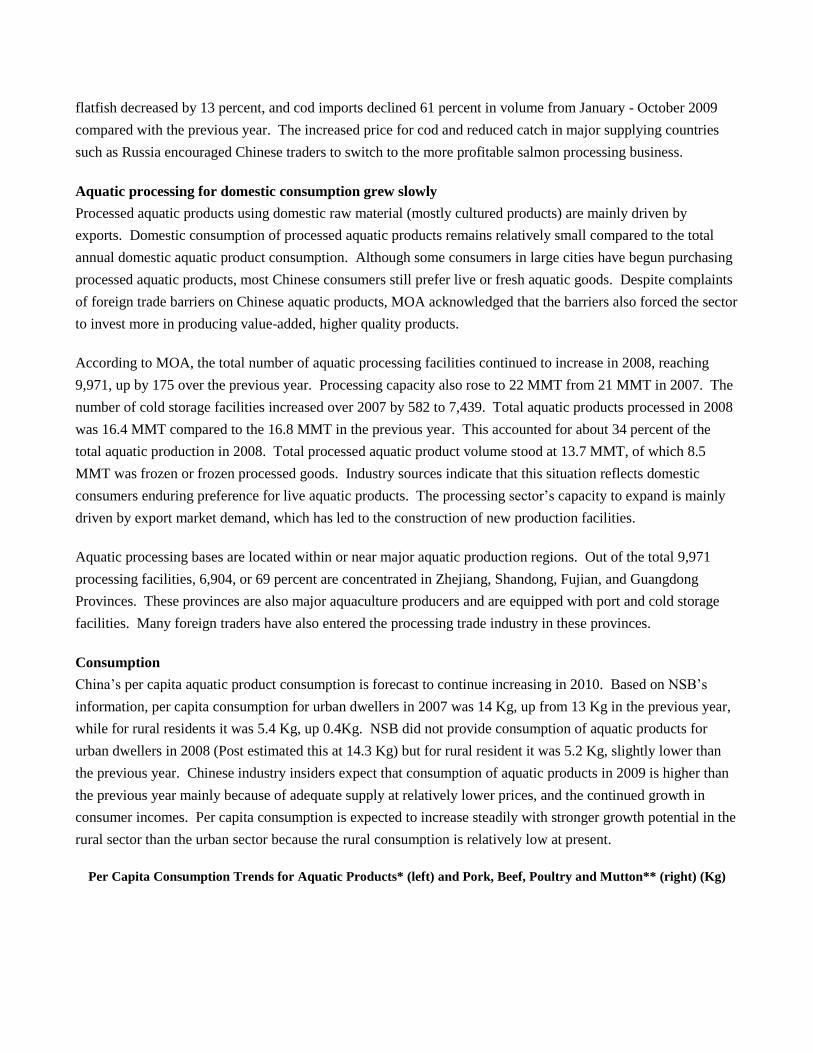
Per Capita Consumption Trends for Aquatic Products* (left) and Pork, Beef, Poultry and Mutton** (right) (Kg)
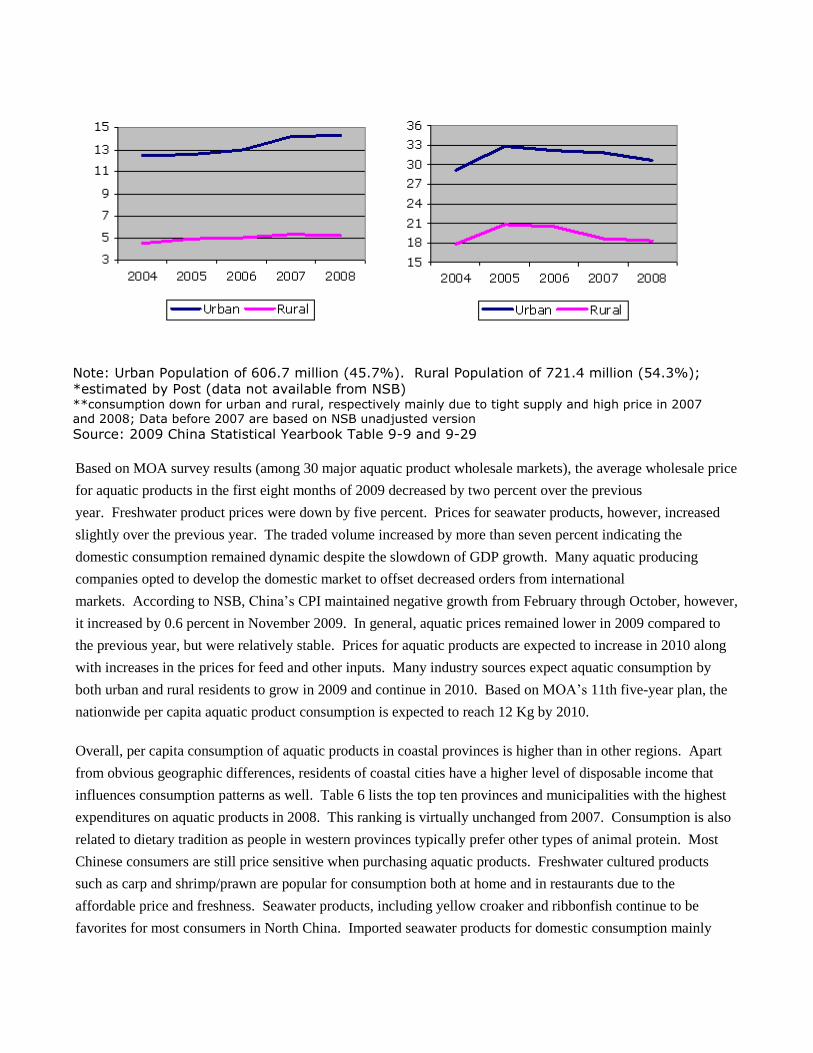
Note: Urban Population of 606.7 million (45.7%). Rural Population of 721.4 million (54.3%);
*estimated by Post (data not available from NSB) **consumption down for urban and rural, respectively mainly due to tight supply and high price in 2007 and 2008; Data before 2007 are based on NSB unadjusted version Source: 2009 China Statistical Yearbook Table 9-9 and 9-29
Based on MOA survey results (among 30 major aquatic product wholesale markets), the average wholesale price
for aquatic products in the first eight months of 2009 decreased by two percent over the previous
year. Freshwater product prices were down by five percent. Prices for seawater products, however, increased
slightly over the previous year. The traded volume increased by more than seven percent indicating the
domestic consumption remained dynamic despite the slowdown of GDP growth. Many aquatic producing
companies opted to develop the domestic market to offset decreased orders from international
markets. According to NSB, China’s CPI maintained negative growth from February through October, however,
it increased by 0.6 percent in November 2009. In general, aquatic prices remained lower in 2009 compared to
the previous year, but were relatively stable. Prices for aquatic products are expected to increase in 2010 along
with increases in the prices for feed and other inputs. Many industry sources expect aquatic consumption by
both urban and rural residents to grow in 2009 and continue in 2010. Based on MOA’s 11th five-year plan, the
nationwide per capita aquatic product consumption is expected to reach 12 Kg by 2010.
Overall, per capita consumption of aquatic products in coastal provinces is higher than in other regions. Apart
from obvious geographic differences, residents of coastal cities have a higher level of disposable income that
influences consumption patterns as well. Table 6 lists the top ten provinces and municipalities with the highest
expenditures on aquatic products in 2008. This ranking is virtually unchanged from 2007. Consumption is also
related to dietary tradition as people in western provinces typically prefer other types of animal protein. Most
Chinese consumers are still price sensitive when purchasing aquatic products. Freshwater cultured products
such as carp and shrimp/prawn are popular for consumption both at home and in restaurants due to the
affordable price and freshness. Seawater products, including yellow croaker and ribbonfish continue to be
favorites for most consumers in North China. Imported seawater products for domestic consumption mainly
include cod, squad, plaice, and mackerel. Processed shellfish/shrimp/prawns and tilapia fillet are also
increasingly popular among consumers in large cities. High quality imported seafood such as lobster, geoducks,
salmon, and crab, however, are widely used by hotels and restaurants targetting high-end consumers. Along
with the growing middle-class in large cities and coastal regions with booming economies, the potential for these
products remains promising as Chinese families opt for a more diversified and nutritious diet.
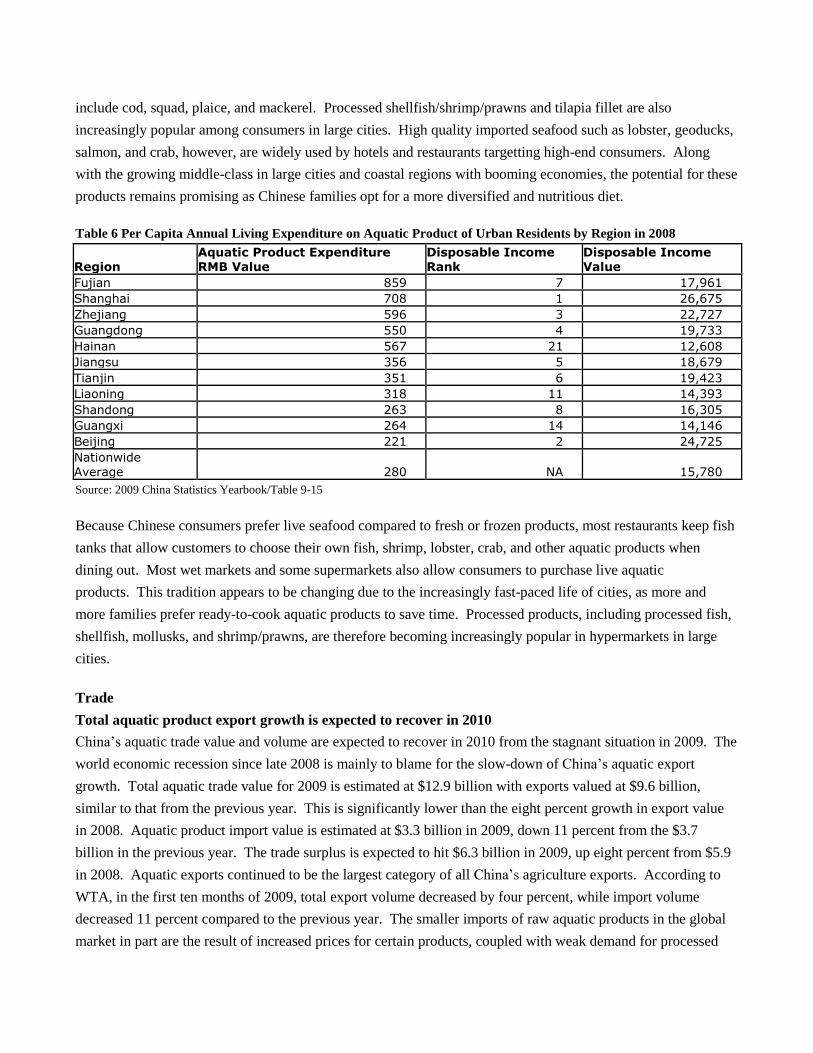
Table 6 Per Capita Annual Living Expenditure on Aquatic Product of Urban Residents by Region in 2008
Region Aquatic Product Expenditure RMB Value
Disposable Income Rank
Disposable Income Value
Fujian 859 7 17,961 Shanghai 708 1 26,675 Zhejiang 596 3 22,727 Guangdong 550 4 19,733 Hainan 567 21 12,608 Jiangsu 356 5 18,679 Tianjin 351 6 19,423 Liaoning 318 11 14,393 Shandong 263 8 16,305 Guangxi 264 14 14,146 Beijing 221 2 24,725 Nationwide Average 280 NA 15,780
Source: 2009 China Statistics Yearbook/Table 9-15
Because Chinese consumers prefer live seafood compared to fresh or frozen products, most restaurants keep fish
tanks that allow customers to choose their own fish, shrimp, lobster, crab, and other aquatic products when
dining out. Most wet markets and some supermarkets also allow consumers to purchase live aquatic
products. This tradition appears to be changing due to the increasingly fast-paced life of cities, as more and
more families prefer ready-to-cook aquatic products to save time. Processed products, including processed fish,
shellfish, mollusks, and shrimp/prawns, are therefore becoming increasingly popular in hypermarkets in large
cities.
Trade
Total aquatic product export growth is expected to recover in 2010
China’s aquatic trade value and volume are expected to recover in 2010 from the stagnant situation in 2009. The
world economic recession since late 2008 is mainly to blame for the slow-down of China’s aquatic export
growth. Total aquatic trade value for 2009 is estimated at $12.9 billion with exports valued at $9.6 billion,
similar to that from the previous year. This is significantly lower than the eight percent growth in export value
in 2008. Aquatic product import value is estimated at $3.3 billion in 2009, down 11 percent from the $3.7
billion in the previous year. The trade surplus is expected to hit $6.3 billion in 2009, up eight percent from $5.9
in 2008. Aquatic exports continued to be the largest category of all China’s agriculture exports. According to
WTA, in the first ten months of 2009, total export volume decreased by four percent, while import volume
decreased 11 percent compared to the previous year. The smaller imports of raw aquatic products in the global
market in part are the result of increased prices for certain products, coupled with weak demand for processed
products at relatively low prices. Some Chinese aquatic product manufacturers complained that they suspended
processing of certain products because they were unable to turn a profit. Industry sources explained that the
growth in total value and decline in volume reflect a shift to a more value-added product mix. Most Chinese
industry insiders believe that along with the stable recovery of the world economy, and the strong
competitiveness of China’s industry, aquatic exports in 2010 are likely to recover over the previous year.
Aquatic export destinations became more diversified. It is expected that China’s aquatic export value to 19
countries/regions will reach $100 million for each in 2009. Japan continued to be the largest export destination,
followed by the United States and South Korea. (See tables).
Aquatic processing trade is expected to level off
Aquatic imports are forecast to increase in 2010 over the estimated 2.1 MMT imported in 2009. The estimated
2.1 MMT of imports in 2009 is 11 percent lower than in 2008. The yearly growth rate for aquatic import volume
reached six and 12 percent in 2007 and 2006, respectively. Chinese industry sources reported the aquatic import
slowdown demonstrated processing trade was challenged by increased prices of raw fish in international
markets, coupled with higher prices for energy, labor, and other domestic inputs. Export prices, however,
remained low due to the global economic recession. For instance, the import volume of cod plummeted by 61
percent from January – August 2009 mainly because of very thin processing profits. MOA is concerned that the
“low price and profit strategy” employed by some exporters will hurt the sustainable development of the
industry and product quality is likely to be compromised.
There is no official data that can accurately distinguish the share of aquatic imports destined for China’s
processing trade. According to MOA, the export value of processing was 37 percent out of the total aquatic
export value in the first ten months of 2009, compared with the 40 percent estimate from industry sources. This
also indicates that export share of domestic aquatic products (using domestically produced raw material) is likely
to grow in 2009. Imports for domestic consumption are also growing, but at a comparably slower
pace. Government policy continues to favor the expansion of the processing industry because it can absorb
much of China’s ever growing labor force. According to WTA, in the first ten months of 2009, imports by
category are characterized by a decreased volume of frozen fish (HS 0303) and mollusks (HS 0307), however,
accounting for 80 and 12 percent of the total imported volume, respectively. Large imports are destined for re-
export with a strong combined export volume of fish/fillet (HS 0304) and prepared or packaged fish (HS 1604),
at about 1.1 MMT, accounting for 50 percent of the total export volume.
Based on WTA, salmon imports increased sharply to 169,226 MT in the first ten months of 2009, up 76 percent
compared to the previous year. Salmon imports from Russia soared to 67,776 MT, from 17,914 MT in
2008. Imports from the United States also increased to 56,481 MT, up 41 percent. Industry sources reported
that a good harvest of salmon in Russia contributed to an affordable price, encouraging many traders to switch to
salmon processing. Based on WTA, import price for salmon in the first ten months of 2009 averaged at $
2.29/Kg, six percent lower than the previous year. Russia surpassed the United States to become the largest
supplier of salmon to China, followed by the United States and Japan.
Russia is expected to continue to top the list of origins for China’s aquatic product imports, which it has headed
for the past consecutive seven years, distantly followed by the United States and Japan. Total imports from
Russia are estimated to be $1.1 billion in 2009, down from the previous year, however, accounting for 34
percent of China’s total 2009 aquatic imports.
Qingdao and Dalian continue to be the two largest arrival ports for aquatic products, accounting for 85 percent of
the total imports. Well-established facilities, including processing factories in Qingdao and Dalian, will likely
solidify the status of these two cities as the largest seafood import hubs in China for the foreseeable future.
Aquatic trade with the United States is expected to grow
Despite the reduced total import value, imports from the United States continued moderate growth during the
first ten months of 2009, with imports valued at $472 million and expected to reach $550 million for the year (up
three percent over 2008). The United States has been the second largest supplier to China since 2004. From
January to August 2009, frozen fish remained the largest category, accounting for 80 percent of the total import
value. Salmon was the top import valued at $136 million, followed by plaice (at $130 million out of the total
$181 million for all flatfish), cod valued at $43 million, and mollusks valued at $45 million. Although salmon
imports from the United States soared, it is difficult to quantify the volume of salmon imported for domestic
consumption. However, salmon is becoming a staple dish among middle class consumers at home or dining out
in Japanese restaurants or hi-end hotels in large cities including Beijing, Shanghai, and Guangzhou. Industry
insiders believe China will become one of the world’s largest salmon markets in the near future.
China’s total aquatic exports to the United States in the first ten months of 2009 also followed a growth trend,
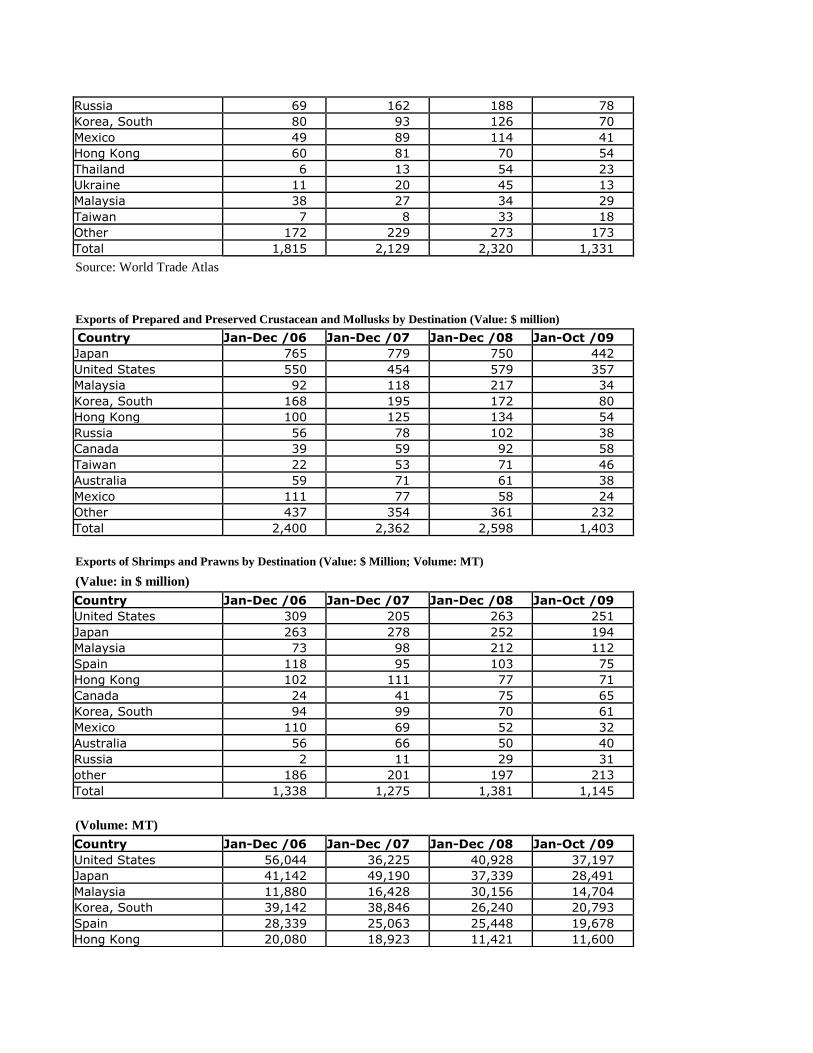
and reached $1.6 billion in value, up two percent over the previous year. Major product category includes fish
fillet ($730 million, up 48 percent over the previous year), followed by prepared/preserved crustacean/mollusks
($357 million), and prepared/packaged fish ($226 million).
Fishmeal imports are forecast at 1.3 MMT in 2010
Fishmeal imports in 2010 are forecast at 1.3 MMT, similar to the estimated 1.3 MMT in 2009. Fishmeal imports
in 2008 exceeded 1.3 MMT, mainly due to a steady recovery of China’s animal husbandry sector. The price of
fishmeal in 2009 declined moderately, allowing imports to remain strong in the first quarter of 2009. Feed
industry sources reported that fishmeal is still regarded as the best animal protein source provided the price
remains acceptable and reasonable. Other protein meals are added as substitutes when prices for fish meal are
too high. Domestic fishmeal production continues to be low and expected to be less than 260,000 MT in
2009. Imports for 2010 are forecast at 1.3 MMT given the large scale of China’s animal husbandry and
aquaculture sectors, and the 2009 ending stocks are likely to be high. Peru remains the largest fishmeal supplier
to China, accounting for 59 percent of total imports in the first ten months of 2009. Imports from the United
States are expected to be similar to past years at approximately 70,000 MT annually.
Fish fillet tops total aquatic exports
China’s exports of aquatic products for 2009 are expected to reach $9.6 billion, similar to the previous
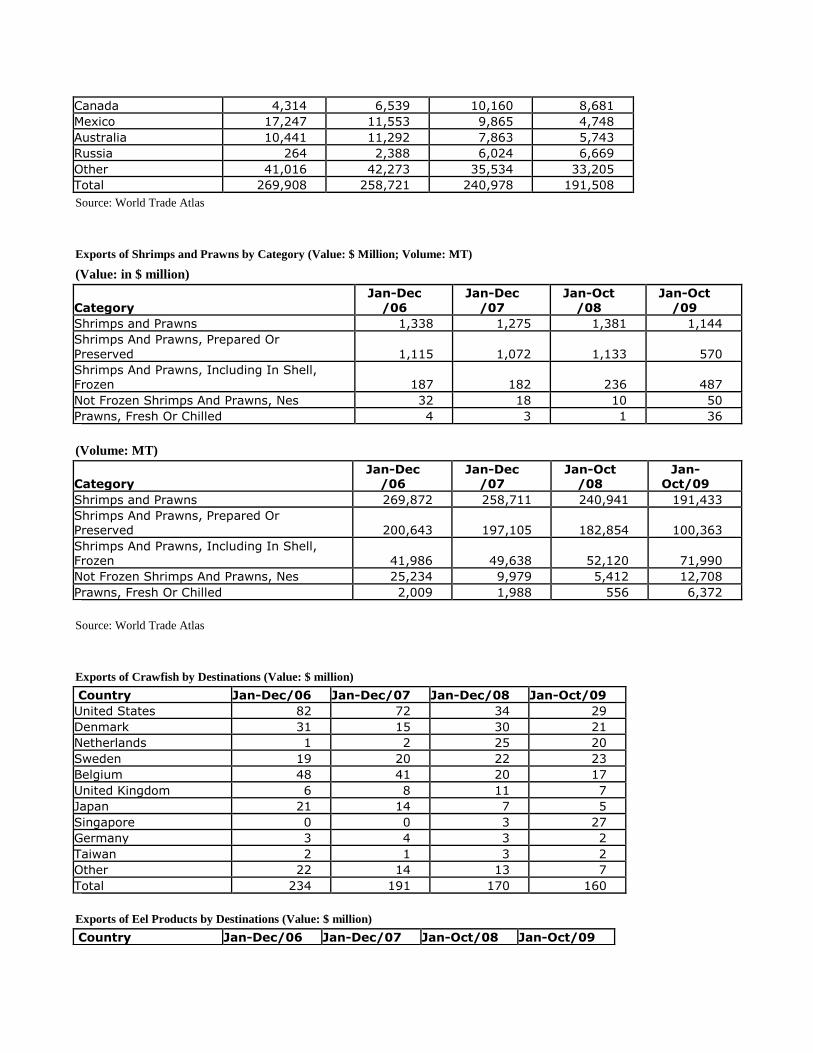
year. Based on WTA data, in the first ten months of 2009 the major export categories - prepared or packaged
fish and caviar (HS Code 1604), and prepared crustaceans and mollusks (HS Code 1605) have seen a decrease in
growth in both value and volume. Fish fillet (HS Code 0304) exports, however, increased 10 percent in export
volume, and 17 percent in value, over the previous year. Some industry insiders believe that this is because
customers in major importing markets prefer less expensive fillets to prepared and packaged fish during times of
economic difficulty.
Adding greater value to fish products has increasingly enhanced China’s industry. The trend is likely to
continue and will be made possible through the advancement in technology and management, as the industry
strives to meet changing consumer demand.
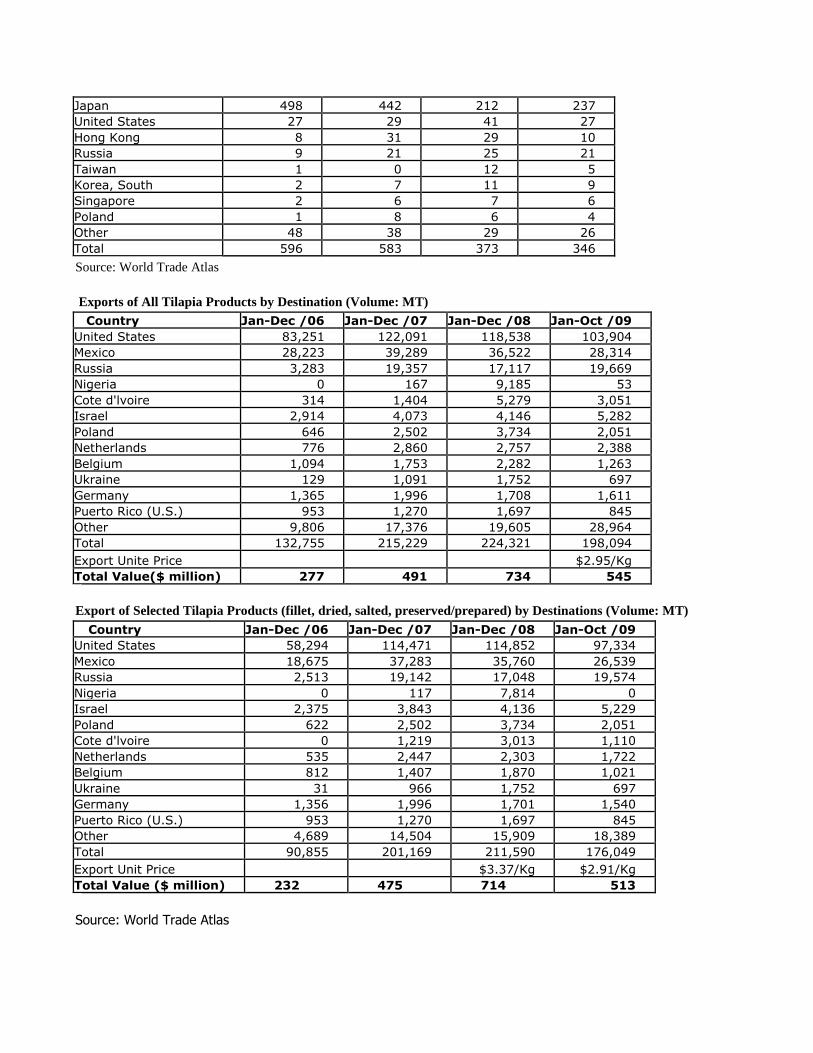
In the first ten months of 2009, total tilapia exports reached $545 million, down from $573 million in the
previous year. The product mix changed, with fillets valued at $327 million, up significantly from $18 million
in 2008; while the export value of prepared and preserved tilapia dropped to $186 million compared to the $539
million in the previous year. This notable change of tilapia product mix reflected a variation in consumer
preference for cheaper fillets. The share of prepared and preserved tilapia fillets may increase along in tandem
with the recovery of consumer purchasing power in 2010. In the first ten months in 2009, the United States
remained the largest destination for China’s tilapia products, accounting for 52 percent in volume. The net
export volume to the United States exceeded 100,000 MT, up 13 percent over 2008.
More measures adopted to make aquatic food exports to the United States safer
On November 19, 2008, the United States Department of Health and Human Service (HHS) announced the
opening of FDA’s first foreign office in Beijing, China. Offices in Guangzhou and Shanghai were opened in
2009. FDA’s presence in China will include eight officials described as "inspectors and senior technical experts
in foods, medicine and medical devices." FDA employees will inspect products and liaise with Chinese officials
and groups. The United States also intends to help the Chinese government improve its regulatory systems for
exports. The establishment of these offices in China will greatly enhance the speed and effectiveness of our
regulatory cooperation and our efforts to protect consumers in both countries. This cooperation is based on a
Memorandum of Agreement on Food and Feed Safety signed by HHS and AQSIQ (GAIN7888). It is expected
that the joint efforts of FDA (by the new FDA presence in China) and AQSIQ will better safeguard Chinese
aquatic products destined to the United States.
Sea caught seafood exports to the EU likely affected by EU catch certificate
Based on an EU Illegal, Unreported and Unregulated Fishing Regulation, effective January 1, 2010, most of the
sea caught seafood exports to EU must be accompanied by a “Catch Certificate.” This will cover both sea
caught products by Chinese marine fishing companies and products imported from other countries by Chinese
processors. MOA has already requested traders/processing facilities obtain the “Catch Certificate” from
overseas suppliers if the processed products are destined for the EU.
Based on WTA data, China’s total aquatic exports to the EU were valued at $1.8 billion in 2008 and reached
$1.4 billion in the first ten months of 2009. Industry sources reported that more than half of these exports are sea
caught processed products. Some Chinese industry insiders opined that these new requirements have raised the
threshold and created a trade barrier for Chinese aquatic product exports to EU.
China’s catfish industry shows concerns over new USDA catfish rule
Since the 2008 Farm Bill extended FSIS’s inspection jurisdiction to include domestic and imported farm-raised
catfish, the relevant Chinese authorities continually express concern over the development of the rule. The
Chinese industry is eager to comment on the USDA proposed rule, and continually remind Post of their hope it
will not affect trade. In coordination with FSIS, FAS/Beijing explained to the industry the implementation of the
rule will comply with WTO principles.
Policy
China’s policy favors smooth growth for aquatic production and exports
China’s fishery production policy remains generally unchanged. China’s rapid GDP growth will boost domestic
demand for aquatic products. MOA continued to promote a more sustainable development model with rational
resource utilization in 2008 through a nationwide plan to build environmentally-friendly and healthy aquaculture
demonstration bases. Through increased enforcement of relevant laws/regulations and technical extension, the
plan is aimed at promoting better use of resources, protecting the environment, producing safe products, and
raising farmer incomes. Other measures include technology extension and drug use supervision. The
aquaculture development plan by region/province also remains unchanged in general. However, some provinces
have expedited development of local freshwater or seawater resources in 2008. For instance Liaoning Province
added 116,000 hectares of seawater culture area, and Shaanxi and Zhejiang Provinces both added freshwater
culture area by 106,000 hectares and 78,000 hectares, respectively. It is difficult to predict whether this rapid
expansion of culture water area will continue into 2010 and beyond. Large aquatic producing provinces will
continue to focus on their most competitive products. Export-oriented aquaculture production/processing will
continue to be concentrated in coastal provinces.
Domestic aquatic catch is restricted. The “Zero Growth” policy for domestic wild aquatic catch is to be
maintained, although overseas catch is encouraged. The two-month summer fishing moratorium in China’s
seawater was extended to two and half months in 2009, and the three-month spring fishing ban in the Yangtze
River entered its sixth year. In an effort to protect and restore ecological balance, state and provincial fishery
departments conduct frequent releases of aquatic fingerlings to waters nationwide. The catch in other territorial
seas is encouraged but the expected production will remain stable overall.
Implementation of aquaculture licensing system delayed
The implementation of an aquaculture licensing system continued in 2009. According to MOA’s 2008
Promotion of Healthy Aquaculture Action Plan, major aquatic producing counties completed overall water
resources development plans and 90 percent of aquaculture entities will be licensed by the end of
2008. However, an MOA circular dated March 30, 2009, indicated that a target of 90 percent licensing is to be
achieved in 2010. This demonstrates the challenge that remains for licensing the thousands of China’s small
scale aquaculture facilities. The implementation of the nationwide licensing system is aimed at better regulation
of the industry and enforcement of policies. As mentioned above, the HHS and AQSIQ agreement signed in
December 2007 will require exporters to the United States to register with AQSIQ and agree to annual
inspections to ensure their goods meet U.S. standards.
Policy on aquatic processing trade remains unchanged
China’s government views the processing trade as an advantageous industry due to its role in generating new
employment and producing rendered product that can be used as a feed ingredient for the feed
industry. Essentially, imports under the heading “Processing Trade” will continue to be imported value added
tax (VAT) and tariff-free. Processed products, however, must be re-exported. Imports destined for China’s
domestic consumption are subject to tariff and VAT (CH5089). According to industry sources, processing trade
declined slightly, accounting for 37 percent of China’s estimated $9.6 billion aquatic exports in 2009. However,
China’s industry and official sources both claim that China is actively becoming the world’s processing center
for mackerel, salmon, cod, and herring. Industry sources note that the number of enterprises involved in
“Processing Trade” is on the rise, especially in the large fishery provinces, Shandong and Liaoning. According
to China’s Ministry of Finance, enterprises engaged in primary processing of aquatic products and other
agriculture commodities are entitled to a preferential income tax policy, however, no details have been
published.
Amended import certificate for live edible aquatic products amended
On December 11, 2008, AQSIQ published on its website the “Explanations on Amendments to Rules of
Inspection and Quarantine on Entering Edible Aquatic
Species.” (http://dzwjyjgs.aqsiq.gov.cn/zxjyjyyq/200812/t20081211_100208.html). The amendments request
the exporting country to add detailed inspection and quarantine information to the export health certificate
(GAIN CH9050). FAS/Beijing, in collaboration with NOAA, APHIS/Beijing, and the Foreign Commercial
Service/Beijing conducted several consultations with AQSIQ. A NOAA amended version of Health Certificate
for live edible aquatic products was approved by AQSIQ, and currently NOAA is preparing 50 original copies of
the certificate for AQSIQ. AQSIQ verbally agreed that trade would not be impacted during this transitional
period.
Marketing
Healthy, Nutritious, Safe and Convenient Products
In recent years, high-end aquatic product imports from overseas have become increasingly available in the China
market. Fishery products from the United States have a reputation for superior quality, natural growing
environment, sustainability, and traceability. Caught from coast to coast, a wide variety of U.S. seafood is
available for export in comparison to the more limited supplies available from third country suppliers.
With the increasing amount of Western style cuisine on offer in restaurants and hotels in China, imported fishery
products are in increasing demand. Lobster, clam, oyster, sea cucumber, snow crabs, and wild Alaskan salmon
are all popular products. Also with the ongoing evolution of Chinese cuisine, more local restaurants are using
imported seafood products to offer more choices for customers.
Stringent food safety procedures, advanced and controlled harvesting, processing, and cold chain logistics help
to ensure the near-fresh conditions of U.S. seafood exports. While China’s cold chain facilities and logistics are
still improving, they have a long way to go to meet evolving domestic requirements and international
standards. Shellfish, such as scallops and oysters from the United States often enjoy strong sales because of
consumer concerns that domestic shellfish may have heavy metal contamination. Sea cucumbers, live lobsters,
and Dungeness crabs reportedly enjoy strong demand in the HRI food service because of their nutritional content
and wild origins sector - despite relatively high prices.
Who are Buying?
Chinese consumers traditionally prefer low-cost, live seafood, and fresh aquatic products. In much of inland
China including the provinces of Inner Mongolia, Shaanxi, Shanxi, Henan, Xinjiang, and Tibet, fresh aquatic
products are scarce due to geographic isolation, underdeveloped cold chain and distribution systems,
transportation bottlenecks, and uneven weather conditions. In these more isolated regions, aquatic products in
frozen, dried, cured, and other processed forms are more popular because of their longer shelf life. Meat is the
preferred animal protein because of traditional dietary habits and consumption patterns.
HRI food service sector remains major end-user
In recent years, high-end seafood imports such as salmon, black sea bass, halibut, live lobsters, and fresh oysters
can be found in many mid-high end restaurants across China. The perceived superior texture and flavor of U.S.
seafood compared to local substitutes continues to win the favor of many high-end chefs and fine dining
establishment professionals.
The HRI food service sector mainly purchases high-end seafood and fishery products. Even in some coastal
cities like Qingdao, Yantai, Tianjin, Dalian, Shanghai, and Guangzhou where local fishery products are
abundant, imported products still receive strong customer support. Effective marketing and promotional
activities such as chef demonstrations, training, and seminars are effective tools for promoting U.S. fishery
products in the HRI food service sector. Most of these activities provide focused education for food service
professionals and emphasize the proper preparation, product handling, and application of various U.S. fishery
products.
Middle class consumers look for quality products and health benefits
Urban and middle class Chinese consumers have become increasingly aware of product origin and opt for
imported products because of its nutrition, safety, and variety. Health consciousness, nutrition, and brand
awareness also increasingly affect consumer perceptions and purchasing behavior. Some specific fishery
products have benefited from medical research linking seafood consumption to good health. This is particularly
true for deep sea fin fish, which often contain high levels of heart-healthy fatty acids such as Omega 3. Media
coverage and lifestyle media campaigns related to these findings continue to play an important role in driving
consumer demand for products such as fish oil in urban China. Market development activities focusing on these
themes are effective tools for educating Chinese consumers about the quality and availability of U.S. fishery
products.
Ready to cook, portion control is the trend
The rapidly changing and increasingly modern, fast-paced lifestyles of many Chinese consumers, especially
those under 35, means that these consumers often prefer to purchase value-added products in supermarket or
hypermarket formats. Portion controlled, ready-to-cook, breaded, battered, frozen filleted, frozen cooked, and
frozen raw seafood are increasingly well-positioned to meet changing consumer needs. These nutritious and
easy-to-prepare products continue to grow in popularity. However, while these seafood products are ready
made, it is advisable to provide clear preparation and cooking instructions. This is important because Chinese
consumers traditionally consume fresh or live fishery products and are often not familiar with value-added
product preparation. Marketing tools in the retail sector include in-store demonstration and promotion, product
sampling, recipe leaflets, and brochures.
Fishery products on the rise in QSR sector
Seafood has also entered the fast food sector. Compared with the traditional meat and poultry options, fish or
seafood items are becoming increasingly popular. KFC, as one of the top Quick Service Restaurant (QSR)
giants in China, has focused on developing healthy menu offerings since 2007 using deep-sea cod and Wild
Alaskan Salmon nuggets. Imported fishery products are also finding their way onto Chinese dining tables in
different presentations and iterations.
Competition
While demand for high-quality fishery products has expanded in China, competition has also intensified with a
growing number of international suppliers entering the market. In China, country of origin markings function
much like brands in other markets. For example, Norwegian salmon has 70 percent more brand recognition than
U.S. origin salmon. Products with established brand recognition and reputations for positive health benefits
often enjoy strong sales in the food service and retail sector. By contrast, seafood products with little or no
product origin recognition usually face a much steeper market development curve and forced to compete solely
on price.
Although the fishery industry has been hit by the economic crisis, especially for higher-priced items, Chinese
importers are confident that the market will bounce back in the near future.
Prices
While price is still one of the most significant factors influencing food purchasing decisions, it is no longer the
sole criteria for China’s increasingly health-conscious consumers and fine dining operators. With food safety
concerns in China and increased industrial pollution, some consumers are reluctant to purchase local fishery
products. While this is a challenge for seafood consumption in general, it also presents an opportunity for many
U.S. seafood products.
In addition to competition from third country suppliers, domestic competition is also on the rise. Local products
continue to gain market share due to improved quality, lower prices, and greater availability. Based on
discussions with local traders, seafood distributors, and suppliers complain that due to the higher prices for
imports, many retailers are hesitant to stock higher end seafood products in their stores because it usually
requires a larger investment. On the other hand, black market sales are also one of the main barriers. There are
processors who normally import raw materials for the purpose of processing, which is subject to much lower
import tax and VAT. After processing, a portion of the raw material is always lost and considered waste. In
some cases, however, processors sell the raw materials and report these raw materials lost. As a consequence,
prices for these fishery products are 3-4 times lower than the properly imported products. This unfair
competition continues to exist and hurt some legitimate importers. For more detailed information, please refer to
CH8005.
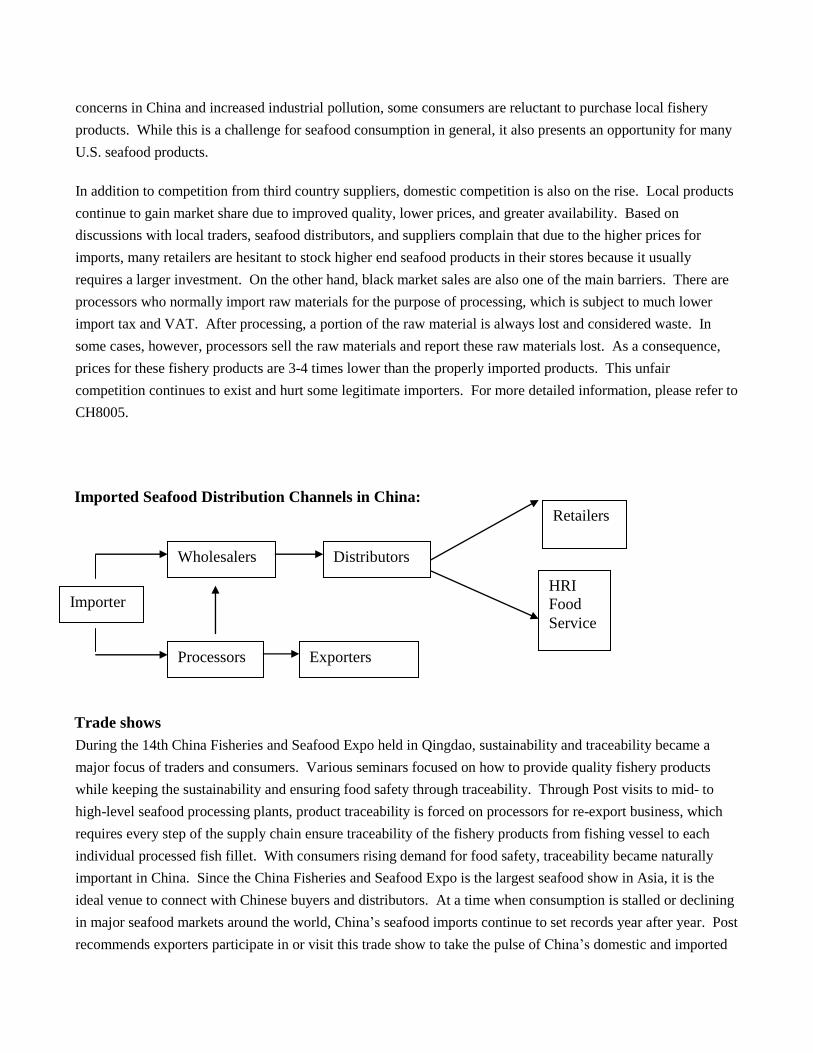
Imported Seafood Distribution Channels in China:
Trade shows
During the 14th China Fisheries and Seafood Expo held in Qingdao, sustainability and traceability became a
major focus of traders and consumers. Various seminars focused on how to provide quality fishery products
while keeping the sustainability and ensuring food safety through traceability. Through Post visits to mid- to
high-level seafood processing plants, product traceability is forced on processors for re-export business, which
requires every step of the supply chain ensure traceability of the fishery products from fishing vessel to each
individual processed fish fillet. With consumers rising demand for food safety, traceability became naturally
important in China. Since the China Fisheries and Seafood Expo is the largest seafood show in Asia, it is the
ideal venue to connect with Chinese buyers and distributors. At a time when consumption is stalled or declining
in major seafood markets around the world, China’s seafood imports continue to set records year after year. Post
recommends exporters participate in or visit this trade show to take the pulse of China’s domestic and imported
Importer
Processors Exporters
HRI
Food
Service
Wholesalers
Retailers
Distributors
seafood market potential.
Best practices
While superior quality, premium prices, traceability, and high levels of food safety are all characteristic of U.S.
seafood and fishery products, exporters need to be aware of the relevant trade policies for exporting and selling
in China. Investment in a long-term marketing strategy to differentiate products from domestic or other
international competitors is important in this market. Potential market entrants need to conduct extensive
desktop and preliminary research before determining if the market is appropriate for their products. Trademark
registration and IPR protection is also strongly recommended for all U.S. product exports. Participating in the
annual China Fisheries and Seafood Expo is a good way to test the water and establish initial face-to-face
contact with importers and distributors. In addition, finding a suitable partner with compatible goals is important
for long-term market development and sales success.
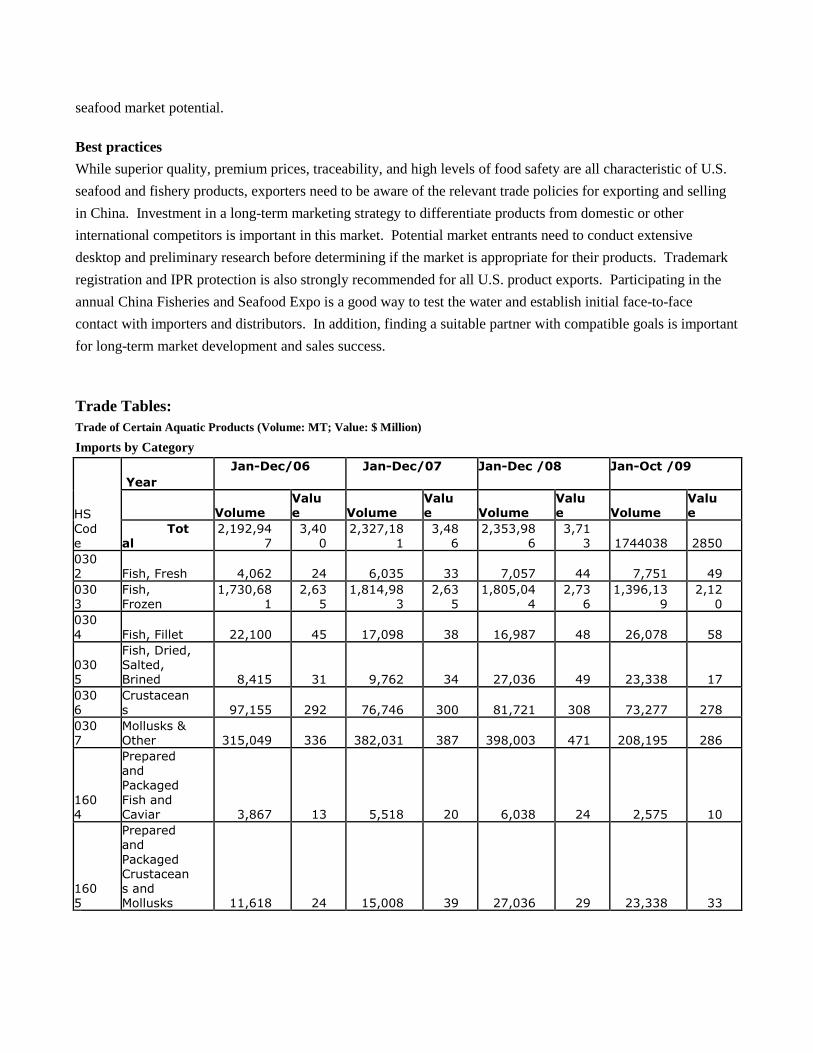
Trade Tables:
Trade of Certain Aquatic Products (Volume: MT; Value: $ Million)
Imports by Category
HS
Code
Year
Jan-Dec/06
Jan-Dec/07
Jan-Dec /08
Jan-Oct /09
Volume Value Volume
Value Volume
Value Volume
Value
Total
2,192,947
3,400
2,327,181
3,486
2,353,986
3,713 1744038 2850
0302 Fish, Fresh 4,062 24 6,035 33 7,057 44 7,751 49 0303
Fish, Frozen
1,730,681
2,635
1,814,983
2,635
1,805,044
2,736
1,396,139
2,120
030
4 Fish, Fillet 22,100 45 17,098 38 16,987 48 26,078 58
0305
Fish, Dried, Salted, Brined 8,415 31 9,762 34 27,036 49 23,338 17
0306
Crustaceans 97,155 292 76,746 300 81,721 308 73,277 278
0307
Mollusks & Other 315,049 336 382,031 387 398,003 471 208,195 286
1604
Prepared and
Packaged
Fish and Caviar 3,867 13 5,518 20 6,038 24 2,575 10
1605
Prepared and
Packaged Crustaceans and Mollusks 11,618 24 15,008 39 27,036 29 23,338 33
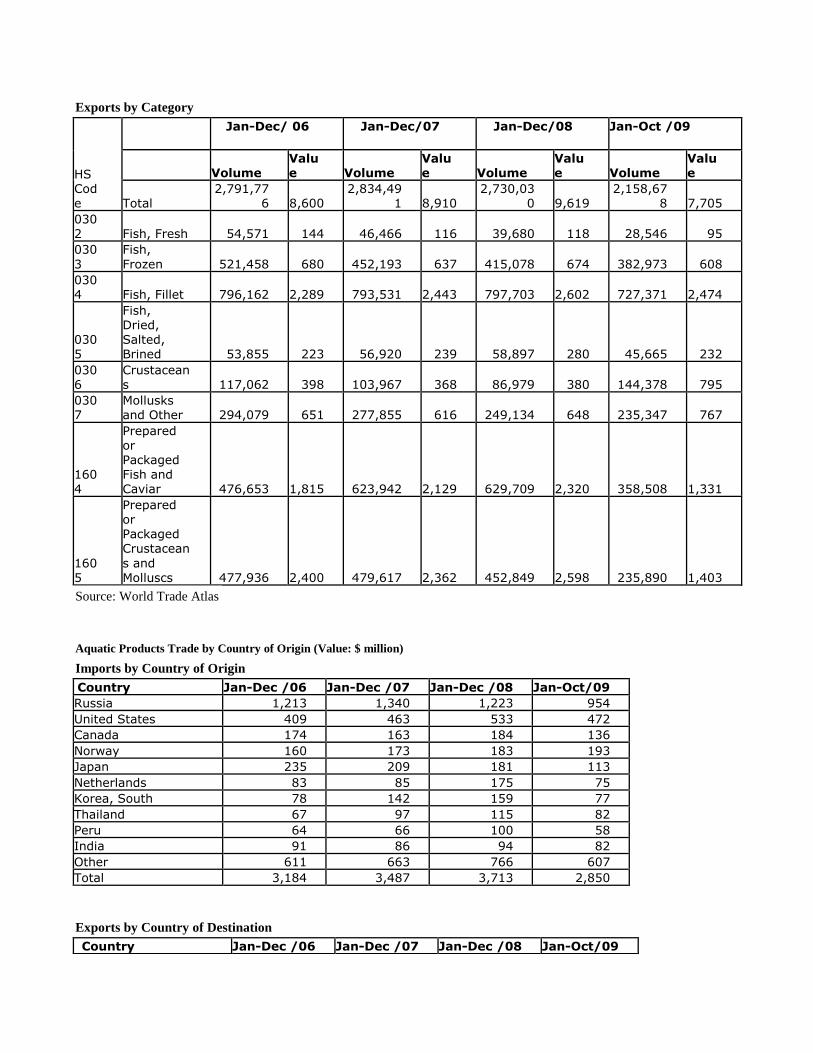
Exports by Category
HS Code
Jan-Dec/ 06
Jan-Dec/07
Jan-Dec/08
Jan-Oct /09
Volume Value Volume
Value Volume
Value Volume
Value
Total 2,791,77
6 8,600 2,834,49
1 8,910 2,730,03
0 9,619 2,158,67
8 7,705 0302 Fish, Fresh 54,571 144 46,466 116 39,680 118 28,546 95 030
3 Fish,
Frozen 521,458 680 452,193 637 415,078 674 382,973 608 0304 Fish, Fillet 796,162 2,289 793,531 2,443 797,703 2,602 727,371 2,474
0305
Fish, Dried,
Salted, Brined 53,855 223 56,920 239 58,897 280 45,665 232
0306
Crustaceans 117,062 398 103,967 368 86,979 380 144,378 795
0307
Mollusks and Other 294,079 651 277,855 616 249,134 648 235,347 767
1604
Prepared or Packaged Fish and Caviar 476,653 1,815 623,942 2,129 629,709 2,320 358,508 1,331
1605
Prepared or Packaged Crustacean
s and Molluscs 477,936 2,400 479,617 2,362 452,849 2,598 235,890 1,403
Source: World Trade Atlas
Aquatic Products Trade by Country of Origin (Value: $ million)
Imports by Country of Origin
Country Jan-Dec /06 Jan-Dec /07 Jan-Dec /08 Jan-Oct/09 Russia 1,213 1,340 1,223 954 United States 409 463 533 472 Canada 174 163 184 136 Norway 160 173 183 193 Japan 235 209 181 113 Netherlands 83 85 175 75 Korea, South 78 142 159 77 Thailand 67 97 115 82 Peru 64 66 100 58 India 91 86 94 82 Other 611 663 766 607 Total 3,184 3,487 3,713 2,850
Exports by Country of Destination
Country Jan-Dec /06 Jan-Dec /07 Jan-Dec /08 Jan-Oct/09

Japan 2,802 2,734 2,500 1,968 United States 1,738 1,729 1,996 1,569 Korea, South 993 973 917 652 Germany 360 384 497 380 Russia 176 300 362 235 Hong Kong 287 314 326 314 Malaysia 177 185 298 199 Thailand 39 48 118 76 Spain 239 241 230 201 Taiwan 93 137 173 244 United Kingdom 212 228 257 190 Mexico 189 173 180 120 Canada 186 211 239 215 Philippines 50 45 55 100 Netherlands 111 120 152 120 Other 949 1,088 1,322 1,122 Total 8,601 8,909 9,619 7,705
Source: World Trade Atlas
Imports of Fish, Frozen by Country of Origin (Volume: MT)
Country Jan-Dec/06 Jan-Dec /07 Jan-Oct /08 Jan-Oct /09 Russia 706,827 724,009 716,816 561,003 United States 190,633 222,906 211,631 210,897 Netherlands 108,016 112,170 121,138 55,204 Thailand 61,094 97,880 106,737 50,760 Japan 149,979 133,374 95,651 65,756 India 114,174 105,633 88,399 59,139 Norway 73,136 71,152 79,283 91,700 Korea, South 25,489 32,862 49,489 30,310 New Zealand 35,477 39,084 49,087 41,686 Canada 38,011 38,406 37,068 24,587 Other 227,845 237,507 249,746 205,098 Total 1,730,681 1,814,983 1,805,044 1,396,139
Imports of Flatfish by Country of Origin (Volume: MT)
Country Jan-Dec/06 Jan-Dec/07 Jan-Dec/08 Jan-oct/09 United States 73,669 83,332 104,640 82,154 Russia 43,129 37,304 20,641 11,873 Canada 7,940 8,238 8,428 6,108 Greenland 3,543 7,351 6,441 4,861 Pakistan 1,331 1,261 2,597 1,577 Korea, South 4,309 2,237 2,537 1,122 Norway 2,277 2,667 2,372 1,676 Spain 1,187 2,385 2,117 2,448 Denmark 4,033 3,896 2,092 385 India 689 1,218 1,990 2,865 Other 12,127 12,730 12,893 8,566 Total 154,234 162,618 166,749 123,634
Source: World Trade Atlas
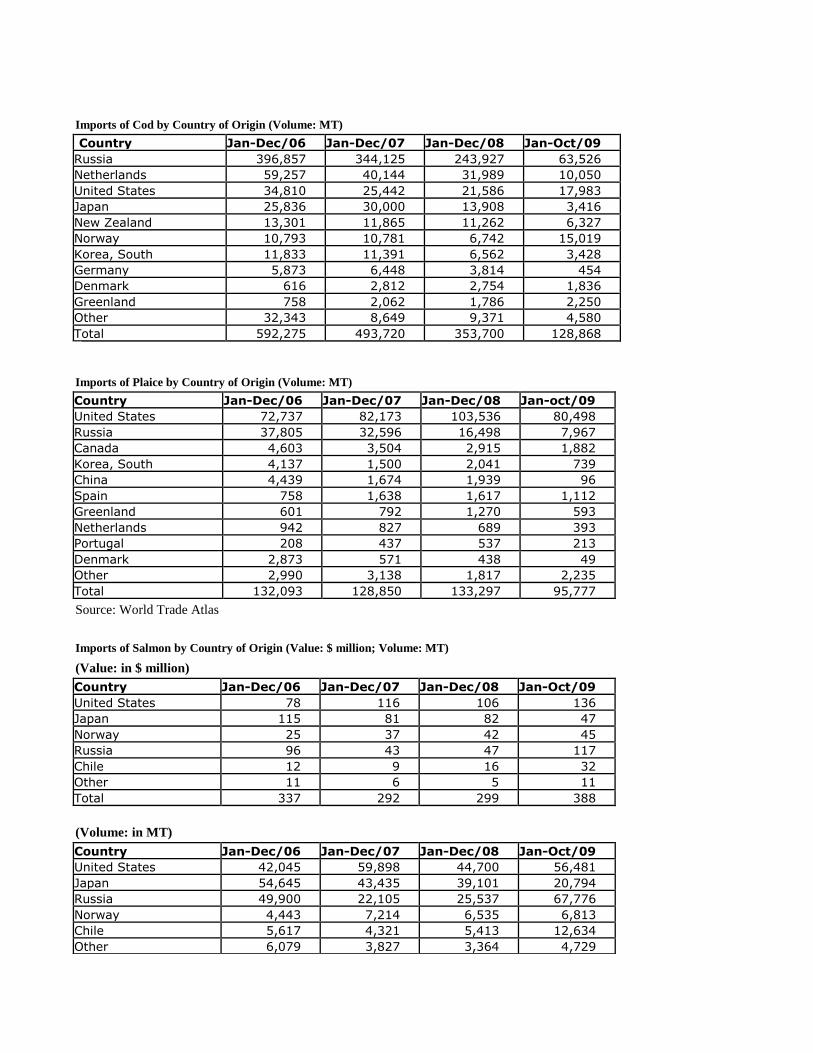
Imports of Cod by Country of Origin (Volume: MT)
Country Jan-Dec/06 Jan-Dec/07 Jan-Dec/08 Jan-Oct/09 Russia 396,857 344,125 243,927 63,526 Netherlands 59,257 40,144 31,989 10,050 United States 34,810 25,442 21,586 17,983 Japan 25,836 30,000 13,908 3,416 New Zealand 13,301 11,865 11,262 6,327 Norway 10,793 10,781 6,742 15,019 Korea, South 11,833 11,391 6,562 3,428 Germany 5,873 6,448 3,814 454 Denmark 616 2,812 2,754 1,836 Greenland 758 2,062 1,786 2,250 Other 32,343 8,649 9,371 4,580 Total 592,275 493,720 353,700 128,868
Imports of Plaice by Country of Origin (Volume: MT)
Country Jan-Dec/06 Jan-Dec/07 Jan-Dec/08 Jan-oct/09 United States 72,737 82,173 103,536 80,498 Russia 37,805 32,596 16,498 7,967 Canada 4,603 3,504 2,915 1,882 Korea, South 4,137 1,500 2,041 739 China 4,439 1,674 1,939 96 Spain 758 1,638 1,617 1,112 Greenland 601 792 1,270 593 Netherlands 942 827 689 393 Portugal 208 437 537 213 Denmark 2,873 571 438 49 Other 2,990 3,138 1,817 2,235 Total 132,093 128,850 133,297 95,777
Source: World Trade Atlas
Imports of Salmon by Country of Origin (Value: $ million; Volume: MT)
(Value: in $ million)
Country Jan-Dec/06 Jan-Dec/07 Jan-Dec/08 Jan-Oct/09 United States 78 116 106 136 Japan 115 81 82 47 Norway 25 37 42 45 Russia 96 43 47 117 Chile 12 9 16 32 Other 11 6 5 11 Total 337 292 299 388
(Volume: in MT)
Country Jan-Dec/06 Jan-Dec/07 Jan-Dec/08 Jan-Oct/09 United States 42,045 59,898 44,700 56,481 Japan 54,645 43,435 39,101 20,794 Russia 49,900 22,105 25,537 67,776 Norway 4,443 7,214 6,535 6,813 Chile 5,617 4,321 5,413 12,634 Other 6,079 3,827 3,364 4,729
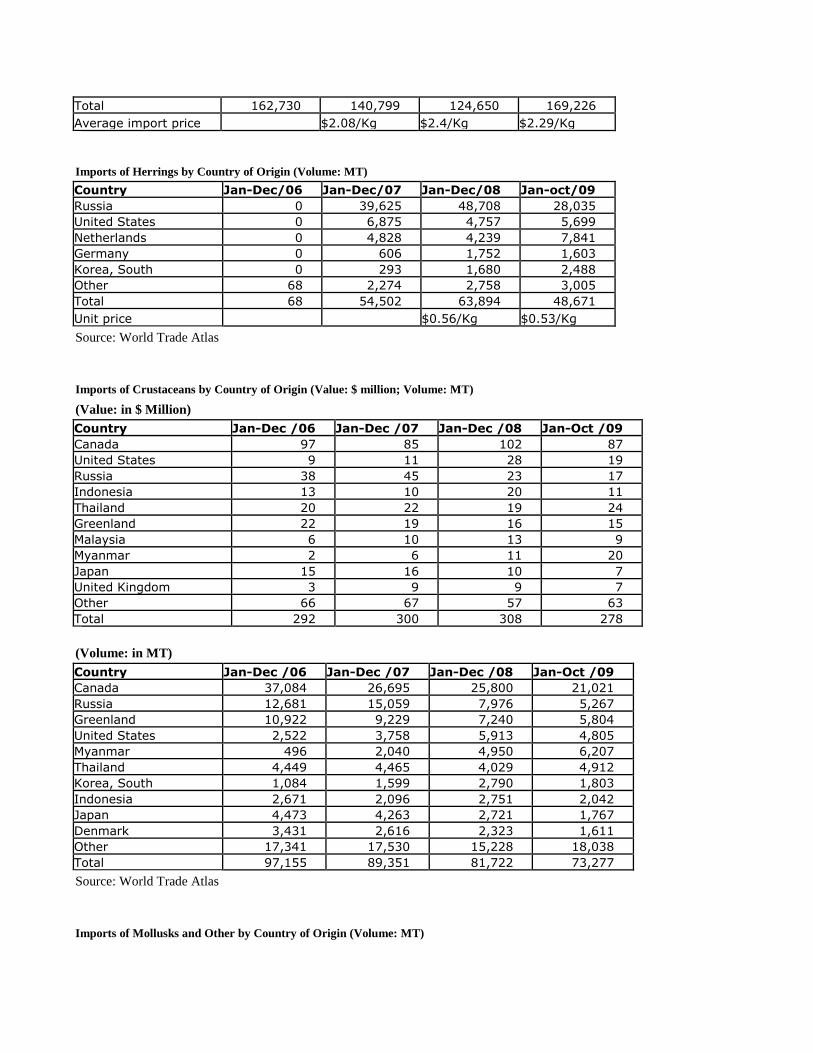
Total 162,730 140,799 124,650 169,226
Average import price $2.08/Kg $2.4/Kg $2.29/Kg
Imports of Herrings by Country of Origin (Volume: MT)
Country Jan-Dec/06 Jan-Dec/07 Jan-Dec/08 Jan-oct/09 Russia 0 39,625 48,708 28,035 United States 0 6,875 4,757 5,699 Netherlands 0 4,828 4,239 7,841 Germany 0 606 1,752 1,603 Korea, South 0 293 1,680 2,488 Other 68 2,274 2,758 3,005 Total 68 54,502 63,894 48,671
Unit price $0.56/Kg $0.53/Kg
Source: World Trade Atlas
Imports of Crustaceans by Country of Origin (Value: $ million; Volume: MT)
(Value: in $ Million)
Country Jan-Dec /06 Jan-Dec /07 Jan-Dec /08 Jan-Oct /09 Canada 97 85 102 87 United States 9 11 28 19 Russia 38 45 23 17 Indonesia 13 10 20 11 Thailand 20 22 19 24 Greenland 22 19 16 15 Malaysia 6 10 13 9 Myanmar 2 6 11 20 Japan 15 16 10 7 United Kingdom 3 9 9 7 Other 66 67 57 63 Total 292 300 308 278
(Volume: in MT)
Country Jan-Dec /06 Jan-Dec /07 Jan-Dec /08 Jan-Oct /09 Canada 37,084 26,695 25,800 21,021 Russia 12,681 15,059 7,976 5,267 Greenland 10,922 9,229 7,240 5,804 United States 2,522 3,758 5,913 4,805 Myanmar 496 2,040 4,950 6,207 Thailand 4,449 4,465 4,029 4,912 Korea, South 1,084 1,599 2,790 1,803 Indonesia 2,671 2,096 2,751 2,042 Japan 4,473 4,263 2,721 1,767 Denmark 3,431 2,616 2,323 1,611 Other 17,341 17,530 15,228 18,038 Total 97,155 89,351 81,722 73,277
Source: World Trade Atlas
Imports of Mollusks and Other by Country of Origin (Volume: MT)
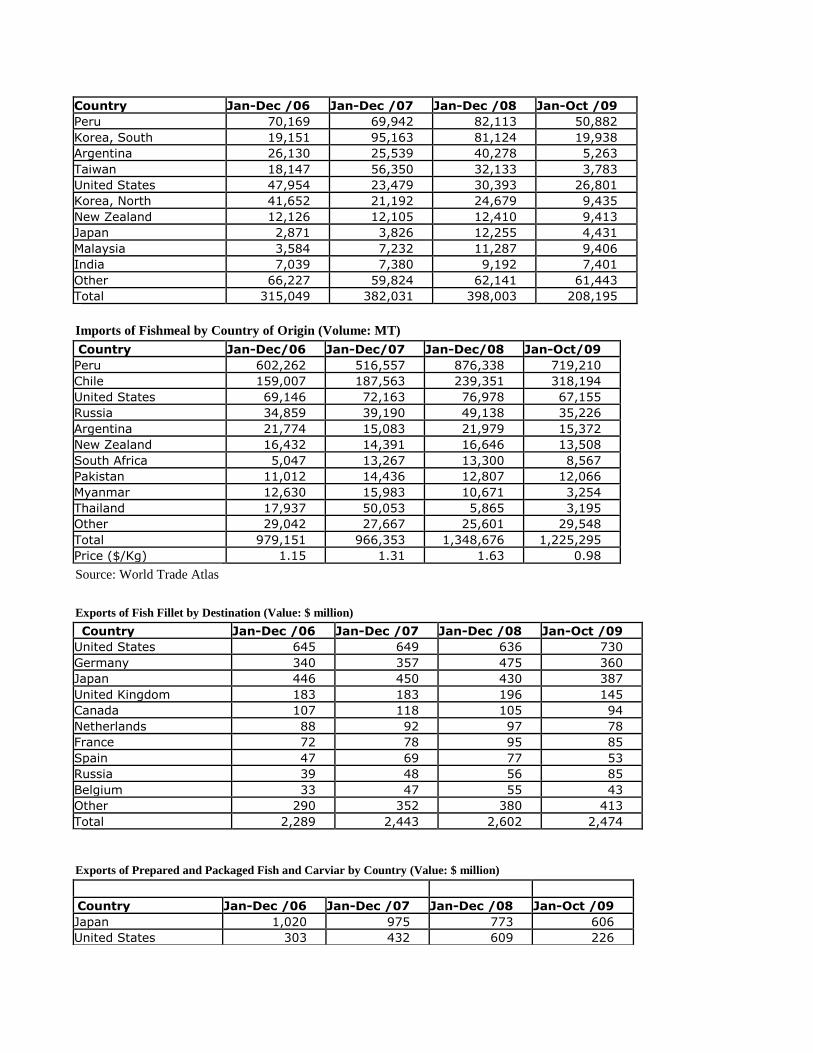
Country Jan-Dec /06 Jan-Dec /07 Jan-Dec /08 Jan-Oct /09 Peru 70,169 69,942 82,113 50,882 Korea, South 19,151 95,163 81,124 19,938 Argentina 26,130 25,539 40,278 5,263 Taiwan 18,147 56,350 32,133 3,783 United States 47,954 23,479 30,393 26,801 Korea, North 41,652 21,192 24,679 9,435 New Zealand 12,126 12,105 12,410 9,413 Japan 2,871 3,826 12,255 4,431 Malaysia 3,584 7,232 11,287 9,406 India 7,039 7,380 9,192 7,401 Other 66,227 59,824 62,141 61,443 Total 315,049 382,031 398,003 208,195
Imports of Fishmeal by Country of Origin (Volume: MT)
Country Jan-Dec/06 Jan-Dec/07 Jan-Dec/08 Jan-Oct/09 Peru 602,262 516,557 876,338 719,210 Chile 159,007 187,563 239,351 318,194 United States 69,146 72,163 76,978 67,155 Russia 34,859 39,190 49,138 35,226 Argentina 21,774 15,083 21,979 15,372 New Zealand 16,432 14,391 16,646 13,508 South Africa 5,047 13,267 13,300 8,567 Pakistan 11,012 14,436 12,807 12,066 Myanmar 12,630 15,983 10,671 3,254 Thailand 17,937 50,053 5,865 3,195 Other 29,042 27,667 25,601 29,548 Total 979,151 966,353 1,348,676 1,225,295 Price ($/Kg) 1.15 1.31 1.63 0.98
Source: World Trade Atlas
Exports of Fish Fillet by Destination (Value: $ million)
Country Jan-Dec /06 Jan-Dec /07 Jan-Dec /08 Jan-Oct /09 United States 645 649 636 730 Germany 340 357 475 360 Japan 446 450 430 387 United Kingdom 183 183 196 145 Canada 107 118 105 94 Netherlands 88 92 97 78 France 72 78 95 85 Spain 47 69 77 53 Russia 39 48 56 85 Belgium 33 47 55 43 Other 290 352 380 413 Total 2,289 2,443 2,602 2,474
Exports of Prepared and Packaged Fish and Carviar by Country (Value: $ million)
Country Jan-Dec /06 Jan-Dec /07 Jan-Dec /08 Jan-Oct /09 Japan 1,020 975 773 606 United States 303 432 609 226
Russia 69 162 188 78 Korea, South 80 93 126 70 Mexico 49 89 114 41 Hong Kong 60 81 70 54 Thailand 6 13 54 23 Ukraine 11 20 45 13 Malaysia 38 27 34 29 Taiwan 7 8 33 18 Other 172 229 273 173 Total 1,815 2,129 2,320 1,331
Source: World Trade Atlas
Exports of Prepared and Preserved Crustacean and Mollusks by Destination (Value: $ million)
Country Jan-Dec /06 Jan-Dec /07 Jan-Dec /08 Jan-Oct /09 Japan 765 779 750 442 United States 550 454 579 357 Malaysia 92 118 217 34 Korea, South 168 195 172 80 Hong Kong 100 125 134 54 Russia 56 78 102 38 Canada 39 59 92 58 Taiwan 22 53 71 46 Australia 59 71 61 38 Mexico 111 77 58 24 Other 437 354 361 232 Total 2,400 2,362 2,598 1,403
Exports of Shrimps and Prawns by Destination (Value: $ Million; Volume: MT)
(Value: in $ million)
Country Jan-Dec /06 Jan-Dec /07 Jan-Dec /08 Jan-Oct /09 United States 309 205 263 251 Japan 263 278 252 194 Malaysia 73 98 212 112 Spain 118 95 103 75 Hong Kong 102 111 77 71 Canada 24 41 75 65 Korea, South 94 99 70 61 Mexico 110 69 52 32 Australia 56 66 50 40 Russia 2 11 29 31 other 186 201 197 213 Total 1,338 1,275 1,381 1,145
(Volume: MT)
Country Jan-Dec /06 Jan-Dec /07 Jan-Dec /08 Jan-Oct /09 United States 56,044 36,225 40,928 37,197 Japan 41,142 49,190 37,339 28,491 Malaysia 11,880 16,428 30,156 14,704 Korea, South 39,142 38,846 26,240 20,793 Spain 28,339 25,063 25,448 19,678 Hong Kong 20,080 18,923 11,421 11,600
Canada 4,314 6,539 10,160 8,681 Mexico 17,247 11,553 9,865 4,748 Australia 10,441 11,292 7,863 5,743 Russia 264 2,388 6,024 6,669 Other 41,016 42,273 35,534 33,205 Total 269,908 258,721 240,978 191,508
Source: World Trade Atlas
Exports of Shrimps and Prawns by Category (Value: $ Million; Volume: MT)
(Value: in $ million)
Category Jan-Dec
/06 Jan-Dec
/07 Jan-Oct
/08 Jan-Oct
/09 Shrimps and Prawns 1,338 1,275 1,381 1,144 Shrimps And Prawns, Prepared Or
Preserved 1,115 1,072 1,133 570 Shrimps And Prawns, Including In Shell, Frozen 187 182 236 487 Not Frozen Shrimps And Prawns, Nes 32 18 10 50 Prawns, Fresh Or Chilled 4 3 1 36
(Volume: MT)
Category Jan-Dec
/06 Jan-Dec
/07 Jan-Oct
/08 Jan-
Oct/09 Shrimps and Prawns 269,872 258,711 240,941 191,433 Shrimps And Prawns, Prepared Or Preserved 200,643 197,105 182,854 100,363 Shrimps And Prawns, Including In Shell,
Frozen 41,986 49,638 52,120 71,990 Not Frozen Shrimps And Prawns, Nes 25,234 9,979 5,412 12,708 Prawns, Fresh Or Chilled 2,009 1,988 556 6,372
Source: World Trade Atlas
Exports of Crawfish by Destinations (Value: $ million)
Country Jan-Dec/06 Jan-Dec/07 Jan-Dec/08 Jan-Oct/09 United States 82 72 34 29 Denmark 31 15 30 21 Netherlands 1 2 25 20 Sweden 19 20 22 23 Belgium 48 41 20 17 United Kingdom 6 8 11 7 Japan 21 14 7 5 Singapore 0 0 3 27 Germany 3 4 3 2 Taiwan 2 1 3 2 Other 22 14 13 7 Total 234 191 170 160
Exports of Eel Products by Destinations (Value: $ million)
Country Jan-Dec/06 Jan-Dec/07 Jan-Oct/08 Jan-Oct/09
Japan 498 442 212 237 United States 27 29 41 27 Hong Kong 8 31 29 10 Russia 9 21 25 21 Taiwan 1 0 12 5 Korea, South 2 7 11 9 Singapore 2 6 7 6 Poland 1 8 6 4 Other 48 38 29 26 Total 596 583 373 346
Source: World Trade Atlas
Exports of All Tilapia Products by Destination (Volume: MT)
Country Jan-Dec /06 Jan-Dec /07 Jan-Dec /08 Jan-Oct /09 United States 83,251 122,091 118,538 103,904 Mexico 28,223 39,289 36,522 28,314 Russia 3,283 19,357 17,117 19,669 Nigeria 0 167 9,185 53 Cote d'lvoire 314 1,404 5,279 3,051 Israel 2,914 4,073 4,146 5,282 Poland 646 2,502 3,734 2,051 Netherlands 776 2,860 2,757 2,388 Belgium 1,094 1,753 2,282 1,263 Ukraine 129 1,091 1,752 697 Germany 1,365 1,996 1,708 1,611 Puerto Rico (U.S.) 953 1,270 1,697 845 Other 9,806 17,376 19,605 28,964 Total 132,755 215,229 224,321 198,094
Export Unite Price $2.95/Kg Total Value($ million) 277 491 734 545
Export of Selected Tilapia Products (fillet, dried, salted, preserved/prepared) by Destinations (Volume: MT)
Country Jan-Dec /06 Jan-Dec /07 Jan-Dec /08 Jan-Oct /09 United States 58,294 114,471 114,852 97,334 Mexico 18,675 37,283 35,760 26,539 Russia 2,513 19,142 17,048 19,574 Nigeria 0 117 7,814 0 Israel 2,375 3,843 4,136 5,229 Poland 622 2,502 3,734 2,051 Cote d'lvoire 0 1,219 3,013 1,110 Netherlands 535 2,447 2,303 1,722 Belgium 812 1,407 1,870 1,021 Ukraine 31 966 1,752 697 Germany 1,356 1,996 1,701 1,540 Puerto Rico (U.S.) 953 1,270 1,697 845 Other 4,689 14,504 15,909 18,389 Total 90,855 201,169 211,590 176,049
Export Unit Price $3.37/Kg $2.91/Kg Total Value ($ million) 232 475 714 513
Source: World Trade Atlas