China: Metals & Mining: Base Metals -...
34
May 14, 2013 China: Metals & Mining: Base Metals Equity Research Weak supply growth to improve zinc/lead outlook; resume on 2 cos Supply-demand for zinc/lead to be balanced over medium/long term We expect supply growth from zinc and lead mines to slow down over the medium-to-long term. We note that several zinc and lead miners have announced either closure of mines or cutting production during 2013-2015 due to resource depletion. Furthermore, supply from potential projects coming onstream and small mines in China will be limited before 2015. Our GS commodities research team estimates that global zinc mine production CAGR will slow to 2.4% over 2013E-2015E, and demand will increase to 4.3% on the back of urbanization in China and consumption upgrades, thereby restoring the supply-demand balance for zinc. We expect zinc/lead prices to rise in 2014-2015 as fundamentals improve. Our GS commodities research team’s 2013E/2014E/2015E price forecasts per ton for zinc are US$2,013 / US$2,175/US$2,200 and lead are US$2,163/US$2,338/US$2,365. Industry consolidation and environmental protection should help alleviate excess capacity in China’s zinc and lead industry, in our view. We note tougher environmental norms and emissions targets are likely to reduce zinc and lead refining capacity by 2 mn tons (government’s plan of 1.3mt lead and 0.65mt zinc) during the 12 th Five-Year Plan, which we believe will help support zinc and lead prices in China. Resume coverage on Lingnan and Chihong, both with Neutral Lingnan: We believe overseas expansion (Perilya/GlobeStar) and subsequent improvement in mining operations indicate strong execution skills. Further, the company is now back to normal operations, post the environmental accidents over 2010-2012. We resume coverage with Neutral as its valuation is not attractive, and our 12-month Director’s Cut-based TP of Rmb8.6. Chihong: Resource allocation is complete and earnings growth is now awaited. Rapid resource expansion generated a large increase in capex over the past 3 years, and we see its CROCI improving at a slow pace (2013/2014 CROCI of 9.3%/9.1% down from 10.5% in 2012). We resume coverage with Neutral and our 12-m Director’s Cut-based TP of Rmb10.41. Key risks Downside: Environmental accidents impacting operations; weak zinc/ lead prices; Upside: Potential government stimulus package boosting demand. RATINGS/TP SUMMARY Note: (1) Target prices are in Rmb. (2) Share prices as of May 10, 2013. (3) 12-m TPs are based on EV/GCI vs. CROCI/WACC (Director’s Cut). Source: Datastream, Gao Hua Securities Research estimates. KEY 2013E ZINC AND LEAD A-SHARE ESTIMATES Source: Gao Hua Securities Research estimates. RELATED RESEARCH Metal Detector: Zinc finding its floor, April 23, 2013 Global Commodities Research: GS Mining Commodity Forecasts for 2013, and Beyond, January 16, 2013 Global Commodities Research: The Old Economy Renaissance: 2013-2014 Issues and Outlook, December 5, 2012 Jefferson Zhang +86(21)2401-8945 [email protected] Beijing Gao Hua Securities Company Limited Goldman Sachs does and seeks to do business with companies covered in its research reports. As a result, investors should be aware that the firm may have a conflict of interest that could affect the objectivity of this report. Investors should consider this report as only a single factor in making their investment decision. For Reg AC certification and other important disclosures, see the Disclosure Appendix, or go to www.gs.com/research/hedge.html. Analysts employed by non- US affiliates are not registered/qualified as research analysts with FINRA in the U.S. Yong Han, CFA +86(21)2401-8948 [email protected] Beijing Gao Hua Securities Company Limited The Goldman Sachs Group, Inc. Global Investment Research Company Ticker Current POT UP/DOWN Jiangxi Copper (A) 600362.SS Buy 23.32 21.2 10.3% Zhongjin Gold 600489.SS Neutral 13.86 12.4 12.2% Zhongjin Lingnan 000060.SZ Neutral 8.60 9.0 -4.1% Zijin (A) 601899.SS Neutral 3.09 3.1 -0.9% Shandong Gold 600547.SS Neutral 30.96 32.1 -3.6% Tongling 000630.SZ Neutral 14.30 15.4 -7.0% Chihong 600497.SS Neutral 10.41 11.9 -12.5% Chalco (A) 601600.SS Sell 3.30 4.1 -19.3% Yunnan Copper 000878.SZ Sell 6.85 12.6 -45.5% Rating 12M TP Price Net profit growth Production growth PE PB ROE Lingnan 23% 16% 34.9 3.1 9.1% Chihong -8% 8% 48.9 4.0 8.2%
Transcript of China: Metals & Mining: Base Metals -...

May 14, 2013
China: Metals & Mining: Base Metals
Equity Research
Weak supply growth to improve zinc/lead outlook; resume on 2 cos
Supply-demand for zinc/lead to be balanced over medium/long term
We expect supply growth from zinc and lead mines to slow down over
the medium-to-long term. We note that several zinc and lead miners have
announced either closure of mines or cutting production during 2013-2015
due to resource depletion. Furthermore, supply from potential projects
coming onstream and small mines in China will be limited before 2015. Our
GS commodities research team estimates that global zinc mine production
CAGR will slow to 2.4% over 2013E-2015E, and demand will increase to 4.3%
on the back of urbanization in China and consumption upgrades, thereby
restoring the supply-demand balance for zinc.
We expect zinc/lead prices to rise in 2014-2015 as fundamentals improve.
Our GS commodities research team’s 2013E/2014E/2015E price forecasts per
ton for zinc are US$2,013 / US$2,175/US$2,200 and lead are
US$2,163/US$2,338/US$2,365.
Industry consolidation and environmental protection should help
alleviate excess capacity in China’s zinc and lead industry, in our view. We
note tougher environmental norms and emissions targets are likely to
reduce zinc and lead refining capacity by 2 mn tons (government’s plan of
1.3mt lead and 0.65mt zinc) during the 12th Five-Year Plan, which we
believe will help support zinc and lead prices in China.
Resume coverage on Lingnan and Chihong, both with Neutral
Lingnan: We believe overseas expansion (Perilya/GlobeStar) and subsequent
improvement in mining operations indicate strong execution skills. Further,
the company is now back to normal operations, post the environmental
accidents over 2010-2012. We resume coverage with Neutral as its valuation
is not attractive, and our 12-month Director’s Cut-based TP of Rmb8.6.
Chihong: Resource allocation is complete and earnings growth is now
awaited. Rapid resource expansion generated a large increase in capex
over the past 3 years, and we see its CROCI improving at a slow pace
(2013/2014 CROCI of 9.3%/9.1% down from 10.5% in 2012). We resume
coverage with Neutral and our 12-m Director’s Cut-based TP of Rmb10.41.
Key risks
Downside: Environmental accidents impacting operations; weak zinc/ lead
prices; Upside: Potential government stimulus package boosting demand.
RATINGS/TP SUMMARY
Note: (1) Target prices are in Rmb. (2) Share prices as of
May 10, 2013. (3) 12-m TPs are based on EV/GCI vs.
CROCI/WACC (Director’s Cut).
Source: Datastream, Gao Hua Securities Research
estimates.
KEY 2013E ZINC AND LEAD A-SHARE ESTIMATES
Source: Gao Hua Securities Research estimates.
RELATED RESEARCH
Metal Detector: Zinc finding its floor, April 23, 2013
Global Commodities Research: GS Mining Commodity
Forecasts for 2013, and Beyond, January 16, 2013
Global Commodities Research: The Old Economy Renaissance:
2013-2014 Issues and Outlook, December 5, 2012
Jefferson Zhang +86(21)2401-8945 [email protected] Beijing Gao Hua Securities Company Limited Goldman Sachs does and seeks to do business with
companies covered in its research reports. As a result, investors should be aware that the firm may have a conflict of interest that could affect the objectivity of this report. Investors should consider this report as only a single factor in making their investment decision. For Reg AC certification and other important disclosures, see the Disclosure Appendix, or go to www.gs.com/research/hedge.html. Analysts employed by non-US affiliates are not registered/qualified as research analysts with FINRA in the U.S.
Yong Han, CFA +86(21)2401-8948 [email protected] Beijing Gao Hua Securities Company Limited
The Goldman Sachs Group, Inc. Global Investment Research
Company TickerCurrent POT UP/DOWN
Jiangxi Copper (A) 600362.SS Buy 23.32 21.2 10.3%Zhongjin Gold 600489.SS Neutral 13.86 12.4 12.2%Zhongjin Lingnan 000060.SZ Neutral 8.60 9.0 -4.1%Zijin (A) 601899.SS Neutral 3.09 3.1 -0.9%Shandong Gold 600547.SS Neutral 30.96 32.1 -3.6%Tongling 000630.SZ Neutral 14.30 15.4 -7.0%Chihong 600497.SS Neutral 10.41 11.9 -12.5%Chalco (A) 601600.SS Sell 3.30 4.1 -19.3%Yunnan Copper 000878.SZ Sell 6.85 12.6 -45.5%
Rating 12M TP Price
Net profitgrowth
Productiongrowth
PE PB ROE
Lingnan 23% 16% 34.9 3.1 9.1%
Chihong -8% 8% 48.9 4.0 8.2%

May 14, 2013 China: Metals & Mining: Base Metals
Goldman Sachs Global Investment Research 2
Table of Contents
Slowdown in supply growth for zinc and lead, resume on 2 stocks 3
Zinc and lead supply-demand to be balanced over the next 3 years 4
China zinc/lead industry: Consolidation likely to cut excess capacity 8
Operations comparison for A-share zinc and lead firms 13
Using Director’s Cut to value zinc and lead firms 15
Chihong (600497.SS, Neutral): Resources acquired, awaiting profits 18
Zhongjin Lingnan (000060.SZ, Neutral): Back to normal operations 24
Disclosure Appendix 31
The prices in this report are as of the market close of May 10, 2013.
Exhibit 1: Valuation table for selected global non-ferrous metal companies under GS/GH coverage
*This stock is on our regional Conviction List Note: US stocks are assigned 6-month target prices
Source: DataStream, Goldman Sachs research estimates, Gao Hua Securities Research estimates.
GS/GH 10-May-13
Ticker Rating Price Ccy 12M TP 2013E 2014E 2013E 2014E 2013E 2014E 2013E 2014E 2013E 2014E
China-A share
Jiangxi Copper (A) 600362.SS Buy 21.15 CNY 23.32 1.46 1.36 14.5 15.6 1.6 1.5 9.4 9.6 11% 10%
Zhongjin Gold 600489.SS Neutral 12.35 CNY 13.86 0.55 0.46 22.4 27.0 3.1 2.8 9.4 10.4 15% 11%
Zhongjin Lingnan 000060.SZ Neutral 8.97 CNY 8.60 0.26 0.28 34.9 31.6 3.1 2.8 11.7 10.9 9% 9%
Zijin Mining (A) 601899.SS Neutral 3.12 CNY 3.09 0.24 0.19 13.3 16.1 2.2 2.0 7.5 8.4 17% 13%
Shandong Gold 600547.SS Neutral 32.13 CNY 30.96 1.36 1.18 23.6 27.3 4.9 4.2 12.2 13.2 23% 17%
Tongling Non-ferrous 000630.SZ Neutral 15.38 CNY 14.30 0.77 0.82 20.0 18.8 1.9 1.7 12.7 11.4 10% 10%
Chihong Zinc & Germanium 600497.SS Neutral 11.89 CNY 10.41 0.24 0.32 48.9 37.7 4.0 3.7 14.9 13.5 8% 10%
Chalco (A) 601600.SS Sell 4.09 CNY 3.30 (0.16) (0.12) 1.3 1.3 17.8 20.6 -5% -4%
Yunnan Copper 000878.SZ Sell 12.58 CNY 6.85 0.04 0.04 2.6 2.5 17.5 18.1 1% 1%
Median-A share metals companies 22.4 27.0 2.6 2.4 12.0 11.2 11% 10%
HK-H share
Jiangxi Copper (H) 0358.HK Buy 16.42 HKD 18.30 1.46 1.36 8.9 9.6 1.0 0.9 5.8 5.9 11% 10%
Zijin Mining (H) 2899.HK Buy 2.33 HKD 2.70 0.24 0.19 7.8 9.5 1.3 1.2 5.0 5.6 17% 13%
China Molybdenum 3993.HK Neutral 3.17 HKD 3.91 0.23 0.22 10.7 11.5 1.0 0.9 5.8 5.2 9% 8%
Zhaojin Mining (H) 1818.HK Sell 8.50 HKD 7.00 0.57 0.45 11.7 14.9 2.1 1.9 8.2 9.5 19% 13%
Chalco (H) 2600.HK Sell 3.24 HKD 2.40 (0.16) (0.12) 0.8 0.8 15.3 17.7 -5% -4%
Median-H share metals companies 9.8 10.6 1.0 0.9 5.8 5.9 11% 10%
US
Vale VALE Buy 16.96 USD 25.60 2.09 2.32 8.1 7.3 1.2 1.1 4.6 4.4 15% 15%
Freeport-McMoRan Copper & GoFCX Buy 32.55 USD 38.00 3.35 3.00 9.7 10.8 1.5 1.4 4.4 4.7 17% 13%
Alcoa AA Neutral 8.70 USD 8.00 0.42 0.65 20.8 13.4 0.7 0.6 7.1 6.3 4% 5%
Southern Copper Corp. SCCO Neutral 33.31 USD 42.00 2.61 2.22 12.7 15.0 4.6 3.9 8.0 8.6 41% 28%
Median-US metals companies 11.2 12.1 1.4 1.2 5.9 5.5 16% 14%
Australia
OceanaGold OGC.AX Buy* 2.07 AUD 2.60 0.16 0.21 13.0 9.8 0.9 0.8 3.9 3.4 7% 9%
Lynas LYC.AX Buy 0.66 AUD 0.81 (0.06) 0.04 15.0 1.9 1.8 9.5 -20% 12%
Teranga Gold TGZ.AX Sell 0.93 AUD 0.50 0.10 (0.03) 9.4 0.6 0.6 3.7 7.6 6% -2%
Alumina AWC.AX Sell 1.09 AUD 0.90 (0.01) 0.00 0.9 0.9 15.4 13.6 -1% 0%
Alacer Gold AQG.AX Sell 2.93 AUD 2.33 0.15 0.10 20.0 30.2 0.8 0.8 2.8 3.2 4% 3%
Iluka Resources ILU.AX Neutral 10.80 AUD 8.85 0.34 1.23 32.1 8.8 2.7 2.4 11.7 4.4 5% 29%
Median-Australian metals companies 20.0 15.0 0.9 0.9 7.7 7.6 4% 3%
EPS PE (X) P/B (X) EV/EBITDA (X) ROE

May 14, 2013 China: Metals & Mining: Base Metals
Goldman Sachs Global Investment Research 3
Slowdown in supply growth for zinc and lead, resume on 2 stocks
Supply growth from zinc and lead mines likely to slow over the medium-to-long term. The Dairi (Indonesia) and Mount Isa (Australia) zinc and lead mines under construction are
scheduled to come onstream during 2013-2015. However, key mines such as Century and
Brunswick are likely to close down or cut production due to resource depletion. We believe
this would severely limit potential capacity release at zinc and lead facilities before 2015. Our
GS commodities research team estimates that during 2013E-2015E, global zinc mine
production will see a CAGR slowdown to 2.4%, a notch below 4% CAGR over the past decade.
In terms of demand, we expect Chinese urbanization and consumption upgrades to drive
continued growth in the real estate and automobile industries over the medium term. At the
same time, the US real estate and car markets are experiencing a revival. Our GS commodity
research team believes global demand for refined zinc will increase 4.3% CAGR over 2013E-
2015E, outpacing supply growth and restoring the supply-demand balance.
Industry consolidation and stricter environmental norms should help alleviate excess
capacity in China’s zinc and lead industry. Small mines currently account for 90% or
more of China’s zinc and lead industry. The Chinese government has strengthened its push
for M&A among metal mines in recent years to further increase industry consolidation.
Restrictions on refining capacity have also intensified, including tougher environmental
norms and emissions targets that will reduce lead refining capacity (including recycled
lead) by 1.3 mn tons and zinc refining capacity by 650k tons (government’s plan) during the
12th Five-Year Plan (2011-2015). We believe excess capacity in China’s zinc and lead
industry will be alleviated somewhat, reducing headwinds on zinc and lead prices.
We expect zinc and lead prices to rise in 2014E-2015E. Even though we believe high zinc and
lead inventories will depress prices in the short term, as peak consumption season destocking
concludes, supply and demand will become balanced, and zinc and lead prices will rise further
in 2014E-2015E. Our GS commodity research team’s 2013E/2014E/2015E price forecasts per ton
for zinc are US$2,013 / US$2,175/US$2,200 and lead are US$2,163/US$2,338/ US$2,365.
In this report, we resume coverage on two A-share zinc and lead companies.
Chihong’s net profit has higher sensitivity to zinc and lead prices, and we believe
greater organic growth over the next three years will result in the company
benefitting further from rising zinc and lead prices. Zhongjin Lingnan has a stable
asset and liability structure, and more effective overseas assets.
Zhongjin Lingnan: Overseas expansion and mining operations reflect the firm’s
strong execution skills. Lingnan successfully acquired Perliya and GlobeStar overseas in
2009 and 2010 and subsequently their earnings improved significantly, reflecting Lingnan’s
strong execution skills, in our view. Over the past two years, however, it has been affected
by environmental incidents, such as the Shaoguan and Renhua accidents, from which it
has recently recovered to normal production. We resume coverage of Zhongjin Lingnan
with a Neutral rating and a 12-month Director’s Cut–based target price of Rmb8.6.
Chihong: Resource layout complete, awaiting earnings updates. Resource allocation is
complete and earnings growth is awaited. Rapid resource expansion generated a large
increase in capex over past 3 years, and we see its CROCI improving at a slow pace
(2013/2014 CROCI of 9.3%/9.1% down from 10.5% in 2012). Our 12-month Director’s Cut–
based target price is Rmb10.41, and resume coverage with a Neutral rating.
Exhibit 2: Comparison of our earnings estimates and market consensus for A share zinc and lead coverage universe
Source: Wind, Gao Hua Securities Research estimates
Companies 2013E 2014E 2013E 2014E 2013E 2014E 2013E 2014E 2013E 2014E Current TPRmb Rmb
Chihong 318 413 365 414 0.24 0.32 0.28 0.32 -13% 0% 11.9 10.41 -12.5%Lingnan 530 586 536 681 0.26 0.28 0.26 0.33 -1% -14% 9.0 8.60 -4.1%
GH estimated earning GH estimated EPSConsensus Consensus Diff. from Cons. Potential Upside/ Downside
Potentialup/ downsideMn Rmb Mn Rmb Rmb Rmb %

May 14, 2013 China: Metals & Mining: Base Metals
Goldman Sachs Global Investment Research 4
Zinc and lead supply-demand to be balanced over the next 3 years
Supply: Resource exhaustion and industry consolidation will slow zinc and lead supply growth over the medium-to-long term
We divide sources of global zinc and lead supply into three types: mines in production or
under construction, potential zinc and lead projects, and growth from China. Based on this
analytic framework, we estimate 2013-2015 zinc and lead supply growth of 1.1%/2.6%/3.6%,
with a 2.4% CAGR, slower than the 4% rate over the past 10 years.
Zinc and lead mines under construction coming onstream unable to replace lost capacity
from closing mines. We estimate that mine closings and lost capacity from resource
exhaustion in 2013/2014/2015 will lower zinc concentrate supply by approximately
361k/494k/397k t. The major source of decline in 2013 will be Xstrata as the firm will close its
Brunswick and Perseverance mines due to declining ore quality and resource exhaustion, and
lower production at its Antamina mine, lowering global zinc production by 361k t. The
estimated loss in 2014 is from reduced production at Minmetals’ Century zinc and lead mine,
and the closing of Vedanta’s Lisheen mine, decreasing zinc mine production by 494k t. In
addition, while zinc and lead mines under construction—like Dairi and Mount Isa—will come
onstream over 2013-2015, we estimate that they will only increase zinc mine production in
those years by 510k/236k/132k t, not enough to offset the declines caused by mine closings.
Exhibit 3: Zinc mines in production which will close/decrease production in 2013-2015, and
their effects on zinc concentrate supply Units: 1,000 t
Source: Wood Mackenzie, Goldman Sachs Global ECS Research estimates
Exhibit 4: Key zinc mines under construction set to come online/expand production, 2013-
2015 Units: 1,000 t
Source: Wood Mackenzie, Goldman Sachs Global ECS Research estimates
Capacity Capacity ChangeCompany Zinc mines 2012E 2013E 2014E 2015E 2015E 2015E-2012EMinmetals Century 510 0 -221 -289 0 -510Xstrata Brunswick 203 -183 -20 0 0 -203Vedanta Lisheen 168 0 -168 0 0 -168Xstrata Perseverance 136 -106 -30 0 0 -136Agnico Eagle La Ronde 50 -35 -9 0 6 -44Kazzinc Zyryanovsk 113 12 -16 -63 46 -67Minmetals Golden Grove 68 -13 -30 3 28 -40Kagara Mt Garnet 44 4 0 -48 0 -44Teck Red Dog 540 -10 0 0 530 -10Xstrata Antamina 250 -30 0 0 220 -30
Total 2,082 -361 -494 -397 830 -1,252
Capacity changes in 2013-2015
Capacity Capacity ChangeCompany Zinc mines 2012E 2013E 2014E 2015E 2015E 2015E-2012EXstrata Mount Isa Pb/Zn 375 25 75 35 510 135Herald Diari 0 110 12 0 122 122Various China 4,179 88 35 -49 4,252 73Glencore Perkoa 35 45 10 0 90 55Zijin Kyzyl Tashtygskoe 50 30 10 0 90 40Penoles Velardena 0 40 35 10 85 85Xstrata Bracemac McLeod 0 60 22 0 82 82HudBay Lalor Lake 8 12 20 40 80 72Compania Cerro Lindo 115 35 0 0 150 35Xstrata McArthur River 200 15 4 4 223 23Minmetals Bisha 0 30 60 90 90Hindustan Rampura-Agucha 750 30 -30 10 760 10Tajikistan Altintopkan 10 20 13 22 65 55
Total 5,722 510 236 132 6,599 877
Capacity changes in 2013-2015

May 14, 2013 China: Metals & Mining: Base Metals
Goldman Sachs Global Investment Research 5
Potential zinc mine capacity release will be relatively slow. We believe another key
factor in determining zinc concentrate supply growth is potential capacity release of zinc
and lead mines. Potential zinc and lead mines have verified resources, but have not yet
begun construction. These projects can be divided based on the amount of progress made,
i.e., projects which are still at the feasibility study stage, projects which have been closed
but may resume production, projects in the financing stage, and projects which have
received construction approval. Our GS commodities research team estimates global
potential zinc mine production of 1.9mt by 2015E. However, based on the current progress
in potential mines, we believe they will come on line relatively slowly.
Exhibit 5: Contribution to ‘probable’ supply, 2011-2015,
by project type/stage Tonnage is in Kt
Exhibit 6: Key potential zinc and lead mines, and
estimated progress Units: 1,000 t
Source: Wood Mackenzie, Goldman Sachs Global ECS Research estimates
Source: ILZSG, Gao Hua Securities Research.
Integration of China’s zinc and lead industry could ease production growth concerns. The integration of China’s zinc and lead industry mainly involves consolidation of small-
scale mines and limiting zinc and lead smelting. We estimate that the Chinese government
will continue to attempt to rectify the zinc and lead industry’s “small-scale and
fragmented” nature and increase industry consolidation. Furthermore, we note that
environmental requirements will limit zinc and lead smelter capacity—energy-saving and
emissions targets will lead to decrease in lead smelting capacity of 1.3 mt by the end of
2015E (including recycled lead capacity), and a decrease in zinc smelting capacity of 650k t;
recycled lead production will increase to 40% (all these targets are set by the government)
of total production. Our base case assumes refined zinc production growth of 6% in 2013E
and 7% in 2014E.
In addition, we believe global refined lead supply growth will slow. With zinc and lead
being generally found in the same mines, most zinc mine closures will equally affect lead
concentrate production, and we estimate that refined lead production growth will slow in
2013-2015. Our GS commodities research team estimates refined lead production growth
at 7% for 2013E, slightly below the average 8.3% growth in 2010-2012.
Demand: Global industrial recovery will spur zinc and lead demand growth
The Goldman Sachs ECS Research team estimates that global GDP will increase to 3.2% in
2013E, from 3.0% in 2012. They estimate 2013E GDP growth in emerging markets (e.g.,
China, India, Brazil, Russia) at 5.8%, up from 2012’s 5.4% (Exhibit 7). The momentum of the
Goldman Sachs Global Leading Indicator has turned positive since August 2012, and
remained so for the past several months, indicating that global manufacturing activity will
continue to recover.
Type/ StageNo. Probable
MinesTotal
tonnage%probable
growthFeasibility 18 1285 68%Potential Restart 12 337 18%Financing/ Refin. 6 207 11%Permitting 2 50 3%Total 39 1878 100%
Zinc mines Country CapacityEstimate year to
come onlineDugald River Australia 200 2015Selwyn Canada 100 2015/16Ozernoye Russia 350 2015/16Gamsberg South Africa 200 2015/16Oued-Amizour (Tala Hamza) Algeria 164 2017/18Mehdiabad Iran 400 2018/19
Total 1414

May 14, 2013 China: Metals & Mining: Base Metals
Goldman Sachs Global Investment Research 6
Exhibit 7: Our ECS Research team estimates global GDP
recovery in 2013/2014…
Exhibit 8: …and the Goldman Sachs GLI indicates
recovery in global manufacturing
Source: Goldman Sachs Global ECS Research estimates. Source: Bloomberg, Goldman Sachs Global ECS Research estimates.
Zinc: Urbanization in China and upgraded consumption are key drivers of demand
Zinc has good anti-corrosion, thermal conductivity and electrical conductivity properties. Its
main uses in primary consumption are in galvanization and zinc alloys, applications which
account for over 50% of total zinc use. Key downstream industries include property, home
appliances and automotives. On a country level, zinc consumption in China currently
accounts for over 40% of the world total (Exhibit 10), making it one of the world’s major
zinc consumers. Our China real estate team expects total GFA sold to rise 20% yoy in 2013E,
which we believe will drive recovery in industries like home appliances, spurring higher
zinc demand. Urbanization and upgraded consumption are also likely to increase
automotive consumption. Furthermore, moderate recovery in demand in regions outside of
China (the property and automotive industries in the US, other developing economies) will
support global zinc consumption in 2013 and 2014, in our view (Exhibits 11 and 12). Our GS
commodities research team estimates global zinc consumption growth of 3.9% in 2013E
and 4.4% in 2014E.
Exhibit 9: Structure of global primary zinc consumption Galvanization and zinc alloys make up over 50% of zinc
consumption, as of 2011
Exhibit 10: Global zinc consumption by country China consumes over 40% of the world’s zinc, as of 2011
Source: ILZSG, Gao Hua Securities Research
Source: ILZSG, Gao Hua Securities Research
Q1 Q2 Q3 Q4USA 2.1 2.9 2.4 2.7 3.1 3.4Japan 1.4 1.7 3.9 1.7 0.8 0.2Euro area -0.7 0.8 0.3 0.7 0.9 1.1 France -0.7 0.4 -0.2 0.3 0.6 0.8 Germany 0.4 1.8 1.4 1.8 2 2.1 Italy -1.5 0.4 -0.1 0.3 0.6 0.9UK 1.3 2 2 2.1 2 2.1China 7.8 8.4 8.3 8.4 8.4 8.5India 5.8 7.2 7.1 7.1 7.3 7.4Brazil 3.3 4.4 4.6 4.6 4.3 4Russia 3.1 4.3 3.4 4.7 4.5 4.5Advanced Economies 1.2 2.2 2.1 2.1 2.2 2.2Emerging Markets 5.8 6.5 6.5 6.6 6.5 6.6World 3.2 4.1 4 4.1 4.1 4.2
2014Real GDP, % change2014
2013
(2.5)
(2.0)
(1.5)
(1.0)
(0.5)
0.0
0.5
1.0
1.5
2.0
25
30
35
40
45
50
55
60
65
70
10/08 04/09 10/09 04/10 10/10 04/11 10/11 04/12 10/12 04/13
US PMI China PMI
Europe PMI GS GLI Momentum (Rhs)
50%
17%
17%
6%
6%4%
Zincification
Zinc alloy
Brass
Zinc products
Chemical
Others
40.6%
8.1%16.1%
4.8%
4.0%
26.5%China
USA
Western Europe
India
Japan
Others

May 14, 2013 China: Metals & Mining: Base Metals
Goldman Sachs Global Investment Research 7
Exhibit 11: US property consumption has improved
significantly since 2012 Units: 1,000 units; %
Exhibit 12: US automotive consumption growth
continues Units: mn cars; %
Source: Wind, Gao Hua Securities Research.
Source: Wind, Gao Hua Securities Research.
Lead: Lead-acid batteries to remain the most stable form of energy storage in 2013-15
Over 70% of lead demand comes from lead-acid batteries, which are mainly used in electric
scooters and cars. We estimate China will remain the largest consumer of lead-acid
batteries in 2013-2015, and continue to consume over 40% of the world’s lead. However,
the continued increase in American car ownership should compensate for weaker demand
for lead-acid batteries as a result of slowing production growth, thereby supporting lead
demand. Our GS commodities research team estimates global lead consumption growth of
8% in 2013E.
Exhibit 13: Over 70% of lead is used in lead-acid batteries as of 2011
Exhibit 14: China consumes over 40% of the world’s lead as of 2011
Source: ILZSG, Gao Hua Securities Research.
Source: ILZSG, Gao Hua Securities Research.
Zinc and lead supply and demand will balance out in the medium-to-long term
Over the next six months, smelters including South Korea’s Onsan and Peru’s La Oroya will
resume production, and the current high levels of world zinc and lead inventories will exert
pressure on prices. However, as destocking concludes, and zinc and lead mines halt/reduce
production, supply and demand will come into balance, in our view. We estimate zinc and
lead prices will rise further in 2013E-2015E. Our 2013E/2014E/2015E price forecasts per ton
for zinc are US$2,013 / US$2,175/US$2,200 and lead are US$2,163/US$2,338/US$2,365, in
line with our ECS Research team.
‐50.0%
‐40.0%
‐30.0%
‐20.0%
‐10.0%
0.0%
10.0%
20.0%
30.0%
40.0%
50.0%
0
10
20
30
40
50
60
03/09 09/09 03/10 09/10 03/11 09/11 03/12 09/12 03/13
US new house sales (Lhs) yoy
‐50%
‐40%
‐30%
‐20%
‐10%
0%
10%
20%
30%
0.0
1.0
2.0
3.0
4.0
5.0
6.0
7.0
8.0
9.0
10.0
03/09 09/09 03/10 09/10 03/11 09/11 03/12 09/12 03/13
US auto sales (Lhs) yoy
77%
3%
6%
2%3% 8%
3%
Batteries
Cable Sheathing
Rolled & Extruded
Shot/Ammunition
Alloys
Pigments & Compounds
Miscellaneous
44.50%
1.30%3.90%
15.40%
15.70%
19.20%China
Japan
Korea Rep
USA
Europe
Others

May 14, 2013 China: Metals & Mining: Base Metals
Goldman Sachs Global Investment Research 8
Exhibit 15: Global zinc supply and demand model
Source: Wood Mackenzie, CRU, Goldman Sachs ECS Research estimates.
Exhibit 16: Global lead supply and demand model
Source: Wood Mackenzie, CRU, Goldman Sachs ECS Research estimates.
For more detailed analysis on global zinc and lead supply and demand, please see our
commodities research team’s January 16, 2013, report titled Global Commodities Research:
GS Mining Commodity Forecasts for 2013, and Beyond, and April 23, 2013, report Metal
Detector: Zinc finding its floor.
China zinc/lead industry: Consolidation likely to cut excess capacity
Zinc and lead supply in China: A two-pronged approach by mines and refineries
should hold back blind expansion
The General Office of the State Council released “Comments on Properly Consolidating
Metal and non-Metal Mines in Accordance with the Law” from the State Administration of
Work Safety on November 4, 2012. The document proposes the government to control
unlicensed mining and other illegal activities. Small mines that do not conform to industry
policy and unable to ensure safety will be either consolidated or closed in accordance with
the law. The restructuring of small mines will help alleviate fragmentation and
uncoordinated behavior because 90% or more of China’s zinc and lead mines are small-
scale operations, in our view.
Further, we think the recent fallback in zinc prices could limit zinc ore supply growth in
China. In our 4-year global supply growth model, which pre-dates the recent market
weakness, more than 70% of supply growth came from China. As the majority of small
Chinese zinc and lead mines have costs at the upper range of the global zinc and lead cost
curve, we think the recent downturn in zinc prices will limit Chinese supply growth.
000 tonnes 2009 2010 2011 2012 2013E 2014E 2015E
Global mine supply 11,021 11,817 12,194 13,013 13,159 13,495 13,977% change -4.0 7.2 3.2 6.7 1.1 2.6 3.6
Including disruption allow. (%) -- -- -- 0% 3% 4% 4%Global refined supply 11,174 12,288 12,920 13,020 13,300 13,750 14,300
% change -3.2 10.0 5.1 0.8 2.2 3.4 4.0
Global refined consumption 10,136 11,754 12,517 12,672 13,119 13,699 14,316 % change (9.5) 16.0 6.5 0.9 3.9 4.4 4.5
Balance 1,038 534 403 393 181 51 (16) Year end inventory (weeks) 4.8 6.2 6.7 8.3 8.7 8.5 8.1 LME Price ($/ t) 1,655 2,162 2,194 1,950 2,013 2,175 2,200 LME Price (c/lb) 75 98 100 88 91 99 100
000 tonnes 2009 2010 2011 2012 2013E
Refined supply 9,042 9,916 10,600 11,496 12,353% growth -2% 10% 7% 8% 7%Refined consumption 8,872 10,032 10,547 11,373 12,230 % growth (3.0) 13.0 5.0 8.0 8.0 Global balance 170 (116) 52 123 122 LME Price (US$/ t) 1,719 2,149 2,402 2,063 2,163
May 14, 2013 China: Metals & Mining: Base Metals
Goldman Sachs Global Investment Research 9
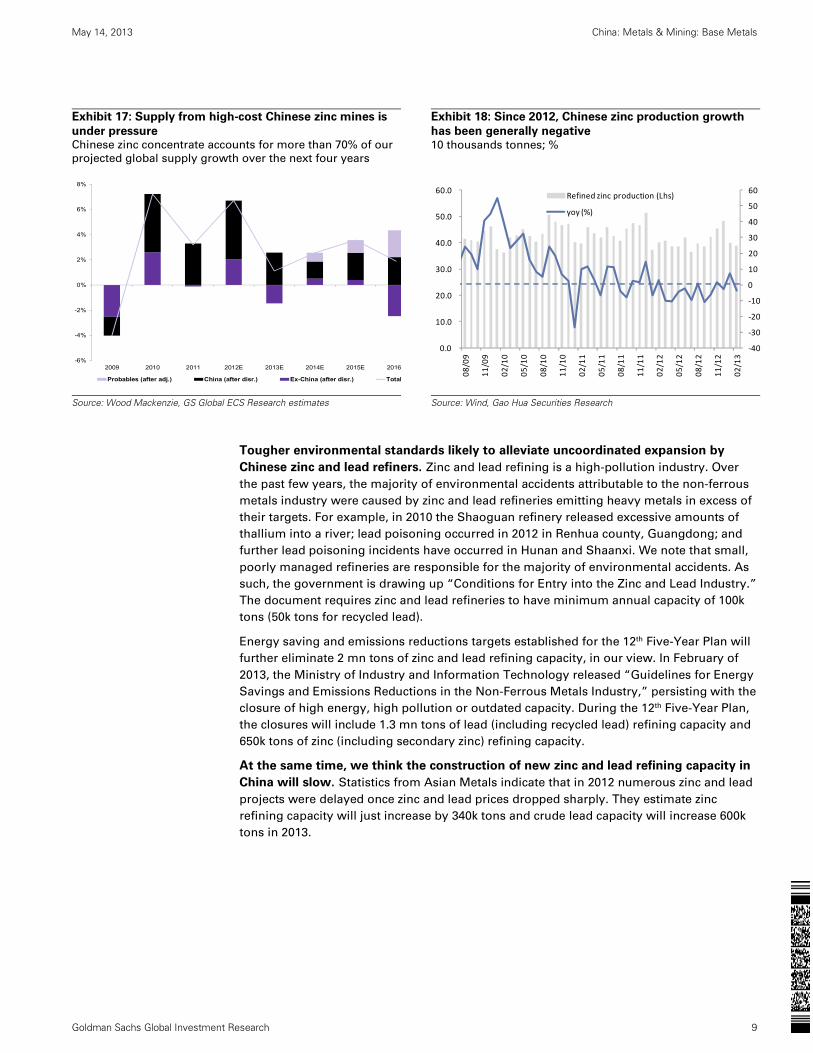
Exhibit 17: Supply from high-cost Chinese zinc mines is
under pressure Chinese zinc concentrate accounts for more than 70% of our
projected global supply growth over the next four years
Exhibit 18: Since 2012, Chinese zinc production growth
has been generally negative 10 thousands tonnes; %
Source: Wood Mackenzie, GS Global ECS Research estimates
Source: Wind, Gao Hua Securities Research
Tougher environmental standards likely to alleviate uncoordinated expansion by
Chinese zinc and lead refiners. Zinc and lead refining is a high-pollution industry. Over
the past few years, the majority of environmental accidents attributable to the non-ferrous
metals industry were caused by zinc and lead refineries emitting heavy metals in excess of
their targets. For example, in 2010 the Shaoguan refinery released excessive amounts of
thallium into a river; lead poisoning occurred in 2012 in Renhua county, Guangdong; and
further lead poisoning incidents have occurred in Hunan and Shaanxi. We note that small,
poorly managed refineries are responsible for the majority of environmental accidents. As
such, the government is drawing up “Conditions for Entry into the Zinc and Lead Industry.”
The document requires zinc and lead refineries to have minimum annual capacity of 100k
tons (50k tons for recycled lead).
Energy saving and emissions reductions targets established for the 12th Five-Year Plan will
further eliminate 2 mn tons of zinc and lead refining capacity, in our view. In February of
2013, the Ministry of Industry and Information Technology released “Guidelines for Energy
Savings and Emissions Reductions in the Non-Ferrous Metals Industry,” persisting with the
closure of high energy, high pollution or outdated capacity. During the 12th Five-Year Plan,
the closures will include 1.3 mn tons of lead (including recycled lead) refining capacity and
650k tons of zinc (including secondary zinc) refining capacity.
At the same time, we think the construction of new zinc and lead refining capacity in
China will slow. Statistics from Asian Metals indicate that in 2012 numerous zinc and lead
projects were delayed once zinc and lead prices dropped sharply. They estimate zinc
refining capacity will just increase by 340k tons and crude lead capacity will increase 600k
tons in 2013.
-6%
-4%
-2%
0%
2%
4%
6%
8%
2009 2010 2011 2012E 2013E 2014E 2015E 2016
Probables (after adj.) China (after disr.) Ex-China (after disr.) Total
‐40
‐30
‐20
‐10
0
10
20
30
40
50
60
0.0
10.0
20.0
30.0
40.0
50.0
60.0
08/09
11/09
02/10
05/10
08/10
11/10
02/11
05/11
08/11
11/11
02/12
05/12
08/12
11/12
02/13
Refined zinc production (Lhs)
yoy (%)

May 14, 2013 China: Metals & Mining: Base Metals
Goldman Sachs Global Investment Research 10
Exhibit 19: Zinc projects to come online in 2013E
Exhibit 20: Lead projects to come online in 2013E
Source: Asian Metals, Gao Hua Securities Research estimates
Source: Asian Metals, Gao Hua Securities Research estimates
China zinc/lead demand: Urbanization/consumption upgrades likely to be key drivers
Zinc: The completed de-stocking of galvanized sheets may directly drive zinc demand. Since 2009, Chinese production of coated sheets (primarily galvanized sheets) enjoyed
sustained growth, increasing from 19.43 mn tons in 2009 to 37.63 mn tons in 2012 (growth
of 94%). In terms of inventories, galvanized sheet stocks fell to the average level since 2009,
in 2H12. We believe that as the de-stocking process winds down, continued urbanization in
China will increase demand from galvanized sheets.
Exhibit 21: Chinese production of coated sheets has risen
since 2009 Coated sheets are the key demand driver for zinc
Exhibit 22: Galvanized sheet inventories have fallen to
the average level since 2009 The end of de-stocking should drive increased zinc demand
Source: Wind, Gao Hua Securities Research.
Source: Wind, Gao Hua Securities Research.
Real estate sales and car production growth continue to support consumption. Data
from the National Bureau of Statistics indicates that yoy sales growth for commercial
housing in China turned negative for almost a year starting October 2011 but then
rebounded strongly to positive growth in October 2012. The rebound was especially
pronounced in 1Q13, when yoy growth reached 37%. At the same time, housing sales have
driven a clear increase in demand for appliances. In addition, we believe that the auto
industry will further support demand. Our China auto analyst expects 2013E/2014E/2015E
car sales to grow 8.5%/8.5%8%, maintaining a strong growth rate. In 2H12, dealerships’
inventories declined; restocking has been driving a rebound in car production.
CompanyCapacity
expansionCurrentcapacity
Year tocome online
Huize of Chihong 100 380 2013Hulunbeier Chihong 140 380 2013Western Mining 100 160 2013Total in 2013 340Jinding zinc Co. 100 220 2014Yunxi zinc Co. 100 120 2014Xinganmen Boyuan 100 100 2014Huili zinc & lead 100 100 2014Total in 2014 400
Company ProvinceCapacity
expansionYear to
come online
Zhuzhou Smelter Group Hunan 100 Jan-13
Zhantai non-ferrous metals Hunan 100 Mar-13
Hongling zinc & lead mine Inner Mongolia 100 2013
Hulunbeier Chihong Inner Mongolia 60 2013
Huize of Chihong Yunnan 60 2013
Luanchuan Shibao mining Henan 80 2013
Hengbang Smelting Co. Shandong 100 2013
Total in 2013 600
(40)
(20)
0
20
40
60
80
100
0
500
1,000
1,500
2,000
2,500
3,000
3,500
4,000
02/09 08/09 02/10 08/10 02/11 08/11 02/12 08/12 02/13
Coated sheets production yoyKt %
0
5
10
15
20
25
30
35
40
45
50
02/09 08/09 02/10 08/10 02/11 08/11 02/12 08/12 02/13
Galvanized sheets Average from 2009
Kt
Average from 2009

May 14, 2013 China: Metals & Mining: Base Metals
Goldman Sachs Global Investment Research 11
Exhibit 23: China property sales maintain strong growth
10 thousands sqm; %
Exhibit 24: As per our China auto analyst, China car sales
likely to maintain strong growth
Source: Wind, Gao Hua Securities Research
Source: Wind, Gao Hua Securities Research estimates
Lead: Benefiting from consumption upgrades. Broken down by lead’s end users (2011),
in China, 28% of lead is used in the manufacture of electric scooters, 22% in the automotive
industry, 22% in lead-acid batteries for export and the rest in UPS, motorcycles and other
fields.
Compared with other metals, lead’s downstream uses skew towards consumption. As such,
we expect that consumption upgrades, increased car sales and the replacement of bicycles
with electric scooters in rural areas will drive lead demand growth. We believe production
of cars and electric scooters should enjoy sustained growth during 2013-2015.
Exhibit 25: Chinese lead-acid battery production has
continued to enjoy strong growth over the past 5 years
Exhibit 26: Electric scooter production has increased
rapidly in China
Source: Wind, Gao Hua Securities Research.
Source: Wind, Gao Hua Securities Research.
Car starting batteries are the main application for lead-acid batteries, accounting for about
48% of the market as of 2011, and are a type of consumable that require regular
replacement. As car ownership increases in China, so will the consumption of batteries.
Accordingly, we see China’s increasing car ownership rate as a support for Chinese lead
demand.
‐100%
‐50%
0%
50%
100%
150%
200%
0
100
200
300
400
500
600
700
800
03/09 09/09 03/10 09/10 03/11 09/11 03/12 09/12 03/13
Real estate sales area by daily
yoy (Rhs)
0.8 0.8 1.4 2.3 2.6 3.3
4.3 5.3 5.7
8.6
11.7 12.7
13.9 15.0 16.3
17.6 16.5%
1.7%
80.3%65.7%
13.8%
24.1%32.5%
22.4%
7.4%
51.1%35.4%
8.7% 9.2%8.5% 8.5%
8.0%
-150%
-100%
-50%
0%
50%
100%
0
5
10
15
20
25
2000
2001
2002
2003
2004
2005
2006
2007
2008
2009
2010
2011
2012
E
2013
E
2014
E
2015
E
Passenger Car Sales Volume Passenger Car growth rate (YoY) (RHS)
115,735 116,391
142,297 140,695
175,955
0
20,000
40,000
60,000
80,000
100,000
120,000
140,000
160,000
180,000
200,000
2008 2009 2010 2011 2012
Production of Lead‐acid batteriesKvAh
1,530
30,960
0
5,000
10,000
15,000
20,000
25,000
30,000
35,000
2003 2004 2005 2006 2007 2008 2009 2010 2011 2012
China E‐bike productionThousands

May 14, 2013 China: Metals & Mining: Base Metals
Goldman Sachs Global Investment Research 12
Exhibit 27: Car ownership in China continues to increase rapidly Units: 1 mn cars, %
Source: Wind, Gao Hua Securities Research.
Our supply/demand models for zinc and lead in China
Exhibit 28: China’s zinc supply/demand should trend towards balance in 2013/2014
Source: China Nonferrous Metals Industry Association, Wind, Gao Hua Securities Research estimates.
Exhibit 29: China’s refined lead supply/demand model
Source: China Nonferrous Metals Industry Association, Wind, Gao Hua Securities Research estimates.
7.71
73.27
0%
5%
10%
15%
20%
25%
30%
0.0
10.0
20.0
30.0
40.0
50.0
60.0
70.0
80.0
2001 2002 2003 2004 2005 2006 2007 2008 2009 2010 2011
Private car ownership in China
yoy (Rhs)
000t 2009 2010 2011 2012 2013E 2014E
China refined zinc capacity 4,425 5,115 5,720 5,800 6,140 6,540Capacity utilization (%) 97% 102% 93% 84% 84% 84%
China refined zinc production 4,286 5,209 5,308 4,847 5,131 5,466yoy (%) 6% 22% 2% -9% 6% 7%
Net import of refined zinc 641 280 301 509 540 512Import 670 323 348 515 550 520Export 29 43 46 6 10 8
China refined zinc supply 4,927 5,489 5,610 5,356 5,671 5,978
China refined zinc demand 4,350 4,850 5081 5285 5,621 5,987Demand growth (%) 5% 11% 5% 4% 6% 7%
Balance 577 639 528 71 50 (9)
000t 2009 2010 2011 2012 2013E 2014E
China refined lead capacity 4,450 4,980 5,382 5,632 5,932 6,232Capacity utilization (%) 85% 83% 79% 82% 82% 82%
China refined lead production 3,773 4,158 4,262 4,646 4,893 5,141 Mined lead production 2,626 2,794 2,836 3,284 3,328 3,290 Recyced lead 1,147 1,364 1,426 1,362 1,566 1,851
Refined lead production yoy (%) 10% 3% 9% 5% 5%Net import of refined lead 134 -2 0 5 0 3
Import 157 22 7 7 5 7Export 23 23 6 2 5 4
China refined lead supply 3,907 4,156 4,262 4,651 4,893 5,144
China refined lead demand 3,650 3,950 4005 4510 4,815 5,179Demand growth (%) 6% 8% 1% 13% 7% 8%
Balance 257 206 257 141 78 (35)

May 14, 2013 China: Metals & Mining: Base Metals
Goldman Sachs Global Investment Research 13
Operations comparison for A-share zinc and lead firms
We compared China’s two main zinc and lead firms—Zhongjin Lingnan and Chihong—
across multiple dimensions. We looked at the firms’ 2013-2015 zinc and lead concentrate
production growth rate, net profits and sensitivity to zinc and lead prices, production costs
and other operational indicators. We further checked firms’ ratio of interest-bearing bonds
to total invested capital, among other factors, to examine financial pressure. We evaluated
gross margins on zinc and lead operations, ROE and CROCI as indicators of profitability.
Our comparisons lead us to conclude: Chihong’s net profits are more sensitive to zinc
and lead prices and the firm’s production growth also outpaces Zhongjin Lingnan.
Lingnan’s overseas mines have higher operational effectiveness and are more stable.
1. Zinc and lead concentrate production growth: We estimate Chihong‘s zinc and lead
concentrate production growth will reach 10.4% CAGR in 2013E-2015E. If Chihong were to
successfully complete the rights issue and purchase Rongda Mining, the CAGR would
climb to 12% (our base case does not include Rongda). Lingnan is expanding Panlong mine
and entering Potosi and Silver Peak mines into service, pushing its 2013-2015 production
growth to 6.8% CAGR. That , however, remains below Chihong’s rate.
2. Net profit sensitivity to zinc and lead prices. We measured the sensitivity of firms’ net
profits to zinc and lead prices. If zinc and lead prices were to rise by 1%, net profit at
Chihong should rise 4%, whereas the figure for Lingnan is about 2.1%. We think Chihong is
likely to benefit more, as we expect zinc and lead prices to rise in 2014 and 2015.
Exhibit 30: Chihong has greater organic growth
Exhibit 31: Chihong will benefit more from higher prices
Sensitivity of net profit to 1% rise in zinc and lead prices
Source: Company data, Gao Hua Securities Research estimates.
Source: Company data, Gao Hua Securities Research estimates.
3. Production costs for zinc and lead concentrate: Lingnan’s primary mine, Fankou, has
lead grade 5% and zinc grade 9%. We estimate the firm’s 2013 costs to be Rmb4,966 per
ton. In comparison, Huize, Chihong’s primary mine, is of higher quality with lead grade
8.5% and zinc grade 20%. Costs per ton are Rmb4,600, a step below Lingnan’s costs.
4. Gross margins for mining and refining: Lingnan had mining and refining gross margin
of 28.5% in 2012 due to slightly higher production costs. That figure is clearly below
Chihong’s gross margin, which was 39.2% in 2012.
10.4%
6.8%
0.0%
2.0%
4.0%
6.0%
8.0%
10.0%
12.0%
Chihong Lingnan
Zinc & Lead concentrate production
growth in 2013-20154%
2%
0%
1%
1%
2%
2%
3%
3%
4%
4%
5%
Chihong Lingnan
Zinc & Lead prices sensitivity to 2013 net profit

May 14, 2013 China: Metals & Mining: Base Metals
Goldman Sachs Global Investment Research 14
Exhibit 32: We estimate Chihong has lower production
cost as of 2013E…
Exhibit 33: …and better gross mining and refining
margins in 2012
Source: Company data, Gao Hua Securities Research estimates.
Source: Company data, Gao Hua Securities Research.
5. Interest-bearing bonds to total invested capital: We use the ratio of interest-bearing
bonds to total invested capital to measure financial cost pressure (total invested capital is
the sum of interest-bearing bonds and shareholder equity attributable to their parent firm).
As of late 2012, the ratio for Lingnan was 38.6%, where as Chihong’s ratio was76.5%,
indicating a significant amount of financial pressure. Chihong’s high gearing ratio is
primarily due to recent rapid resource expansion. However, the firm’s plan to raise capital
through a rights offering has been approved by CSRC on March 15. If the rights issue were
to be successfully completed, it could help lower Chihong’s interest-bearing bond to total
invested capital ratio to about 45%, alleviating financial pressure once bank loans are
returned.
6. Assets acquired overseas and operations: Lingnan and Chihong, aside from developing
domestic resources, have in recent years continued to look for growth abroad. Lingnan in 2009
acquired Perliya during the financial crisis and that year moved from losses to profit; in 2010 it
again leveraged the Perliya platform to acquire GlobeStar mine and began to develop a variety
of metals. Profitability also became more stable. Chihong in 2010 became involved with one of
the world’s biggest zinc and lead mines—Canada’s Selwyn zinc and lead mine, which is
scheduled to enter service in 2015/2016. Further, Chihong announced in 2012 that it had
acquired a zinc and lead mine in Bolivia. Overall, Lingnan’s overseas operations already
account for 25% (2012) of the company’s net earnings and operational effectiveness is higher
while Chihong’s overseas assets are still under construction.
Exhibit 34: Lingnan is under less financial pressure Lingnan has a more stable asset and debt structure as of
2012
Exhibit 35: Comparison of overseas acquisitions and
operational status Lingnan’s overseas operational efficiency is higher
Source: Company data, Gao Hua Securities Research estimates.
Source: Company data, Gao Hua Securities Research.
4,600
4,966
3,000
3,500
4,000
4,500
5,000
5,500
Huize mine of Chihong Fankou mine of Lingnan
Zinc & Lead concentrate production cost
39.2%
28.5%
0.0%
5.0%
10.0%
15.0%
20.0%
25.0%
30.0%
35.0%
40.0%
45.0%
Chihong Lingnan
Gross margin of mining/smelting
business in 2012
76.5%
38.6%
0.0%
10.0%
20.0%
30.0%
40.0%
50.0%
60.0%
70.0%
80.0%
90.0%
Chihong Lingnan
Interest-bearing debt/total invested capitalCompany Overseas resources Operation
Selywn in CanadaScheduled to come online in2015/2016
Zinc & Lead projects in BoliviaAnnounced in Dec 2012 while notcomplete yet
Perilya in Australia
Globestar
Chihong
Lingnan
Made profit in the purchasingyear of Perilya; Profit alsoimproved for Globestar; both ofthem contribute Rmb90 mn(25%) of net profit in 2012

May 14, 2013 China: Metals & Mining: Base Metals
Goldman Sachs Global Investment Research 15
7. ROE: We expect Lingnan’s ROE to rise to 9.1% in 2013E as zinc and lead prices increase
and the negative influence of environmental accidents fades. That figure outpaces
Chihong’s ROE, which we estimate to be 8.2% in 2013E.
8. CROCI: We estimate Lingnang’s 2013E CROCI will edge up to 11.6% and remain in the
sector’s second quartile for the next three years. For Chihong, which continues to invest
significant sums into new mines, we expect CROCI to slip to 9.3%, placing it in the sector’s
third quartile.
Exhibit 36: Lingnan’s ROE should outpace Chihong in
2013E
Exhibit 37: Lingnan’s CROCI is also outpacing Chihong in
2013E
Source: Company data, Gao Hua Securities Research estimates.
Source: Company data, Gao Hua Securities Research estimates.
Using Director’s Cut to value zinc and lead firms
We use Director’s Cut methodology for valuing A-share zinc and lead firms, in line
with our other covered commodity stocks. Based on current valuations, the non-
ferrous metals’ industry average EV/GCI vs. CROCI/WACC is 1.0X.
Cash returns on cash invested (CROCI) is a key measure of a firm’s ability to create value.
By comparing firm’s past-three-years and 2013E-2014E CROCI, we divide non-ferrous
metals A-shares into quartiles, with the highest-CROCI firms in the first quartile, and the
lowest-CROCI firms in the fourth quartile.
Exhibit 38: A-share metal firms’ CROCI
Gold firms have higher CROCI while aluminum firms have lower CROCI
Source: Gao Hua Securities Research estimates.
8.2%
9.1%
7.0%
7.5%
8.0%
8.5%
9.0%
9.5%
Chihong Lingnan
2013E ROE
9.3%
11.6%
7.0%
7.5%
8.0%
8.5%
9.0%
9.5%
10.0%
10.5%
11.0%
11.5%
12.0%
Chihong Lingnan
2013E CROCI
Ticker Company 2010 2011 2012 2013E 2014E 2015E
600362.SS Jiangxi Copper 2 2 2 2 2 2000630.SZ Tongling 3 3 4 3 3 3000878.SZ Yunnan Copper 2 4 2 4 4 4000060.SZ Zhongjin Lingnan 4 2 3 2 2 2600497.SS Chihong 3 3 3 3 3 3601600.SS Chalco 4 4 4 4 4 4600489.SS Zhongjin Gold 1 1 1 1 1 1600547.SS Shandong Gold 1 1 1 1 1 1601899.SS Zijin Mining 1 1 1 1 1 1
May 14, 2013 China: Metals & Mining: Base Metals
Goldman Sachs Global Investment Research 16
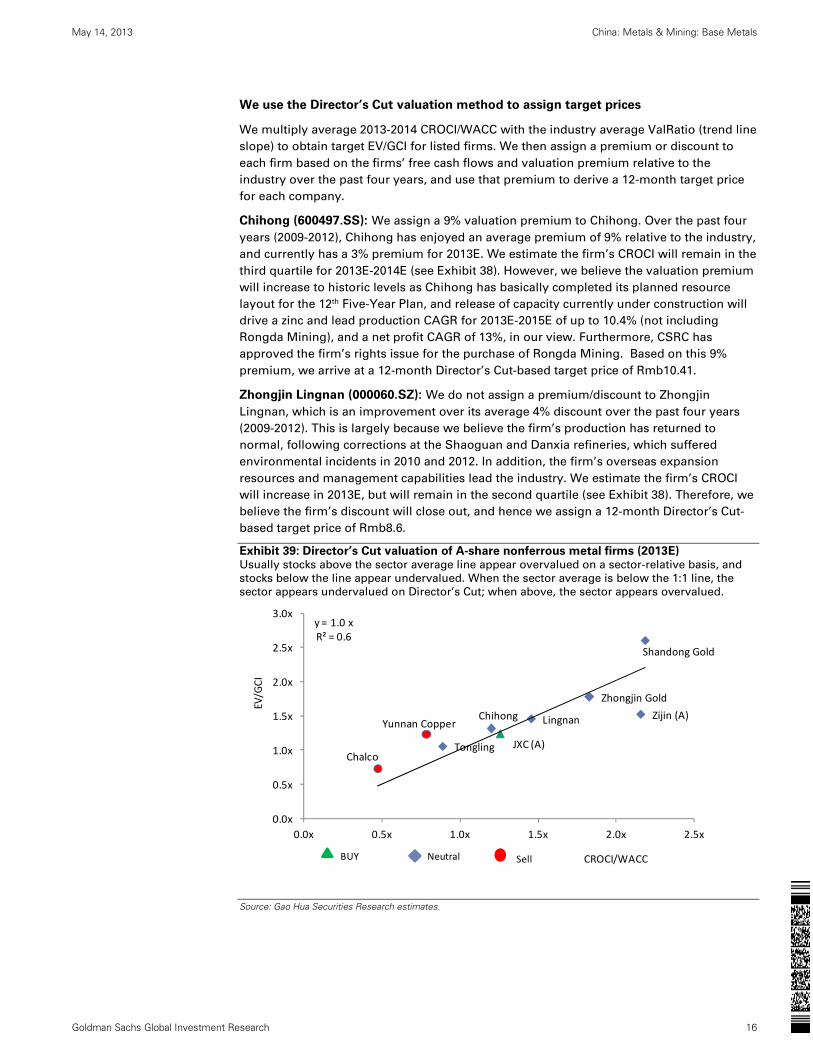
We use the Director’s Cut valuation method to assign target prices
We multiply average 2013-2014 CROCI/WACC with the industry average ValRatio (trend line
slope) to obtain target EV/GCI for listed firms. We then assign a premium or discount to
each firm based on the firms’ free cash flows and valuation premium relative to the
industry over the past four years, and use that premium to derive a 12-month target price
for each company.
Chihong (600497.SS): We assign a 9% valuation premium to Chihong. Over the past four
years (2009-2012), Chihong has enjoyed an average premium of 9% relative to the industry,
and currently has a 3% premium for 2013E. We estimate the firm’s CROCI will remain in the
third quartile for 2013E-2014E (see Exhibit 38). However, we believe the valuation premium
will increase to historic levels as Chihong has basically completed its planned resource
layout for the 12th Five-Year Plan, and release of capacity currently under construction will
drive a zinc and lead production CAGR for 2013E-2015E of up to 10.4% (not including
Rongda Mining), and a net profit CAGR of 13%, in our view. Furthermore, CSRC has
approved the firm’s rights issue for the purchase of Rongda Mining. Based on this 9%
premium, we arrive at a 12-month Director’s Cut-based target price of Rmb10.41.
Zhongjin Lingnan (000060.SZ): We do not assign a premium/discount to Zhongjin
Lingnan, which is an improvement over its average 4% discount over the past four years
(2009-2012). This is largely because we believe the firm’s production has returned to
normal, following corrections at the Shaoguan and Danxia refineries, which suffered
environmental incidents in 2010 and 2012. In addition, the firm’s overseas expansion
resources and management capabilities lead the industry. We estimate the firm’s CROCI
will increase in 2013E, but will remain in the second quartile (see Exhibit 38). Therefore, we
believe the firm’s discount will close out, and hence we assign a 12-month Director’s Cut-
based target price of Rmb8.6.
Exhibit 39: Director’s Cut valuation of A-share nonferrous metal firms (2013E) Usually stocks above the sector average line appear overvalued on a sector-relative basis, and
stocks below the line appear undervalued. When the sector average is below the 1:1 line, the
sector appears undervalued on Director’s Cut; when above, the sector appears overvalued.
Source: Gao Hua Securities Research estimates.
JXC (A)Tongling
Yunnan Copper LingnanChihong
Chalco
Zhongjin Gold
Shandong Gold
Zijin (A)
y = 1.0 xR² = 0.6
0.0x
0.5x
1.0x
1.5x
2.0x
2.5x
3.0x
0.0x 0.5x 1.0x 1.5x 2.0x 2.5x
EV/GCI
CROCI/WACCNeutralBUY Sell

May 14, 2013 China: Metals & Mining: Base Metals
Goldman Sachs Global Investment Research 17
Exhibit 40: Director’s Cut derivation of 12-month target prices; we rate both Chihong and
Zhongjin Lingnan Neutral
Source: Company data, Datastream, Gao Hua Securities Research estimates.
Zhongjin Lingnan Chihong Ave CROCI (2013E-2014E) 11.5% 9.2%Sector Valratio (EV/GCI vs. CROCI/WACC) 1.0x 1.0xValuation prem./disc.Adjustment 0% 9%Historical premium/discount -4% 9%Adjusted Valratio 1.0x 1.1xCROCI/WACC (2013E-2014E) 1.4x 1.2xTarget EV/GCI 1.5x 1.3xGCI (mn) 14,613 22,102Minority interests 1,611 2,529Net debt 2,099 12,231MV (pricing currency mn) 17,743 13,635Share outstanding (mn) 2,063 1,31012M Target price 8.60 10.41 Rating Neutral NeutralPotential upside (%) -4.1% -12.5%Current price (2013/5/10) 9.0 11.9

May 14, 2013 China: Metals & Mining: Base Metals
Goldman Sachs Global Investment Research 18
Chihong (600497.SS, Neutral): Resources acquired, awaiting profits
Investment view
We resume coverage on Chihong with a Neutral rating and a 12-m
Director’s Cut-based target price of Rmb10.41, implying 12.5% downside
potential. We believe the firm’s core growth driver will be the release of
capacity from acquired mines beginning production. In addition, we
believe the potential acquisition and consolidation of Rongda Mining
through a rights issue, if successfully completed, could be accretive to
earnings, and help lower the firm’s financial cost. However, with the
firm’s 2013E/2014E CROCI in the third quartile, and a 2013E P/E ratio of
48.9X—above the industry median—we assign a Neutral rating.
Key growth drivers
The firm may meet its 12th Five-Year Plan resource target early.At the end of 2009, Chihong set strategic targets for the 12th Five-Year
Plan: zinc and lead resources reaching 10mt by 2015, and refining
capacity of 1mt. Over the past three years, the firm has expanded its
resources through domestic consolidation and overseas purchases. In
terms of smelting production, the Huize 160k t smelting project is
scheduled to begin production in 2H13, and the 200k t Hulunbuir facility
is slated to start operations in late 2013.
Potential acquisition and consolidation of Rongda Mining could be earnings accretive. Chihong’s application for a rights issue has
been approved by the CSRC on March 15, and it plans to use Rmb2.1 bn
for acquiring a 51% stake in Rongda Mining held by the parent company
Yunnan Metallurgical Group (our base case does not include assets from
Rongda Mining). Rongda had net profits attributable to the parent
company of Rmb363 mn in 2012, 51% of which would imply Rmb185
mn. If Chihong’s rights issue and Rongda acquisition were to be
successfully completed, we estimate Rongda could potentially
contribute Rmb0.11 to Chihong’s 2013E EPS. Furthermore, the company
announced that the rights issue will raise not more than Rmb5 bn, of
which Rmb2.1 bn will be used to acquire the 51% stake in Rongda, and
the rest will be deposited in the bank, potentially lowering the firm’s
asset-liability ratio to around 53%.
Valuation
From 2009-2012, Chihong saw a 9% valuation premium on average. It is
currently at 3%; but we think if the rights issue were to be successfully
completed, earnings updates post the potential purchase of Rongda may
help raise the premium closer to the historical average. We apply a 9%
valuation premium and arrive at our 12-month Director’s Cut-based
target price of Rmb10.41.
Risks
Downside: An “environmental tax” levied on the firm’s products;
Upside: Faster-than-expected progress on projects under construction.
Growth
Returns *
Multiple
Volatility Volatility
Multiple
Returns *
Growth
Investment Profile
Low High
Percentile 20th 40th 60th 80th 100th
* Returns = Return on Capital For a complete description of the investment
profile measures please refer to the
disclosure section of this document.
Yunnan Chihong Zinc & Germanium (600497.SS)
Asia Pacific Metals & Mining Peer Group Average
Key data Current
Price (Rmb) 11.89
12 month price target (Rmb) 10.41
Market cap (Rmb mn / US$ mn) 15,577.0 / 2,536.3
Foreign ownership (%) --
12/12 12/13E 12/14E 12/15E
EPS (Rmb) 0.27 0.24 0.32 0.39
EPS growth (%) 1.6 (8.5) 29.8 22.5
EPS (diluted) (Rmb) 0.27 0.24 0.32 0.39
EPS (basic pre-ex) (Rmb) 0.27 0.24 0.32 0.39
P/E (X) 52.6 48.9 37.7 30.8
P/B (X) 4.8 4.0 3.7 3.5
EV/EBITDA (X) 24.2 14.9 13.5 13.0
Dividend yield (%) 1.4 1.0 1.3 1.6
ROE (%) 9.3 8.2 10.3 11.7
CROCI (%) 10.5 9.3 9.1 8.9
2,000
2,100
2,200
2,300
2,400
2,500
2,600
2,700
10
11
12
13
14
15
16
17
May-12 Aug-12 Nov-12 Feb-13
Price performance chart
Yunnan Chihong Zinc & Germanium (L) Shanghai SE A Share Index (R)
Share price performance (%) 3 month 6 month 12 month
Absolute (24.1) (1.9) (24.5)
Rel. to Shanghai SE A Share Index (17.8) (9.6) (19.0)
Source: Company data, Goldman Sachs Research estimates, FactSet. Price as of 5/10/2013 close.
INVESTMENT LIST MEMBERSHIP
Neutral
Coverage View: Neutral

May 14, 2013 China: Metals & Mining: Base Metals
Goldman Sachs Global Investment Research 19
Yunnan Chihong Zinc & Germanium: Summary financials
Profit model (Rmb mn) 12/12 12/13E 12/14E 12/15E Balance sheet (Rmb mn) 12/12 12/13E 12/14E 12/15E
Total revenue 12,130.4 16,558.8 19,759.2 21,342.4 Cash & equivalents 1,171.0 1,205.1 1,466.4 1,221.5
Cost of goods sold (10,287.1) (14,526.3) (17,492.7) (18,903.6) Accounts receivable 1,296.7 1,879.0 1,910.4 2,182.6
SG&A (848.5) (853.6) (951.9) (1,024.3) Inventory 1,277.0 1,906.8 1,927.2 2,216.0
R&D -- -- -- -- Other current assets 0.0 0.0 0.0 0.0
Other operating profit/(expense) (57.4) (47.9) (53.5) (57.5) Total current assets 3,744.7 4,990.9 5,304.0 5,620.2
EBITDA 1,324.9 2,039.8 2,184.6 2,298.4 Net PP&E 12,234.1 13,195.5 13,474.3 13,814.4
Depreciation & amortization (387.5) (908.9) (923.5) (941.4) Net intangibles 5,215.8 5,001.4 4,787.1 4,572.7
EBIT 937.4 1,130.9 1,261.1 1,357.0 Total investments 819.3 819.3 819.3 819.3
Interest income 8.2 14.5 14.9 18.1 Other long-term assets 204.4 279.0 332.9 359.6
Interest expense (600.8) (755.6) (770.2) (755.6) Total assets 22,218.3 24,286.1 24,717.6 25,186.2
Income/(loss) from uncons. subs. 39.4 0.0 0.0 0.0
Others 32.1 0.0 0.0 0.0 Accounts payable 2,794.3 3,573.4 4,094.7 4,191.8
Pretax profits 416.4 389.8 505.8 619.5 Short-term debt 7,587.8 8,087.8 7,587.8 7,587.8
Income tax (74.6) (77.1) (100.0) (122.5) Other current liabilities 0.0 0.0 0.0 0.0
Minorities 6.1 5.5 7.2 8.8 Total current liabilities 10,382.1 11,661.1 11,682.4 11,779.6
Long-term debt 4,848.5 5,348.5 5,348.5 5,348.5
Net income pre-preferred dividends 347.9 318.2 413.0 505.8 Other long-term liabilities 619.8 846.1 1,009.6 1,090.5
Preferred dividends 0.0 0.0 0.0 0.0 Total long-term liabilities 5,468.3 6,194.5 6,358.0 6,438.9
Net income (pre-exceptionals) 347.9 318.2 413.0 505.8 Total liabilities 15,850.3 17,855.6 18,040.5 18,218.5
Post-tax exceptionals 0.0 0.0 0.0 0.0
Net income 347.9 318.2 413.0 505.8 Preferred shares 0.0 0.0 0.0 0.0
Total common equity 3,833.2 3,901.3 4,155.2 4,454.5
EPS (basic, pre-except) (Rmb) 0.27 0.24 0.32 0.39 Minority interest 2,534.7 2,529.2 2,522.0 2,513.2
EPS (basic, post-except) (Rmb) 0.27 0.24 0.32 0.39
EPS (diluted, post-except) (Rmb) 0.27 0.24 0.32 0.39 Total liabilities & equity 22,218.3 24,286.1 24,717.6 25,186.2
DPS (Rmb) 0.19 0.12 0.16 0.19
Dividend payout ratio (%) 71.9 50.0 50.0 50.0 BVPS (Rmb) 2.93 2.98 3.17 3.40
Free cash flow yield (%) (5.6) (4.0) 5.1 (0.2)
Growth & margins (%) 12/12 12/13E 12/14E 12/15E Ratios 12/12 12/13E 12/14E 12/15E
Sales growth 92.1 36.5 19.3 8.0 CROCI (%) 10.5 9.3 9.1 8.9
EBITDA growth 22.6 54.0 7.1 5.2 ROE (%) 9.3 8.2 10.3 11.7
EBIT growth 34.6 20.6 11.5 7.6 ROA (%) 1.9 1.4 1.7 2.0
Net income growth (3.1) (8.5) 29.8 22.5 ROACE (%) 5.6 5.0 5.5 5.9
EPS growth 1.6 (8.5) 29.8 22.5 Inventory days 54.0 40.0 40.0 40.0
Gross margin 15.2 12.3 11.5 11.4 Receivables days 47.1 35.0 35.0 35.0
EBITDA margin 10.9 12.3 11.1 10.8 Payable days 97.7 80.0 80.0 80.0
EBIT margin 7.7 6.8 6.4 6.4 Net debt/equity (%) 176.9 190.2 171.8 168.1
Interest cover - EBIT (X) 1.6 1.5 1.7 1.8
Cash flow statement (Rmb mn) 12/12 12/13E 12/14E 12/15E Valuation 12/12 12/13E 12/14E 12/15E
Net income pre-preferred dividends 347.9 318.2 413.0 505.8
D&A add-back 387.5 908.9 923.5 941.4 P/E (analyst) (X) 52.6 48.9 37.7 30.8
Minorities interests add-back (6.1) (5.5) (7.2) (8.8) P/B (X) 4.8 4.0 3.7 3.5
Net (inc)/dec working capital 84.1 (433.1) 469.5 (463.9) EV/EBITDA (X) 24.2 14.9 13.5 13.0
Other operating cash flow 546.0 151.7 109.6 54.2 EV/GCI (X) 1.6 1.4 1.3 1.2
Cash flow from operations 1,359.4 940.1 1,908.4 1,028.8 Dividend yield (%) 1.4 1.0 1.3 1.6
Capital expenditures (2,534.5) (1,655.9) (988.0) (1,067.1)
Acquisitions (1,433.7) 0.0 0.0 0.0
Divestitures 0.0 0.0 0.0 0.0
Others (138.4) 0.0 0.0 0.0
Cash flow from investments (4,106.6) (1,655.9) (988.0) (1,067.1)
Dividends paid (common & pref) (196.5) (250.1) (159.1) (206.5)
Inc/(dec) in debt 3,815.6 1,000.0 (500.0) 0.0
Common stock issuance (repurchase) 421.8 0.0 0.0 0.0
Other financing cash flows (789.2) 0.0 0.0 0.0
Cash flow from financing 3,251.6 749.9 (659.1) (206.5)
Total cash flow 504.4 34.1 261.3 (244.8) Note: Last actual year may include reported and estimated data.
Source: Company data, Goldman Sachs Research estimates.

May 14, 2013 China: Metals & Mining: Base Metals
Goldman Sachs Global Investment Research 20
Resource strategy promotes sustained growth
Chihong has the potential to meet its resource goals early. At the end of 2009, Chihong
set strategic targets for the 12th Five-Year Plan: zinc and lead resources reach 10mt by 2015,
and refining capacity of 1mt. Over the past three years, the firm has expanded its
resources: In April 2011, it purchased Yongchang mine, Lancang Lead mine and
Daxing’anling Mining, increasing its zinc and lead holdings by 1.32mt; in 2011, it also
purchased Jinxin Mining, increasing its zinc and lead holdings by 155k t; in December 2012,
it announced the purchase of Bolivian Yangfan mine, D Copper mine, and Amazon Mining;
in March 2013, the firm signed an agreement with Selwyn to purchase the remaining 50%
equity stake in the Selwyn-Chihong joint venture; further, Chihong’s application for a rights
issue has been approved by the CSRC on March 15, and it plans to use the money raised to
acquire 51% stake in Rongda Mining. We believe that, if the above projects all progress
smoothly, the firm has the potential to increase its resource holdings from 3mt in 2009 to
10mt in 2013, meeting its 12th Five-Year Plan resource targets early.
Exhibit 41: Zinc and lead reserves controlled by the firm, as of 2012
Source: Company data, Gao Hua Securities Research
Exhibit 42: Zinc and lead projects with announced purchases in progress, as of March 2013
Source: Company data, Gao Hua Securities Research.
Smelting capacity is likely to be released gradually over the next two years. The firm’s
160k t Huize refinery project (60k t/a crude lead, 100k t/a refined zinc and comprehensive
slag utilization process) is scheduled to begin trial production, and is likely to begin normal
production in 2H13. The 200k t Hulunbuir refinery (140k t/a zinc, 60k t/a lead refining) is
likely to begin production at the end of 2013, according to the company.
OreKt Zinc (%) Lead (%) Silver (g/ t) Zinc (kt) Lead (kt) Silver (t)
Huize mine 100% 3,756 20.2% 8.5% 757 321 0Zhaotong Yiliang mine 100% 1,610 14.0% 3.0% 46.0 225 48 74Yongchang mine 93% 5,318 7.3% 3.0% 159.5 397 173 33Lancang mine 100% 5,619 3.3% 4.6% 156.7 280 272 1,206Daxing'anling Mining 100% 7,240 2.1% 0.7% 149 52Jinxin mining 100% 4,081 3.5% 0.3% 142 13 442Hulunbuir Chihong 50%Selwyn in Canada 50% 16,063 10.3% 4.2% 1,646 679Total 3,598 1,558 1,755
Zinc & Lead mines EquityGrade Resources
OreKt Zinc (kt) Lead (kt) Silver (t) Copper (kt)
Mines announced to acquire
Rongda mine 51% 526 426 2,057 49
D copper mine in Bolivia 835
Yangfan mine in Bolivia 817
Amazon mining in Bolivia 1,007
Zinc & Lead mines EquityResources

May 14, 2013 China: Metals & Mining: Base Metals
Goldman Sachs Global Investment Research 21
Potential consolidation of Rongda accretive to earnings
The firm’s application for a rights issue was approved by the CSRC on March 15, and
Chihong has announced that it will use the money raised to acquire Yunnan Metallurgical
Group’s 51% stake in Rongda Mining (our base case does not include assets from Rongda).
Rongda and its wholly owned subsidiary Yishengyuan Mining have approval for four
mines with total zinc and lead reserves of 952k t, 2057 t of silver, and 49k t of copper. In
2012, Rongda realized net profits attributable to the parent company of Rmb363 mn, with a
51% stake implying Rmb185 mn. Assuming Chihong’s rights issue and Rongda purchase
were to be successfully completed, on Chihong’s 2012 earnings it would about 15%
accretive.
We believe the potential rights issue could also improve the firm’s asset-liability
structure, lowering financial costs. As of end-2012, Chihong had an asset-liability ratio of
71%, with interest-bearing debt of over Rmb12 bn. Financial costs for the firm in 2012
reached Rmb600 mn, significantly higher than the firm’s 2012 net profit attributable to the
parent company of Rmb350 mn. Based on the company’s announcements, the rights issue
will raise not more than Rmb5 bn, of which Rmb2.1 bn will be used to acquire the 51%
stake in Rongda, and the rest will be deposited in the bank. We calculate that this could
lower the firm’s asset-liability ratio to 53%, saving approximately Rmb180 mn in financial
costs in 2013.
Exhibit 43: Scenario analysis: EPS after potential
consolidation of Rongda (based on share capital after
rights issue)
Exhibit 44: Asset-liability ratio before and after potential
rights issue, as of 2012
Source: Company data, Gao Hua Securities Research estimates.
Source: Company data, Gao Hua Securities Research estimates.
Further profit contributions will have to wait until capacity release from the
purchased overseas resources. Although the firm has increased its resources relatively
rapidly over the past few years, earnings from the Yongchang and Lancang zinc and lead
mines have been relatively weak due to geologic conditions; Jinxin Mining has just
received resource registration; Selwyn-Chihong Mining is scheduled to begin production
at the end of 2015, contributing in 2016. Therefore, we estimate relatively slow 2013E/2014E
zinc and lead concentrate production growth (8.1%/8.0% from7.8% in 2012), while the start
of zinc and lead concentrate production at Selwyn-Chihong would potentially lead to a
15.2% growth in 2015E.
0.27
0.31
0.22
0.24
0.26
0.28
0.3
0.32
No consolidation Consolidated Rongda mine
2012 EPS 71%
53%
0%
10%
20%
30%
40%
50%
60%
70%
80%
No consolidation Consolidated Rongda mine
Asset-liability ratio

May 14, 2013 China: Metals & Mining: Base Metals
Goldman Sachs Global Investment Research 22
Scattered metals are an important source of profits
The company’s key scattered metals include germanium and cadmium. Presently, Chihong
has 30 tons of annual germanium capacity and is constructing 800 tons of annual cadmium
capacity.
Chihong’s main germanium products are pure germanium and germanium dioxide, and
most of which are used in optical instruments or military applications, with stable orders.
In 2011, Chihong produced 5.56 tons of pure germanium and 11.64 tons of germanium
dioxide, accounting for 6.2% of gross earnings. In 2012, we estimate Chihong sold only 10
tons of germanium products and the contribution to gross earnings declined to 2% as
prices and sales volumes declined. But germanium prices have been among the strongest
performers in metals in 2013, rising 7% since the start of the year. As a result, we expect
the contribution of germanium products to earnings to increase.
Exhibit 45: Price trends for germanium products
Exhibit 46: Price trends for cadmium ingot
Source: Asian Metals, Gao Hua Securities Research.
Source: Asian Metals, Gao Hua Securities Research.
Potential environmental tax on lead may be a headwind for Chihong
The Economic Information newspaper reported on March 12, 2013, that the Ministry of
Finance will accelerate reforms to the environmental protection tax. The move will place an
environmental protection tax on products that contain lead or other highly polluting
materials. In 2012, lead products accounted for 8% of Chihong’s total income (not including
lead product trade income). We perform a scenario analysis on the environmental
protection tax rate as below.
Exhibit 47: Scenario analysis of the impact of an environmental tax on Chihong in 2013 Our base case is no environmental tax
Source: Gao Hua Securities Research estimates.
0
2000
4000
6000
8000
10000
12000
14000
05/09 11/09 05/10 11/10 05/11 11/11 05/12 11/12 05/13
Germanium oxide 99.99% min
Germanium metal 99.99% min
Rmb/t
0
5000
10000
15000
20000
25000
30000
35000
40000
05/09 11/09 05/10 11/10 05/11 11/11 05/12 11/12 05/13
Cadmium ingot Rmb/t
1% 3% 5%Net profit changes (%) 0 -2.0% -6.2% -10.3%
Environmental tax rateBase case - Noenvironmental tax

May 14, 2013 China: Metals & Mining: Base Metals
Goldman Sachs Global Investment Research 23
Director’s Cut target price of Rmb10.41; Neutral rating
CROCI to remain in the third quartile. We think Chihong’s strong organic growth will
help its net profit growth rate outpace Lingnan, its peer. Despite this, we believe Chihong’s
2013E/2014E/2015E CROCI will edge down to 9.3%/9.1%/8.9%, from 10.5% in 2012, primarily
because the firm will continue to make significant capital expenditures over this period and
the release of capacity from mines under construction will likely be slow.
Chihong’s EV/GCI vs. CROCI/WACC premium relative to the industry is likely to rise to its historical average. Over the past four years (2009-2012), Chihong averaged a
9% premium to the industry, but at present that premium has slipped to 3%. But we think
its premium is likely to climb to its historical average, because the company has completed
its resource layout for the 12th Five-Year plan and capacity from mines under construction
should drive zinc and lead ore concentrate production growth of 10.4% CAGR from 2013E-
2015E (not including Rongda). Further, the CSRC has already approved Chihong’s rights
offering to acquire Rongda, the successful completion of which would also support
Chihong’s premium, in our view.
We derive our 12-m Director’s Cut target price of Rmb10.41 and resume coverage with a Neutral rating. Our 12-month target price of Rmb10.41 is based on a
target premium of 9%. Our target price implies 12.5% potential downside.
Exhibit 48: Chihong’s historical P/E band
Exhibit 49: Chihong’s historical P/B band
Source: Bloomberg, Gao Hua Securities Research estimates.
Source: Bloomberg, Gao Hua Securities Research estimates.
0
50
100
150
200
250
May‐07 May‐08 May‐09 May‐10 May‐11 May‐12 May‐13
PE Ave.PE +1Stdev ‐1Stdev
0
10
20
30
40
50
60
70
80
90
Ma
y/0
5
No
v/0
5
Ma
y/0
6
No
v/0
6
Ma
y/0
7
No
v/0
7
Ma
y/0
8
No
v/0
8
Ma
y/0
9
No
v/0
9
Ma
y/1
0
No
v/1
0
Ma
y/1
1
No
v/1
1
Ma
y/1
2
No
v/1
2
Ma
y/1
3
Share price 0.50X 1.50X 2.50X
3.50X 4.50X 6.50X

May 14, 2013 China: Metals & Mining: Base Metals
Goldman Sachs Global Investment Research 24
Zhongjin Lingnan (000060.SZ, Neutral): Back to normal operations
Investment view
We resume coverage on Lingnan with a Neutral rating and our 12-month
Director’s Cut-based target price of Rmb8.6, implying 4% potential
downside. Lingnan successfully acquired Perliya and GlobeStar
overseas in 2009 and 2010, and their earnings improved significantly
under Lingnan. However, environmental accidents negatively impacted
development over the past two years, and production has recently
recovered. We expect Lingnan’s CROCI to remain in the second quartile
over the next two years on the back of resumption of normal operations.
Currently, 2013E P/E is 34.9X, slightly above the 5-year average of 28.7X.
Key growth drivers
Overseas expansion and operational results demonstrate strong execution skills. During 2008-2009, Lingnan acquired 50.1% of Perliya for
Rmb200 mn. Perliya then moved into profitability. In 2010, Lingnan used
Perliya as a platform to successfully acquire GlobeStar, which significantly
improved earnings in 2011. In 2012, overseas mines raised their share of
Lingnan’s net profits to 25% from 15% in 2011.
Diverse metal resources support strategy of stable development. In 2013, we estimate Panlong mine’s zinc and lead concentrate production
to be 26.7k tons and the opening of the Perilya Potosi/Silver Peak projects
also to contribute 17k tons of zinc and lead concentrate. In addition,
Lingnan acquired GlobeStar and added 123k tons of copper resources from
Cerro de Maimon, 93k tons of nickel resources from Cumpie Hill, and 201k
tons of lithium from Moblan. Diversified resources should make earnings
more defensive when zinc and lead prices are low and support Lingnan’s
stable development, in our view.
Returning to normalcy after environmental accidents. In 2010,
Lingnan’s Shaoguan refinery water discharges into a river resulted in
thallium levels exceeding targets. The government required that the
refinery be closed entirely for corrections and the crude smelting system
was unable to resume transitional operations until September 2012. In
March 2012, Danxia refinery was closed for 3 months and Fankou mine
closed for 1 month due to lead poisoning. Lingnan has recently returned
to normal operations. Furthermore, its second largest shareholder—
Guangsheng Investment and Development—increased its stake by
purchasing 6.94mn shares (0.34%) during Dec 21, 2012 to Feb 7, 2013 to
6.85%, which we think reflects its confidence in Lingnan’s robust
outlook.
Valuation
From 2009-2012, Lingnan’s EV/GCI vs. CROCI/WACC was at 4% discount
relative to the industry, which widened to 5% in 2013. We think the
discount is likely to disappear as the firm returns to normal operations
after accidents in 2010 and 2012, and its CROCI remaining steady in the
second quartile during 2013-2014.
Risks
Downside: Environmental problems continuing to influence production;
Upside: New progress in overseas expansion.
Growth
Returns *
Multiple
Volatility Volatility
Multiple
Returns *
Growth
Investment Profile
Low High
Percentile 20th 40th 60th 80th 100th
* Returns = Return on Capital For a complete description of the investment
profile measures please refer to the
disclosure section of this document.
Shenzhen Zhongjin Lingnan Nonfemet (000060.SZ)
Asia Pacific Metals & Mining Peer Group Average
Key data Current
Price (Rmb) 8.97
12 month price target (Rmb) 8.60
Market cap (Rmb mn / US$ mn) 18,504.6 / 3,012.9
Foreign ownership (%) --
12/12 12/13E 12/14E 12/15E
EPS (Rmb) 0.21 0.26 0.28 0.29
EPS growth (%) (54.5) 22.5 10.6 0.6
EPS (diluted) (Rmb) 0.21 0.26 0.28 0.29
EPS (basic pre-ex) (Rmb) 0.21 0.26 0.28 0.29
P/E (X) 41.7 34.9 31.6 31.4
P/B (X) 3.2 3.1 2.8 2.6
EV/EBITDA (X) 13.1 11.7 10.9 10.8
Dividend yield (%) 0.5 0.6 0.7 0.7
ROE (%) 7.9 9.1 9.3 8.7
CROCI (%) 10.1 11.6 11.4 10.9
750
800
850
900
950
1,000
1,050
1,100
1,150
1,200
1,250
7.0
7.5
8.0
8.5
9.0
9.5
10.0
10.5
11.0
11.5
12.0
May-12 Aug-12 Nov-12 Feb-13
Price performance chart
Shenzhen Zhongjin Lingnan Nonfemet (L) Shenzhen A Index (R)
Share price performance (%) 3 month 6 month 12 month
Absolute (20.5) 18.2 (7.6)
Rel. to Shenzhen A Index (20.6) 1.0 (7.8)
Source: Company data, Goldman Sachs Research estimates, FactSet. Price as of 5/10/2013 close.
INVESTMENT LIST MEMBERSHIP
Neutral
Coverage View: Neutral
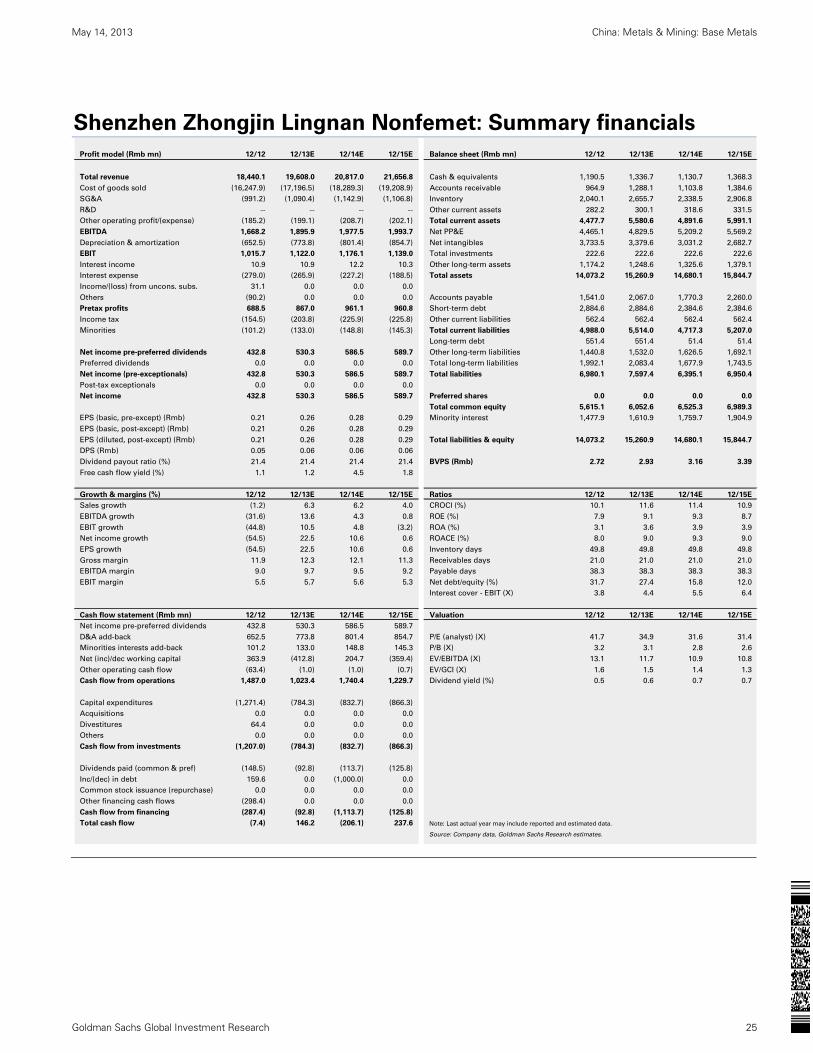
May 14, 2013 China: Metals & Mining: Base Metals
Goldman Sachs Global Investment Research 25
Shenzhen Zhongjin Lingnan Nonfemet: Summary financials
Profit model (Rmb mn) 12/12 12/13E 12/14E 12/15E Balance sheet (Rmb mn) 12/12 12/13E 12/14E 12/15E
Total revenue 18,440.1 19,608.0 20,817.0 21,656.8 Cash & equivalents 1,190.5 1,336.7 1,130.7 1,368.3
Cost of goods sold (16,247.9) (17,196.5) (18,289.3) (19,208.9) Accounts receivable 964.9 1,288.1 1,103.8 1,384.6
SG&A (991.2) (1,090.4) (1,142.9) (1,106.8) Inventory 2,040.1 2,655.7 2,338.5 2,906.8
R&D -- -- -- -- Other current assets 282.2 300.1 318.6 331.5
Other operating profit/(expense) (185.2) (199.1) (208.7) (202.1) Total current assets 4,477.7 5,580.6 4,891.6 5,991.1
EBITDA 1,668.2 1,895.9 1,977.5 1,993.7 Net PP&E 4,465.1 4,829.5 5,209.2 5,569.2
Depreciation & amortization (652.5) (773.8) (801.4) (854.7) Net intangibles 3,733.5 3,379.6 3,031.2 2,682.7
EBIT 1,015.7 1,122.0 1,176.1 1,139.0 Total investments 222.6 222.6 222.6 222.6
Interest income 10.9 10.9 12.2 10.3 Other long-term assets 1,174.2 1,248.6 1,325.6 1,379.1
Interest expense (279.0) (265.9) (227.2) (188.5) Total assets 14,073.2 15,260.9 14,680.1 15,844.7
Income/(loss) from uncons. subs. 31.1 0.0 0.0 0.0
Others (90.2) 0.0 0.0 0.0 Accounts payable 1,541.0 2,067.0 1,770.3 2,260.0
Pretax profits 688.5 867.0 961.1 960.8 Short-term debt 2,884.6 2,884.6 2,384.6 2,384.6
Income tax (154.5) (203.8) (225.9) (225.8) Other current liabilities 562.4 562.4 562.4 562.4
Minorities (101.2) (133.0) (148.8) (145.3) Total current liabilities 4,988.0 5,514.0 4,717.3 5,207.0
Long-term debt 551.4 551.4 51.4 51.4
Net income pre-preferred dividends 432.8 530.3 586.5 589.7 Other long-term liabilities 1,440.8 1,532.0 1,626.5 1,692.1
Preferred dividends 0.0 0.0 0.0 0.0 Total long-term liabilities 1,992.1 2,083.4 1,677.9 1,743.5
Net income (pre-exceptionals) 432.8 530.3 586.5 589.7 Total liabilities 6,980.1 7,597.4 6,395.1 6,950.4
Post-tax exceptionals 0.0 0.0 0.0 0.0
Net income 432.8 530.3 586.5 589.7 Preferred shares 0.0 0.0 0.0 0.0
Total common equity 5,615.1 6,052.6 6,525.3 6,989.3
EPS (basic, pre-except) (Rmb) 0.21 0.26 0.28 0.29 Minority interest 1,477.9 1,610.9 1,759.7 1,904.9
EPS (basic, post-except) (Rmb) 0.21 0.26 0.28 0.29
EPS (diluted, post-except) (Rmb) 0.21 0.26 0.28 0.29 Total liabilities & equity 14,073.2 15,260.9 14,680.1 15,844.7
DPS (Rmb) 0.05 0.06 0.06 0.06
Dividend payout ratio (%) 21.4 21.4 21.4 21.4 BVPS (Rmb) 2.72 2.93 3.16 3.39
Free cash flow yield (%) 1.1 1.2 4.5 1.8
Growth & margins (%) 12/12 12/13E 12/14E 12/15E Ratios 12/12 12/13E 12/14E 12/15E
Sales growth (1.2) 6.3 6.2 4.0 CROCI (%) 10.1 11.6 11.4 10.9
EBITDA growth (31.6) 13.6 4.3 0.8 ROE (%) 7.9 9.1 9.3 8.7
EBIT growth (44.8) 10.5 4.8 (3.2) ROA (%) 3.1 3.6 3.9 3.9
Net income growth (54.5) 22.5 10.6 0.6 ROACE (%) 8.0 9.0 9.3 9.0
EPS growth (54.5) 22.5 10.6 0.6 Inventory days 49.8 49.8 49.8 49.8
Gross margin 11.9 12.3 12.1 11.3 Receivables days 21.0 21.0 21.0 21.0
EBITDA margin 9.0 9.7 9.5 9.2 Payable days 38.3 38.3 38.3 38.3
EBIT margin 5.5 5.7 5.6 5.3 Net debt/equity (%) 31.7 27.4 15.8 12.0
Interest cover - EBIT (X) 3.8 4.4 5.5 6.4
Cash flow statement (Rmb mn) 12/12 12/13E 12/14E 12/15E Valuation 12/12 12/13E 12/14E 12/15E
Net income pre-preferred dividends 432.8 530.3 586.5 589.7
D&A add-back 652.5 773.8 801.4 854.7 P/E (analyst) (X) 41.7 34.9 31.6 31.4
Minorities interests add-back 101.2 133.0 148.8 145.3 P/B (X) 3.2 3.1 2.8 2.6
Net (inc)/dec working capital 363.9 (412.8) 204.7 (359.4) EV/EBITDA (X) 13.1 11.7 10.9 10.8
Other operating cash flow (63.4) (1.0) (1.0) (0.7) EV/GCI (X) 1.6 1.5 1.4 1.3
Cash flow from operations 1,487.0 1,023.4 1,740.4 1,229.7 Dividend yield (%) 0.5 0.6 0.7 0.7
Capital expenditures (1,271.4) (784.3) (832.7) (866.3)
Acquisitions 0.0 0.0 0.0 0.0
Divestitures 64.4 0.0 0.0 0.0
Others 0.0 0.0 0.0 0.0
Cash flow from investments (1,207.0) (784.3) (832.7) (866.3)
Dividends paid (common & pref) (148.5) (92.8) (113.7) (125.8)
Inc/(dec) in debt 159.6 0.0 (1,000.0) 0.0
Common stock issuance (repurchase) 0.0 0.0 0.0 0.0
Other financing cash flows (298.4) 0.0 0.0 0.0
Cash flow from financing (287.4) (92.8) (1,113.7) (125.8)
Total cash flow (7.4) 146.2 (206.1) 237.6 Note: Last actual year may include reported and estimated data.
Source: Company data, Goldman Sachs Research estimates.

May 14, 2013 China: Metals & Mining: Base Metals
Goldman Sachs Global Investment Research 26
Overseas expansion, mining results display strong execution skills
The acquisition of Perilya was Lingnan’s first overseas venture. In 2009, Lingnan
invested A$45.46 mn (Rmb200 mn) to acquire 50.1% of the listed Australian mining firm
Perilya. At the time of acquisition, Perilya had 3.5 mn tons of zinc and lead reserves and
617 tons of silver. The company raised A$55.2 mn in a rights offering to expand its
development of non-ferrous metals and in 2009 helped Perilya to shift from loss-making
into profitability. Since the acquisition on February 9, 2009, to the end of 2009, Lingnan had
realized profits of A$31.08 mn. Lingnan further expanded Perilya’s reserves through
additional exploration to 4.47 mn tons of zinc and 1,979 tons of silver as of June 2012.
Further, in 2009 Lingnan successfully signed a cooperative exploration agreement with the
Canadian firm Teck for the Ballinalack site in Ireland—Lingnan took 40% stake in Teck for
US$6 mn. Exploration at the Ballinalack site already has found 560k tons of zinc and lead
resources.
Exhibit 50: The acquisition of Perilya clearly increased resource reserves, as of 2012
Source: Company data, Gao Hua Securities Research.
The acquisition of GlobeStar created a platform for an international, diversified metal
company. In December 2010, Lingnan acquired 97.77% of the Canadian firm GlobeStar
using C$1.65 per share cash offer through Perilya. GlobeStar fully controls the resources at
Cerro de Maimon (123k tons of copper, 208 tons of silver and 6.8 tons of gold); Cumpie Hill
(93k tons of nickel); and Moblan (201k tons of lithium). The move not only boosted
Lingnan’s zinc and lead reserves, but also gave it exposure to copper, gold, nickel, and
lithium among other metal resources that we think would help stabilize the company’s
earnings when zinc and lead prices are weak.
Exhibit 51: The acquisition of GlobeStar created a diversified metals platform (as of 2012)
Source: Company data, Gao Hua Securities Research.
OreKt Zinc (%) Lead (%) Silver (g/ t) Copper (%) Zinc (kt) Lead (kt) Silver (t) Copper (kt)
Broken hill southern 53% 12,700 8.9% 6.8% 67 1,130 864 851
Broken hill Potosi 53% 1,610 14.0% 3.0% 46 225 48 74
Broken hill Silver Peak 53% 400 5.0% 9.0% 77 20 36 31
Broken hill North Mine 53% 1,000 7.0% 9.0% 140 70 90 140
Broken hill North Deeps 53% 3,300 11.5% 13.8% 224 380 455 739
Flinders-Beltana 53% 972 29.8% 290
Flinders-Adelaide 53% 316 32.0% 101
North Moolooloo 53% 2,140 34.4% 1.4% 735 29
Mount Oxide 53% 15,977 9 1.4% 144 228
Perilya total 38,415 2,951 1,522 1,979 228
Perilya total excluding minorities 20,502 1,575 812 1,056 122
Equity (%)Grade Resources
Zinc & Lead mines
OreKt Copper (kt) Silver (t) Gold (t) Nickel (kt) Lithium (kt)
Cerro de Maimon Oxide Ore 53% 1,157 39.9 2.2
Cerro de Maimon Sulphide Ore 53% 4,825 122.5 168.4 4.6
Cumpie Hill 53% 6,200 93.0
Moblan 32% 14,250 200.9
GlobeStar total 26,432 122.5 208.3 6.8 93.0 200.9
GlobeStar total excluding minorities 11,065 65.4 111.2 3.6 49.6 64.3
Equity (%)Resources
Mines
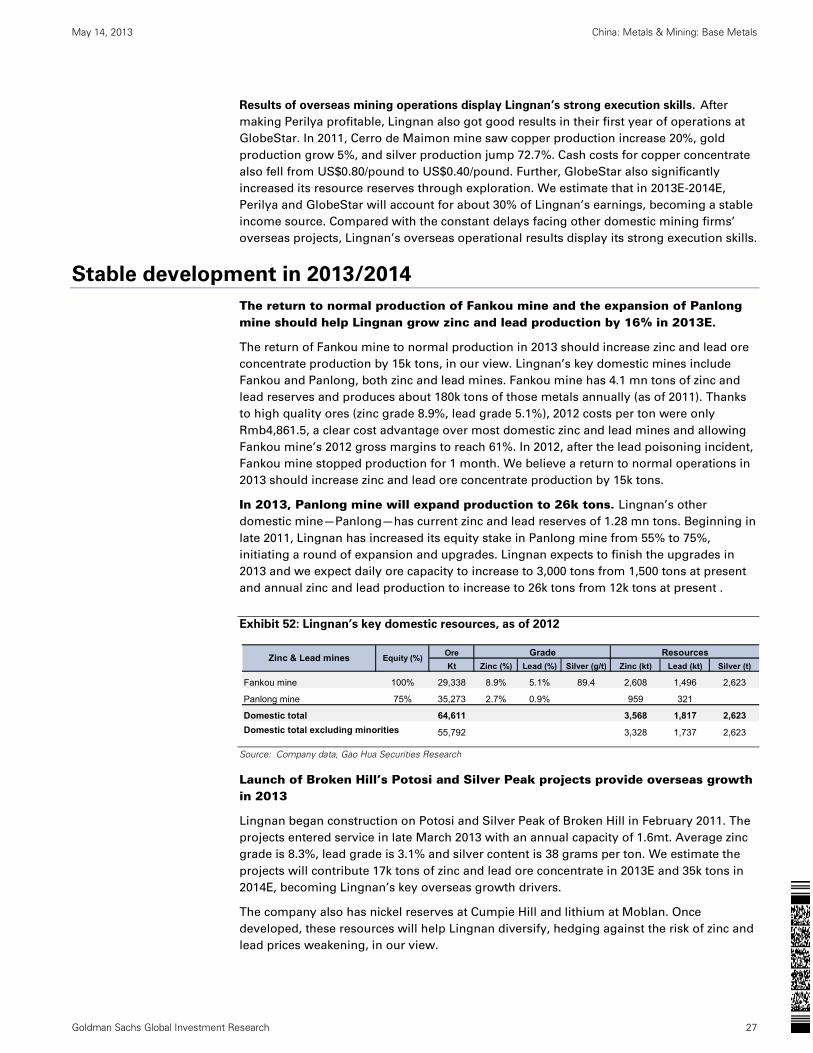
May 14, 2013 China: Metals & Mining: Base Metals
Goldman Sachs Global Investment Research 27
Results of overseas mining operations display Lingnan’s strong execution skills. After
making Perilya profitable, Lingnan also got good results in their first year of operations at
GlobeStar. In 2011, Cerro de Maimon mine saw copper production increase 20%, gold
production grow 5%, and silver production jump 72.7%. Cash costs for copper concentrate
also fell from US$0.80/pound to US$0.40/pound. Further, GlobeStar also significantly
increased its resource reserves through exploration. We estimate that in 2013E-2014E,
Perilya and GlobeStar will account for about 30% of Lingnan’s earnings, becoming a stable
income source. Compared with the constant delays facing other domestic mining firms’
overseas projects, Lingnan’s overseas operational results display its strong execution skills.
Stable development in 2013/2014
The return to normal production of Fankou mine and the expansion of Panlong mine should help Lingnan grow zinc and lead production by 16% in 2013E.
The return of Fankou mine to normal production in 2013 should increase zinc and lead ore
concentrate production by 15k tons, in our view. Lingnan’s key domestic mines include
Fankou and Panlong, both zinc and lead mines. Fankou mine has 4.1 mn tons of zinc and
lead reserves and produces about 180k tons of those metals annually (as of 2011). Thanks
to high quality ores (zinc grade 8.9%, lead grade 5.1%), 2012 costs per ton were only
Rmb4,861.5, a clear cost advantage over most domestic zinc and lead mines and allowing
Fankou mine’s 2012 gross margins to reach 61%. In 2012, after the lead poisoning incident,
Fankou mine stopped production for 1 month. We believe a return to normal operations in
2013 should increase zinc and lead ore concentrate production by 15k tons.
In 2013, Panlong mine will expand production to 26k tons. Lingnan’s other
domestic mine—Panlong—has current zinc and lead reserves of 1.28 mn tons. Beginning in
late 2011, Lingnan has increased its equity stake in Panlong mine from 55% to 75%,
initiating a round of expansion and upgrades. Lingnan expects to finish the upgrades in
2013 and we expect daily ore capacity to increase to 3,000 tons from 1,500 tons at present
and annual zinc and lead production to increase to 26k tons from 12k tons at present .
Exhibit 52: Lingnan’s key domestic resources, as of 2012
Source: Company data, Gao Hua Securities Research
Launch of Broken Hill’s Potosi and Silver Peak projects provide overseas growth in 2013
Lingnan began construction on Potosi and Silver Peak of Broken Hill in February 2011. The
projects entered service in late March 2013 with an annual capacity of 1.6mt. Average zinc
grade is 8.3%, lead grade is 3.1% and silver content is 38 grams per ton. We estimate the
projects will contribute 17k tons of zinc and lead ore concentrate in 2013E and 35k tons in
2014E, becoming Lingnan’s key overseas growth drivers.
The company also has nickel reserves at Cumpie Hill and lithium at Moblan. Once
developed, these resources will help Lingnan diversify, hedging against the risk of zinc and
lead prices weakening, in our view.
Ore
Kt Zinc (%) Lead (%) Silver (g/t) Zinc (kt) Lead (kt) Silver (t)
Fankou mine 100% 29,338 8.9% 5.1% 89.4 2,608 1,496 2,623
Panlong mine 75% 35,273 2.7% 0.9% 959 321
Domestic total 64,611 3,568 1,817 2,623
Domestic total excluding minorities 55,792 3,328 1,737 2,623
Equity (%)Grade Resources
Zinc & Lead mines

May 14, 2013 China: Metals & Mining: Base Metals
Goldman Sachs Global Investment Research 28
Environmental accidents a drag on expansion
Environmental accidents impacted operations. In October 2010, excessive amounts
of thallium were discovered in an upstream segment of Bei River in Shaoguan city. The
Ministry of Environmental Protection found the Shaoguan refinery’s waste water to be the
source of the pollution and, starting October 21, 2010, the refinery ceased all operations.
On July 20, 2011, Lingnan received approval from SASAC (State-owned Assets Supervision
and Administration Commission of Guangdong province) for transitional operation of the
refining system, but the #2 crude smelting system did not receive approval for transitional
operation until September 2012. The #1 crude smelting system has been required to be
completely closed and reorganizing the Shaoguan refinery has involved relocation and
upgrades at other sites. Refining of zinc and lead metals at Shaoguan refinery fell from
256.2k tons in 2010 to 32k tons in 2011.
In March 2012, the company’s Danxia refinery and Fankou zinc and lead mine were also
closed for inspections following lead poisoning incidents. Fankou mine was closed for 1
month while Danxia refinery stopped work for about 3 months. We believe the stoppages
reduced 2012 refined zinc and lead metal output by about 50k tons.
Exhibit 53: Lingnan’s smelting production declined significantly after environmental
accidents ‘000 tonnes
Source: Company data, Gao Hua Securities Research estimates
Environmental accidents also delayed progress on expansion. Before the accidents,
Lingnan had successfully acquired Perilya and GlobeStar. The overseas acquisitions drove
rapid development. But the two accidents forced Lingnan to focus more on environmental
safety in mining regions and refineries, especially at the relocation and upgrades to new
sites for the Shaoguan refinery, which is an area of focus for the company in 2013-2014.
We think as a result of this, the pace of expansion will slow somewhat.
The accidents have also caused Lingnan’s stock price to slide from outperforming to underperforming the sector. In October 2010, in the six months
preceding the Shaoguan refinery accident, Lingnan’s stock price rose 48% while the zinc
and lead industry as a whole rose 45% and Chihong’s stock price rose 25.6%. But from the
Shaoguan accident until the lead poisoning on March 5, 2012, Lingnan’s stock price fell
39.3% while the sector declined 34% and Chihong’s stock price fell 17.3%. In the six months
363.8
132.4 143.9
250.0
-
50.0
100.0
150.0
200.0
250.0
300.0
350.0
400.0
2010 2011 2012 2013E
Smelting production
for Lingnan
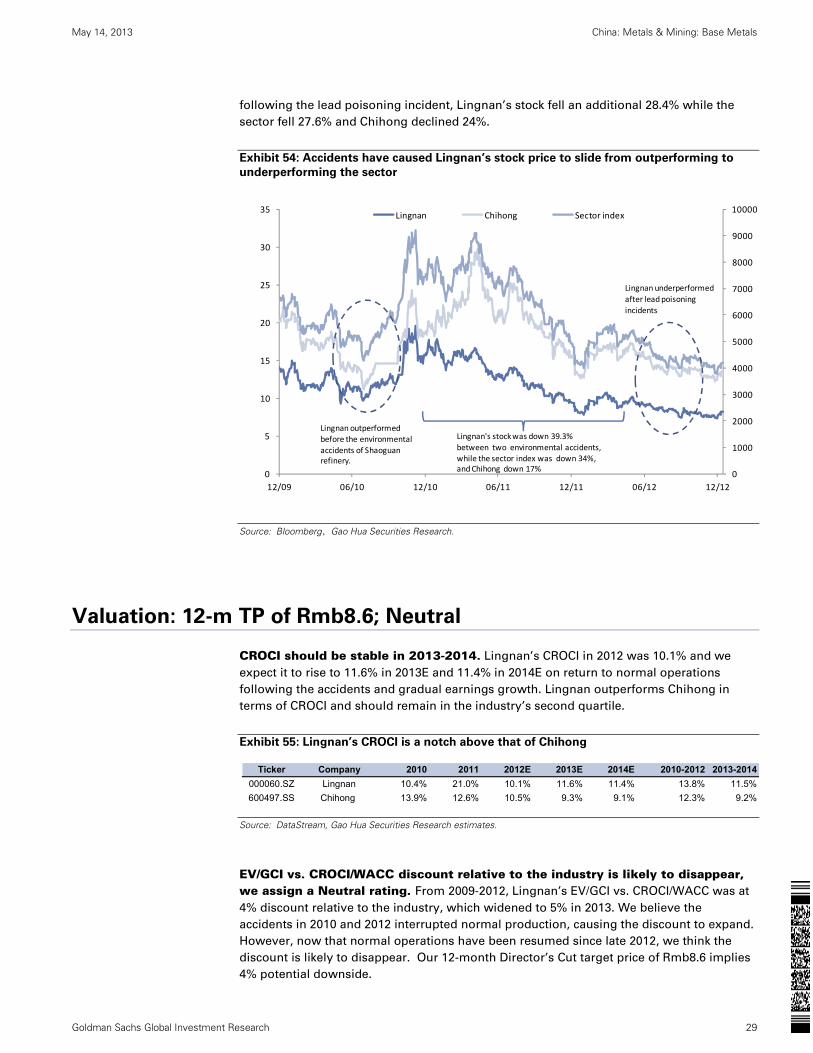
May 14, 2013 China: Metals & Mining: Base Metals
Goldman Sachs Global Investment Research 29
following the lead poisoning incident, Lingnan’s stock fell an additional 28.4% while the
sector fell 27.6% and Chihong declined 24%.
Exhibit 54: Accidents have caused Lingnan’s stock price to slide from outperforming to
underperforming the sector
Source: Bloomberg、Gao Hua Securities Research.
Valuation: 12-m TP of Rmb8.6; Neutral
CROCI should be stable in 2013-2014. Lingnan’s CROCI in 2012 was 10.1% and we
expect it to rise to 11.6% in 2013E and 11.4% in 2014E on return to normal operations
following the accidents and gradual earnings growth. Lingnan outperforms Chihong in
terms of CROCI and should remain in the industry’s second quartile.
Exhibit 55: Lingnan’s CROCI is a notch above that of Chihong
Source: DataStream, Gao Hua Securities Research estimates.
EV/GCI vs. CROCI/WACC discount relative to the industry is likely to disappear, we assign a Neutral rating. From 2009-2012, Lingnan’s EV/GCI vs. CROCI/WACC was at
4% discount relative to the industry, which widened to 5% in 2013. We believe the
accidents in 2010 and 2012 interrupted normal production, causing the discount to expand.
However, now that normal operations have been resumed since late 2012, we think the
discount is likely to disappear. Our 12-month Director’s Cut target price of Rmb8.6 implies
4% potential downside.
0
1000
2000
3000
4000
5000
6000
7000
8000
9000
10000
0
5
10
15
20
25
30
35
12/09 06/10 12/10 06/11 12/11 06/12 12/12
Lingnan Chihong Sector index
Lingnan outperformed before the environmental
accidents of Shaoguan refinery.
Lingnan's stock was down 39.3%
between two environmental accidents, while the sector index was down 34%, and Chihong down 17%
Lingnan underperformed
after lead poisoning
incidents
Ticker Company 2010 2011 2012E 2013E 2014E 2010-2012 2013-2014
000060.SZ Lingnan 10.4% 21.0% 10.1% 11.6% 11.4% 13.8% 11.5%
600497.SS Chihong 13.9% 12.6% 10.5% 9.3% 9.1% 12.3% 9.2%
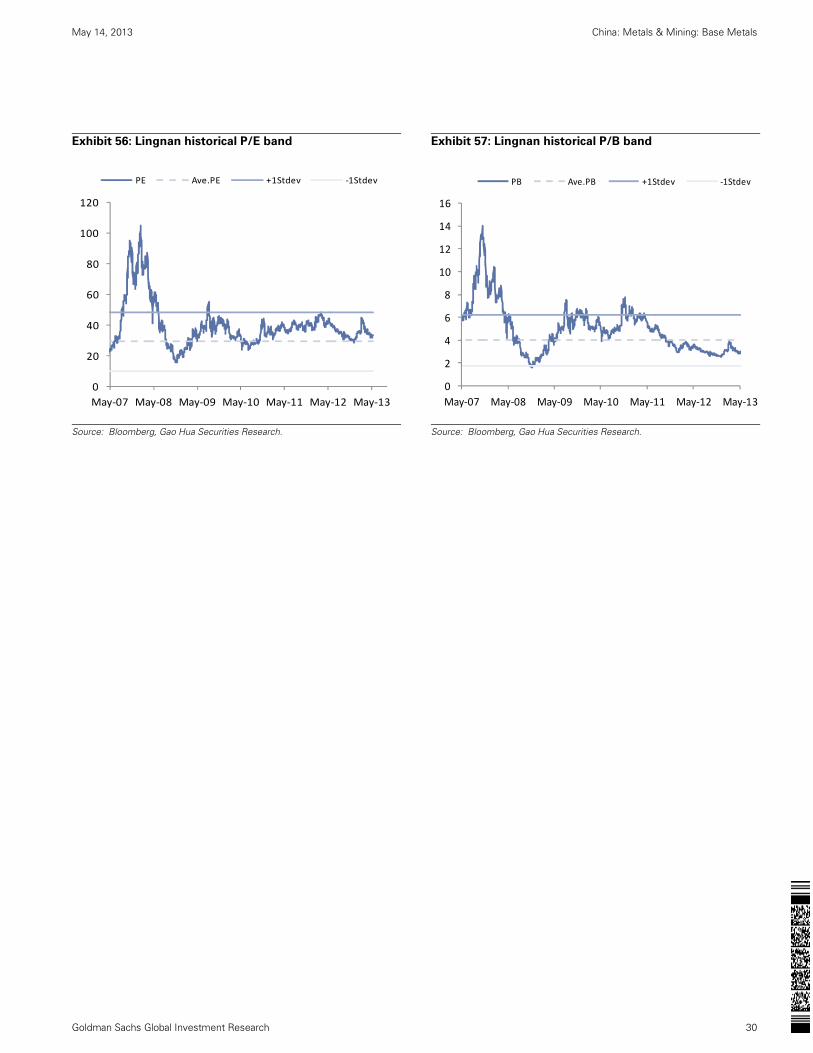
May 14, 2013 China: Metals & Mining: Base Metals
Goldman Sachs Global Investment Research 30
Exhibit 56: Lingnan historical P/E band
Exhibit 57: Lingnan historical P/B band
Source: Bloomberg, Gao Hua Securities Research.
Source: Bloomberg, Gao Hua Securities Research.
0
20
40
60
80
100
120
May‐07 May‐08 May‐09 May‐10 May‐11 May‐12 May‐13
PE Ave.PE +1Stdev ‐1Stdev
0
2
4
6
8
10
12
14
16
May‐07 May‐08 May‐09 May‐10 May‐11 May‐12 May‐13
PB Ave.PB +1Stdev ‐1Stdev

May 14, 2013 China: Metals & Mining: Base Metals
Goldman Sachs Global Investment Research 31
Disclosure Appendix
Reg AC
We, Jefferson Zhang and Yong Han, CFA, hereby certify that all of the views expressed in this report accurately reflect our personal views about the
subject company or companies and its or their securities. We also certify that no part of our compensation was, is or will be, directly or indirectly,
related to the specific recommendations or views expressed in this report.
Investment Profile
The Goldman Sachs Investment Profile provides investment context for a security by comparing key attributes of that security to its peer group and
market. The four key attributes depicted are: growth, returns, multiple and volatility. Growth, returns and multiple are indexed based on composites
of several methodologies to determine the stocks percentile ranking within the region's coverage universe.
The precise calculation of each metric may vary depending on the fiscal year, industry and region but the standard approach is as follows:
Growth is a composite of next year's estimate over current year's estimate, e.g. EPS, EBITDA, Revenue. Return is a year one prospective aggregate
of various return on capital measures, e.g. CROCI, ROACE, and ROE. Multiple is a composite of one-year forward valuation ratios, e.g. P/E, dividend
yield, EV/FCF, EV/EBITDA, EV/DACF, Price/Book. Volatility is measured as trailing twelve-month volatility adjusted for dividends.
Quantum
Quantum is Goldman Sachs' proprietary database providing access to detailed financial statement histories, forecasts and ratios. It can be used for
in-depth analysis of a single company, or to make comparisons between companies in different sectors and markets.
GS SUSTAIN
GS SUSTAIN is a global investment strategy aimed at long-term, long-only performance with a low turnover of ideas. The GS SUSTAIN focus list
includes leaders our analysis shows to be well positioned to deliver long term outperformance through sustained competitive advantage and
superior returns on capital relative to their global industry peers. Leaders are identified based on quantifiable analysis of three aspects of corporate
performance: cash return on cash invested, industry positioning and management quality (the effectiveness of companies' management of the
environmental, social and governance issues facing their industry).
Disclosures
Coverage group(s) of stocks by primary analyst(s)
Jefferson Zhang: Asia Commodities Companies, Asia Energy. Yong Han, CFA: Asia Commodities Companies, Asia Energy.
Asia Commodities Companies: ACC, Aluminum Corporation of China (A), Aluminum Corporation of China (H), Ambuja Cements, Angang Steel (A),
Angang Steel (H), Anhui Conch Cement (A), Anhui Conch Cement (H), Asia Cement, Asia Cement China Holdings, BBMG Corporation (A), BBMG
Corporation (H), Banpu Public Company, Baoshan Iron & Steel, Borneo Lumbung Energi and Metal Tbk PT, Bumi Resources, China Coal Energy (A),
China Coal Energy (H), China Molybdenum Co., China National Building Material, China Resources Cement Holdings, China Shanshui Cement Group,
China Shenhua Energy (A), China Shenhua Energy (H), China Steel (GDR), China Steel Corporation, Coal India Ltd., Grasim Industries, Harum Energy
Tbk PT, Hidili Industry International Development, India Cements, Jiangxi Copper (A), Jiangxi Copper (H), Korea Zinc, Maanshan Iron & Steel (A),
Maanshan Iron & Steel (H), Mongolian Mining Corp., PT Adaro Energy Tbk, PT Indo Tambangraya Megah, PT Tambang Batubara Bukit Asam,
Shandong Gold Mining Co, Shenzhen Zhongjin Lingnan Nonfemet, Shougang Fushan Resources Group, Shree Cement Ltd, TCC International
Holdings, Taiwan Cement, Tongling Nonferrous Metals Group Co., Ultratech Cement, Yanzhou Coal Mining (A), Yanzhou Coal Mining (H), Yunnan
Chihong Zinc & Germanium, Yunnan Copper Co., Zhaojin Mining Industry, Zhongjin Gold, Zijin Mining (A), Zijin Mining (H).
Asia Energy: Beijing Haohua Energy Resource, Datong Coal Industry, Guizhou Panjiang Refined Coal, Henan Shen Huo Coal Industry & Electricity
Power Co., Huolinhe Opencut Coal, Inner Mongolia Yitai Coal Co Ltd, Jizhong Energy Resources, Kailuan Energy Chemical, Pingdingshan Tianan Coal
Mining, Pingzhuang Energy Resources, SDIC Xinji Energy Co., Shanxi Coal International Energy Group Co., Shanxi Lanhua Sci-Tech Venture, Shanxi
Lu'an Environmental Energy Development, Shanxi Xishan Coal and Electricity Power, Yangquan Coal Industry Group, Yitai Coal, Yuanxing Energy.

May 14, 2013 China: Metals & Mining: Base Metals
Goldman Sachs Global Investment Research 32
Company-specific regulatory disclosures
The following disclosures relate to relationships between The Goldman Sachs Group, Inc. (with its affiliates, "Goldman Sachs") and companies
covered by the Global Investment Research Division of Goldman Sachs and referred to in this research.
Goldman Sachs expects to receive or intends to seek compensation for investment banking services in the next 3 months: Yunnan Chihong Zinc &
Germanium (Rmb11.71)
There are no company-specific disclosures for: Shenzhen Zhongjin Lingnan Nonfemet (Rmb8.94)
Distribution of ratings/investment banking relationships
Goldman Sachs Investment Research global coverage universe
Rating Distribution Investment Banking Relationships
Buy Hold Sell Buy Hold Sell
Global 31% 54% 15% 49% 42% 36%
As of April 1, 2013, Goldman Sachs Global Investment Research had investment ratings on 3,492 equity securities. Goldman Sachs assigns stocks as
Buys and Sells on various regional Investment Lists; stocks not so assigned are deemed Neutral. Such assignments equate to Buy, Hold and Sell for
the purposes of the above disclosure required by NASD/NYSE rules. See 'Ratings, Coverage groups and views and related definitions' below.
Price target and rating history chart(s)
Regulatory disclosures
Disclosures required by United States laws and regulations
See company-specific regulatory disclosures above for any of the following disclosures required as to companies referred to in this report: manager
or co-manager in a pending transaction; 1% or other ownership; compensation for certain services; types of client relationships; managed/co-
managed public offerings in prior periods; directorships; for equity securities, market making and/or specialist role. Goldman Sachs usually makes a
market in fixed income securities of issuers discussed in this report and usually deals as a principal in these securities.
The following are additional required disclosures: Ownership and material conflicts of interest: Goldman Sachs policy prohibits its analysts,
professionals reporting to analysts and members of their households from owning securities of any company in the analyst's area of
coverage. Analyst compensation: Analysts are paid in part based on the profitability of Goldman Sachs, which includes investment banking
revenues. Analyst as officer or director: Goldman Sachs policy prohibits its analysts, persons reporting to analysts or members of their
households from serving as an officer, director, advisory board member or employee of any company in the analyst's area of coverage. Non-U.S. Analysts: Non-U.S. analysts may not be associated persons of Goldman, Sachs & Co. and therefore may not be subject to NASD Rule 2711/NYSE
Rules 472 restrictions on communications with subject company, public appearances and trading securities held by the analysts.
Distribution of ratings: See the distribution of ratings disclosure above. Price chart: See the price chart, with changes of ratings and price targets in
prior periods, above, or, if electronic format or if with respect to multiple companies which are the subject of this report, on the Goldman Sachs
website at http://www.gs.com/research/hedge.html.
Additional disclosures required under the laws and regulations of jurisdictions other than the United States
The following disclosures are those required by the jurisdiction indicated, except to the extent already made above pursuant to United States laws
and regulations. Australia: Goldman Sachs Australia Pty Ltd and its affiliates are not authorised deposit-taking institutions (as that term is defined in
the Banking Act 1959 (Cth)) in Australia and do not provide banking services, nor carry on a banking business, in Australia. This research, and any
access to it, is intended only for "wholesale clients" within the meaning of the Australian Corporations Act, unless otherwise agreed by Goldman
Sachs. Brazil: Disclosure information in relation to CVM Instruction 483 is available at http://www.gs.com/worldwide/brazil/area/gir/index.html.
Where applicable, the Brazil-registered analyst primarily responsible for the content of this research report, as defined in Article 16 of CVM Instruction
483, is the first author named at the beginning of this report, unless indicated otherwise at the end of the text. Canada: Goldman, Sachs & Co. has
approved of, and agreed to take responsibility for, this research in Canada if and to the extent it relates to equity securities of Canadian issuers.
Analysts may conduct site visits but are prohibited from accepting payment or reimbursement by the company of travel expenses for such
visits. Hong Kong: Further information on the securities of covered companies referred to in this research may be obtained on request from
Goldman Sachs (Asia) L.L.C. India: Further information on the subject company or companies referred to in this research may be obtained from
Goldman Sachs (India) Securities Private Limited; Japan: See below. Korea: Further information on the subject company or companies referred to
in this research may be obtained from Goldman Sachs (Asia) L.L.C., Seoul Branch. New Zealand: Goldman Sachs New Zealand Limited and its
Shenzhen Zhongjin Lingnan Nonfemet (000060.SZ)
11.212.2
8.85
5.00
7.00
9.00
11.00
13.00
15.00
17.00
19.00
600
800
1,000
1,200
1,400
1,600
Goldman Sachs rating and stock price target history
Stock Price Currency : Chinese Renminbi
Source: Goldman Sachs Investment Research for ratings and price targets; FactSet closing prices as of 3/31/2013.
The price targets show n should be considered in the context of all prior published Goldman Sachs research, w hich may or may not have included price targets, as w ell as developments relating to the company, its industry and f inancial markets.
Rating
Price target
Price target at removal
Covered by current analyst
Not covered by current analyst
Shenzhen A Index
Inde
x P
rice
Sto
ck P
rice Mar 2 Mar 15 Sep 24
N NA BM
CSJ J A S O N D J F M A M J J A S O N D J F M A M J J A S O N D J F M
2010 2011 2012 2013
Yunnan Chihong Zinc & Germanium (600497.SS)
13.8316.79
7.5614.02
5
10
15
20
25
30
2,000
2,200
2,400
2,600
2,800
3,000
3,200
3,400
Goldman Sachs rating and stock price target history
Stock Price Currency : Chinese Renminbi
Source: Goldman Sachs Investment Research for ratings and price targets; FactSet closing prices as of 3/31/2013.
The price targets show n should be considered in the context of all prior published Goldman Sachs research, w hich may or may not have included price targets, as w ell as developments relating to the company, its industry and f inancial markets.
Rating
Price target
Price target at removal
Covered by current analyst
Not covered by current analyst
Shanghai SE A Share Index
Inde
x P
rice
Sto
ck P
rice Mar 2 Mar 15 Sep 24
S NA NM
CSJ J A S O N D J F M A M J J A S O N D J F M A M J J A S O N D J F M
2010 2011 2012 2013
May 14, 2013 China: Metals & Mining: Base Metals
Goldman Sachs Global Investment Research 33
affiliates are neither "registered banks" nor "deposit takers" (as defined in the Reserve Bank of New Zealand Act 1989) in New Zealand. This research,
and any access to it, is intended for "wholesale clients" (as defined in the Financial Advisers Act 2008) unless otherwise agreed by Goldman
Sachs. Russia: Research reports distributed in the Russian Federation are not advertising as defined in the Russian legislation, but are information
and analysis not having product promotion as their main purpose and do not provide appraisal within the meaning of the Russian legislation on
appraisal activity. Singapore: Further information on the covered companies referred to in this research may be obtained from Goldman Sachs
(Singapore) Pte. (Company Number: 198602165W). Taiwan: This material is for reference only and must not be reprinted without permission.
Investors should carefully consider their own investment risk. Investment results are the responsibility of the individual investor. United Kingdom: Persons who would be categorized as retail clients in the United Kingdom, as such term is defined in the rules of the Financial Services
Authority, should read this research in conjunction with prior Goldman Sachs research on the covered companies referred to herein and should refer
to the risk warnings that have been sent to them by Goldman Sachs International. A copy of these risks warnings, and a glossary of certain financial
terms used in this report, are available from Goldman Sachs International on request.
European Union: Disclosure information in relation to Article 4 (1) (d) and Article 6 (2) of the European Commission Directive 2003/126/EC is available
at http://www.gs.com/disclosures/europeanpolicy.html which states the European Policy for Managing Conflicts of Interest in Connection with
Investment Research.
Japan: Goldman Sachs Japan Co., Ltd. is a Financial Instrument Dealer registered with the Kanto Financial Bureau under registration number Kinsho
69, and a member of Japan Securities Dealers Association, Financial Futures Association of Japan and Type II Financial Instruments Firms
Association. Sales and purchase of equities are subject to commission pre-determined with clients plus consumption tax. See company-specific
disclosures as to any applicable disclosures required by Japanese stock exchanges, the Japanese Securities Dealers Association or the Japanese
Securities Finance Company.
Ratings, coverage groups and views and related definitions
Buy (B), Neutral (N), Sell (S) -Analysts recommend stocks as Buys or Sells for inclusion on various regional Investment Lists. Being assigned a Buy
or Sell on an Investment List is determined by a stock's return potential relative to its coverage group as described below. Any stock not assigned as
a Buy or a Sell on an Investment List is deemed Neutral. Each regional Investment Review Committee manages various regional Investment Lists to a
global guideline of 25%-35% of stocks as Buy and 10%-15% of stocks as Sell; however, the distribution of Buys and Sells in any particular coverage
group may vary as determined by the regional Investment Review Committee. Regional Conviction Buy and Sell lists represent investment
recommendations focused on either the size of the potential return or the likelihood of the realization of the return.
Return potential represents the price differential between the current share price and the price target expected during the time horizon associated
with the price target. Price targets are required for all covered stocks. The return potential, price target and associated time horizon are stated in each
report adding or reiterating an Investment List membership.
Coverage groups and views: A list of all stocks in each coverage group is available by primary analyst, stock and coverage group at
http://www.gs.com/research/hedge.html. The analyst assigns one of the following coverage views which represents the analyst's investment outlook
on the coverage group relative to the group's historical fundamentals and/or valuation. Attractive (A). The investment outlook over the following 12
months is favorable relative to the coverage group's historical fundamentals and/or valuation. Neutral (N). The investment outlook over the
following 12 months is neutral relative to the coverage group's historical fundamentals and/or valuation. Cautious (C). The investment outlook over
the following 12 months is unfavorable relative to the coverage group's historical fundamentals and/or valuation.
Not Rated (NR). The investment rating and target price have been removed pursuant to Goldman Sachs policy when Goldman Sachs is acting in an
advisory capacity in a merger or strategic transaction involving this company and in certain other circumstances. Rating Suspended (RS). Goldman
Sachs Research has suspended the investment rating and price target for this stock, because there is not a sufficient fundamental basis for
determining, or there are legal, regulatory or policy constraints around publishing, an investment rating or target. The previous investment rating and
price target, if any, are no longer in effect for this stock and should not be relied upon. Coverage Suspended (CS). Goldman Sachs has suspended
coverage of this company. Not Covered (NC). Goldman Sachs does not cover this company. Not Available or Not Applicable (NA). The
information is not available for display or is not applicable. Not Meaningful (NM). The information is not meaningful and is therefore excluded.
Global product; distributing entities
The Global Investment Research Division of Goldman Sachs produces and distributes research products for clients of Goldman Sachs on a global
basis. Analysts based in Goldman Sachs offices around the world produce equity research on industries and companies, and research on
macroeconomics, currencies, commodities and portfolio strategy. This research is disseminated in Australia by Goldman Sachs Australia Pty Ltd
(ABN 21 006 797 897); in Brazil by Goldman Sachs do Brasil Corretora de Títulos e Valores Mobiliários S.A.; in Canada by Goldman, Sachs & Co.
regarding Canadian equities and by Goldman, Sachs & Co. (all other research); in Hong Kong by Goldman Sachs (Asia) L.L.C.; in India by Goldman
Sachs (India) Securities Private Ltd.; in Japan by Goldman Sachs Japan Co., Ltd.; in the Republic of Korea by Goldman Sachs (Asia) L.L.C., Seoul
Branch; in New Zealand by Goldman Sachs New Zealand Limited; in Russia by OOO Goldman Sachs; in Singapore by Goldman Sachs (Singapore)
Pte. (Company Number: 198602165W); and in the United States of America by Goldman, Sachs & Co. Goldman Sachs International has approved this
research in connection with its distribution in the United Kingdom and European Union.
European Union: Goldman Sachs International, authorized and regulated by the Financial Services Authority, has approved this research in
connection with its distribution in the European Union and United Kingdom; Goldman Sachs AG and Goldman Sachs International
Zweigniederlassung Frankfurt, regulated by the Bundesanstalt für Finanzdienstleistungsaufsicht, may also distribute research in Germany.
General disclosures
This research is for our clients only. Other than disclosures relating to Goldman Sachs, this research is based on current public information that we
consider reliable, but we do not represent it is accurate or complete, and it should not be relied on as such. We seek to update our research as
appropriate, but various regulations may prevent us from doing so. Other than certain industry reports published on a periodic basis, the large
majority of reports are published at irregular intervals as appropriate in the analyst's judgment.
Goldman Sachs conducts a global full-service, integrated investment banking, investment management, and brokerage business. We have
investment banking and other business relationships with a substantial percentage of the companies covered by our Global Investment Research
Division. Goldman, Sachs & Co., the United States broker dealer, is a member of SIPC (http://www.sipc.org).
Our salespeople, traders, and other professionals may provide oral or written market commentary or trading strategies to our clients and our
proprietary trading desks that reflect opinions that are contrary to the opinions expressed in this research. Our asset management area, our
proprietary trading desks and investing businesses may make investment decisions that are inconsistent with the recommendations or views
expressed in this research.

May 14, 2013 China: Metals & Mining: Base Metals
Goldman Sachs Global Investment Research 34
The analysts named in this report may have from time to time discussed with our clients, including Goldman Sachs salespersons and traders, or may
discuss in this report, trading strategies that reference catalysts or events that may have a near-term impact on the market price of the equity
securities discussed in this report, which impact may be directionally counter to the analysts' published price target expectations for such stocks. Any
such trading strategies are distinct from and do not affect the analysts' fundamental equity rating for such stocks, which rating reflects a stock's
return potential relative to its coverage group as described herein.
We and our affiliates, officers, directors, and employees, excluding equity and credit analysts, will from time to time have long or short positions in,
act as principal in, and buy or sell, the securities or derivatives, if any, referred to in this research.
This research is not an offer to sell or the solicitation of an offer to buy any security in any jurisdiction where such an offer or solicitation would be
illegal. It does not constitute a personal recommendation or take into account the particular investment objectives, financial situations, or needs of
individual clients. Clients should consider whether any advice or recommendation in this research is suitable for their particular circumstances and, if
appropriate, seek professional advice, including tax advice. The price and value of investments referred to in this research and the income from them
may fluctuate. Past performance is not a guide to future performance, future returns are not guaranteed, and a loss of original capital may occur.
Fluctuations in exchange rates could have adverse effects on the value or price of, or income derived from, certain investments.
Certain transactions, including those involving futures, options, and other derivatives, give rise to substantial risk and are not suitable for all investors.
Investors should review current options disclosure documents which are available from Goldman Sachs sales representatives or at
http://www.theocc.com/about/publications/character-risks.jsp. Transaction costs may be significant in option strategies calling for multiple purchase
and sales of options such as spreads. Supporting documentation will be supplied upon request.
In producing research reports, members of the Global Investment Research Division of Goldman Sachs Australia may attend site visits and other
meetings hosted by the issuers the subject of its research reports. In some instances the costs of such site visits or meetings may be met in part or in
whole by the issuers concerned if Goldman Sachs Australia considers it is appropriate and reasonable in the specific circumstances relating to the
site visit or meeting.
All research reports are disseminated and available to all clients simultaneously through electronic publication to our internal client websites. Not all
research content is redistributed to our clients or available to third-party aggregators, nor is Goldman Sachs responsible for the redistribution of our
research by third party aggregators. For all research available on a particular stock, please contact your sales representative or go to
http://360.gs.com.
Disclosure information is also available at http://www.gs.com/research/hedge.html or from Research Compliance, 200 West Street, New York, NY
10282.
© 2013 Goldman Sachs.
No part of this material may be (i) copied, photocopied or duplicated in any form by any means or (ii) redistributed without the prior written consent of The Goldman Sachs Group, Inc.