
China Mengniu Dairy Company Limited 2014 Interim Results · The presentation is prepared by China...
27
China Mengniu Dairy Company Limited 2014 Interim Results Stock Code: 2319 August 2014
Transcript of China Mengniu Dairy Company Limited 2014 Interim Results · The presentation is prepared by China...

China Mengniu Dairy Company Limited
2014 Interim Results
Stock Code: 2319
August 2014

2
The presentation is prepared by China Mengniu Dairy Company Limited (the
“Company”) and is solely for the purpose of corporate communication and
general reference only. The presentation is not intended as an offer to sell, or to
solicit an offer to buy or to form any basis of investment decision for any class of
securities of the Company in any jurisdiction. All such information should not be
used or relied on without professional advice. The presentation is a brief
summary in nature and do not purport to be a complete description of the
Company, its business, its current or historical operating results or its future
business prospects. This presentation contains projections and forward looking
statements that may reflect the Company’s current views with respect to future
events and financial performance.
This presentation is provided without any warranty or representation of any kind,
either expressed or implied. The Company specifically disclaims all
responsibilities in respect of any use or reliance of any information, whether
financial or otherwise, contained in this presentation. The Company undertakes
no obligation to publicly update or revise any forward-looking statements,
whether as a result of new information, future events or otherwise.
Disclaimer

3
Sun Yiping, Executive Director & Chief Executive Officer
Bai Ying, Executive Director & Chief Operation Officer
Zhang Ping, Chief Financial Officer
Liu Shengli, Vice President of Sales
Jesper Fournaise Colding, Vice President of Strategy
Zhai Mei, Assistant Vice President of Public Relations
Thibaut Helleputte, General Manager of Mengniu Danone JV
Chris Kwok, Financial Controller & Company Secretary
Li Dongming, Executive Director & Vice President of Yashili
Management Team

Part 1 2014 Interim Results Review
4

5
Financial Highlights
RMB Million
For the Six Months Ended June 30
2014
Organic
Change
vs. 2013
2014
Consolidated
2013
Consolidated
Change
vs. 2013
Revenue 24,290.1 17.5% 25,835.8 20,667.9 25.0%
Gross Profit 7,548.6 36.8% 8,381.8 5,518.8 51.9%
Gross Profit
Margin 31.08% 4.38ppt 32.44% 26.70% 5.74ppt
EBITDA 1,793.4 19.3% 2,041.9 1,503.6 35.8%
EBITDA Margin 7.38% 0.10ppt 7.90% 7.28% 0.62ppt
Profit Attributable to
Owners of the
Company 931.0 24.2% 1,048.6 749.5 39.9%
Net Profit
Margin 3.83% 0.20ppt 4.06% 3.63% 0.43ppt
Basic EPS
(RMB) 0.480 14.6% 0.540 0.419 28.9%
6
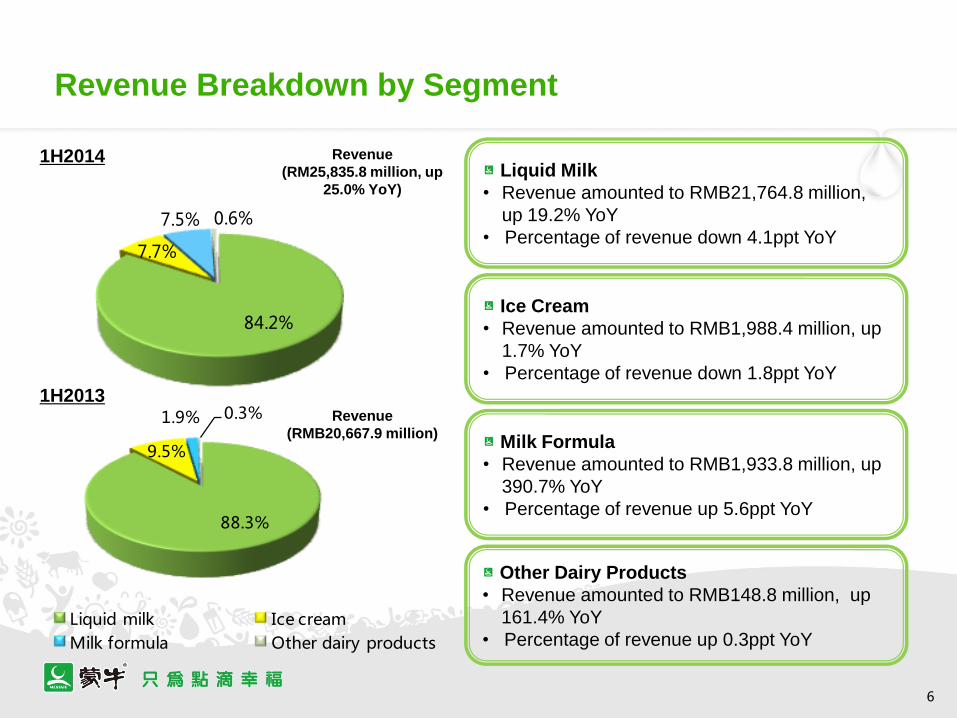
Revenue Breakdown by Segment
Liquid Milk
• Revenue amounted to RMB21,764.8 million,
up 19.2% YoY
• Percentage of revenue down 4.1ppt YoY
Ice Cream
• Revenue amounted to RMB1,988.4 million, up
1.7% YoY
• Percentage of revenue down 1.8ppt YoY
Milk Formula
• Revenue amounted to RMB1,933.8 million, up
390.7% YoY
• Percentage of revenue up 5.6ppt YoY
1H2014
1H2013
Other Dairy Products
• Revenue amounted to RMB148.8 million, up
161.4% YoY
• Percentage of revenue up 0.3ppt YoY
88.3%
9.5%
1.9% 0.3%
Liquid milk Ice cream
Milk formula Other dairy products
Revenue
(RM25,835.8 million, up
25.0% YoY)
Revenue
(RMB20,667.9 million)
84.2%
7.7%
7.5% 0.6%

58.5%26.8%
14.7%
59.9%25.9%
14.2%
UHT milk Milk beverages Yogurt
7
Revenue Breakdown of Liquid Milk Segment
UHT Milk
• Revenue amounted to RMB12,737.4 million, up
16.4% YoY
• Percentage of liquid milk revenue down 1.4ppt YoY
Milk Beverages
• Revenue amounted to RMB5,826.2 million, up
23.1% YoY
• Percentage of liquid milk revenue up 0.9ppt YoY
Yogurt
• Revenue amounted to RMB3,201.2 million, up
23.6% YoY
• Percentage of liquid milk revenue up 0.5ppt YoY
1H2014
1H2013
Revenue of Liquid Milk
(RMB21,764.8 million, up
19.2% YoY)
Revenue of Liquid Milk
(RMB18,262.5 million)

8
Market Share
Liquid Milk UHT Products
Chilled Products
1H2013 1H2014
25.5% 25.2%
22.8% 23.7%
12.3% 10.0%
7.5% 8.0%
31.9% 33.1%
Mengniu A B C Others
1H2013 1H2014
27.3% 27.6%
25.5% 27.0%
15.8% 13.0% 7.3% 7.0%
24.1% 25.4%
Mengniu A B C Others
1H2013 1H2014
19.5% 18.5%
18.7% 18.3%
13.5% 13.9%
7.2% 7.7%
41.1% 41.6%
Mengniu A B Junlebao Others

839.5 979.2
1,387.1
2,751.8
57.8
57.8
124.1
40.2
40.2
Plants & Equiments
Equity Investment
Biological Assets
12,596.5
9
2,331.6
1,578.5 1,546.5
Cash Flow & CAPEX
Net Cash Inflow from
Operating Activities
(RMB Million)
Capital Expenditure
(RMB Million)
1H2013 1H2014
Organic
1H2014
Consolidated
1H2013 1H2014
Organic
3,715.4
1,485.1
1,077.2
1H2014
Consolidated

801.4860.0
962.03,806.9
5,325.2
5,897.1
18.4%
21.9% 22.8%
10
(RMB Million) (RMB Million)
S&D G&A
SG&A Expenses
1H2013 1H2014
Organic
1H2013 1H2014
Organic
Expenses Percentage of total revenue
3.9%
3.5% 3.7%
1H2014
Consolidated
1H2014
Consolidated

48.5 50.0 51.2
8.7
7.37.1
16.4
28.636.5
11
1H2013 1H2013 1H2013
Operating Efficiency Index
Inventory Turnover Receivables Turnover (1) Payables Turnover (2)
(1)Receivables Turnover = [Average Balance of Trade and Bills Receivables / Revenue] x No. of days
(2)Payables Turnover = [Average Balance of Trade and Bills Payables / Cost of Sales] x No. of days
(Day) (Day) (Day)
1H2014
Organic
1H2014
Consolidated
1H2014
Organic
1H2014
Consolidated
1H2014
Organic
1H2014
Consolidated

12
Part 2 1H2014 Business Overview

13
2014: Implementation of Winning Strategy
Strengthen milk sources
to secure quality supply
Expand retail network
to enhance penetration
Focus on star brands
to optimize product mix
Bolster innovation
to reinforce leading position
Optimize incentive plan
to strengthen talent pool
Integrate strategic resources
to implement five-year plan
Healthy
Development
of the Industry Consumer
Experience Quality and
Safety

14
第三部分 2014年展望
2014 Key Words

15
O
O2O T
TBM
P
WSP
Innovation: Embracing Digital Marketing
System Innovation Marketing Innovation E-commerce
From
“Scan me,
I take you to
the farm”
to
“Cloud-viewable”
>20% marketing
spending on digital media
Establish Information &
Innovative Development
Team
Develop applications to
build up an integrated
digital marketing platform
Strengthen digital
capabilities
Promoting new products
Services for distributors
Consumer insights
214 mil views
187 mil participants

16
Sustainable Profitable Growth
1. Portfolio Management 2. Operating Efficiency
Optimization
3. Prudent OPEX and
CAPEX
Focus on 3 high margin
brands: Yoyi C, Champion
Yogurt, Bio
Reduce the number of
SKUs
Upgrade taste and
packaging
Increase utilization rate
Enhance production and
operation efficiency
Cost control and efficiency
improvement
Focus A&P on 3 major
brands
Prudent CAPEX
Revenue Operating
Margin
Integration (1): Mengniu & Danone

17
Integration (2): Mengniu & Arla
Import Business Technology Sharing Lean Management
Project
Established China-Denmark Milk
Technology Cooperation Center
Commenced fingerprint spectrum
project and developed raw milk
testing technology
Introduced quality management
from Arla Gaarden and built ranch
technology standardization system
Went through value chain to
identify value-added points
Launched「Lean」projects,
including quality
improvement, supply-
demand balance, etc., to
lower the cost, improve
quality and shorten the
production cycle
18
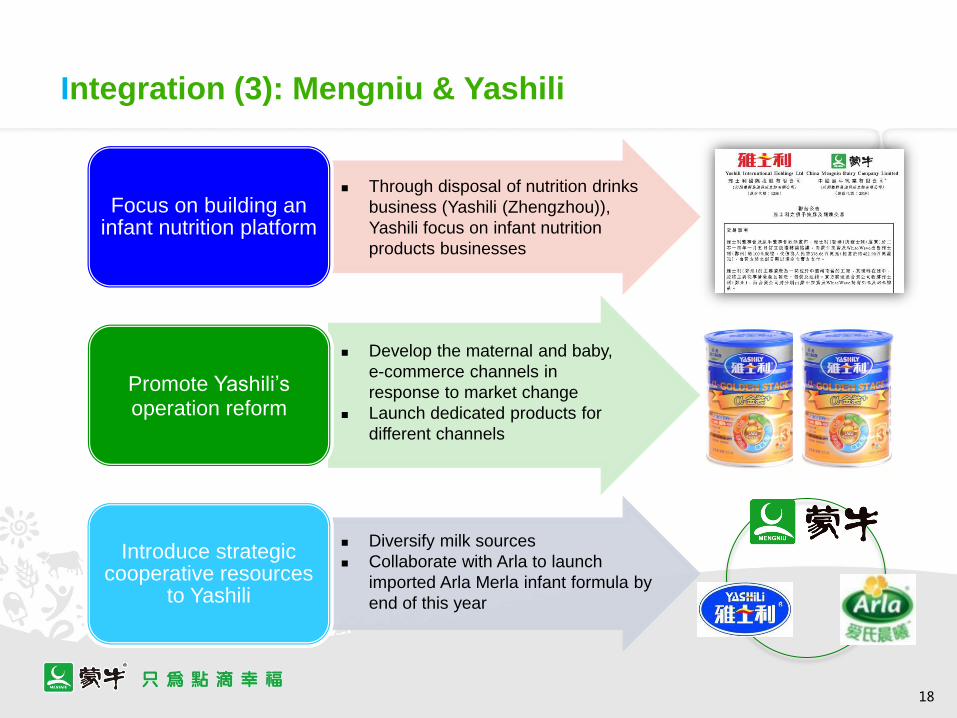
Integration (3): Mengniu & Yashili
Focus on building an infant nutrition platform
Promote Yashili’s operation reform
Introduce strategic cooperative resources
to Yashili
Through disposal of nutrition drinks
business (Yashili (Zhengzhou)),
Yashili focus on infant nutrition
products businesses
Develop the maternal and baby,
e-commerce channels in
response to market change
Launch dedicated products for
different channels
Diversify milk sources
Collaborate with Arla to launch
imported Arla Merla infant formula by
end of this year

Joint Venture Progress
Establish Joint Venture with start-up activities on
track
Receive government approvals
Complete initial capital injection
Complete acquisition of Yashili (Zhengzhou)
Obtain approvals from Yashili independent
shareholders
Carry out construction and modification work to
the facility
19
Integration (4): Mengniu & WhiteWave
(51%)
(49%)
Next Step
To launch nutritious, healthy and innovative plant-
based beverage products by end of 2014 To shape the future of plant-based food and
beverages in China with WhiteWave (NYSE:
WWAV) while leading the development of dairy
industry

20
Investment: Investment along the Industry Value Chain
Mengniu’s Stake
~ 43%
~ 28%
~ 4%
~ 4%
(1117.HK)
(1431.HK)
(1432.HK)
25% of raw milk was
sourced from farming
companies which we
have equity investment
69% of raw milk was
sourced from our
cooperative farms
Leveraging small capital for big resources: To secure supply of
premium raw milk through small capital investment

Performance: Launch of SAP System to Improve
Operational Efficiency
21
SAP-ERP SAP-CRM 2.0
Pilot run at 3 plants, aiming to cover 50%
of plants by end of 2014
Cover 4 categories: UHT, chilled
products, ice cream and cheese
Apply in supply chain, quality
management and finance modules
Pilot run in 3 sales regions, aiming to
cover all sales regions by end of 2014
Cover 4 categories: UHT, chilled
products, ice cream and cheese
Cover management over comprehensive
range of sales procedures
Optimize operational efficiency,
provide accurate data support for better decision-making
Business and
finance management alignment Sophisticated management of sales

22
Brand
focus
Gross
margin
Marginal
profit
Market
potential
…
Performance: Key Brands to Profits
Categorize key brands
Star Brands Backbone
Brands
Profit
Contributor
Brands
Opportunity
Brands
More resources invested in star
brands and opportunity brands
Effective and selective
capital allocation
CAPEX
investment in
brands with
growth potential
Yoyi C,
Just
Yoghurt
Strict portfolio management
& efficiency enhancement
Gross margin improved
Optimize SKUs
Launch “Design to
Value” initiatives:
refining packaging,
recipes…
Brand value
increased
Brand image
improved
Emphasizing
Mengniu’s social
responsibility
Rebuild mother brand

23
Performance: Key Brands to Profits
*Revenue of Mengniu’s four major brand clusters (excluding milk formula, cheese and
Junlebao) as a percentage of Mengniu’s organic revenue.
Star brands
Backbone brands
Profit
Contributor brands
Opportunity brands
UHT
Yogurt/
Probiotic
Beverage
Milk
Beverage Ice Cream Fresh Milk
1H2013 1H2014
* % of Mengniu Revenue
34.3% 35.3%
43.7% 41.9%
10.5% 8.7%
3.5% 4.7%

Performance: Reinforce Sales Execution
24
Improve Retail
Management &
Service Quality
Increase market
penetration
Innovate in sales
information
management
Strengthen
distributor
management system
Build up sales
organization
capabilities

25
Open & Transparent Culture
Achieve cross-division, cross-system and cross-
cultural integration to build a stronger team
Build an innovative and efficient management
system to improve strategy execution
Build an attractive reward and incentive system to
motivate talents

26
Interpret “Little Happiness Matters” through
“A Drop of Goodness”
A
Brand
Positioning
Reinforcement of “Little Happiness
Matters”
B
Image
Upgrade
Brand new image for consumers
C
All-round
Communication
Deliver the message “A Drop of Goodness”
to the public
员工版 羽泉版
Star Citizens
Affectionate
Warm
Passion
Open
Heart-led
innovation
Brand Manifesto
Brand Elements
Upgrade VI System
Helin XI Experience Hall
“Each and every drop” Song and MV
Meng Federal
27
THANKS! 阳光
Sunshine
高尚 Nobility
责任 Responsibility
创新 Innovation


