China Fiber Optic (3777 HK) Emerson
31
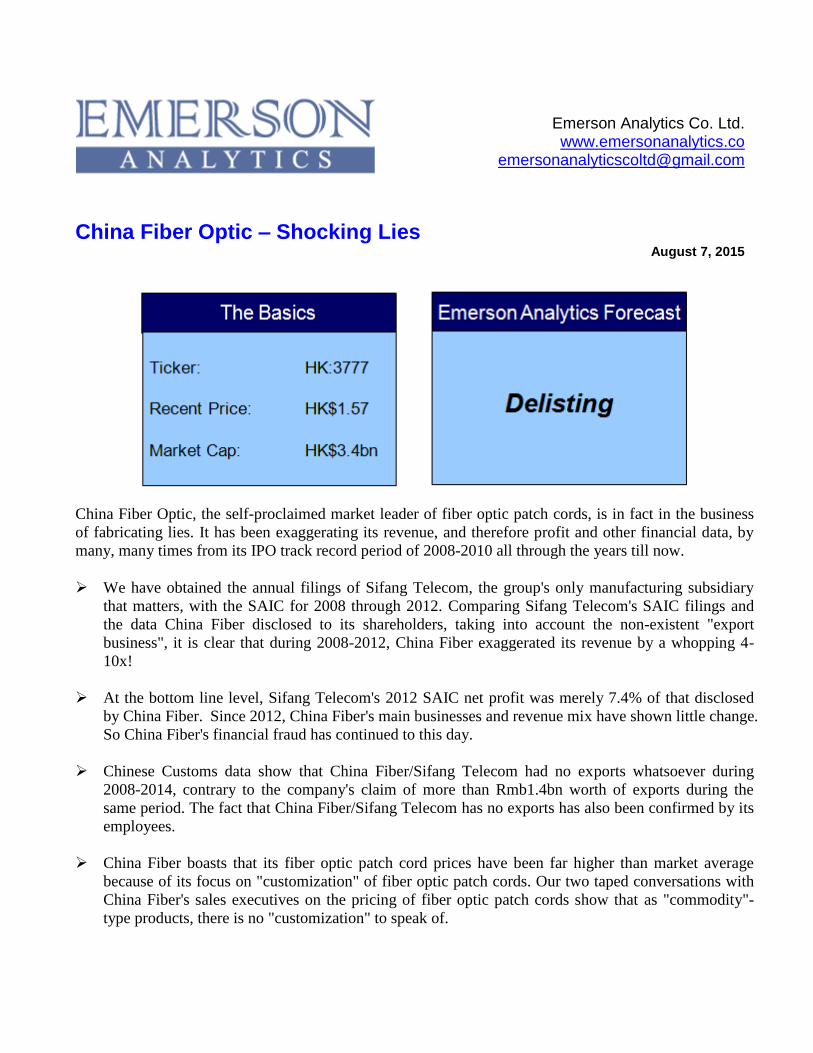
Emerson Analytics Co. Ltd. www.emersonanalytics.co [email protected] China Fiber Optic – Shocking Lies August 7, 2015 China Fiber Optic, the self-proclaimed market leader of fiber optic patch cords, is in fact in the business of fabricating lies. It has been exaggerating its revenue, and therefore profit and other financial data, by many, many times from its IPO track record period of 2008-2010 all through the years till now. We have obtained the annual filings of Sifang Telecom, the group's only manufacturing subsidiary that matters, with the SAIC for 2008 through 2012. Comparing Sifang Telecom's SAIC filings and the data China Fiber disclosed to its shareholders, taking into account the non-existent "export business", it is clear that during 2008-2012, China Fiber exaggerated its revenue by a whopping 4- 10x! At the bottom line level, Sifang Telecom's 2012 SAIC net profit was merely 7.4% of that disclosed by China Fiber. Since 2012, China Fiber's main businesses and revenue mix have shown little change. So China Fiber's financial fraud has continued to this day. Chinese Customs data show that China Fiber/Sifang Telecom had no exports whatsoever during 2008-2014, contrary to the company's claim of more than Rmb1.4bn worth of exports during the same period. The fact that China Fiber/Sifang Telecom has no exports has also been confirmed by its employees. China Fiber boasts that its fiber optic patch cord prices have been far higher than market average because of its focus on "customization" of fiber optic patch cords. Our two taped conversations with China Fiber's sales executives on the pricing of fiber optic patch cords show that as "commodity"- type products, there is no "customization" to speak of.
-
Upload
asianextractor -
Category
Business
-
view
61 -
download
5
Transcript of China Fiber Optic (3777 HK) Emerson
Emerson Analytics Co. Ltd. www.emersonanalytics.co [email protected]
China Fiber Optic – Shocking Lies August 7, 2015
China Fiber Optic, the self-proclaimed market leader of fiber optic patch cords, is in fact in the business
of fabricating lies. It has been exaggerating its revenue, and therefore profit and other financial data, by
many, many times from its IPO track record period of 2008-2010 all through the years till now.
We have obtained the annual filings of Sifang Telecom, the group's only manufacturing subsidiary
that matters, with the SAIC for 2008 through 2012. Comparing Sifang Telecom's SAIC filings and
the data China Fiber disclosed to its shareholders, taking into account the non-existent "export
business", it is clear that during 2008-2012, China Fiber exaggerated its revenue by a whopping 4-
10x!
At the bottom line level, Sifang Telecom's 2012 SAIC net profit was merely 7.4% of that disclosed
by China Fiber. Since 2012, China Fiber's main businesses and revenue mix have shown little change.
So China Fiber's financial fraud has continued to this day.
Chinese Customs data show that China Fiber/Sifang Telecom had no exports whatsoever during
2008-2014, contrary to the company's claim of more than Rmb1.4bn worth of exports during the
same period. The fact that China Fiber/Sifang Telecom has no exports has also been confirmed by its
employees.
China Fiber boasts that its fiber optic patch cord prices have been far higher than market average
because of its focus on "customization" of fiber optic patch cords. Our two taped conversations with
China Fiber's sales executives on the pricing of fiber optic patch cords show that as "commodity"-
type products, there is no "customization" to speak of.
China Fiber Optic – Shocking Lies
2
We have come to process a sales contract and its related invoice issued by China Fiber during the
first half of 2015. They clearly show that China Fiber was selling non-bundle patch cords at merely
Rmb6.32 per set, a price similar to those quoted by China Fiber's staff in taped conversations with
our investigators. This price was merely 1/8 of the 2012 full year average claimed by China Fiber.
The recent market average price for bundle patch cords with 12 connectors is about Rmb40.8 per set,
compared with Rmb38 and Rmb42 quoted by two separate China Fiber sales executives to our
investigators. These prices were also way below China Fiber's claim of Rmb134 per set for 2012.
Sifang Telecom SAIC filings reveal that China Fiber actually had very few telecom carrier clients.
Over the years, the trend has been one of shrinkage – shrinking from two carriers (China Mobile and
China Telecom) to just one (China Telecom), and from several provinces (Hunan, Guizhou,
Guangdong, and Hebei) to merely its home province (Hebei). Such a small client base cannot
possibly sustain China Fiber's relentless revenue growth that amounted to Rmb8.55bn over seven
years.
Using assumptions that are most favorable to China Fiber, we estimate, with two different methods,
that the company's actual revenue in 2012 was about Rmb287m or Rmb267m, respectively. The two
numbers are less than a fifth of the Rmb1.49bn reported by China Fiber, but we suspect even our
estimates are still too high.
This is a case of outrageous fraud. Delisting is the only appropriate outcome for a crime perpetuated
over at least five years.
China Fiber Optic – Shocking Lies
3
Table of Contents
Part 1. Annual SAIC Filings Deviate Significantly from Reports to Shareholders ............................................................... 6
1.1. Sifang Telecom is the Only Subsidiary That Matters ......................................................................................................... 6
1.2. SAIC Filing Shows China Fiber Numbers Hugely Inflated ............................................................................................... 8
1.3. Revenue Inflated 3.5-4.8x from 2009 to 2012 .................................................................................................................. 11
Part 2. What Exports? ............................................................................................................................................................... 12
2.1. China Fiber's Export Business Model .............................................................................................................................. 12
2.2. Sifang Telecom No Show in China Customs Data ........................................................................................................... 14
2.3. Sifang Telecom Staff Confirm No Exports ....................................................................................................................... 15
Part 3. Impossibly High Unit Prices ......................................................................................................................................... 17
3.1. China Fiber's Unit Price Disclosures .............................................................................................................................. 17
3.2. What are Patch Cords? .................................................................................................................................................... 18
3.3. The Convenient Excuse of "Customization" ..................................................................................................................... 19
3.4. Sales Contract Proves Jumper Prices Far Less Than Those Claimed by China Fiber.................................................... 21
3.5. 12-core fiber pig-tail Priced Way Below China Fiber's Claims ...................................................................................... 24
Part 4. Financials and Valuation .............................................................................................................................................. 26
4.1. China Fiber's Telecom Carrier Clients ............................................................................................................................ 26
4.2. Volume and ASP Suggest 2012 Revenue of Rmb287m ..................................................................................................... 29
4.3. SAIC Filings Suggest 2012 Revenue of Rmb267m ........................................................................................................... 29
4.4. Valuation .......................................................................................................................................................................... 31
Appendix I – Sifang Telecom 2012 SAIC Filing
Appendix II – Sifang Telecom Financial Statements (2008-2012)
Appendix III – Exports in 2014 under HS code 85367000
China Fiber Optic – Shocking Lies
4
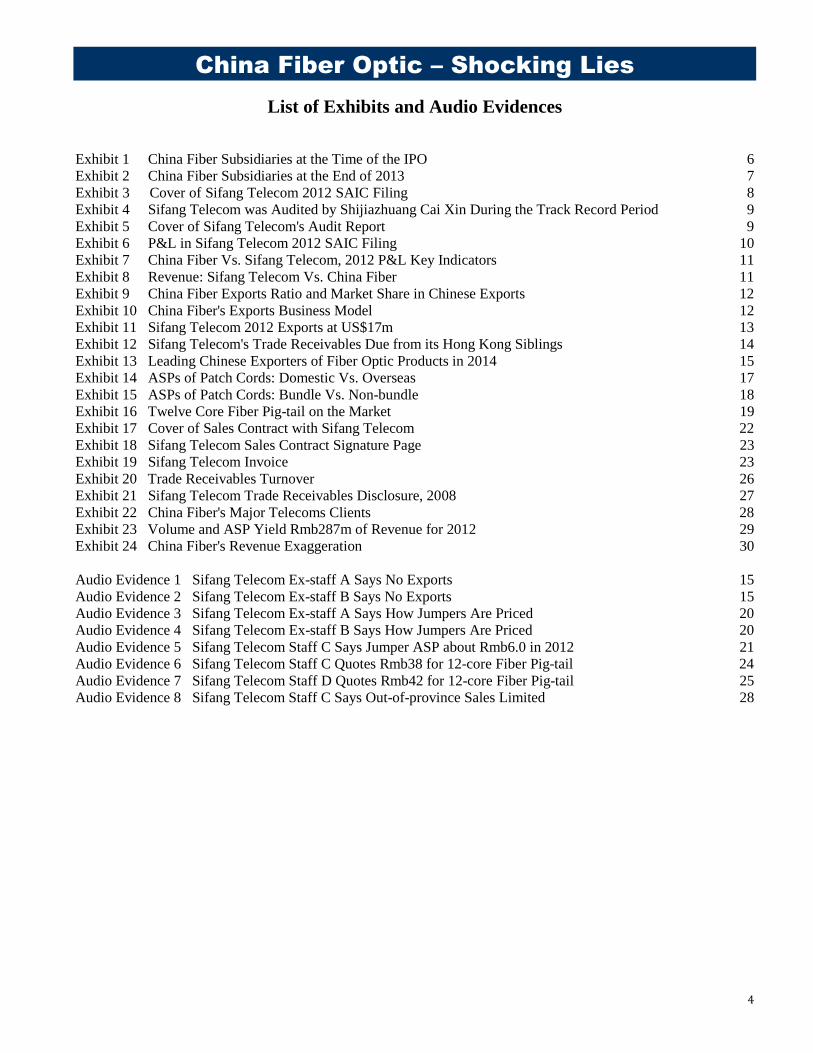
List of Exhibits and Audio Evidences
Exhibit 1 China Fiber Subsidiaries at the Time of the IPO 6
Exhibit 2 China Fiber Subsidiaries at the End of 2013 7
Exhibit 3 Cover of Sifang Telecom 2012 SAIC Filing 8
Exhibit 4 Sifang Telecom was Audited by Shijiazhuang Cai Xin During the Track Record Period 9
Exhibit 5 Cover of Sifang Telecom's Audit Report 9
Exhibit 6 P&L in Sifang Telecom 2012 SAIC Filing 10
Exhibit 7 China Fiber Vs. Sifang Telecom, 2012 P&L Key Indicators 11
Exhibit 8 Revenue: Sifang Telecom Vs. China Fiber 11
Exhibit 9 China Fiber Exports Ratio and Market Share in Chinese Exports 12
Exhibit 10 China Fiber's Exports Business Model 12
Exhibit 11 Sifang Telecom 2012 Exports at US$17m 13
Exhibit 12 Sifang Telecom's Trade Receivables Due from its Hong Kong Siblings 14
Exhibit 13 Leading Chinese Exporters of Fiber Optic Products in 2014 15
Exhibit 14 ASPs of Patch Cords: Domestic Vs. Overseas 17
Exhibit 15 ASPs of Patch Cords: Bundle Vs. Non-bundle 18
Exhibit 16 Twelve Core Fiber Pig-tail on the Market 19
Exhibit 17 Cover of Sales Contract with Sifang Telecom 22
Exhibit 18 Sifang Telecom Sales Contract Signature Page 23
Exhibit 19 Sifang Telecom Invoice 23
Exhibit 20 Trade Receivables Turnover 26
Exhibit 21 Sifang Telecom Trade Receivables Disclosure, 2008 27
Exhibit 22 China Fiber's Major Telecoms Clients 28
Exhibit 23 Volume and ASP Yield Rmb287m of Revenue for 2012 29
Exhibit 24 China Fiber's Revenue Exaggeration 30
Audio Evidence 1 Sifang Telecom Ex-staff A Says No Exports 15
Audio Evidence 2 Sifang Telecom Ex-staff B Says No Exports 15
Audio Evidence 3 Sifang Telecom Ex-staff A Says How Jumpers Are Priced 20
Audio Evidence 4 Sifang Telecom Ex-staff B Says How Jumpers Are Priced 20
Audio Evidence 5 Sifang Telecom Staff C Says Jumper ASP about Rmb6.0 in 2012 21
Audio Evidence 6 Sifang Telecom Staff C Quotes Rmb38 for 12-core Fiber Pig-tail 24
Audio Evidence 7 Sifang Telecom Staff D Quotes Rmb42 for 12-core Fiber Pig-tail 25
Audio Evidence 8 Sifang Telecom Staff C Says Out-of-province Sales Limited 28
China Fiber Optic – Shocking Lies
5
Disclaimer
We are a group of seasoned equities analysts with many years of experience in the research of economic
and political trends as well as individual stocks around the world. With background in various
international investment banks, we have followed the development of the Chinese equities market right
from day one.
We are determined to expose as much of the fraud in the Chinese stock market as we can. The most
widespread and serious fraud is probably that undertaken by listed companies, in fabricating non-existent
businesses and stealing shareholders money, among other tricks.
In exposing these crimes we challenge the listed companies to prove the integrity of their announcements
and financial statements. The listed companies, of course, want everybody to believe that their
announcements and financial statements are true. Their auditors, employees, independent directors,
lawyers, shareholders and even the general public all hope that these announcements and financial
statements are true.
We have made our best effort to ascertain that everything we say in this report is accurate. We
have obtained our information from public sources that we believe to be accurate and reliable, or
from sources whom we believe are not insiders or connected parties to the companies mentioned
herein. However, we are certainly NOT in the business of making investment recommendations.
This is not an investment report and should not be regarded as such. Read and use our reports at
your own risk. Most important of all, DO YOUR OWN RESEARCH BEFORE YOU COMMIT
OTHER PEOPLE'S MONEY.
We and/or our associates/partners may have long or short positions in the equities and/or their
derivatives at the time of publication of our reports, and we and/or our associates/partners may
maintain or change our positions at any time.
China Fiber Optic – Shocking Lies
6
China Fiber Optic, which claims to be the country's largest producer of fiber optic patch cords, was listed
on the Hong Kong market in mid-2011 with BOC International, the investment banking arm of Bank of
China, as the sponsor and lead manager and Ernst and Young as the auditor. Since its Rmb316m IPO, the
company has reported steady revenue and profit growth with minor margin erosion.
However, we have irrefutable evidence that China Fiber fabricated revenue and profit during the
preparation of its IPO prospectus and has perpetuated this crime until this day. We also believe that the
professional advisers were totally unprofessional and did not do a proper due diligence at the time of the
company's IPO.
Compared with the fraudulent companies China Lumena (0067.HK), Shenguan Holdings (0829.HK) and
Sound Global (0967.HK) that we have exposed earlier, China Fiber has a smaller market capitalization
but a shockingly higher degree of forgery.
When we first saw the annual filings by China Fiber's principal Mainland subsidiary with the State
Administration of Industry and Commerce (SAIC) in Hebei, we were shocked to see that its revenue was
way below that reported by China Fiber to its shareholders and regulators. When we could not find China
Fiber's subsidiary in Chinese Customs' database, we couldn't believe our own eyes. And when we
obtained a sales contract and invoice issued by China Fiber showing that it was selling its products at
merely 1/8 of its claimed average selling price (ASP), we thought we were looking at something else.
The fact is irrefutable. China Fiber is a fraudulent company that has been using simple and primitive
methods to exaggerate its accounts as it prepared its IPO in 2011. The crime has been perpetuated all
through the years to this date.
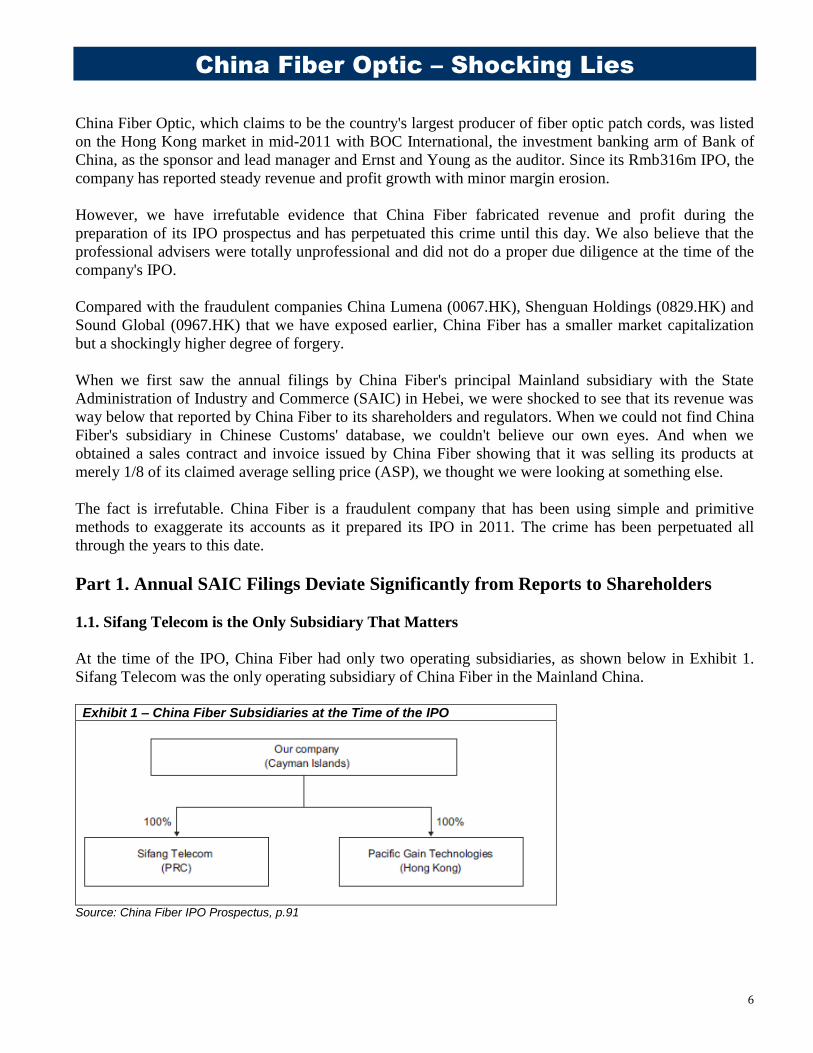
Part 1. Annual SAIC Filings Deviate Significantly from Reports to Shareholders
1.1. Sifang Telecom is the Only Subsidiary That Matters
At the time of the IPO, China Fiber had only two operating subsidiaries, as shown below in Exhibit 1.
Sifang Telecom was the only operating subsidiary of China Fiber in the Mainland China.
Exhibit 1 – China Fiber Subsidiaries at the Time of the IPO
Source: China Fiber IPO Prospectus, p.91
China Fiber Optic – Shocking Lies
7
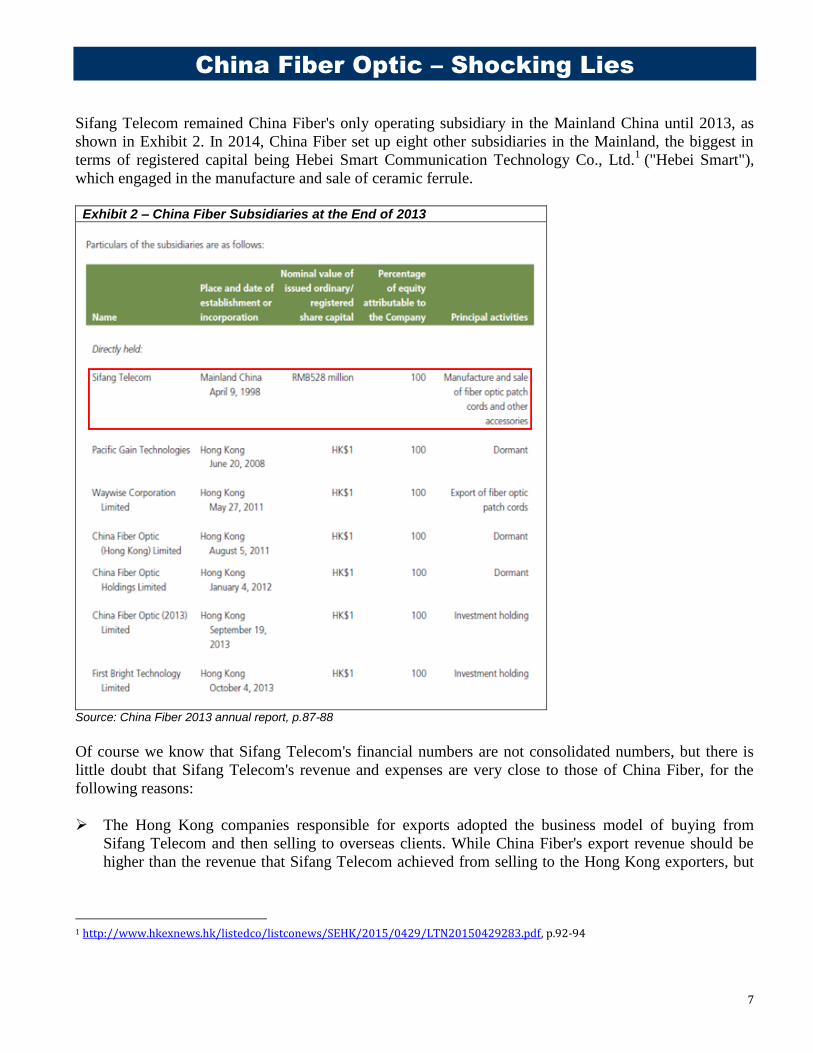
Sifang Telecom remained China Fiber's only operating subsidiary in the Mainland China until 2013, as
shown in Exhibit 2. In 2014, China Fiber set up eight other subsidiaries in the Mainland, the biggest in
terms of registered capital being Hebei Smart Communication Technology Co., Ltd.1 ("Hebei Smart"),
which engaged in the manufacture and sale of ceramic ferrule.
Exhibit 2 – China Fiber Subsidiaries at the End of 2013
Source: China Fiber 2013 annual report, p.87-88
Of course we know that Sifang Telecom's financial numbers are not consolidated numbers, but there is
little doubt that Sifang Telecom's revenue and expenses are very close to those of China Fiber, for the
following reasons:
The Hong Kong companies responsible for exports adopted the business model of buying from
Sifang Telecom and then selling to overseas clients. While China Fiber's export revenue should be
higher than the revenue that Sifang Telecom achieved from selling to the Hong Kong exporters, but
1 http://www.hkexnews.hk/listedco/listconews/SEHK/2015/0429/LTN20150429283.pdf, p.92-94
China Fiber Optic – Shocking Lies
8
the difference should not be that substantial given the generally narrow export margins. (In any case,
as we'll show later, China Fiber does not have an export business at all!)
Prior to the end of 2013, no other Mainland entity contributed to China Fiber's revenue. For 2014, the
newly created subsidiaries probably made limited contribution to China Fiber's business. As an
example, Hebei Smart, the new biggest subsidiary in terms of registered capital, only "began mass
production in the fourth quarter of 2014", according to p.10 of China Fiber's 2014 annual report.
Further, the real contribution of Hebei Smart's ceramic ferrule business was to lower China Fiber's
cost of production, rather than to expand sales.
1.2. SAIC Filing Shows China Fiber Numbers Hugely Inflated
Due to changes in China's policy with regard to SAIC annual filings, we have not been able to access
Sifang Telecom's SAIC filings from 2013 onward. However, Sifang Telecom's SAIC filings up to 2012
demonstrate very clearly that China Fiber hugely exaggerated its financial performance.
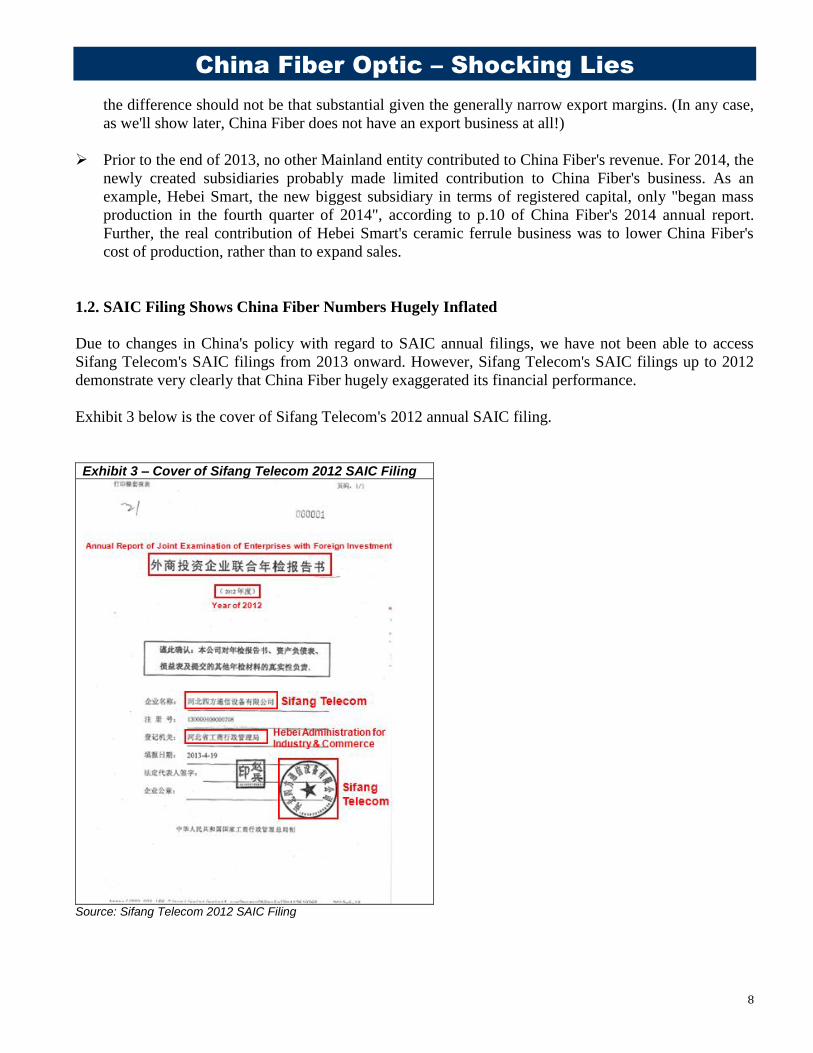
Exhibit 3 below is the cover of Sifang Telecom's 2012 annual SAIC filing.
Exhibit 3 – Cover of Sifang Telecom 2012 SAIC Filing
Source: Sifang Telecom 2012 SAIC Filing
China Fiber Optic – Shocking Lies
9
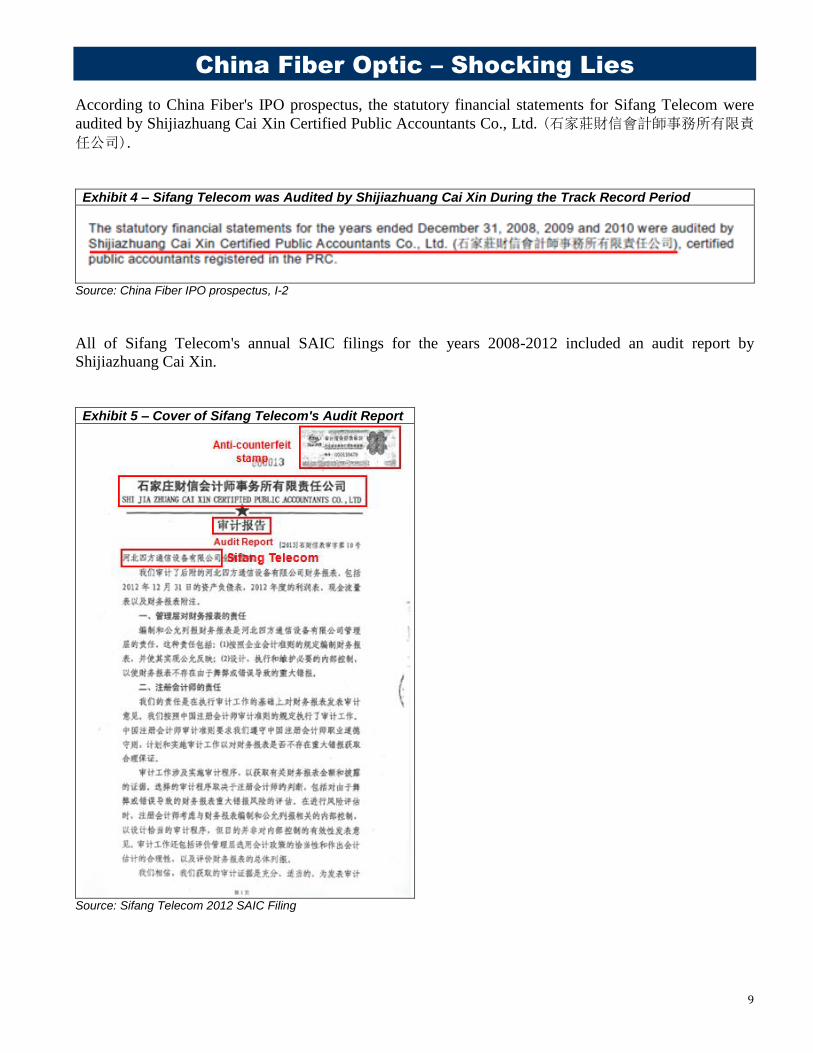
According to China Fiber's IPO prospectus, the statutory financial statements for Sifang Telecom were
audited by Shijiazhuang Cai Xin Certified Public Accountants Co., Ltd. (石家莊財信會計師事務所有限責
任公司).
Exhibit 4 – Sifang Telecom was Audited by Shijiazhuang Cai Xin During the Track Record Period
Source: China Fiber IPO prospectus, I-2
All of Sifang Telecom's annual SAIC filings for the years 2008-2012 included an audit report by
Shijiazhuang Cai Xin.
Exhibit 5 – Cover of Sifang Telecom's Audit Report
Source: Sifang Telecom 2012 SAIC Filing
China Fiber Optic – Shocking Lies
10
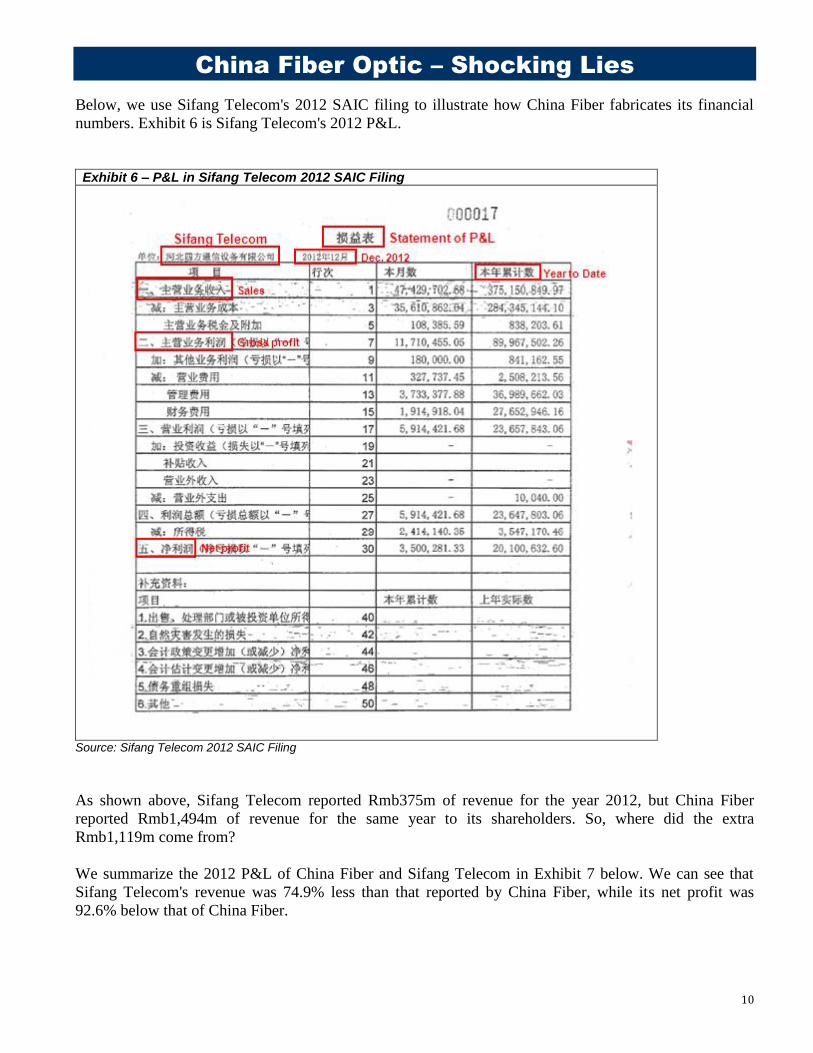
Below, we use Sifang Telecom's 2012 SAIC filing to illustrate how China Fiber fabricates its financial
numbers. Exhibit 6 is Sifang Telecom's 2012 P&L.
Exhibit 6 – P&L in Sifang Telecom 2012 SAIC Filing
Source: Sifang Telecom 2012 SAIC Filing
As shown above, Sifang Telecom reported Rmb375m of revenue for the year 2012, but China Fiber
reported Rmb1,494m of revenue for the same year to its shareholders. So, where did the extra
Rmb1,119m come from?
We summarize the 2012 P&L of China Fiber and Sifang Telecom in Exhibit 7 below. We can see that
Sifang Telecom's revenue was 74.9% less than that reported by China Fiber, while its net profit was
92.6% below that of China Fiber.
China Fiber Optic – Shocking Lies
11
Exhibit 7 – China Fiber Vs. Sifang Telecom, 2012 P&L Key Indicators
Year end Dec 31 (Rmb m) China Fiber
claims
Sifang Telecom's SAIC filing
Difference (%)
Revenue 1,494 375 -74.9%
Gross profit 426 90 -78.9%
Gross margin 28.5% 24.0% -4.6%
Net profit 272 20 -92.6%
Net margin 18.2% 5.4% -12.9%
Sources: China Fiber 2012 annual report, Sifang Telecom 2012 SAIC Filing
In Appendix I, we present Sifang Telecom's 2012 SAIC filing in its entirety. For privacy reason, we have
omitted certain information such as the identity of those filing the report.
We have passed on Sifang Telecom's complete SAIC filings for the years 2008-2012 to the SFC of Hong
Kong.
1.3. Revenue Inflated 3.5-4.8x from 2009 to 2012
The situation in earlier years was similar to that of 2012. In Appendix II we present the financial
statements from Sifang Telecom's 2008-2012 SAIC filings.
Exhibit 8 below compares the revenue reported by China Fiber to its shareholders against that filed by
Sifang Telecom with SAIC during 2008-2012. We can see that China Fiber consistently exaggerated its
revenue, by nearly 5x in 2009 and about 4x in 2012. However, later in this report, we will prove that even
Sifang Telecom's SAIC filings are exaggerated. This means that China Fiber's revenue inflation was in
reality as high as 9.5x in 2009 and about 5.6x in 2012.
Exhibit 8 – Revenue: Sifang Telecom Vs. China Fiber
Year end Dec 31 (Rmb m) 2008 2009 2010 2011 2012
China Fiber revenue 334 646 838 1,257 1,494
Sifang Telecom revenue 302 133 238 320 375
Multiple 1.1x 4.8x 3.5x 3.9x 4.0x
Sources: China Fiber IPO prospectus and annual reports, Sifang Telecom SAIC Filings
China Fiber Optic – Shocking Lies
12
Part 2. What Exports?
According to China Fiber, exports have always been a significant part of its business. Not only does it
claim that it derives revenue from exports during the years, exports are said to be priced at much higher
levels, therefore giving the group better margins.
Products grouped under HS code 85367000 include optical fiber, optical fiber bundles and fiber optic
patch cords. According to China Customs data, China exported a total of Rmb1.87bn of such products in
2014. Based on China Fiber's disclosures, the company exported a total of Rmb1.42bn during 2008-2014,
accounting for 14.7% of all such HS code 85367000 exports during the period. This is summarized below
in Exhibit 9.
Exhibit 9 – China Fiber Exports Ratio and Market Share in Chinese Exports
Year end Dec 31 (Rmb m) 2008 2009 2010 2011 2012 2013 2014 Total
Revenue 334 646 838 1,257 1,494 1,776 2,209 8,559
- Domestic 108 540 642 1,036 1,294 1,550 1,963 7,133
- Exports 227 105 196 221 201 226 246 1,421
- Exports Ratio 67.7% 16.3% 23.4% 17.6% 13.4% 12.7% 11.1% 16.6%
Total PRC Exports 839 855 1,226 1,386 1,578 1,930 1,868 9,683 - China Fiber's market share 27.0% 12.3% 16.0% 16.0% 12.7% 11.7% 13.2% 14.7%
Sources: China Fiber IPO prospectus and annual reports, China Customs
However, all our information suggests that China Fiber's export business is virtually non-existent!
2.1. China Fiber's Export Business Model
According to China Fiber's IPO prospectus, the company obtained its overseas contracts on its own and
that its international customers were distributors that sold China Fiber's products to telecommunications
network contractors in their respective markets. This implies that China Fiber conducted its own export
business without relying on the major Chinese telecoms network contractors such as Huawei, nor would it
rely on other Chinese distributors.
Exhibit 10 – China Fiber's Exports Business Model
Source: China Fiber IPO prospectus, p.110
China Fiber Optic – Shocking Lies
13
China Fiber has subsidiaries registered in Hong Kong for handling its export business. Initially, exports
were handled by Pacific Gain Technologies Limited ("Pacific Gain"). In 2011 China Fiber set up
Waywise Corporation Limited ("Waywise") that also handled exports for China Fiber. In 2012, Pacific
Gain became dormant, leaving Waywise as the only Hong Kong subsidiary in operation.
In Sifang Telecom's 2012 SAIC filing (Exhibit 11 below), we can see that the company reported total
exports of US$17m.
Exhibit 11 – Sifang Telecom 2012 Exports at US$17m
Source: Sifang Telecom 2012 SAIC Filing
In the SAIC filings, Sifang Telecom discloses the trade receivables due from its sister companies (see
Exhibit 12 below). There is no doubt Sifang Telecom's exports are handled by its Hong Kong siblings.
China Fiber Optic – Shocking Lies
14
Exhibit 12 – Sifang Telecom's Trade Receivables Due from its Hong Kong Siblings
Year end Dec 31 (Rmb m) 2008 2009 2010 2011
Pacific Gain 1 10 16 N.A.
Waywise N.A. N.A. N.A. 95
Sources: Sifang Telecom SAIC Filings
Clearly, as far as Mainland business is concerned, Sifang Telecom handles its own exports by selling to
China Fiber's Hong Kong subsidiaries. Sifang Telecom will therefore show up in China Customs' list of
exporters for HS code 85367000.
2.2. Sifang Telecom No Show in China Customs Data
The curious thing is, Sifang Telecom has no presence in China Customs data!
How do we know?
We have access to China Customs' record of exports of fiber optic products for 2008 through 2014. These
records detail the date of trade, type of trade (export or import), HS code, product name, value, quantity,
unit price, unit of quantity, country of origin/destination, port of custom clearance, mode of trade (such as
general trade, processing trade, bonded trade, bonded re-exports, etc), mode of transport, transit country,
enterprise code, enterprise name, type of enterprise, delivery location and contact details.
We have ploughed through the database but could not find any export information relating to Sifang
Telecom, despite China Fiber's claim of Rmb1,421m in exports from 2008 to 2014.
The following table in Exhibit 13 lists the top 10 exporters for HS code 85367000 in 2014. Based on
China Fiber's claim of Rmb245.6m of fiber optic patch cords exports in 2014, Sifang Telecom should
rank as the country's leading exporter.
However, China Customs data show that Sifang Telecom had no exports in 2014.
China Fiber Optic – Shocking Lies
15
Exhibit 13 – Leading Chinese Exporters of Fiber Optic Products in 2014
Company Name Export value
(Rmb m) Market
share (%)
泰連電子(無錫)有限公司 240.4 13.0%
富晉精密工業(晉城)有限公司 125.2 6.8%
波若威光纖通訊(中山)有限公司 63.0 3.4%
愛普迪光通訊科技(深圳)有限公司 58.8 3.2%
億光電子(中山)有限公司 52.7 2.9%
住友電工光器件(無錫)有限公司 51.7 2.8%
泰科電子(上海)有限公司 43.1 2.3%
新確精密科技(深圳)有限公司 41.5 2.2%
武漢烽火國際技術有限責任公司 38.4 2.1%
英通達安費諾光纖技術(深圳)有限公司 36.7 2.0%
Source: China Customs
In Appendix III, we present 2014 China Customs data with full details of China's exports of optical fiber,
optical fiber bundles and fiber optic patch cords under HS code 85367000.
A complete set of this database from 2008 to 2014, containing detailed information on 52,704
transactions, is being furnished to the SFC of Hong Kong.
2.3. Sifang Telecom Staff Confirm No Exports
We have talked to Sifang Telecom's two former employees (Ex-staff A and Ex-staff B) and two current
staff (Staff C and Staff D) about the company. Ex-staff A and Ex-staff B confirmed to us that Sifang
Telecom had never had any export business. The following is the transcripts of the conversations.
Audio Evidence 1 – Sifang Telecom Ex-staff A Says No Exports
Emerson investigator: So does Sifang Telecom have exports? Ex-staff A: What rubbish? The foreigners are more advanced than us, and they demand things with higher degrees of precision. Emerson investigator: So you are only selling domestically at Rmb5-6 a piece? Ex-staff A: Yes, that's right.
Source: Emerson Analytics
Audio Evidence 2 – Sifang Telecom Ex-staff B Says No Exports
Emerson investigator: Do you at Sifang Telecoms have exports? Ex-staff B: Basically it's all domestic. Emerson investigator: Basically all domestic? Ex-staff B: Yes.
Source: Emerson Analytics
China Fiber Optic – Shocking Lies
16
Our conversations with the Sifang Telecom staff were taped secretly. To protect the safety of the
interviewees, we will not make public any audio recording in which they reveal evidence of China Fiber's
lies or exaggerations. We are, however, sharing such audio recordings as well as the interviewees' names,
positions, contact telephone numbers and dates of meeting with the SFC of Hong Kong. A total of eight
audio clips have been provided to SFC in relation to this report.
China Fiber Optic – Shocking Lies
17
Part 3. Impossibly High Unit Prices
The integrity of China Fiber's disclosures and financial statements has been challenged by the media
before. The focus was mainly on the impossibly high unit prices. Here, we will demonstrate conclusively
the absurdity of China Fiber's high unit prices.
3.1. China Fiber's Unit Price Disclosures
In Exhibit 14 below, we list the so-called domestic and "overseas" ASPs of patch cords that China Fiber
claimed to have achieved.
Exhibit 14 – ASPs of Patch Cords: Domestic Vs. Overseas
Year end Dec 31 2008 2009 2010 2011 2012 2013 2014
Revenue (Rmb m) 283 615 785 1,234 1,477 1,275 1,621
- Domestic 56 510 589 1,012 1,276 1,049 1,375
- Overseas 227 105 196 221 201 226 246
Sales volume (m sets) 1.73 9.61 10.76 17.93 19.20 22.62 N.A.
- Domestic 1.18 9.33 10.23 17.26 18.46 21.42 N.A.
- Overseas 0.55 0.28 0.53 0.67 0.74 1.20 N.A.
ASP (Rmb/set) 163.2 64.0 73.0 68.8 76.9 56.3 N.A.
- Domestic 47.6 54.6 57.6 58.6 69.1 49.0 N.A.
- Overseas 410.6 375.6 369.7 332.9 271.1 188.1 N.A.
Sources: China Fiber IPO prospectus and annual reports
As shown in Part 2 above, China Fiber doesn't really have any exports to speak of. Thus, we will only
discuss China Fiber's domestic ASPs here. China Fiber claims ASPs of Rmb50-70 per set in domestic
sales.
China Fiber's domestic sales revenue, volume and ASPs can be further analyzed according to bundle
patch cords and non-bundle patch cords (see Exhibit 15 below). These two categories were first presented
by China Fiber in its clarification announcement dated March 22, 2013, after the company was challenged
by a Hong Kong magazine for exaggerating its ASPs. According to the clarification announcement, non-
bundle patch cords are those usually with one to two connectors on each end of the patch cords while
bundle patch cords are those with 6, 8 or 12 connectors on each end of the patch cords2.
2 http://www.hkexnews.hk/listedco/listconews/SEHK/2013/0324/LTN20130324053.pdf, p.4
China Fiber Optic – Shocking Lies
18
Exhibit 15 – ASPs of Patch Cords: Bundle Vs. Non-bundle
Year end Dec 31 2012 2013 2014
Domestic patch cords revenue (Rmb m) 1,276 1,049 N.A.
- Bundle patch cords 569 258* N.A.
- Non-bundle patch cords 707 791 N.A.
Domestic patch cords volume (m sets) 18.5 21.4 N.A.
- Bundle patch cords 4.2 1.9 N.A.
- Non-bundle patch cords 14.2 19.5 N.A.
ASP (Rmb/set) 69.1 49.0 N.A.
- Bundle patch cords 134.4 134.0 N.A.
- Non-bundle patch cords 49.7 40.6 N.A.
Sources: China Fiber annual reports * Calculations based on the disclosure in p.11 of China Fiber's 2013 annual report that bundle patch cords accounted for 24.6% of total domestic sales of patch cords
Note that after the 2014 interim report, China Fiber ceased to disclose any volume or ASP data. In our
experience, cutting back on disclosure is always a bad sign.
3.2. What are Patch Cords?
Before we analyze China Fiber's fiber optic patch cord ASPs, we need to explain clearly the relevant
industry jargons.
FC/SC: ferrule connector and subscriber connector, are the two main types of fiber optic patch cords. FC
patch cords are the most popular type of fiber optic patch cords in the Chinese market3. All else being
equal, an FC patch cord is more expensive than an SC patch cord.
Jumper ("跳線"): a soft optical cable with one connector at each end of the cable. Unless otherwise
stated, a fiber optic patch cord refers to a jumper. Non-bundle patch cords with two connectors on each
end of the patch cords are very rare. In the clarification announcement, the "non-bundle patch cords with
one to two connectors on each end of the patch cords" essentially is a reference to jumpers.
Pig-tail ("尾纖"): a soft optical cable with one connector at only one end of the cable.
Twelve core fiber pig-tail ("12 芯束狀尾纖"): a bundle patch cord comprising 12 pig-tails.
3 http://www.hkexnews.hk/listedco/listconews/SEHK/2011/0616/LTN20110616005.pdf, p.61
China Fiber Optic – Shocking Lies
19
In our conversations with Sifang Telecom's staff, we were advised that the "bundle patch cords with 12
connectors on each end" referred to in the clarification announcement were in fact 12-core fiber pig-tails.
Our observation of the marketplace also shows that other than the jumpers, 12-core fiber pig tails are the
most common patch cord products. Go to www.1688.com to search for "12 芯束状尾纤 FC" and one can
see many vendors selling them.
Exhibit 16 – Twelve Core Fiber Pig-tail on the Market
Source: http://s.1688.com/selloffer/offer_search.htm?keywords=12%D0%BE%CA%F8%D7%B4%CE%B2%CF%CBfc&button_click=top&earseDirect=false&n=y, retrieved on June 10, 2015
In our discussions below, we use "fiber optic patch cords" as a general reference to all the different types
of such products supplied by China Fiber. For specific products, we'll identify them more precisely as
jumpers, pig-tails or 12-core fiber pig-tails.
3.3. The Convenient Excuse of "Customization"
According to its 2013 clarification, China Fiber was able to achieve high ASPs by focusing on
"customization" of fiber optic patch cords.

China Fiber Optic – Shocking Lies
20
Some readers may recall our analysis just over a year ago of the so-called "specialty" thenardite produced
by China Lumena (0067.HK), now undergoing bankruptcy proceedings. In that case, thenardite is a
commodity that is basically 99% pure, and China Lumena simply does not produce any high-priced
"specialty" thenardite4.
The so-called "customization" claimed by China Fiber works in the same way as China Lumena's
"specialty" thenardite. Fiber optic patch cords are standard parts used by the optical fiber industry and
have no need for "customization". It's just an attempt to cover up China Fiber's fabrication of revenue and
profit.
We have talked to Sifang Telecom's staff on how jumpers are priced. The English transcripts of Audio
Evidence 3 and 4 are presented below.
Audio Evidence 3 – Sifang Telecom Ex-staff A Says How Jumpers Are Priced
Emerson investigator: The jumpers produced by Sifang Telecom, how much are they priced at? Ex-staff A: A jumper is priced at about Rmb5-6. Emerson investigator: Rmb5-6 a set? Ex-staff A: Yes. It sells to China Mobile, Unicom, China Telecom, the cable TV carriers, supplying these companies. Emerson investigator: Between the connectors is a piece of fiber optic cable. For Rmb5-6 a set, how long is the fiber optic cable in the middle? Ex-staff A: Ok, let me tell you, one meter of fiber optic cable is about Rmb0.1, Rmb0.2 or Rmb0.3. Emerson investigator: So cheap? Ex-staff A: You see, a jumper has two connectors, right? Each connector is about Rmb2-3. Emerson investigator: Oh. Ex-staff A: How is a jumper priced? It's based on the length of the fiber cable, plus the two connectors. There you have it. Emerson investigator: So, how much are you at Sifang Telecom selling your jumpers? Ex-staff A: A three meter cable is about Rmb0.5. That makes more than Rmb4.0 a jumper.
Source: Emerson Analytics
Audio Evidence 4 – Sifang Telecom Ex-staff B Says How Jumpers Are Priced
Emerson investigator: So how much are you selling your jumpers? Ex-staff B: A set of FC jumper is just several Rmb. Emerson investigator: Several Rmb? Ex-staff B: For a set of jumper, one connector costs more than Rmb1.0. With two connectors, that makes it more than Rmb2.0. Adding a fiber cable to it, basically we can sell at about Rmb4-5 each. Emerson investigator: Is there a standard length for the cable? How many meters? Ex-staff B: Yes, there are standards. Some are one meter long, some 1.5 meters, some two meters, and some are even three meters long. Emerson investigator: And on average? Ex-staff B: Fiber cables are sold by the meters, say about Rmb0.1 for a meter of fiber cable.
Source: Emerson Analytics
4 http://emersonanalytics.co/downloads/Lumena-HK_0067-Delisting.pdf, p.12
China Fiber Optic – Shocking Lies
21
China Fiber claims in the clarification announcement that the pricing of patch cords "is generally
determined and vastly varied by the type of fiber, the type and length of soft optical cables, the type and
specifications of connectors, the number of connectors, the volume and product quality being required
and other additional specific requirements".
Let us now compare this with what Sifang Telecom staff has told us:
type of fiber – never mentioned by any Sifang Telecom staff, thus unclear what China Fiber really
meant
type and length of soft optical cables – according to Sifang Telecom staff, fiber cables are very
cheap and that the bulk of raw material cost is the cost of the connector
type and specifications of connectors – generally speaking, Sifang Telecom staff were referring to
FC jumpers. FC fiber optic patch cords are China Fiber's principal fiber optic patch cord product5. As
we have explained earlier, FC patch cords are more expensive than SC patch cords, all else being
equal
number of connectors – jumpers have only two connectors, one at each end of the fiber cable
volume and product quality – Audio Evidence 5 and 7 below show that large orders will enjoy
discounts, but Sifang Telecom staff have made no mention of product quality
other additional specific requirements – not mentioned by Sifang Telecom staff
We can see from the conversation above that the ASP of jumpers is merely about Rmb5.0 in recent weeks,
while China Fiber claimed that it achieved ASP of Rmb49.7 per set in 2012 (see Exhibit 15 above). Can
this 10x price gap really be explained by China Fiber's purported "customization" in "product quality" and
"other additional specific requirements" that Sifang Telecom staff have never mentioned? They didn't
mention them because there was simply no quality difference or "additional specific requirements".
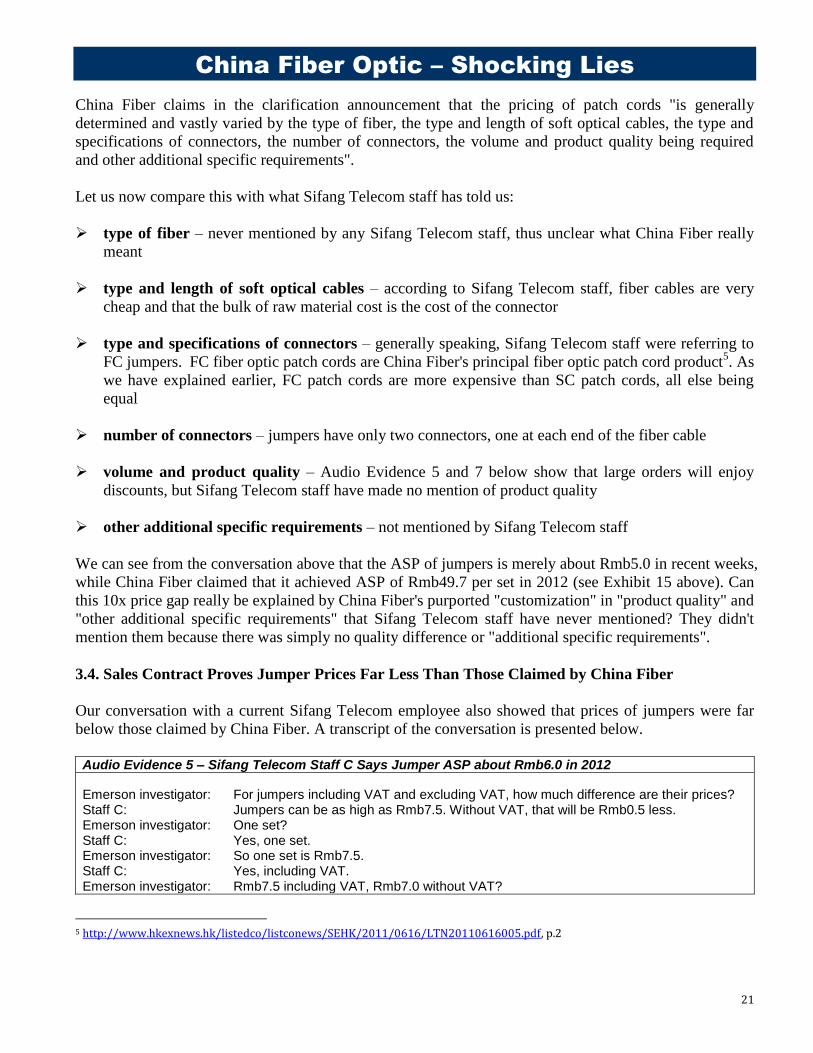
3.4. Sales Contract Proves Jumper Prices Far Less Than Those Claimed by China Fiber
Our conversation with a current Sifang Telecom employee also showed that prices of jumpers were far
below those claimed by China Fiber. A transcript of the conversation is presented below.
Audio Evidence 5 – Sifang Telecom Staff C Says Jumper ASP about Rmb6.0 in 2012
Emerson investigator: For jumpers including VAT and excluding VAT, how much difference are their prices? Staff C: Jumpers can be as high as Rmb7.5. Without VAT, that will be Rmb0.5 less. Emerson investigator: One set? Staff C: Yes, one set. Emerson investigator: So one set is Rmb7.5. Staff C: Yes, including VAT. Emerson investigator: Rmb7.5 including VAT, Rmb7.0 without VAT?
5 http://www.hkexnews.hk/listedco/listconews/SEHK/2011/0616/LTN20110616005.pdf, p.2
China Fiber Optic – Shocking Lies
22
Staff C: Right. Emerson investigator: Later on, if sales volume increases, how much can the price fall? Say, if the order is more than 10 thousand sets? Staff C: There's room for Rmb0.2-0.3. Emerson investigator: Several years ago, prices were cheaper than they are now, right? Staff C: Yes, cheaper. About Rmb1.0 cheaper. Emerson investigator: In 2012? Staff C: Yes, 2012, around that time. In 2012 prices were definitely cheaper than they are now. Emerson Investigator: Cheaper by Rmb1.0?
Staff C: Yes, cheaper by Rmb1.0.
Source: Emerson Analytics
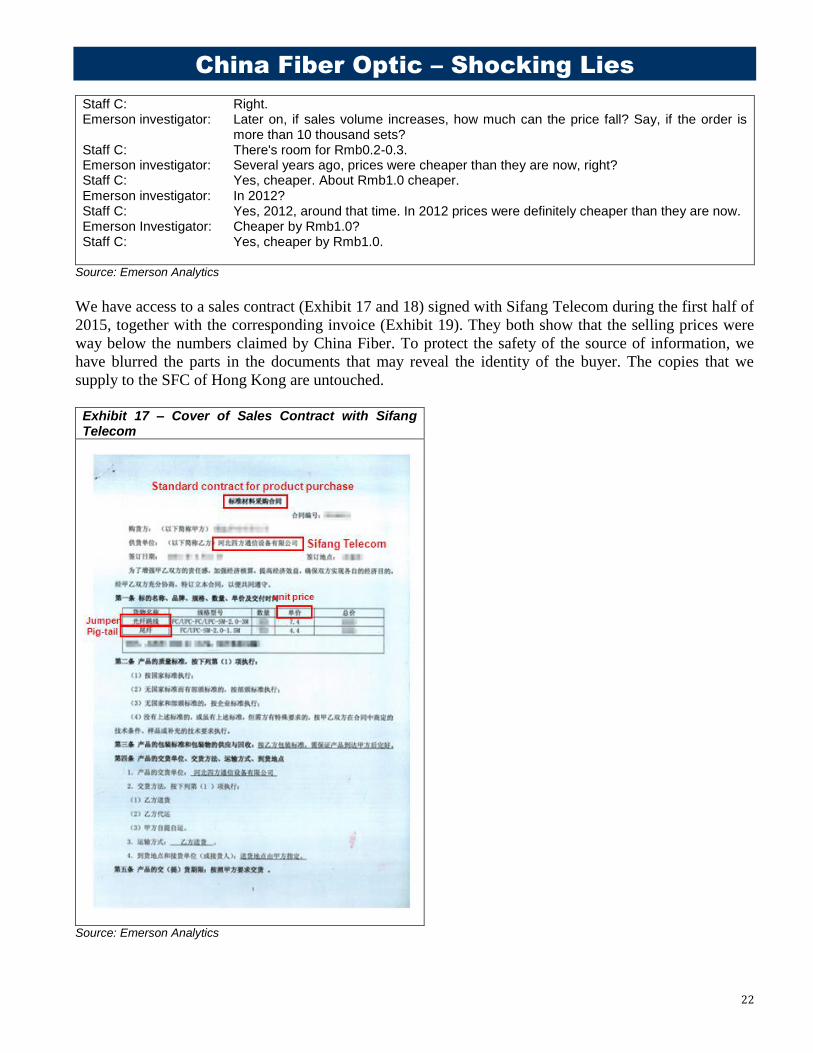
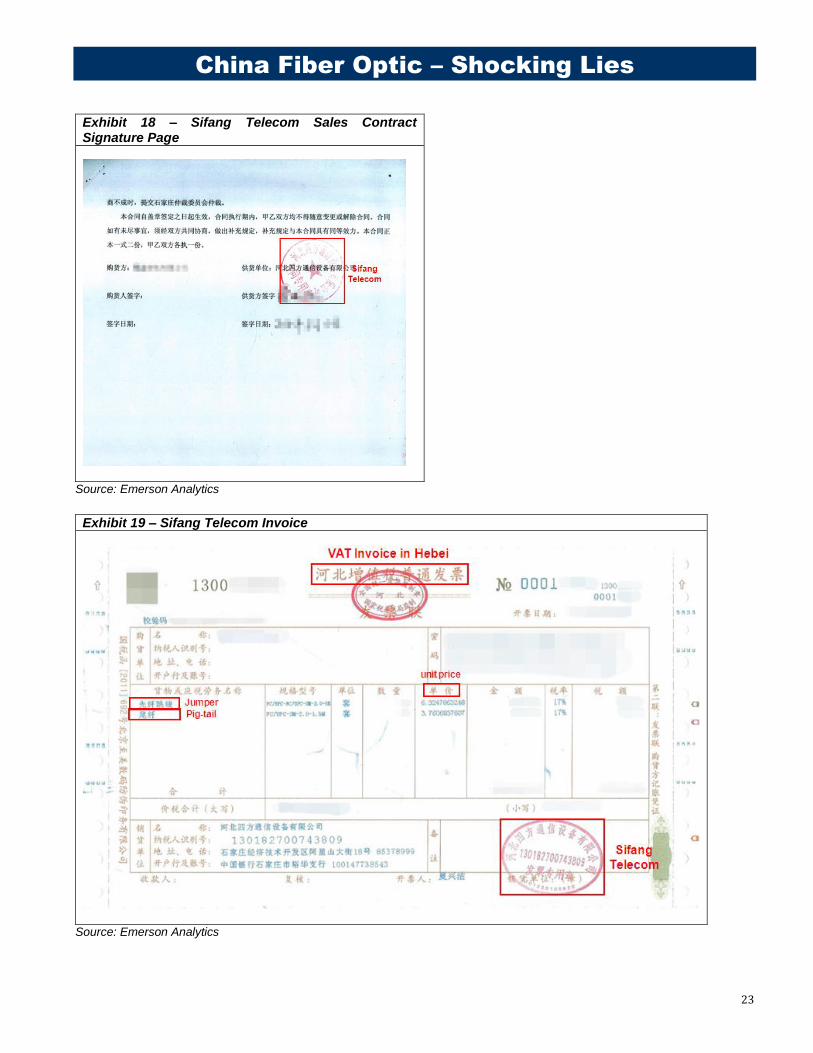
We have access to a sales contract (Exhibit 17 and 18) signed with Sifang Telecom during the first half of
2015, together with the corresponding invoice (Exhibit 19). They both show that the selling prices were
way below the numbers claimed by China Fiber. To protect the safety of the source of information, we
have blurred the parts in the documents that may reveal the identity of the buyer. The copies that we
supply to the SFC of Hong Kong are untouched.
Exhibit 17 – Cover of Sales Contract with Sifang Telecom
Source: Emerson Analytics
China Fiber Optic – Shocking Lies
23
Exhibit 18 – Sifang Telecom Sales Contract Signature Page
Source: Emerson Analytics
Exhibit 19 – Sifang Telecom Invoice
Source: Emerson Analytics
China Fiber Optic – Shocking Lies
24
As can be seen, Sifang Telecom is selling jumpers and pig-tails in this contract, at a unit price of
Rmb6.32 (=7.4/(1+17%)) per set for the former and of Rmb3.76 (=4.4/(1+17%)) per set for the latter.
China Fiber has claimed ASP of Rmb49.7 per set for jumpers for 2012 (see Exhibit 15). That's 7.9x of the
recent transaction price shown in the sales contract above.
We believe the actual ASP for non-bundle patch cords in 2012 was lower than Rmb6.32 per set for the
following two reasons:
The contract amount was relatively small. According to the Sifang Telecom staff, large orders in tens
of thousands sets can get discounts of Rmb0.2-0.3 per set; and
The same Sifang Telecom Staff C also told our investigator that the price of a set of jumper was now
about Rmb1.0 higher than that in 2012 due to cost increases in recent years.
In our estimates of China Fiber's actual revenue, we will assume an ASP of Rmb6.4 for a set of non-
bundle patch cord, the most favorable assumption for China Fiber.
3.5. 12-core fiber pig-tail Priced Way Below China Fiber's Claims
In this section we analyze in depth prices of Sifang Telecom's bundle patch cords, using those of 12-core
fiber pig-tail as benchmark:
Bundle patch cords may consist of 6, 8 or 12 connectors, though the latter is more common; and
Prices of 12-core fiber pig-tail are naturally higher than those of fewer connectors. However, even
these are being sold at levels way below those claimed by China Fiber.
Exhibit 16 above shows a screen capture of the search result, with 10 manufacturers quoting prices at a
low of Rmb32 to a high of Rmb55. The average price for 12-core fiber pig-tail was Rmb40.8 per set.
China Fiber has claimed ASP of Rmb134 per set for bundle patch cords, about 3.3x the current market
average of Rmb40.8 per set.
We have talked to two current staff of Sifang Telecom. They quoted prices of Rmb38 and Rmb42 a set
(without VAT) for 12-core fiber pig-tails, respectively, in line with the current market average. Audio
Evidence 6 and 7 are recordings of our conversations with them.
Audio Evidence 6 – Sifang Telecom Staff C Quotes Rmb38 for 12-core Fiber Pig-tail
Staff C: Twelve-core fiber pig-tail? Emerson investigator: Yes, 12-core fiber pig-tail. Staff C: Some are distribution channel prices, some are retail prices. Old customers will
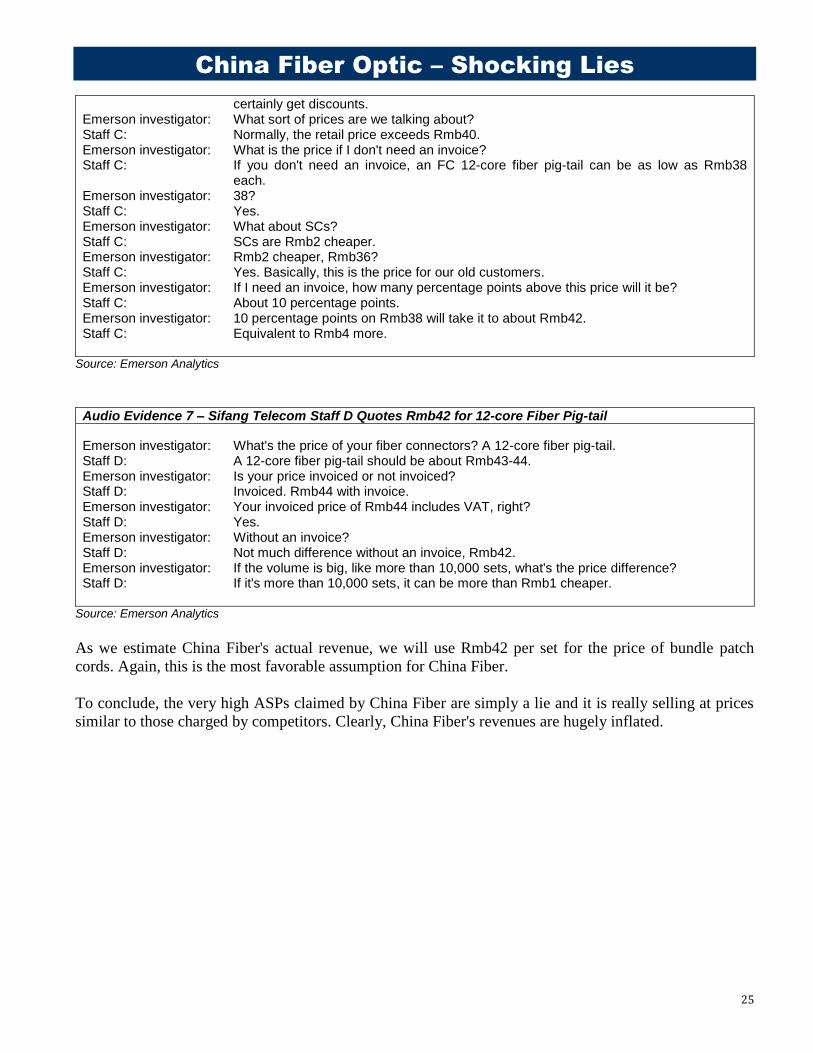
China Fiber Optic – Shocking Lies
25
certainly get discounts. Emerson investigator: What sort of prices are we talking about? Staff C: Normally, the retail price exceeds Rmb40. Emerson investigator: What is the price if I don't need an invoice? Staff C: If you don't need an invoice, an FC 12-core fiber pig-tail can be as low as Rmb38 each. Emerson investigator: 38? Staff C: Yes. Emerson investigator: What about SCs? Staff C: SCs are Rmb2 cheaper. Emerson investigator: Rmb2 cheaper, Rmb36? Staff C: Yes. Basically, this is the price for our old customers. Emerson investigator: If I need an invoice, how many percentage points above this price will it be? Staff C: About 10 percentage points. Emerson investigator: 10 percentage points on Rmb38 will take it to about Rmb42. Staff C: Equivalent to Rmb4 more.
Source: Emerson Analytics
Audio Evidence 7 – Sifang Telecom Staff D Quotes Rmb42 for 12-core Fiber Pig-tail
Emerson investigator: What's the price of your fiber connectors? A 12-core fiber pig-tail. Staff D: A 12-core fiber pig-tail should be about Rmb43-44. Emerson investigator: Is your price invoiced or not invoiced? Staff D: Invoiced. Rmb44 with invoice. Emerson investigator: Your invoiced price of Rmb44 includes VAT, right? Staff D: Yes. Emerson investigator: Without an invoice? Staff D: Not much difference without an invoice, Rmb42. Emerson investigator: If the volume is big, like more than 10,000 sets, what's the price difference? Staff D: If it's more than 10,000 sets, it can be more than Rmb1 cheaper.
Source: Emerson Analytics
As we estimate China Fiber's actual revenue, we will use Rmb42 per set for the price of bundle patch
cords. Again, this is the most favorable assumption for China Fiber.
To conclude, the very high ASPs claimed by China Fiber are simply a lie and it is really selling at prices
similar to those charged by competitors. Clearly, China Fiber's revenues are hugely inflated.
China Fiber Optic – Shocking Lies
26
Part 4. Financials and Valuation
When we began to prepare this report, we planned to analyze China Fiber's real profitability and its actual
financial position, and then attempt a valuation on the company based on its actual profit and asset
conditions, as we had done with our previous reports.
As we found out more about China Fiber's flagrant acts of fraud, we felt increasingly that there was no
need to look into such details. We believe anyone who has carefully read the first three parts of this report
will agree with us.
Thus, in the financial analysis section, we will focus on China Fiber's revenue. During 2008-2014, it had
cumulative revenue of Rmb8.55bn. So, who were its clients?
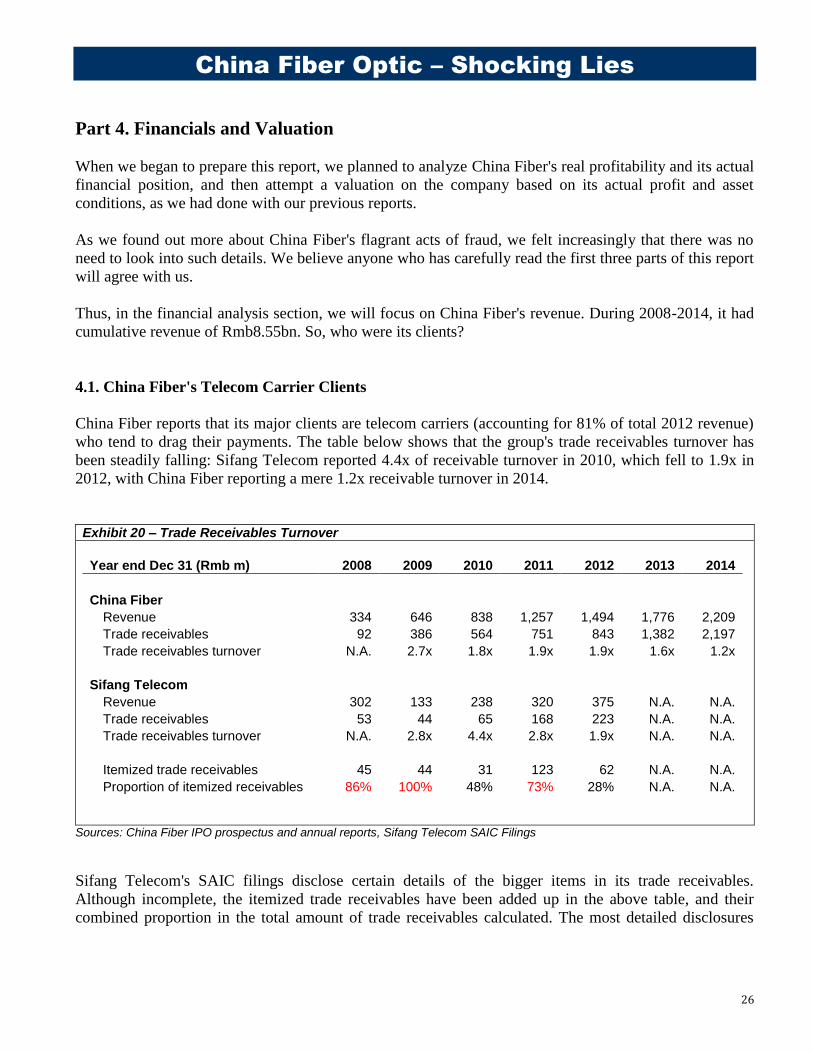
4.1. China Fiber's Telecom Carrier Clients
China Fiber reports that its major clients are telecom carriers (accounting for 81% of total 2012 revenue)
who tend to drag their payments. The table below shows that the group's trade receivables turnover has
been steadily falling: Sifang Telecom reported 4.4x of receivable turnover in 2010, which fell to 1.9x in
2012, with China Fiber reporting a mere 1.2x receivable turnover in 2014.
Exhibit 20 – Trade Receivables Turnover
Year end Dec 31 (Rmb m) 2008 2009 2010 2011 2012 2013 2014
China Fiber
Revenue 334 646 838 1,257 1,494 1,776 2,209
Trade receivables 92 386 564 751 843 1,382 2,197
Trade receivables turnover N.A. 2.7x 1.8x 1.9x 1.9x 1.6x 1.2x
Sifang Telecom
Revenue 302 133 238 320 375 N.A. N.A.
Trade receivables 53 44 65 168 223 N.A. N.A.
Trade receivables turnover N.A. 2.8x 4.4x 2.8x 1.9x N.A. N.A.
Itemized trade receivables 45 44 31 123 62 N.A. N.A.
Proportion of itemized receivables 86% 100% 48% 73% 28% N.A. N.A.
Sources: China Fiber IPO prospectus and annual reports, Sifang Telecom SAIC Filings
Sifang Telecom's SAIC filings disclose certain details of the bigger items in its trade receivables.
Although incomplete, the itemized trade receivables have been added up in the above table, and their
combined proportion in the total amount of trade receivables calculated. The most detailed disclosures
China Fiber Optic – Shocking Lies
27
were made in 2009, 2008 and 2011, when 100%, 86% and 73% of the year's trade receivables were
itemized. The list of clients with receivables outstanding to Sifang Telecom in 2009 was so detailed that
even amounts under Rmb1.0 were included. For convenience's sake, we look at 2008 to illustrate Sifang
Telecom's financial conditions.
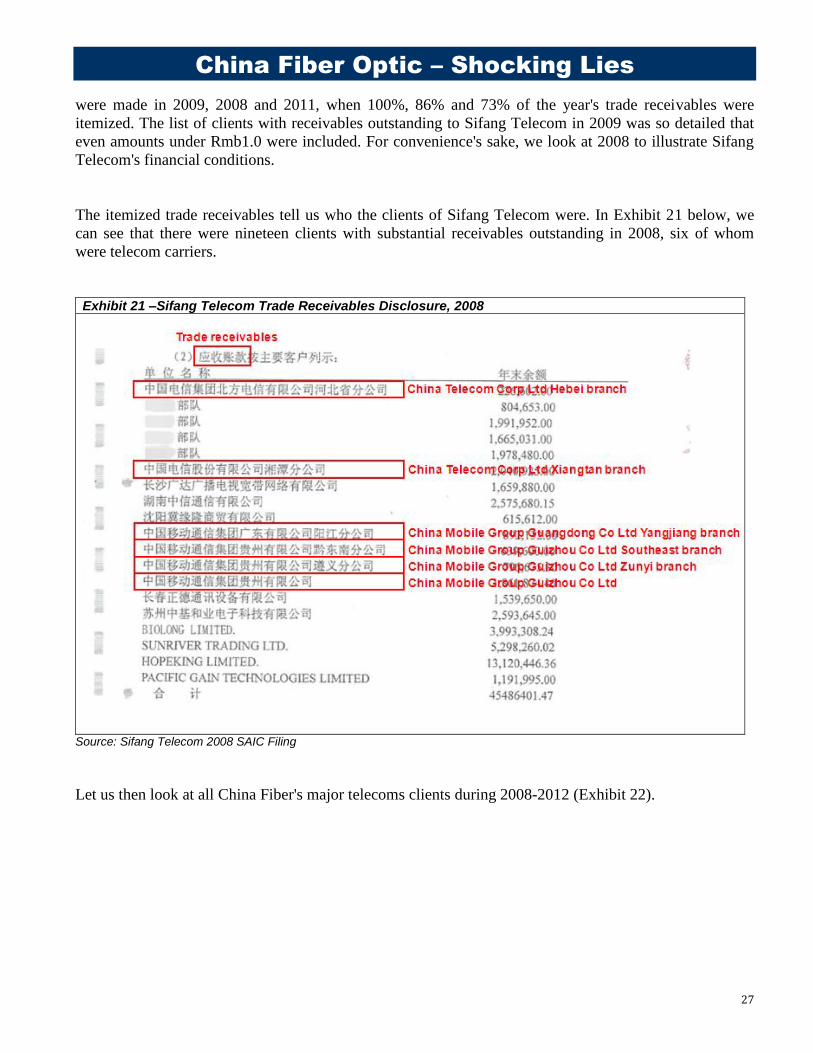
The itemized trade receivables tell us who the clients of Sifang Telecom were. In Exhibit 21 below, we
can see that there were nineteen clients with substantial receivables outstanding in 2008, six of whom
were telecom carriers.
Exhibit 21 –Sifang Telecom Trade Receivables Disclosure, 2008
Source: Sifang Telecom 2008 SAIC Filing
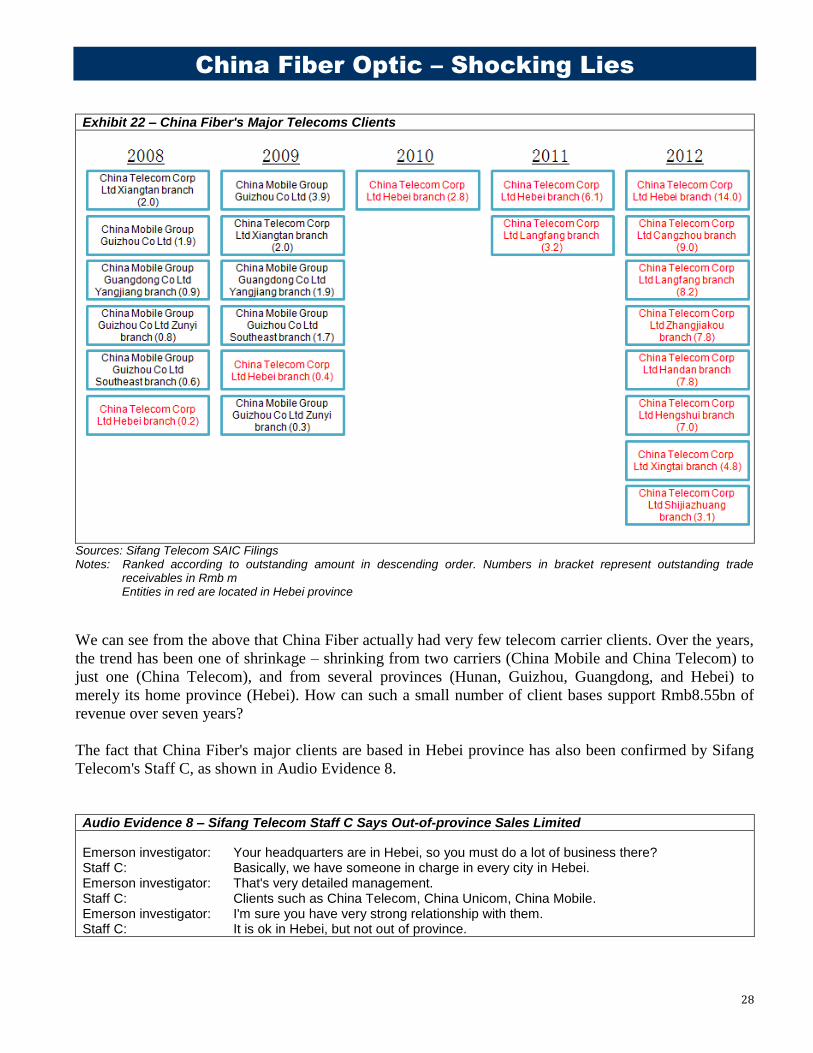
Let us then look at all China Fiber's major telecoms clients during 2008-2012 (Exhibit 22).
China Fiber Optic – Shocking Lies
28
Exhibit 22 – China Fiber's Major Telecoms Clients
Sources: Sifang Telecom SAIC Filings Notes: Ranked according to outstanding amount in descending order. Numbers in bracket represent outstanding trade
receivables in Rmb m Entities in red are located in Hebei province
We can see from the above that China Fiber actually had very few telecom carrier clients. Over the years,
the trend has been one of shrinkage – shrinking from two carriers (China Mobile and China Telecom) to
just one (China Telecom), and from several provinces (Hunan, Guizhou, Guangdong, and Hebei) to
merely its home province (Hebei). How can such a small number of client bases support Rmb8.55bn of
revenue over seven years?
The fact that China Fiber's major clients are based in Hebei province has also been confirmed by Sifang
Telecom's Staff C, as shown in Audio Evidence 8.
Audio Evidence 8 – Sifang Telecom Staff C Says Out-of-province Sales Limited
Emerson investigator: Your headquarters are in Hebei, so you must do a lot of business there? Staff C: Basically, we have someone in charge in every city in Hebei. Emerson investigator: That's very detailed management. Staff C: Clients such as China Telecom, China Unicom, China Mobile. Emerson investigator: I'm sure you have very strong relationship with them. Staff C: It is ok in Hebei, but not out of province.
China Fiber Optic – Shocking Lies
29
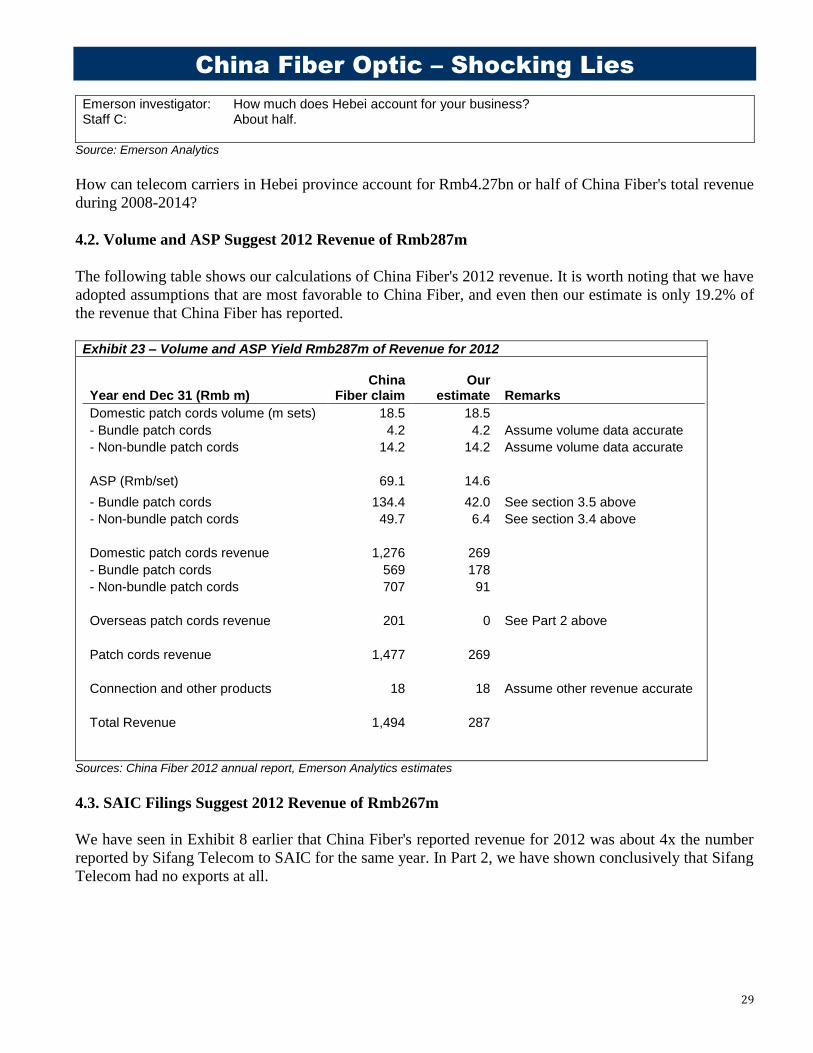
Emerson investigator: How much does Hebei account for your business? Staff C: About half.
Source: Emerson Analytics
How can telecom carriers in Hebei province account for Rmb4.27bn or half of China Fiber's total revenue
during 2008-2014?
4.2. Volume and ASP Suggest 2012 Revenue of Rmb287m
The following table shows our calculations of China Fiber's 2012 revenue. It is worth noting that we have
adopted assumptions that are most favorable to China Fiber, and even then our estimate is only 19.2% of
the revenue that China Fiber has reported.
Exhibit 23 – Volume and ASP Yield Rmb287m of Revenue for 2012
Year end Dec 31 (Rmb m) China
Fiber claim Our
estimate Remarks
Domestic patch cords volume (m sets) 18.5 18.5
- Bundle patch cords 4.2 4.2 Assume volume data accurate
- Non-bundle patch cords 14.2 14.2 Assume volume data accurate
ASP (Rmb/set) 69.1 14.6
- Bundle patch cords 134.4 42.0 See section 3.5 above
- Non-bundle patch cords 49.7 6.4 See section 3.4 above
Domestic patch cords revenue 1,276 269
- Bundle patch cords 569 178
- Non-bundle patch cords 707 91
Overseas patch cords revenue 201 0 See Part 2 above
Patch cords revenue 1,477 269
Connection and other products 18 18 Assume other revenue accurate
Total Revenue 1,494 287
Sources: China Fiber 2012 annual report, Emerson Analytics estimates
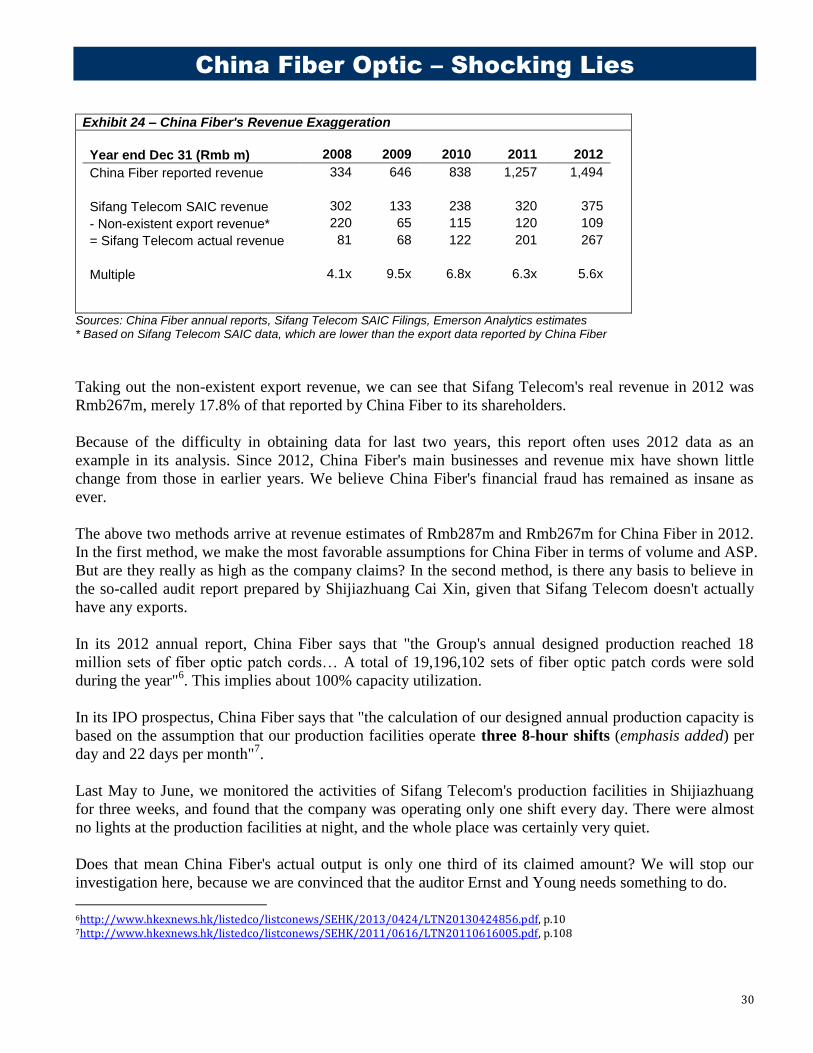
4.3. SAIC Filings Suggest 2012 Revenue of Rmb267m
We have seen in Exhibit 8 earlier that China Fiber's reported revenue for 2012 was about 4x the number
reported by Sifang Telecom to SAIC for the same year. In Part 2, we have shown conclusively that Sifang
Telecom had no exports at all.
China Fiber Optic – Shocking Lies
30
Exhibit 24 – China Fiber's Revenue Exaggeration
Year end Dec 31 (Rmb m) 2008 2009 2010 2011 2012
China Fiber reported revenue 334 646 838 1,257 1,494
Sifang Telecom SAIC revenue 302 133 238 320 375
- Non-existent export revenue* 220 65 115 120 109
= Sifang Telecom actual revenue 81 68 122 201 267
Multiple 4.1x 9.5x 6.8x 6.3x 5.6x
Sources: China Fiber annual reports, Sifang Telecom SAIC Filings, Emerson Analytics estimates * Based on Sifang Telecom SAIC data, which are lower than the export data reported by China Fiber
Taking out the non-existent export revenue, we can see that Sifang Telecom's real revenue in 2012 was
Rmb267m, merely 17.8% of that reported by China Fiber to its shareholders.
Because of the difficulty in obtaining data for last two years, this report often uses 2012 data as an
example in its analysis. Since 2012, China Fiber's main businesses and revenue mix have shown little
change from those in earlier years. We believe China Fiber's financial fraud has remained as insane as
ever.
The above two methods arrive at revenue estimates of Rmb287m and Rmb267m for China Fiber in 2012.
In the first method, we make the most favorable assumptions for China Fiber in terms of volume and ASP.
But are they really as high as the company claims? In the second method, is there any basis to believe in
the so-called audit report prepared by Shijiazhuang Cai Xin, given that Sifang Telecom doesn't actually
have any exports.
In its 2012 annual report, China Fiber says that "the Group's annual designed production reached 18
million sets of fiber optic patch cords… A total of 19,196,102 sets of fiber optic patch cords were sold
during the year"6. This implies about 100% capacity utilization.
In its IPO prospectus, China Fiber says that "the calculation of our designed annual production capacity is
based on the assumption that our production facilities operate three 8-hour shifts (emphasis added) per
day and 22 days per month"7.
Last May to June, we monitored the activities of Sifang Telecom's production facilities in Shijiazhuang
for three weeks, and found that the company was operating only one shift every day. There were almost
no lights at the production facilities at night, and the whole place was certainly very quiet.
Does that mean China Fiber's actual output is only one third of its claimed amount? We will stop our
investigation here, because we are convinced that the auditor Ernst and Young needs something to do.
6http://www.hkexnews.hk/listedco/listconews/SEHK/2013/0424/LTN20130424856.pdf, p.10 7http://www.hkexnews.hk/listedco/listconews/SEHK/2011/0616/LTN20110616005.pdf, p.108
China Fiber Optic – Shocking Lies
31
4.4. Valuation
There is no doubt China Fiber's financial statements are seriously fraudulent at some 6-10x revenue
fabrication, to the extent that there is simply no need for a valuation analysis. For a long-running case of
criminal deception, the only appropriate regulatory action is Delisting.