China Energy Outlook - U.S. Energy Information ... its central scenario is not fully developed to...
27
XIAOJIE XU CHAIR FELLOW, WORLD ENERGY CHINA OUTLOOK INSTITUTE OF WORLD ECONOMICS AND POLITICS, CHINESE ACADEMY OF SOCIAL SCIENCES China Energy Outlook 2020 2014-7-15 Washington DC World Energy China Outlook | Xiaojie Xu and Chen Tangsi | [email protected] 1
Transcript of China Energy Outlook - U.S. Energy Information ... its central scenario is not fully developed to...

XIA OJIE XU
C H A I R F E L L O W , W O R L D E N E R G Y C H I N A O U T L O O K I N S T I T U T E O F W O R L D E C O N O M I C S A N D P O L I T I C S ,
C H I N E S E A C A D E M Y O F S O C I A L S C I E N C E S
China Energy Outlook 2020
2014-7-15 Washington DC World Energy China Outlook | Xiaojie Xu and Chen Tangsi | [email protected]
1

World Energy China Outlook 2014-2015
Annual
interactive Energy Outlook
Mid-year Updates
IWEP Energy Chinese Academy of Social
Sciences
2014-7-15 Washington DC World Energy China Outlook | Xiaojie Xu and Chen Tangsi | [email protected]
2

Content
I. Scenarios, Assumption and Database II. Some Findings III. Conclusions
2014-7-15 Washington DC World Energy China Outlook | Xiaojie Xu and Chen Tangsi | [email protected]
3

Outlook Scenario: EES
Our research emphasizes energy policy and its implications on energy developments with a set of assumptions.
We conduct a comparative review between our report and IEA World Energy Outlook 2012 and 2013 Editions finding IEA’s New Policy Scenario, its central scenario is not fully developed to fit China’s realities.
We decided to develop our own central policy scenario, i.e., Eco-friendly Energy Strategy, to back up our research and outlook within the outlook period (2011-2030).
2014-7-15 Washington DC World Energy China Outlook | Xiaojie Xu and Chen Tangsi | [email protected]
4

Assumptions
IEA’s CPS IWEP’s EES
1. GDP $ Industries Global GDP growth rate 3.6% in 2011-2035 while China GDP 8.1% in 2011-2020, 5.7% in 5.7% in 2011-2035
China GDP growth rate 7.67% in 2013, 7.5% in 2014-2015), 7.0% in 2016-2020; elasticity=0.5
2. Population & Urbanization
Worldwide: 7-8.7 billion from 2012 to 2035 with annual growth rate at 0.9%
China: 1.354 billion in 2012, projected to be 1.44 billion with annual growth rate 0.77%. 1.47 billion in 2030 with annual rate 0.21%
3. Pricing & Subsidies
Oil: imported at $113/bbl in 2020 and $128/bbl in 2035. Gas price gap narrowed. Coal price remain lower than oil.
China: oil product prices will be international. Domestic gas price will be reformed upward as benchmarking in Asia by 2020.
2014-7-15 Washington DC World Energy China Outlook | Xiaojie Xu and Chen Tangsi | [email protected]
5

Assumptions continued
IEA’s CPS IWEP’s EES
4. Energy Conversion Coal Conversion Ratio 38.27% in 2013
Coal Conversion Ratio 38.27% in 2013, 39.63% in 2015 and 40.28% in 2020
5. CO2 Constraints
Global: CO2 emission will increase 34% by 2035 from 8% in 2012. If carbon marketing initiated in all sector, carbon price could $30 per ton in 2035 from $10/ton in 2020.
In China, 45% carbon emission will be reduced in 2020. Carbon tax could be better option than carbon marketing.
6. Technology
Technology in use or under development will be cost effective in association of energy supply and demand
Technology innovation presents huge potential in China, esp. clean coal, energy efficiency and CCUS will be expanded wider after 2020. Therefore, outcome of energy saving and emission will outstrip those envisioned by the IEA.
2014-7-15 Washington DC World Energy China Outlook | Xiaojie Xu and Chen Tangsi | [email protected]
6

10 sets of technologies Global China Forward Looking
Clean Coal Coal chemical and coal power integration
Clean coal tech spread around 2020, coal2gas under development
Cost reduction and water solutions to be explored
Unconventional Drilling
US, Poland, Australia, etc. Development approach toward tight gas, CBM and shale. Unconventional rate will be upward to 67% in 2020
Comprehensive solutions dealing with uncertainties in geology, technology, infrastructure and regulations
Deep Water Deep and ultra-deep water E&P activities and produce 200 Mt in 2020
Moving to deep water for production 50 Mt in 2020
Further openness and technology & equipment innovation
Renewable electricity
Solar PV capacity grow at 42% while wind capacity grow at 27%
Solar and wind power sector are under restructuring for higher increases
Cost effectiveness and policy supports are required。
Nuclear Nuclear plants are under review and re-start. 15-20 nuclear plants could be restored, Nuclear power could account for 15%.
Currently, 21 nuclear plants under operations, 28 more plants are planned. 50 GW in 2020
Benchmarking pricing and safety & security, plus public awareness
CCUS 13 large CCS pilot projects are under operation or construction
CCUS (2+9) is listed into its 5-year energy Hi-tech planning
Enhance financing and policy supports, increase pilot projects
Bio energy Enhance policy supports and further investment dealing with over investments
Promoting bio energy diversification (fuel, power, gas) fitting local requirements
Provide policy incentives to build up confidence and promote R&D while promote international cooperation
HEV/EV HEV/EV sale increase sharply for better future
Working on HEV technical routes and standards and promote in major cities in 2015
Further reduce battery costs, plus logistics。
Energy Efficiency
Majority of consumers released incentive and policy
Efficiency is developed in details Diminishing obstacles
Environmental Release further development energy saving and environmental protection proposals in August 2013
Take energy saving as a new life style by launching “new energy, new life” campaign
2014-7-15 Washington DC World Energy China Outlook | Xiaojie Xu and Chen Tangsi | [email protected]
7

Key Policy under Review
# Dates Authority Documents/conference Types
1 13-1-1 State Council Five Year Plan for the Energy Industry Central
2 13-7-1 State Council Policy Briefing on Solar Sector Development Central
3 13-8-2 State Council Policy on Energy Saving and Environmental Protection Industrial Development Central
4 13-9-1 State Council Plan for Actions against Atmospheric Pollution Central
5 13-9-1 Ministry of Environmental Protection, NDRC, MOII, MOF, NEA
Implementation Details for Actions against Atmospheric Pollution in Beijing-Tianjin-Hebei and neighboring regions Inter-provincial
6 13-9-2 Hebei Province Implementation Plan for Actions against Atmospheric Pollution in Hebei Provincial
7 14-1-1 National Energy Administration National Energy Conference 2014 – Policy Briefing Sectoral
8 14-3-1 NDRC, NEA, MOEP Working Plan against Atmospheric Pollution in Energy Sector Central
9 14-4-1 State Council An Establishments of Effective Mechanisms to Enhance Natural Gas Supply – Policy Briefing Central
10 14-4-1 National Energy Commission The 2nd National Energy Commission Conference Report Central
11 14-5-1 State Council Low Carbon Plan for Actions toward Energy Saving and Reduction of Emission in 2014-2015 Central
12 14-6-1 Central Financial Steering Committee The 6th Central Financial and Economic Steering Group Conference Central
2014-7-15 Washington DC World Energy China Outlook | Xiaojie Xu and Chen Tangsi | [email protected]
8

IWEP EES/ IEA NPS/450
Policy Review
Factors
Re-adjustments
Statistical Sources
Adjustments
Energy (coal, oil, gas, non-fossil fuel)
Electricity D/S
CO2 Emission (Fossil Fuel)
Sectoral D Under
construction
IWEP Energy Outlook Database
2014-7-15 Washington DC World Energy China Outlook | Xiaojie Xu and Chen Tangsi | [email protected]
9

Supply Side Sectoral Side Total Primary Energy Demand
Service VA Services
Coal
Oil
NG
Hydro
Nuk
Bio
Others
Coal
Oil
NG
Installed Capacity
Domestic Output
Imports /Exports
Products
Value added
Miles per capita
Truck Miles
Civil Acreage
Commercial
Industry
Transport
Construct
Machinery Agriculture
IWEP Energy Outlook Database
2014-7-15 Washington DC World Energy China Outlook | Xiaojie Xu and Chen Tangsi | [email protected]
10
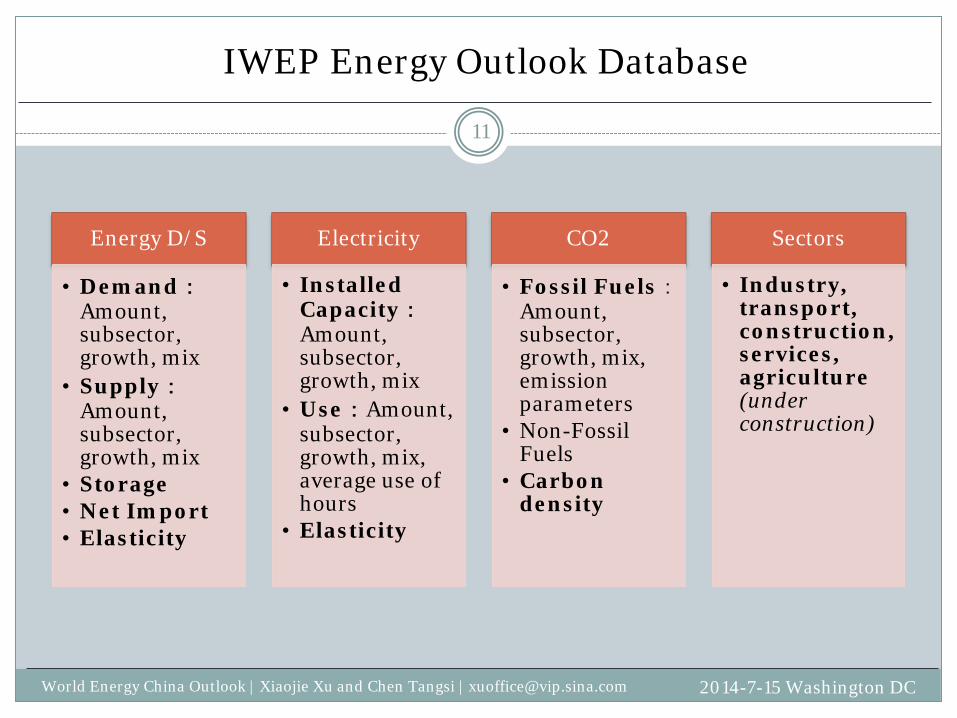
Energy D/S
• Demand:Amount, subsector, growth, mix
• Supply:Amount, subsector, growth, mix
• Storage • Net Import • Elasticity
Electricity
• Installed Capacity:Amount, subsector, growth, mix
• Use:Amount, subsector, growth, mix, average use of hours
• Elasticity
CO2
• Fossil Fuels:Amount, subsector, growth, mix, emission parameters
• Non-Fossil Fuels
• Carbon density
Sectors
• Industry, transport, construction, services, agriculture (under construction)
IWEP Energy Outlook Database
2014-7-15 Washington DC World Energy China Outlook | Xiaojie Xu and Chen Tangsi | [email protected]
11

II. Some Findings
Energy Demand Outlook 2020 Energy Supply Outlook 2020 Electricity Use CO2 Emission – fossil fuels Coal Use Efficiency Gas Mix and Foreign Dependency Energy Efficiency Policy Options: Capacity and Coal Use Reduction
2014-7-15 Washington DC World Energy China Outlook | Xiaojie Xu and Chen Tangsi | [email protected]
12

China Energy Demand Outlook 2011-2020
2000
2200
2400
2600
2800
3000
3200
3400
3600
2011 2012 2013 2014 2015 2016 2017 2018 2019 2020
IEA-Demand (NPS),
Mtoe
IWEP-Demand
IWEP-Supply
2014-7-15 Washington DC World Energy China Outlook | Xiaojie Xu and Chen Tangsi | [email protected]
13

GDP and Energy Demand
0
500
1000
1500
2000
2500
3000
3500
6.50%
7.00%
7.50%
8.00%
8.50%
2012 2013 2014 2015 2016 2017 2018 2019 2020
GDP Growth Demand
2014-7-15 Washington DC World Energy China Outlook | Xiaojie Xu and Chen Tangsi | [email protected]
14

Energy Mix - Demand
0%
10%
20%
30%
40%
50%
60%
70%
80%
90%
100%
2013 2014 2015 2016 2017 2018 2019 2020
Otherrenewables
Bio
Hydro
Nuclear
Natural Gas
Oil
Coal0
500
1000
1500
2000
2500
3000
3500
2013 2014 2015 2016 2017 2018 2019 2020
2014-7-15 Washington DC World Energy China Outlook | Xiaojie Xu and Chen Tangsi | [email protected]
15

Energy Mix - Supply
0%
10%
20%
30%
40%
50%
60%
70%
80%
90%
100%
2013 2014 2015 2016 2017 2018 2019 2020
OtherrenewablesBio
Hydro
Nuclear
Natural Gas
Oil
Coal0
500
1000
1500
2000
2500
3000
2013 2014 2015 2016 2017 2018 2019 2020
2014-7-15 Washington DC World Energy China Outlook | Xiaojie Xu and Chen Tangsi | [email protected]
16

CO2 Emission – Fossil Fuel
IWEP, 9071
IEA-NPS, 10239
IEA-450, 6100
0
2000
4000
6000
8000
10000
12000
2011 2015 2020 2025 2030
MT
2014-7-15 Washington DC World Energy China Outlook | Xiaojie Xu and Chen Tangsi | [email protected]
17

Electricity Use
Coal remains cost effective and stable source of power generation while wind plus solar will be seen growth momentum.
2014-7-15 Washington DC World Energy China Outlook | Xiaojie Xu and Chen Tangsi | [email protected]
18
0
1000
2000
3000
4000
5000
6000
7000
8000
2013 2014 2015 2020
Others
Solar
Wind
Bio
Hydro
NuclearGas
Coal
66%
16%
6%
76%
17%
5%

Coal Use Efficiency
Coal is turning to be both fuels and feedstock in consumption.
37.00%
37.50%
38.00%
38.50%
39.00%
39.50%
40.00%
40.50%
0
200
400
600
800
1000
1200
1400
1600
1800
2000
2013 2015 2020
Others
Coal2Gas
Coal fired
Conversion Ratio53%
47%
54%
44%
55%
4%
41%
Mtoe
2014-7-15 Washington DC World Energy China Outlook | Xiaojie Xu and Chen Tangsi | [email protected]
19

Natural Gas: Mix and Foreign Dependency
Bcm
2014-7-15 Washington DC World Energy China Outlook | Xiaojie Xu and Chen Tangsi | [email protected]
20
20.00%
25.00%
30.00%
35.00%
40.00%
45.00%
50.00%
0
50
100
150
200
250
300
350
400
450
500
2013 2015 2020
LNG Imported
PNG Imported
Unconventional
Conventional
ForeignDependency

Gas fired Use in NG
Gas fired generation will be demand variable source and remain at lower level due to costs and interrupted use.
0%
10%
20%
30%
40%
50%
60%
70%
80%
90%
100%
2013 2015 2020
2014-7-15 Washington DC World Energy China Outlook | Xiaojie Xu and Chen Tangsi | [email protected]
21
0%
10%
20%
30%
40%
50%
60%
70%
80%
90%
100%
1996 2000 2008 2010 2012
Chemicals
Gas fired
Industrial Fuels
City Gas

Energy and Carbon Intensity
2014-7-15 Washington DC World Energy China Outlook | Xiaojie Xu and Chen Tangsi | [email protected]
22
0.0
0.5
1.0
1.5
2.0
2.5
3.0
0.0
0.2
0.4
0.6
0.8
1.0
1.2
2005 2010 2015 2020
Carbon Intensity
Energy Intensity
-49.5%
-42.0%
CO2 Ton/10K RMB
Oil Ton/10K RMB

Capacity Shut-down by 2015
Output reduction Unit Coal saving (10 k standard tones)
Iron-making 1500 10 k tones 600
Steel-making 1500 ibid 900
Cement 10000 ibid 1200
Flat Glass 2000 10 th weight cases 1000
Total 3700
Over invested capacity is targeted to reduce energy/coal consumption by the end of 2015 and beyond.
As planned, some surplus of capacity in iron, steel, cement, and flat glass (main user of energy sectors) is slated to shut down with 37 million tone coal standard tones will be shrunk by the 2015.
Such a shrinking pace will continue.
2014-7-15 Washington DC World Energy China Outlook | Xiaojie Xu and Chen Tangsi | [email protected]
23

Capacity Shut down in Hebei Province by 2017
Shut down Output Unit Coal saving (10 k standard tones)
Steel 6000 10 k tones 3000
Cement 6100 ibid 732
Coal 4000 ibid 126
Flat Glass 3600 10 th weight cases 1800
Total 5658
Taking Hebei province as an example, by 2017, over 5658 million tones of coal use could be diminished.
This reflects a trajectory of coal use prevailing in three consuming regions (Beijing-Tianjin-Hebei region, Yangtz river region, and Zhu River region) and energy producing provinces in Shanxi, Shangxi and Inner Mongolia.
2014-7-15 Washington DC World Energy China Outlook | Xiaojie Xu and Chen Tangsi | [email protected]
24

III. Conclusions
China energy demand is reviewed at slower growth to 2020 than last year at 2.06%, while energy supply will keep pace up, accordingly. But the gap between the two remains large.
CO2 emission will continue to grow but level off a bit than expected. Electricity consumption is growing with some uncertainties. Coal, as a
quality source of power generation, is expected to be main source but debate remains at present and subject to clean coal technology and policy incentives into the future.
City gas and industrial fuel will be main sectors of natural gas usage in China while gas fired generation remains at lower level.
2014-7-15 Washington DC World Energy China Outlook | Xiaojie Xu and Chen Tangsi | [email protected]
25

III. Conclusions
Currently, coal use reduction remain a policy option. However, clean coal and efficiency enhancement are critical consideration. Coal use efficiency and conversion rate is expected to increase.
Renewables is subject to cost reduction, business models and utilization (with fossil fuels and distributed consumption smartly).
The 13th Five Year Plan (2016-2020) turns to be a critical to Chinese expected energy revolution, which could come with further economic reforms including industrial restructuring, efficiency enhancement, plus police incentives.
2014-7-15 Washington DC World Energy China Outlook | Xiaojie Xu and Chen Tangsi | [email protected]
26

Xiaojie Xu
2014-7-15 Washington DC World Energy China Outlook | Xiaojie Xu and Chen Tangsi | [email protected]
27
Xiaojie Xu, the Chief Fellow of the annual World Energy China Outlook and heads up the World Energy Division (since April 2009) at Institute of World Economics and Politics, Chinese Academy of Social Sciences in Beijing; a Member of the World Economic Forum's Global Agenda Council on Energy Security, an Editorial Board member of the Journal of World Energy Law and Business, a senior advisor to China Energy Fund, a standing member of petroleum economics sub-committee of China Petroleum Society; Previously, had worked at China National Petroleum Corporation (CNPC, 1983-2009) and was the Director of Institute of Overseas Investment Research, CNPC (2000-2009), has been advising the National Energy Administration on oil and gas policy and international energy policy, and CNPC, CNOOC and some other state owned energy companies on global expansion specializing in geopolitical, economical, commercial, regulatory, and contractual review, business development and risk management; is the author of Petro-Dragon’s Rise, what it means for China and the World (English, European Press, 2002) and Energy Black Swan: Global Games for Hydrocarbon Resources and Chinese Options (in Chinese, 2011) along with numerous writing and speeches on energy investment, corporate strategy and governance, and geopolitics of energy in both Chinese and English. Graduated from Zhejiang University in 1983.