China Dairy Market Update April 30, 2013 - Orrani Consulting Consulting - ADPI Slides for...
31
China Dairy Market Update April 30, 2013
Transcript of China Dairy Market Update April 30, 2013 - Orrani Consulting Consulting - ADPI Slides for...

China Dairy
Market Update
April 30, 2013

Introduction –
Orrani Consulting

International Dairy Industry Projects
Cheese route to market study - Russia
Dairy market entry – Thailand
Dairy partner search – SEA
Dairy supply & demand study – India
Dairy market
entry study – Iraq
Whey ingredient
opportunity study -
China
Dairy foodservice brand
development – China
Artisanal /
speciality
cheese
market
entry study
– US
Dairy trade
policy
analysis for
whey JV –
Brazil
Dairy ingredient
study – Vietnam
Infant formula market
entry – Philippines
Dairy export
strategy –
Scotland
Organic milk study – China
Dairy market
assessment –
West Africa
Cheese export strategy
– Greece Yoghurt/dessert
study – Japan
Yoghurt/dessert
study – Latin
America
Baby foods
market
assessment –
Mexico
Dairy export study
– Caribbean
Dairy market entry
study – South
Africa
Dairy ingredient assessment - Russia
Dairy export study
– Mauritius
Dairy sector
review – Sub-
Saharan Africa
Dairy trade visit hosting -
Indonesia
Cheese & butter marketing program – Asia
Global dairy buyer survey – Asia, Latin America, MENA,
Europe
Global dairy commodity trade/policy/economics analysis
Strategic review, dairy
industry – Australasia
Whey market
assessment –
Canada
Due diligence
assessment
– US

China ‒ Major Ongoing Change

Continuing Period of National Change
President
Hu Jintao
Li Keqiang Wen Jiabao
Xi Jinping
(& Peng Liyuan!)
Premier
In Out

China is the world factory for food re-exporting
after processing
Now a key market for imported food
with increased domestic consumption
China Food Market – Changes • Gap between import & export has
increased from almost zero in 2006
• H1 2012 ‒ food imports were $54.72
billion, 2 x the export value
• Forecast to become the world’s
largest consumer of imported foods
Limited market for high-value food items due to
low purchasing power
Market entries for diverse range of
premium food products
• Ever-increasing disposable income
makes imported goods affordable
• Diverse premium imported foods are
now widely available in China
market and are selling well

China Food Market – Changes
Immature sales networks
and underdeveloped facilities
Strong advances in different channels
• Retail ‒ Set to be the 3rd largest
retail market by 2025 ($2 trillion)
• Foodservice ‒ 30,000+ western
style restaurants
• Logistics ‒ 20,000+ cold stores
Chinese consumers very price sensitive
Growing consumer awareness of
quality and safety of food due to:
- Increasing number of food safety scandals - More exposure to foreign cultures/lifestyles - One-child policy, young generation, white
collars
• Consumer shift from price- to
quality-orientation
• Willing to spend up to 20% more
for premium food products with
quality and safety guaranteed

Per Capita Disposable Income in China
– Urban Residents
RMB24,565 = Close to $4,000
10,493
11,760
13,786
15,781
17,175
19,109
21,810
24,565
-
5,000
10,000
15,000
20,000
25,000
30,000
2006 2007 2008 2009 2010 2011 2012 2013
RM
B

Recent Openings Outside Tier 1 Cities
• Starbucks in Datong (Tier 3), Apple in Chengdu (Tier 2)
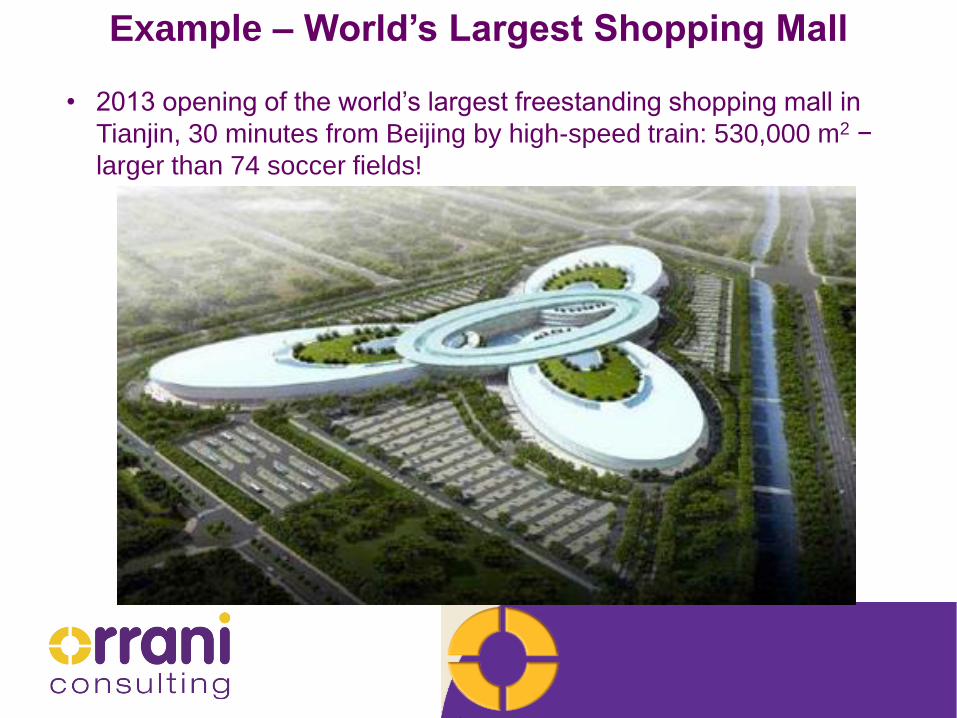
• 2013 opening of the world’s largest freestanding shopping mall in
Tianjin, 30 minutes from Beijing by high-speed train: 530,000 m2 −
larger than 74 soccer fields!
Example – World’s Largest Shopping Mall
Dairy in China ‒
Trends and Opportunities
Dairy Farming Development Ongoing
• Supply/demand gap remains
• Production 37.44 million MT in 2012, up only 5%
• Demand 40-41 million MT
• Fonterra predicts national demand of 70 billion L by 2020
• 5YP of September 2011 targets
• 38% of cows on large-scale dairy farms (100+ cows) by 2015 (vs 28%)
• Many regional governments had earlier pushed in similar direction
• Examples of key investments in large-scale farms in 2012
• January: Nestlé − $395 million, 5 yr program, Heilongjiang
• June: New Hope − $158 million, 3-5 years, East China, Sichuan, Yunnan
• August: Yili − $190 million in 2012 alone (after $1.2 billion 2007-2011)
• September: Mengniu − $553 million, next 5 years

Dairy Industry Output Recovering
• Output up from 23.8 to 25.5 million MT
1,658 1,534
1,784 1,839 1,854
2,095 2,231 2,116 2,143 2,086
2,148 2,341
1,763 1,711
1,964 1,909
1,989
2,152 2,095 2,129
2,474
2,256
2,458 2,551
100
600
1,100
1,600
2,100
2,600
3,100
Jan Feb Mar Apr May Jun Jul Aug Sep Oct Nov Dec
'000 MT
2011 2012 Linear (2012)
Source: Dairy Association of China

Regional Perspectives – 2012 Output
3,257 3,207
2,726
1,858
1,677
-15%
2.9%
1.3%
4.2%
5.7%
-20%
-15%
-10%
-5%
0%
5%
10%
0
500
1,000
1,500
2,000
2,500
3,000
3,500
IMAR Shandong Hebei Heilongjiang Henan
'000 MT
Output Growth rate
• IMAR output down 15% in 2012, but other key regions grew
Source: Dairy Association of China

Import Demand Still Trending Upwards
405,557
167,553
378,380
91,282
48,326 38,806
0
50,000
100,000
150,000
200,000
250,000
300,000
350,000
400,000
450,000
WMP SMP Whey Infant Formula Butter Cheese
MT
2008
2009
2010
2011
2012
WMP
imports -
124,775 MT
in Jan-Feb
2013, up
50% vs. Jan-
Feb 2012
23% NL
18% NZ
17%FR
What impact
could a
China-US
FTA have on
trade?
Source: China Customs
96% NZ 63% NZ
11% US
46% US
15% FR
89% NZ 44% NZ
24% US
20% AUS

Rising Farmgate Prices
• The raw milk price in China increased constantly in 2012-2013 due to
• Rising prices of corn (+4% y-o-y in March) and soy meal (+23%)
• Increasing demand
• Trend likely to continue in 2013 ‒ 8% rise?
• Shanghai: current base price of RMB4/kg ‒ $0.65
0.54 0.54
0.54 0.55
0.50
0.52
0.54
0.56
0.58
0.60
December January February March
$/k
g
Source: Dairy Association of China

Retail Prices Following Suit
1.42
1.48
1.86
1.99
1.30
1.40
1.50
1.60
1.70
1.80
1.90
2.00
US
D/k
g
Milk Products
Yoghurt
30.59
32.10
22.80
24.57
20
22
24
26
28
30
32
34
US
D/k
g
Multinational IF
Domestic IF
Source: Ministry of Commerce

Food Safety Remains Work in Progress
• March 10 − new “superministry” − General Food
& Drug Administration to take over tasks from
• Ministry of Agriculture ‒ focused on milk
production/collection/distribution
• General Administration of Quality Supervision,
Inspection & Quarantine (AQSIQ) ‒ dealing with
imported and local foods
• State Administration of Industry and Commerce (SAIC)
– products from factory door to point of sale
• Ministry of Health/MOH – approves foods/substances
with no local standard
• Bureau of Public Security/BPS – enforces Criminal Law
• Regulations are being continually overhauled
• Mainstream foreign brands = “reassuringly expensive”
Key requirement − more prevention and less reaction

Y-o-Y Growth ‒ How’s the Local Industry Doing?
8.12 8.53
9.44 9.86
10.25 10.22 10.26
11.70
0.39 0.52 0.49 0.51 0.58 0.77 0.49
0.86
19.3% 21.4% 22.3% 18.5%
22%
16.6% 11.3% 18.5%
8.2%
76.2%
16.7%
9.2%
42.0%
43.4%
-1.9%
25.2%
-20%
0%
20%
40%
60%
80%
100%
0
2
4
6
8
10
12
14
Q1 2011 Q2 2011 Q3 2011 Q4 2011 Q1 2012 Q2 2012 Q3 2012 Q4 2012
(Billion $)
Sales Total profit Growth rate of sales Growth rate of total profit
• ~18% of the country’s 649 processors made losses in 2012 (2011: 16%)
• But profitability growth outpacing sales growth – premium products
Source: CEMAC/NBS
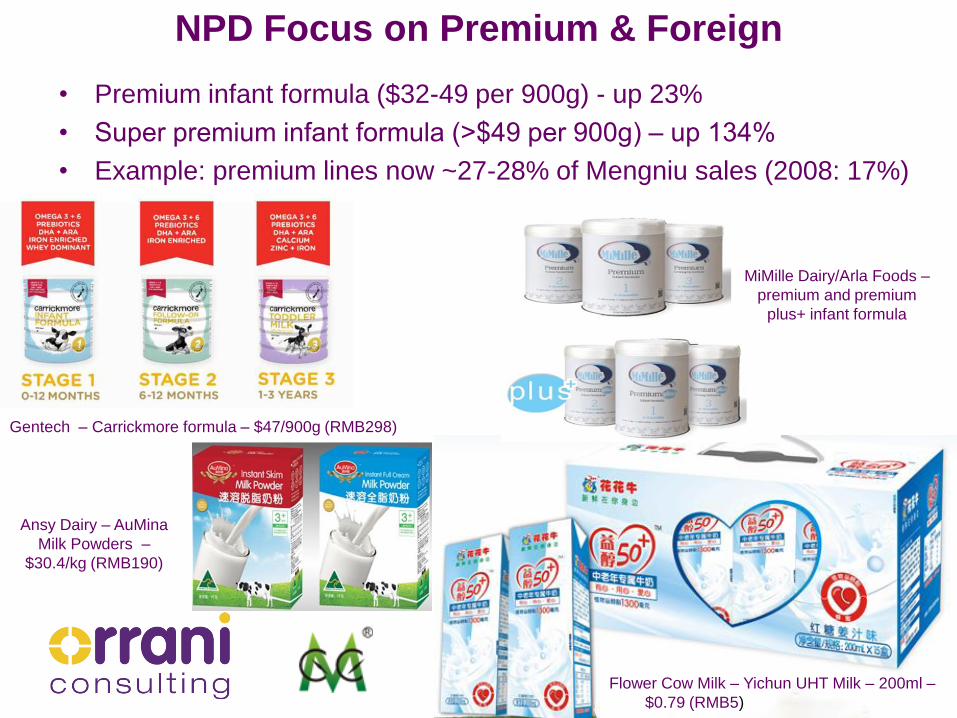
NPD Focus on Premium & Foreign
Flower Cow Milk – Yichun UHT Milk – 200ml –
$0.79 (RMB5)
Ansy Dairy – AuMina
Milk Powders –
$30.4/kg (RMB190)
Gentech – Carrickmore formula – $47/900g (RMB298)
MiMille Dairy/Arla Foods –
premium and premium
plus+ infant formula
• Premium infant formula ($32-49 per 900g) - up 23%
• Super premium infant formula (>$49 per 900g) ‒ up 134%
• Example: premium lines now ~27-28% of Mengniu sales (2008: 17%)

45%
5% 20%
30% Yili
Bright
Mengniu
Others
Major Domestic Brands in China

Role Reversal at the Top?
• Bright Dairy ($2 billion)
• Reasonable profit performance in 2012: H1 +61.9%, Q3 +16.7%
• More premium products, diversified sales channels
• Conspicuous underperformers?
• Beijing Sanyuan − profitable on liquid/yoghurt, but Sanlu acquisition difficult,
growth elusive
• Wandashan − Heilongjiang’s advantages not realised
Yili ($7 billion)
• Known for
“proper”, less
edgy approach
• Now seeking
innovation and
profitability
• NZ investment
Mengniu ($6 billion)
• Traditionally aggressive
approach
• Now increasingly risk
averse (COFCO & Arla
2 key shareholders)
• Focus on premium

Snapshot 1 ‒ Modern Dairy: Growth & Widening Customer Base
• Beneficiary of state push for
• Large-scale dairy farming
• Production growth 2015 – 50 million MT / 2020 – 64 million MT
• Sales USD173.9 million (RMB1,092 million) – up 48.5%
• Pre-tax profit USD28.3 million (RMB178 million) – up 9.2%
• 22 farms – targets 30+ by 2015
• 176,264 cows – targets 260,000+ by 2015
• Milk sales 260,906 MT – up 33.6% (vs H1 2012)
• Less reliance on Mengniu seems likely (unless its acquired by Mengniu!)
• 86.7% sold to Mengniu – down 11.8%
• Diversification / risk mitigation
• COFCO driving Mengniu to develop own farms
Note: Based on H1 2013
(June–December 2012)

Snapshot 2 ‒ Yakult: Pushing Inland
• Currently building 3rd plant in China, for 2014 completion
• Local production capacity will be ~2.86 million bottles/day,
facilitating further expansion into the cities in inland
• Strategic rollout:
• Focus on coastal
regions after market
entry (2001)
• Developed sales in
Wuhan (2009),
Xi’an and
Changsha (2012)
• Sales office in
Chengdu (January
2013)

Snapshot 3 ‒ Want Want: Pushing Inland
• Sales $3,358 million (+14% vs 2011)
• Net profit $554 million (+32%)
• Dairy products & beverages now 50.9% of sales
• Fastest growing business segment +22.6% vs rice
vs. crackers -6.5%, snack foods +14.8%
• Targeting growth in 3rd / 4th tier cities
34.4% 36.1% 27.4% 28.0% 27.7% 24.2%
29.0% 28.8%
25.4% 23.7% 24.5% 24.7%
35.7% 34.5% 46.6% 47.6% 47.3% 50.9%
0.9% 0.6% 0.6% 0.7% 0.5% 0.2%
0%
10%
20%
30%
40%
50%
60%
70%
80%
90%
100%
2007 2008 2009 2010 2011 2012
Rice crackers Snack foods Dairy products and beverages Others
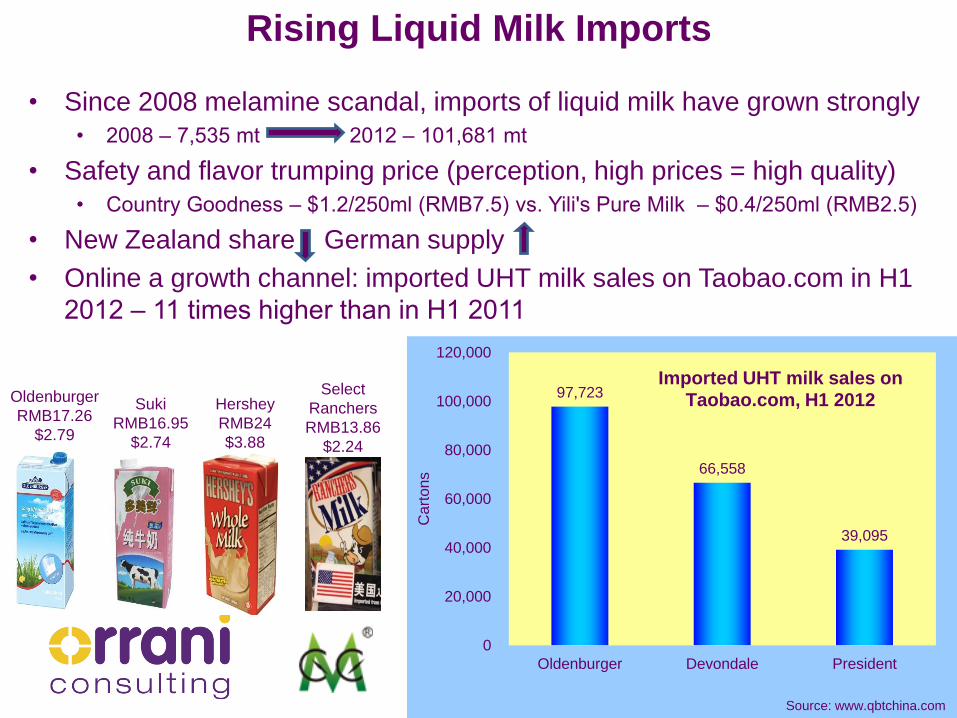
Rising Liquid Milk Imports
• Since 2008 melamine scandal, imports of liquid milk have grown strongly
• 2008 ‒ 7,535 mt 2012 ‒ 101,681 mt
• Safety and flavor trumping price (perception, high prices = high quality)
• Country Goodness ‒ $1.2/250ml (RMB7.5) vs. Yili's Pure Milk ‒ $0.4/250ml (RMB2.5)
• New Zealand share German supply
• Online a growth channel: imported UHT milk sales on Taobao.com in H1
2012 ‒ 11 times higher than in H1 2011
Oldenburger
RMB17.26
$2.79
Suki
RMB16.95
$2.74
Hershey
RMB24
$3.88
Select
Ranchers
RMB13.86
$2.24
97,723
66,558
39,095
0
20,000
40,000
60,000
80,000
100,000
120,000
Oldenburger Devondale President
Cart
ons
Imported UHT milk sales on Taobao.com, H1 2012
Source: www.qbtchina.com

• Annual per capita consumption:
global 2.8kg, China 0.2kg
• Imports over 90% of consumption
• Popular varieties:
Mozzarella
Cheddar
Parmesan
Cream Cheese
Brie
Gouda
• Major foodservice opportunity but
retail still a hard sell
80% 20%
Cheese Challenge Remains

Cheese Challenge Remains
• Positioning for snacking seems attractive
• Dairy’s image as natural / healthy fits into current marketing propositions for snacks
• Yoghurt, ice-cream and milk ‒ popular dairy snacks (children, young white collar workers)
• Efforts by several brands to target the snacking cheese sector, but more
consumer education is critical
• Note ‒ our recent Cheese Technology Landscape report shows China
rising fast as a cheese innovator over last 2 decades, 2nd only to USA in
2011 based on patent applications

Opportunities Comparison –
China, India

Opportunities Comparison – China, India
• Interesting to compare with India (2012: 116 million mt milk)
– Near self sufficiency (only ~13% processed vs. 90-95% in China)
– High import tariffs
– High ‘protein gap’ (~ 1/3 population vegetarian, dairy protein a key
source to fill)
– Rising demand for “Next Generation Food Solutions” (people emerging from poverty, higher income groups)
– Good potential for protein-based solutions for adults, growing children
– Infant foods market constrained by restrictive regulatory environment
– Low cheese production: whey, lactose deficit
– Robust pharma industry: increasing demand for excipients
– Dairy brand Amul rated Most Trusted F&B brand!!
• China’s very high potential shouldn’t obscure other opportunities

UK
Richard Field
+44-7850-594851
USA
Christine Van Asten
+1 (608) 712 9175
www.orrani.com