China Carbon Market Monitor - Home | Partnership for ... China Market... · 3 Table 1. Shenzhen...
8
1 Disclaimer This work is a product of Sino Carbon, under supervision from World Bank Group staff. The findings, interpretations, and conclusions expressed in this work do not necessarily reflect the views of The World Bank Group, its Board of Executive Directors, or the governments they represent. The World Bank Group does not guarantee the accuracy of the data included in this work. The boundaries, colors, denominations, and other information shown on any map in this work do not imply any judgment on the part of The World Bank Group concerning the legal status of any territory or the endorsement or acceptance of such boundaries. Please direct any comments and questions about this work to the PMR Secretariat ([email protected]). Q1 2017/ No. 8 The PMR China Carbon Market Monitor provides timely information across the Chinese pilot carbon markets. It also provides analysis of climate policy and market developments at the national level. Highlights • In Q1 2017, the secondary carbon market for China’s ETS pilots and the Fujian market accumulated a trading volume of 9.7 million tons, representing a trading value of US$22.1 million, and an average price of US$2.27/ton. Compared with Q4 2016, only Shenzhen, Guangdong and Chongqing experienced an increase in trading. • Fujian launched an ETS in late Q4 2016, bringing the number of local markets in China to eight. Trading began in earnest in January.The decision to launch a local market allows Fujian officials and regulated entities an opportunity to gain experience with emissions trading ahead of the launch of the national system. • On March 14, NDRC temporarily suspended CCER project registration and credit issuance in order to revise the Interim Measures for the Administration of Voluntary Emission Trading of GHG. The suspension meant that no CCER registrations or credits were issued in Q1 2017. Contents Pilot Carbon Markets ..........................2 Shenzhen ................................................ 2 Shanghai ................................................. 3 Beijing...................................................... 3 Guangdong.............................................. 4 Tianjin ...................................................... 4 Hubei ....................................................... 5 Chongqing ............................................... 5 Fujian ....................................................... 6 CCER Market ............................................... 7 Policy Updates and Analysis .............8 China Carbon Market Monitor
Transcript of China Carbon Market Monitor - Home | Partnership for ... China Market... · 3 Table 1. Shenzhen...

1
DisclaimerThis work is a product of Sino Carbon, under supervision from World Bank Group staff. The findings, interpretations, and conclusions expressed in this work do not necessarily reflect the views of The World Bank Group, its Board of Executive Directors, or the governments they represent.The World Bank Group does not guarantee the accuracy of the data included in this work. The boundaries, colors, denominations, and other information shown on any map in this work do not imply any judgment on the part of The World Bank Group concerning the legal status of any territory or the endorsement or acceptance of such boundaries. Please direct any comments and questions about this work to the PMR Secretariat ([email protected]).
Q1 2017/ No. 8
The PMR China Carbon Market Monitor provides timely information across the Chinese pilot carbon markets. It also provides analysis of climate policy and market developments at the national level.
Highlights• In Q1 2017, the secondary carbon market for China’s ETS
pilots and the Fujian market accumulated a trading volume of 9.7 million tons, representing a trading value of US$22.1 million, and an average price of US$2.27/ton. Compared with Q4 2016, only Shenzhen, Guangdong and Chongqing experienced an increase in trading.
• Fujian launched an ETS in late Q4 2016, bringing the number of local markets in China to eight. Trading began in earnest in January.The decision to launch a local market allows Fujian officials and regulated entities an opportunity to gain experience with emissions trading ahead of the launch of the national system.
• On March 14, NDRC temporarily suspended CCER project registration and credit issuance in order to revise the Interim Measures for the Administration of Voluntary Emission Trading of GHG. The suspension meant that no CCER registrations or credits were issued in Q1 2017.
Contents
Pilot Carbon Markets ..........................2
Shenzhen ................................................2
Shanghai .................................................3
Beijing ......................................................3
Guangdong ..............................................4
Tianjin ......................................................4
Hubei .......................................................5
Chongqing ...............................................5
Fujian .......................................................6
CCER Market ............................................... 7
Policy Updates and Analysis .............8
ChinaCarbon MarketMonitor

2
Pilot Carbon MarketsSince trading in China began on June 18, 2013, 128 million tons of emissions allowances have been traded on the secondary market across eight carbon markets. This accounts for a total value of US$403 million, with an average price of US$3.15/ton. Online trading and over-the-counter (OTC) transactions constitute 53% and 47% of the total volume, respectively. Of the total trade value to date, 62% has come from online trading while 38% has been OTC.
The Fujian carbon market began operating in late December 2016. The launch gives Fujian officials an opportunity to gain experience with emissions trading prior to the anticipated launch of the national system. The market’s performance was promising in its first full quarter of trading, outperforming both the Chongqing and Tianjin markets.
Below is a summary of the activity in each of the eight markets between January and March 2017. With the exception of the Guangdong and Hubei markets, the data reported are for the secondary market, including online and OTC trading.1
1 In China’s pilot markets, all transactions—including OTC—must take place on trading platforms (i.e., exchanges). Therefore, the term
“OTC” in this report refers to transactions that are brought to the exchanges for registration and clearing once the two parties making
the deal have agreed on the price and volume of the trade.
Figure 1. Cumulative Trading Volume in the 8 Markets(Million tons, June 18, 2013 - March 31, 2017)
Figure 4. Shenzhen Carbon Markets: Online Trading(Q1 2017)
Figure 2. Cumulative Trading Value in the 8 Pilots(Million US$, June 18, 2013 - March 31, 2017)
Figure 3. Daily Average Price of Online Trading (US$/ton)(June 18, 2013 -March 31, 2017)
Shenzhen
Highlights • Shenzhen traded 169,386 tons of Shenzhen Emissions
Allowances (SZA) for a total value of US$701,163, representing 1.75% and 3.18% of total volume and value, respectively, among all pilots this quarter. The majority (92.5%) of the SZA traded were the 2016 vintage.
• Onl ine t rading of SZA reached 9,386 tons and US$40,462. Prices fluctuated from US$3.51/ton to US$6.68/ton.
• 160,000 tons were traded OTC at a total value of US$660,702. The average OTC trading price was US$4.13/ton.

3
Table 1. Shenzhen Secondary Carbon Market Data(Q1 2017)
Table 2. Shanghai Secondary Carbon Market Data(Q1 2017)
Table 3. Shanghai: Allowance Derivative Market(Q1 2017)
Figure 5. Shanghai Carbon Market: Online Trading(Q1 2017)
Figure 6. Shanghai Carbon Markets: Forward(Q1 2017)
Shanghai
Highlights • 3,051,866 tons of Shanghai Emissions Allowances
(SHEA) were traded for a total value of US$4,334,926. Of this, 720,905 tons were traded online at a value of US$3,695,279. 2,330,961 tons were traded OTC at a value of US$639,648.2
• Building on the trend in Q4 2016, the online trading price continued to increase, rising from US$4.17/ton to over US$5.60/ton.
• 16,620 forward agreements were s igned for the f ive forward products on market (SHEAF022017, SHEAF052017, SHEAF082017, SHEAF112017, and SHEAF022018), representing 1,662,000 tons of underlying allowances. The delivery date for SHEAF022017 forward contracts was end-February, though the closing price for these contracts has not been made public.
2 Shanghai failed to report the value of 230,961 tons of OTC trades between February 13 and February 17. These trades are
estimated to be worth about US$12 million.

4
Table 4. Beijing: Secondary Carbon Market Data(Q1 2017)
Figure 7. Beijing Carbon Market: Online Trading(Q1 2017)
Highlights • 928,480 tons (US$3,737,416) of Beijing Emissions
Allowances (BEA) were traded in Q1. Online trading totaled 209,117 tons (US$1,546,982). The average price was US$7.40/ton, the highest among all markets this quarter. 719,363 tons (US$2,190,434) of BEA were traded OTC; the average OTC trading price of US$3.04/ton.
Table 5. Guangdong Secondary Carbon Market Data(Q1 2017)
Table 6. Guangdong Auction Data(Q1 2017)
Figure 8. Guangdong Carbon Market: Online Trading(Q1 2017)
Guangdong
Highlights • The Guangdong market had the highest volume (4,619,265
tons) and value (US$9,846,923) of trading among all markets in Q1. The majority (2,732,053 tons) took place OTC at a value of US$5,320,972, while 1,887,212 tons were traded online for a total value of US$4,525,952.
• Two auctions were held for 2016 allowances in which 1 million tons were auctioned, generating US$2.29 million.
• On Jan 6, 2017, Guangdong DRC expanded its ETS regulation to include civil aviation, paper making and white cement production.
Beijing

5
Figure 9. Tianjin Carbon Market: Online Trading(Q1 2017)
Table 8. Hubei Secondary Carbon Market Data(Q1 2017)
Table 9. Hubei Allowance Derivative Market Data(Q1 2017)
Table7. Tianjin Secondary Carbon Market Data( Q1 2017)
Highlights • Only one day of trading took place in Tianjin in Q1: on
March 21 76,000 tons were traded for US$149,576.
• The weak trading is likely due to the slow roll out of the Tianjin 2016 carbon market working scheme, which was not made public until mid-April. In response, most covered entities took a wait-and-see attitude, which resulted in minimal trading prior to the release of the working scheme.
Chongqing
Highlights • 10,433 tons (US$24,959) Chongqing Emiss ions
Allowances (CQEA) traded in Q1, all online.
• The price for CQEA dropped dramatically from about
Hubei
Tianjin Highlights • Online trading of Hubei Emissions Allowances (HBEA)
totaled 455,378 tons (US$1,153,874). The average price was US$2.53/ton. There were zero OTC transactions.
• In the derivative market, trading of HBEA1705 reached 2,625,800 tons (US$8,171,083).
Figure 10. Hubei Carbon Market: Online Trading(Q1 2017)

6
Figure 11. Chongqing Carbon Market: Online Trading( Q1 2017)
Table 10. Chongqing Secondary Carbon Market Data (Q1 2017)
US$2.50/ton to less than a dollar following a significant uptick in volumes traded on March 21.
• 100.37 million tons of 2016 allowances were distributed on January 18 to those regulated entities that submitted applications for them.
Fujian
Highlights • In its first full quarter of operation, steady activity led
to 384,265 tons (US$2,097,066) of Fujian Emissions Allowances (FJEA) being traded, all online.
• The price averaged US$5.5/ton.
Figure 12. Fujian Carbon Market: Online Trading(Q1 2017)
Table 11. Fujian Secondary Carbon Market Data (Q1 2017)

7
Figure 13. CCER Projects by Type (% of issued projects)
Figure 14. CCER Projects by Type (% of credits issued)
Figure 15. Distribution of CCER Trading Among Exchanges (M tCO2e)
Figure 16. On-line CCER Price of Q1 2017 (US$/ton)
3According to regulation on the management and operation of CCER projects issued by the NDRC, there are four categories of CCER projects. Category 1 refers to newly developed CCER projects. Category 2 refers to those projects which get a Letter of Approval from the Designated National Authority but are not yet registered at the CDM Executive Board. Category 3 refers to those registered CDM projects applying for issuance of emissions reductions generated before the date of registration, known as Pre-CDM projects. Category 4 refers to those registered CDM projects for which the CDM Executive Board never issued any emissions reductions.4On March 14, 2017, the NDRC suspended CCER project registration and credit issuance in order to revise its Interim Measures for the Administration of Voluntary Emis-sion Trading of GHG. Existing registered and issued projects will not be impacted by the revision.
CCER MarketAs of March 31, 2017, 2,871 Certified Emission Reduction (CCER) projects have been publicized for comment and 1,047 have been registered (287 of which have been issued) Among those issued, the certification reports for 254 (representing 52.94 million tons of CCERs) are publically available. Among issued projects, 139 are Type I3 (18.9 million tons of CCERs issued), 17 are Type II (3.72 million tCO2e), and 98 are Type III (30.31 million tCO2e). In addition, wind, small-scale hydro, solar PV and household biogas projects are most popular, due in part to the offset rules for CCERs in the pilot carbon markets.
88.58 million tons of CCERs have been traded through the exchanges (Figure 15). Forty-six percent of trading has taken place on the Shanghai market (40.83 million tons), which resumed CCER transactions on February 8 after a six-month suspension. CCERs are traded in the new Fujian market, though details are not yet available.Only the Shanghai, Beijing and Sichuan exchanges disclose CCER prices. Q1 prices for CCERs trading on the Shanghai market ranged from US$1.86/ton to US$4.18/ton. Prices were comparable on the Beijing market, ranging from US$1.44/ton to US$4.07/ton, while prices in Sichuan were much lower: between US$0.29/ton and US$1.45/ton.Overall, CCER prices declined over the course of Q1 beginning in February. NDRC has announced that it will stop CCER registration, providing little expectation that CCERs will continue to be part of the national ETS4 (Figure 16).
Wind Hydro Solar PVHousehold
biogasTotal
Total projects
90 32 48 41 254
Millions of tCO2e
12.46 13.42 2.74 6.29 52.94
* Hubei ,Chongqing and Fujian markets do not announce CCER trading information.
** There was no on-line CCER trading between January 1 and Febru-ary 7, in part due to Chinese New Year.
8
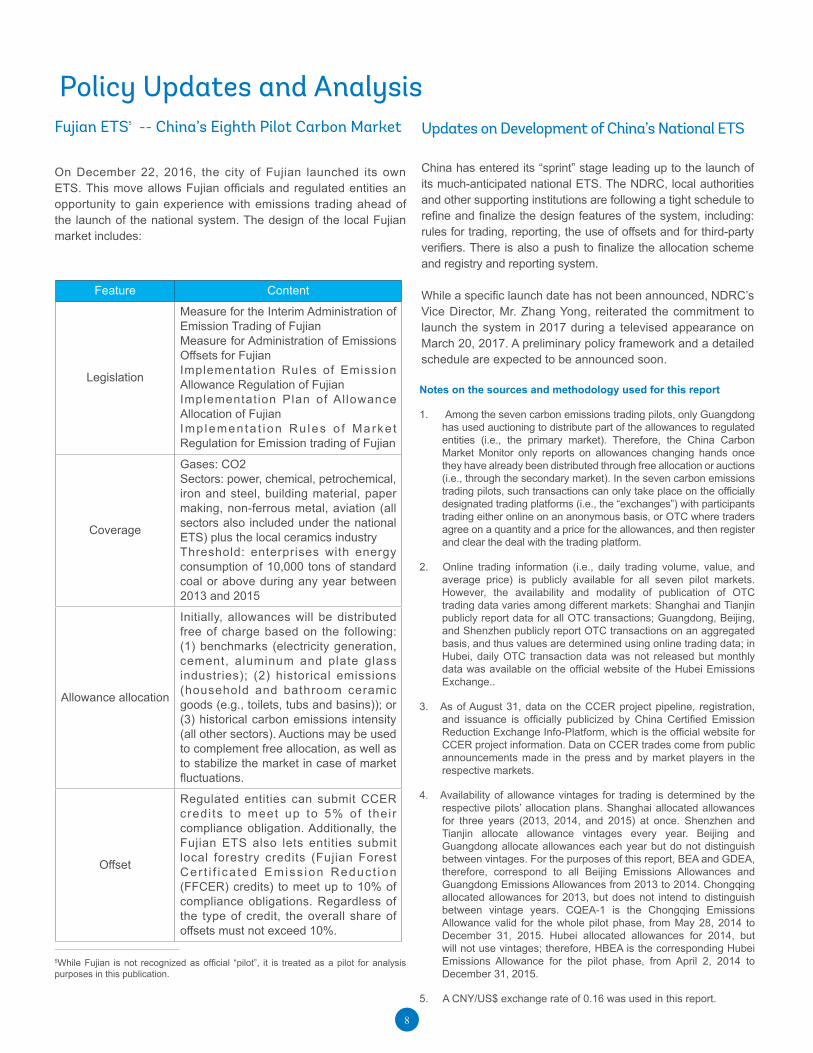
Fujian ETS5 -- China’s Eighth Pilot Carbon Market
On December 22, 2016, the city of Fujian launched its own ETS. This move allows Fujian officials and regulated entities an opportunity to gain experience with emissions trading ahead of the launch of the national system. The design of the local Fujian market includes:
Updates on Development of China’s National ETS
China has entered its “sprint” stage leading up to the launch of its much-anticipated national ETS. The NDRC, local authorities and other supporting institutions are following a tight schedule to refine and finalize the design features of the system, including: rules for trading, reporting, the use of offsets and for third-party verifiers. There is also a push to finalize the allocation scheme and registry and reporting system.
While a specific launch date has not been announced, NDRC’s Vice Director, Mr. Zhang Yong, reiterated the commitment to launch the system in 2017 during a televised appearance on March 20, 2017. A preliminary policy framework and a detailed schedule are expected to be announced soon.
Notes on the sources and methodology used for this report
1. Among the seven carbon emissions trading pilots, only Guangdong has used auctioning to distribute part of the allowances to regulated entities (i.e., the primary market). Therefore, the China Carbon Market Monitor only reports on allowances changing hands once they have already been distributed through free allocation or auctions (i.e., through the secondary market). In the seven carbon emissions trading pilots, such transactions can only take place on the officially designated trading platforms (i.e., the “exchanges”) with participants trading either online on an anonymous basis, or OTC where traders agree on a quantity and a price for the allowances, and then register and clear the deal with the trading platform.
2. Online trading information (i.e., daily trading volume, value, and average price) is publicly available for all seven pilot markets. However, the availability and modality of publication of OTC trading data varies among different markets: Shanghai and Tianjin publicly report data for all OTC transactions; Guangdong, Beijing, and Shenzhen publicly report OTC transactions on an aggregated basis, and thus values are determined using online trading data; in Hubei, daily OTC transaction data was not released but monthly data was available on the official website of the Hubei Emissions Exchange..
3. As of August 31, data on the CCER project pipeline, registration, and issuance is officially publicized by China Certified Emission Reduction Exchange Info-Platform, which is the official website for CCER project information. Data on CCER trades come from public announcements made in the press and by market players in the respective markets.
4. Availability of allowance vintages for trading is determined by the respective pilots’ allocation plans. Shanghai allocated allowances for three years (2013, 2014, and 2015) at once. Shenzhen and Tianjin allocate allowance vintages every year. Beijing and Guangdong allocate allowances each year but do not distinguish between vintages. For the purposes of this report, BEA and GDEA, therefore, correspond to all Beijing Emissions Allowances and Guangdong Emissions Allowances from 2013 to 2014. Chongqing allocated allowances for 2013, but does not intend to distinguish between vintage years. CQEA-1 is the Chongqing Emissions Allowance valid for the whole pilot phase, from May 28, 2014 to December 31, 2015. Hubei allocated allowances for 2014, but will not use vintages; therefore, HBEA is the corresponding Hubei Emissions Allowance for the pilot phase, from April 2, 2014 to December 31, 2015.
5. A CNY/US$ exchange rate of 0.16 was used in this report.
Feature Content
Legislation
Measure for the Interim Administration of Emission Trading of FujianMeasure for Administration of Emissions Offsets for Fujian Implementation Rules of Emission Allowance Regulation of Fujian Implementation Plan of Al lowance Allocation of FujianImp lementa t ion Ru les o f Marke t Regulation for Emission trading of Fujian
Coverage
Gases: CO2Sectors: power, chemical, petrochemical, iron and steel, building material, paper making, non-ferrous metal, aviation (all sectors also included under the national ETS) plus the local ceramics industryThreshold: enterprises with energy consumption of 10,000 tons of standard coal or above during any year between 2013 and 2015
Allowance allocation
Initially, allowances will be distributed free of charge based on the following: (1) benchmarks (electricity generation, cement, aluminum and plate glass industries); (2) historical emissions (household and bathroom ceramic goods (e.g., toilets, tubs and basins)); or (3) historical carbon emissions intensity (all other sectors). Auctions may be used to complement free allocation, as well as to stabilize the market in case of market fluctuations.
Offset
Regulated entities can submit CCER credi ts to meet up to 5% of their compliance obligation. Additionally, the Fujian ETS also lets entities submit local forestry credits (Fujian Forest Cer t i f i ca ted Emiss ion Reduc t ion (FFCER) credits) to meet up to 10% of compliance obligations. Regardless of the type of credit, the overall share of offsets must not exceed 10%.
Policy Updates and Analysis
5While Fujian is not recognized as official “pilot”, it is treated as a pilot for analysis purposes in this publication.