Chilean banking review Nov -17 Banks - investorideas.com · Equity Research - Chile Industry Alert...
15
Equity Research - Chile Industry Alert January 10 th , 2018 Chilean banking review Nov -17 Strong month for the industry; Itau Corpbanca reported a new monthly net loss Banks We believe that results for the banking industry in Nov - 17 were positive as banks posted a strong recovery in the top line compared to prior month. Net income in Nov - 17 for the industry reached CLP 207.1 bn, equivalent to an increase of 42.1% m/m and 172.6% y/y, respectively. Given the result on net earnings, profitability, measured in terms of quarterly ROAE, reached 12.2% compared to 11.5% and 9.0% reported in Oct - 16 and Nov - 16. Loan growth stayed relatively flat, advancing 4.9% y/y; this sluggish performance continued to be mainly driven by a 1.8% y/y growth on the commercial segment. Despite moderate growth, positive performance across the industry was mainly driven by a 14.3% y/y increase in the top line. Higher spreads on loans led to a quarterly NIM of 3.8% relative to 3.7% in Nov - 16. Provision expenses declined 28.1% y/y, while cost of credit reached 1.1% relatively in line with Oct - 17. On the other hand, banks maintained efficient cost control policies as OPEX advanced just 3.6% y/y. We maintain a positive view across the Chilean banks for 2018 primarily explained by i) better macro outlook, ii) higher loan growth relative to 2017, and iii) asset quality under control. Banco de Chile (HOLD; T.P.: CLP 103/share). Solid month for the bank. Net earnings reached CLP 58.8 bn, compared to CLP 34.4 bn reported last month. This performance was driven by an increase of 9.2% m/m and 14.3% y/y on the bank’s operating income. Furthermore, net provision expenses declined 19.3% m/m and 64.3% y/y as the bank continues to focus on existing clients, while being conservative on the corporate segment. Our HOLD is unchanged. Banco Santander Chile (BUY; T.P.: CLP 52.7/share). Positive month for Santander Chile. Revenues climbed 7.8% m/m and 9.9% y/y, respectively. Net provision expenses declined 8.6% y/y; however, we acknowledge that provisions of CLP 29.2 bn were the highest on a YTD basis. On the other hand, Santander continues to deliver on OPEX as this account advanced a mere 3.9% y/y compared to 7.9% y/y of Banco de Chile. Given this operating performance, net profits reached CLP 47.9 bn, equivalent to a 39.8% m/m and 42.1% y/y increase. Our BUY is unchanged. BCI (HOLD; T.P.: CLP 45,500/share). Good month for BCI but below Santander and Banco de Chile. Net profits grew 25.6% m/m but a mere 2.6% y/y. We highlight a 30.6% m/m decline on net provision expenses to CLP 13.8 nm. The latter was the lowest level since Jun - 17. Going forward, we will continue to monitor the evolution of the recent M&A activity as BCI should be focused on the consolidation of the new acquired assets. Grupo Security (HOLD; T.P.: CLP 280/share). Great month for Banco Security. The bank reported net earnings of CLP 6.2 bn, equivalent to a 42.7% m/m and 65.1% y/y increase. In Nov - 17, Security was able to deliver solid results on the top line and provision expenses. Itau Corpbanca (HOLD; T.P.: CLP 6.6/share). A new disappointing month. In fact, the bank reported a net loss of CLP 390 mn. We suspect that the bank added provisions on the Alto Maipo case; in fact, this account reached CLP 50.7 bn, vs an average of CLP 22.9 bn on a YTD basis. CREDICORP CAPITAL RESEARCH Sebastian Gallego +(571) 3394400 ext 1594 [email protected] Carolina Ratto +(562) 24461768 ext 768 [email protected] IMPORTANT NOTICE (US FINRA RULE 2242) This document is intended for INSTITUTIONAL INVESTORS and is not subject to all of the independence and disclosure standards applicable to debt research reports prepared for retail investors. Credicorp Capital may do or seek to do business with companies covered in its research reports. As a result, investors should be aware that the firm may have a conflict of interest that could affect the objectivity of this report. Investors should consider this report as only a single factor in making their investment decision. Refer to important disclosures on page 9 to 13, Analyst Certification on Page 9. Additional disclosures on page 13. chile ci Low er prov isions bsan ci Strong top line bci ci Better asset quality figures secur ci Best month in earnings itaucorp ci Net losses again Industry View on Nov - 17 results LTM YTD chile ci 34.0% 4.3% bsan ci 36.4% 3.8% bci ci 30.2% 1.9% secur ci 30.0% 2.1% itaucorp ci 3.6% 3.2% IPSA 37.2% 2.6% Perfomance (local currency)
Transcript of Chilean banking review Nov -17 Banks - investorideas.com · Equity Research - Chile Industry Alert...

Equity Research - Chile
Industry AlertJanuary 10
th, 2018
Chilean banking review Nov -17Strong month for the industry; Itau Corpbanca
reported a new monthly net loss
Banks
We believe that results for the banking industry in Nov - 17 were positive
as banks posted a strong recovery in the top line compared to prior
month. Net income in Nov - 17 for the industry reached CLP 207.1 bn,
equivalent to an increase of 42.1% m/m and 172.6% y/y, respectively.
Given the result on net earnings, profitability, measured in terms of
quarterly ROAE, reached 12.2% compared to 11.5% and 9.0% reported in
Oct - 16 and Nov - 16. Loan growth stayed relatively flat, advancing 4.9%
y/y; this sluggish performance continued to be mainly driven by a 1.8%
y/y growth on the commercial segment. Despite moderate growth,
positive performance across the industry was mainly driven by a 14.3%
y/y increase in the top line. Higher spreads on loans led to a quarterly NIM
of 3.8% relative to 3.7% in Nov - 16. Provision expenses declined 28.1%
y/y, while cost of credit reached 1.1% relatively in line with Oct - 17. On
the other hand, banks maintained efficient cost control policies as OPEX
advanced just 3.6% y/y. We maintain a positive view across the Chilean
banks for 2018 primarily explained by i) better macro outlook, ii) higher
loan growth relative to 2017, and iii) asset quality under control.
Banco de Chile (HOLD; T.P.: CLP 103/share). Solid month for the bank. Net
earnings reached CLP 58.8 bn, compared to CLP 34.4 bn reported last month.
This performance was driven by an increase of 9.2% m/m and 14.3% y/y on the
bank’s operating income. Furthermore, net provision expenses declined 19.3%
m/m and 64.3% y/y as the bank continues to focus on existing clients, while
being conservative on the corporate segment. Our HOLD is unchanged.
Banco Santander Chile (BUY; T.P.: CLP 52.7/share). Positive month for
Santander Chile. Revenues climbed 7.8% m/m and 9.9% y/y, respectively. Net
provision expenses declined 8.6% y/y; however, we acknowledge that
provisions of CLP 29.2 bn were the highest on a YTD basis. On the other hand,
Santander continues to deliver on OPEX as this account advanced a mere
3.9% y/y compared to 7.9% y/y of Banco de Chile. Given this operating
performance, net profits reached CLP 47.9 bn, equivalent to a 39.8% m/m and
42.1% y/y increase. Our BUY is unchanged.
BCI (HOLD; T.P.: CLP 45,500/share). Good month for BCI but below
Santander and Banco de Chile. Net profits grew 25.6% m/m but a mere 2.6%
y/y. We highlight a 30.6% m/m decline on net provision expenses to CLP 13.8
nm. The latter was the lowest level since Jun - 17. Going forward, we will
continue to monitor the evolution of the recent M&A activity as BCI should be
focused on the consolidation of the new acquired assets.
Grupo Security (HOLD; T.P.: CLP 280/share). Great month for Banco
Security. The bank reported net earnings of CLP 6.2 bn, equivalent to a 42.7%
m/m and 65.1% y/y increase. In Nov - 17, Security was able to deliver solid
results on the top line and provision expenses.
Itau Corpbanca (HOLD; T.P.: CLP 6.6/share). A new disappointing month. In
fact, the bank reported a net loss of CLP 390 mn. We suspect that the bank
added provisions on the Alto Maipo case; in fact, this account reached CLP
50.7 bn, vs an average of CLP 22.9 bn on a YTD basis.
CREDICORP CAPITAL RESEARCH
Sebastian Gallego
+(571) 3394400 ext 1594
Carolina Ratto
+(562) 24461768 ext 768
IMPORTANT NOTICE (US FINRA RULE 2242) This document is intended for
INSTITUTIONAL INVESTORS and is not subject to all of the independence and
disclosure standards applicable to debt research reports prepared for retail
investors. Credicorp Capital may do or seek to do business with companies
covered in its research reports. As a result, investors should be aware that the firm
may have a conflict of interest that could affect the objectivity of this report.
Investors should consider this report as only a single factor in making their
investment decision. Refer to important disclosures on page 9 to 13, Analyst
Certification on Page 9. Additional disclosures on page 13.
chile ci Low er prov isions
bsan ci Strong top line
bci ci Better asset quality figures
secur ci Best month in earnings
itaucorp ci Net losses again
Industry
View on Nov - 17 results
LTM YTD
chile ci 34.0% 4.3%
bsan ci 36.4% 3.8%
bci ci 30.2% 1.9%
secur ci 30.0% 2.1%
itaucorp ci 3.6% 3.2%
IPSA 37.2% 2.6%
Perfomance (local currency)

Source: SBIF, Bloomberg, Credicorp Capital
Performance IPSA & Chilean Banks (under coverage)
80
90
100
110
120
130
140
150
Jan-17 Mar-17 May-17 Jul-17 Sep-17 Nov-17 Jan-18
Banco de Chile Santander Chile BCI
Security ItauCorpbanca IPSA
Nov - 17 bank results relative to our 4Q17 estimates
Data Model 4Q17 Data Model 4Q17 Data Model 4Q17 Surprise
-45.1% -44.7% -0.92% -1.02% 139,821 154,970 -9.8%
-41.0% -41.4% -1.16% -1.12% 123,249 150,270 -18.0%
-52.6% -52.7% -0.87% -0.9% 78,411 85,165 -7.9%
-60.8% -60.4% -1.76% -1.25% 25,623 35,201 -27.2%
-46.0% -48.9% -1.08% -0.81% 15,941 18,024 -11.6%
-50.9% -1.13% 529,229
Data Model 4Q17 Data Model 4Q17 Data Model 4Q17 Difference
0.4% 4.4% 4.5% 4.4% 18.3% 20.4% -2.0%
2.8% 3.7% 4.6% 4.4% 16.5% 19.8% -3.2%
7.9% 10.5% 3.3% 3.2% 11.6% 12.4% -0.9%
-0.2% 3.6% 3.7% 3.2% 3.2% 4.3% -1.1%
7.7% 9.7% 3.0% 2.9% 12.9% 13.8% -0.9%
4.9% 3.8% 11.8%
Net income*
Bank
Cost of creditCost to income
Industry
Banco de Chile
Santander Chile
BCI
Itau Corpbanca
Banco Security
ROAE*
Banco Security
Industry
Bank
Banco de Chile
Santander Chile
BCI
Itau Corpbanca
Loan growth NIM
*Level if monthly figure is maintained; other indicators compare last three month data vs our valuation model estimate
*Colors according to the following table
-100% <50%
-50% -50% - 0%
50% 0% - 50%
100% >50%
2

Market share by loans (total gross loans in Chile)
November 2016 November 2017
Source: SBIF, Credicorp Capital
3
Monthly Result by banking institution
CLP bn Nov-16 Oct-17 Nov-17 Nov-16 Oct-17 Nov-17 Nov-16 Oct-17 Nov-17
Income Statement
NII 549.8 520.5 612.7 104.2 105.5 120.9 100.4 93.2 114.2
Net fee income 133.2 143.1 146.4 20.9 22.5 21.0 24.9 28.2 27.8
Operating revenue 706.5 739.3 807.4 132.9 135.5 146.1 135.6 126.0 149.3
Provision expenses -234.4 -139.8 -168.5 -32.0 -26.2 -29.2 -51.5 -22.8 -18.4
Operating expenses -393.8 -388.1 -407.9 -58.8 -60.5 -61.1 -59.9 -59.8 -64.6
Net income 76.0 145.7 207.1 33.7 34.3 47.9 24.5 34.4 58.8
YoY % -53.2% -2.4% 172.6% 7.4% -15.1% 42.1% -53.2% -17.6% 140.6%
MoM % -49.1% -25.5% 42.1% -16.5% -28.0% 39.8% -41.4% -31.8% 71.1%
Accum. net income 1,795.2 1,867.8 2,074.9 437.8 464.4 512.3 494.4 468.0 526.9
YoY % -11.2% 8.6% 15.6% 1.6% 14.9% 17.0% -6.4% -0.4% 6.6%
Ratios (L3M annualized except for capital ratio)
Profitability & efficiency
NIM 3.7% 3.6% 3.8% 4.3% 4.4% 4.6% 4.3% 4.2% 4.5%
Cost-to-income ratio -55.4% -52.0% -50.9% -43.5% -41.6% -41.0% -46.5% -46.1% -45.1%
ROAA 0.8% 1.0% 1.0% 1.3% 1.6% 1.6% 1.4% 1.7% 1.8%
ROAE 9.0% 11.5% 12.2% 15.8% 17.3% 17.4% 15.3% 18.1% 18.8%
Asset Quality
Cost of credit -1.3% -1.0% -1.1% -1.3% -1.1% -1.2% -1.5% -0.9% -0.9%
NPL ratio 1.9% 1.9% 1.9% 2.1% 2.2% 2.2% 1.2% 1.2% 1.2%
NPL coverage 160% 156% 158% 146% 136% 135% 269% 251% 251%
Capital ratio
BIS ratio 13.7% 13.8% n.a. 13.3% 13.8% n.a. 13.8% 14.4% n.a.
Balance Sheet (exc. International operations)
Gross loans 140,443 145,471 147,289 26,913 27,312 27,667 25,279 25,426 25,385
YoY % 5.9% 4.7% 4.9% 6.8% 2.4% 2.8% 3.7% 2.2% 0.4%
Source: SBIF, Credicorp Capital
Industry Santander Chile Banco de Chile
Santander Chile19.2%
Banco de Chile18.0%
BCI13.1%
Itau Corpbanca
11.5%
BBVA6.6%
Security3.2%
Banco de Estado14.8%
Others13.7%
Santander Chile18.8%
Banco de Chile17.2%
BCI13.5%
Itau Corpbanca
10.9%
BBVA6.7%
Security3.3%
Banco de Estado15.3%
Others14.3%

Funding structure per bank (includes foreign subsidiaries)
Source: SBIF, Credicorp Capital
4
Monthly Result by banking institution
CLP bn Nov-16 Oct-17 Nov-17 Nov-16 Oct-17 Nov-17 Nov-16 Oct-17 Nov-17
Income Statement
NII 75.6 67.8 75.3 71.4 69.8 86.3 12.1 13.2 13.7
Net fee income 14.8 13.3 16.0 21.9 22.8 23.4 3.8 5.1 5.3
Operating revenue 50.9 93.5 98.6 100.8 109.8 113.8 18.8 19.5 22.1
Provision expenses -71.3 -14.9 -50.7 -13.7 -19.9 -13.8 -4.5 -6.2 -3.2
Operating expenses -60.0 -55.0 -57.5 -57.2 -59.1 -62.1 -12.9 -7.6 -10.9
Net income -47.7 17.5 -0.4 28.4 23.2 29.1 3.8 4.4 6.2
YoY % -320.4% -651.7% -99.2% 8.9% -12.4% 2.6% -614.1% 5.0% 65.1%
MoM % 1406.9% 1545.2% -102.2% 7.2% -18.5% 25.6% -9.3% -16.0% 42.7%
Accum. net income 3.0 102.5 102.1 309.0 337.9 367.0 47.8 49.2 55.4
YoY % -99.0% 102.0% 3272.3% 3.0% 20.4% 18.8% 4.2% 11.7% 15.9%
Ratios (L3M annualized except for capital ratio)
Profitability & efficiency
NIM 3.2% 3.4% 3.7% 3.5% 3.2% 3.3% 2.8% 3.0% 3.0%
Cost-to-income ratio -84.5% -67.3% -60.8% -54.4% -52.7% -52.6% -64.2% -44.4% -46.0%
ROAA -0.7% 0.3% 0.2% 1.1% 1.0% 1.0% 0.8% 1.0% 1.0%
ROAE -6.2% 2.5% 2.3% 13.2% 11.8% 11.9% 10.8% 12.0% 12.8%
Asset Quality
Cost of credit -2.5% -1.4% -1.8% -1.0% -0.9% -0.9% -0.8% -1.2% -1.1%
NPL ratio 1.8% 2.1% 2.0% 1.5% 1.5% 1.4% 1.4% 1.3% 1.3%
NPL coverage 157% 141% 157% 134% 129% 134% 131% 130% 134%
Capital ratio
BIS ratio 14.0% 14.6% n.a. 13.4% 13.5% n.a. 13.2% 13.2% n.a.
Balance Sheet (exc. International operations)
Gross loans 16,148 15,811 16,117 18,448 19,703 19,909 4,446 4,746 4,789
YoY % -0.7% -1.7% -0.2% 8.1% 8.6% 7.9% 11.1% 10.1% 7.7%
Source: SBIF, Credicorp Capital
SecurityBCIItau Corpbanca
26% 32% 33%19%
12%23%
43%39% 41%
44% 52%
53%
7% 4%7%
11% 4%
5%
24% 25% 19%26% 32%
20%
0%
20%
40%
60%
80%
100%
Santander Chile Banco de Chile BCI Itau Corpbanca Security Banco de Estado
Demand deposits Time deposits Interbank loans Bonds
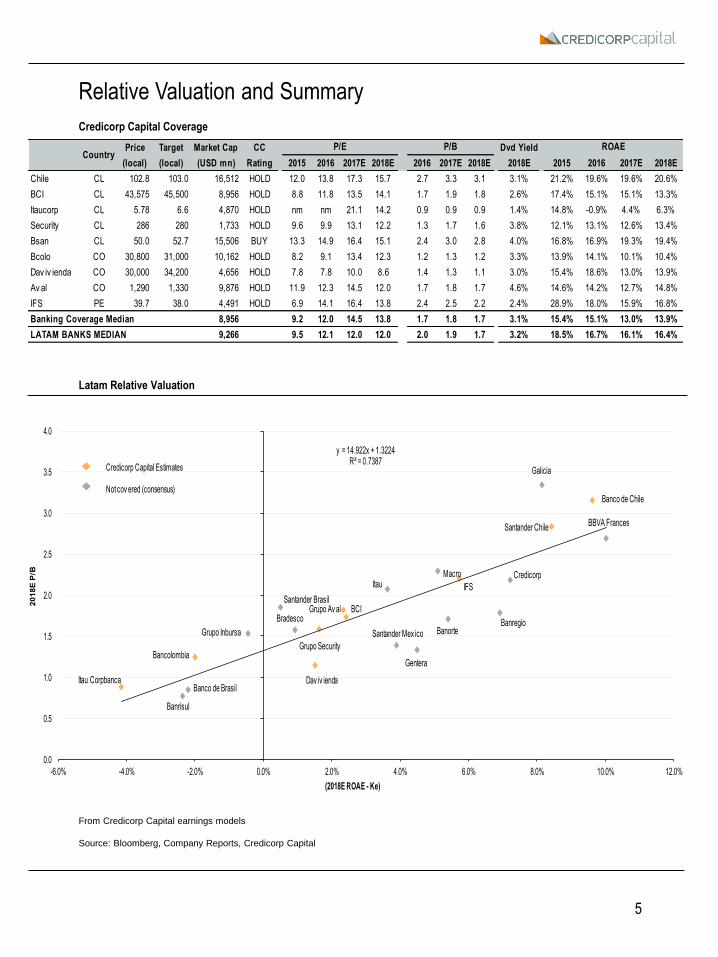
Relative Valuation and Summary
Credicorp Capital Coverage
Latam Relative Valuation
From Credicorp Capital earnings models
Source: Bloomberg, Company Reports, Credicorp Capital
5
Price Target Market Cap CC Dvd Yield
(local) (local) (USD mn) Rating 2015 2016 2017E 2018E 2016 2017E 2018E 2018E 2015 2016 2017E 2018E
Chile CL 102.8 103.0 16,512 HOLD 12.0 13.8 17.3 15.7 2.7 3.3 3.1 3.1% 21.2% 19.6% 19.6% 20.6%
BCI CL 43,575 45,500 8,956 HOLD 8.8 11.8 13.5 14.1 1.7 1.9 1.8 2.6% 17.4% 15.1% 15.1% 13.3%
Itaucorp CL 5.78 6.6 4,870 HOLD nm nm 21.1 14.2 0.9 0.9 0.9 1.4% 14.8% -0.9% 4.4% 6.3%
Security CL 286 280 1,733 HOLD 9.6 9.9 13.1 12.2 1.3 1.7 1.6 3.8% 12.1% 13.1% 12.6% 13.4%
Bsan CL 50.0 52.7 15,506 BUY 13.3 14.9 16.4 15.1 2.4 3.0 2.8 4.0% 16.8% 16.9% 19.3% 19.4%
Bcolo CO 30,800 31,000 10,162 HOLD 8.2 9.1 13.4 12.3 1.2 1.3 1.2 3.3% 13.9% 14.1% 10.1% 10.4%
Dav iv ienda CO 30,000 34,200 4,656 HOLD 7.8 7.8 10.0 8.6 1.4 1.3 1.1 3.0% 15.4% 18.6% 13.0% 13.9%
Av al CO 1,290 1,330 9,876 HOLD 11.9 12.3 14.5 12.0 1.7 1.8 1.7 4.6% 14.6% 14.2% 12.7% 14.8%
IFS PE 39.7 38.0 4,491 HOLD 6.9 14.1 16.4 13.8 2.4 2.5 2.2 2.4% 28.9% 18.0% 15.9% 16.8%
Banking Coverage Median 8,956 9.2 12.0 14.5 13.8 1.7 1.8 1.7 3.1% 15.4% 15.1% 13.0% 13.9%
LATAM BANKS MEDIAN 9,266 9.5 12.1 12.0 12.0 2.0 1.9 1.7 3.2% 18.5% 16.7% 16.1% 16.4%
CountryP/E P/B ROAE
Banco de Chile
BCI
Itau Corpbanca
Grupo Security
Santander Chile
Bancolombia
Dav iv ienda
Grupo Av al
IFS
Credicorp
Banco de Brasil
Bradesco
Itau
Santander Brasil
Banrisul
Banorte
Gentera
Santander Mex icoGrupo InbursaBanregio
Macro
Galicia
BBVA Frances
y = 14.922x + 1.3224R² = 0.7387
0.0
0.5
1.0
1.5
2.0
2.5
3.0
3.5
4.0
-6.0% -4.0% -2.0% 0.0% 2.0% 4.0% 6.0% 8.0% 10.0% 12.0%
20
18
E P
/B
(2018E ROAE - Ke)
Credicorp Capital Estimates
Not cov ered (consensus)

Inflation vs NIM Real GDP growth vs Industry loan growth
Source: SBIF
6
Loan mix
-1%
1%
3%
5%
7%
9%
11%
13%
15%
17%
-1%
1%
3%
5%
7%
9%
11%
Nov
-10
Nov
-11
Nov
-12
Nov
-13
Nov
-14
Nov
-15
Nov
-16
Nov
-17
Lo
an g
row
th
GD
P
Real GDP growth Industry loan growth
Commercial51.0%
Consumer16.4%
Mortgage32.6%
Commercial54.9%
Consumer15.7%
Mortgage29.3%
Commercial64.5%
Consumer11.8%
Mortgage23.7%
Commercial68.0%
Consumer12.2%
Mortgage19.9%
Commercial78.1%
Consumer9.0%
Mortgage12.9%
Santander ChileBanco de Chile
BCI SecurityItau Corpbanca
Commercial57.9%Consumer
13.6%
Mortgage28.5%
Industry
0.0%
1.0%
2.0%
3.0%
4.0%
5.0%
6.0%
3.0%
3.5%
4.0%
4.5%
5.0%
Nov
-11
Nov
-12
Nov
-13
Nov
-14
Nov
-15
Nov
-16
Nov
-17
Inflatio
nNIM
NIM Inflation

Loan growth y/y Deposit growth y/y
Demand deposit growth y/y LTD ratio
NPL coverage (>90 days)NPL ratio (>90 days)
Source: SBIF
7
-10%
0%
10%
20%
30%
40%
Nov-10 Nov-11 Nov-12 Nov-13 Nov-14 Nov-15 Nov-16 Nov-17
Santander Chile Banco de Chile BCI
Security Itau Corpbanca Industry
-20%
-10%
0%
10%
20%
30%
40%
Nov-10 Nov-11 Nov-12 Nov-13 Nov-14 Nov-15 Nov-16 Nov-17
Santander Chile Banco de Chile BCI
Security Itau Corpbanca Industry
-20%
-10%
0%
10%
20%
30%
40%
50%
Nov-10 Nov-11 Nov-12 Nov-13 Nov-14 Nov-15 Nov-16 Nov-17
Santander Chile Banco de Chile BCI
Security Itau Corpbanca Industry
100%
110%
120%
130%
140%
150%
Nov-10 Nov-11 Nov-12 Nov-13 Nov-14 Nov-15 Nov-16 Nov-17
Santander Chile Banco de Chile BCI
Security Itau Corpbanca Industry
0.0
0.5
1.0
1.5
2.0
2.5
3.0
3.5
4.0
Nov-10 Nov-11 Nov-12 Nov-13 Nov-14 Nov-15 Nov-16 Nov-17
Santander Chile Banco de Chile BCI
Security Itau Corpbanca Industry
0.0
0.5
1.0
1.5
2.0
2.5
3.0
3.5
4.0
Nov-10 Nov-11 Nov-12 Nov-13 Nov-14 Nov-15 Nov-16 Nov-17
Santander Chile Banco de Chile BCI
Security Itau Corpbanca Industry

Quarterly NIM Quarterly cost of credit
Cost-to-income Quarterly ROAA
BIS ratioQuarterly ROAE
Source: SBIF
8
0.0%
0.5%
1.0%
1.5%
2.0%
2.5%
3.0%
3.5%
4.0%
Nov-10 Nov-11 Nov-12 Nov-13 Nov-14 Nov-15 Nov-16 Nov-17
Santander Chile Banco de Chile BCI
Security Itau Corpbanca Industry
0.00%
1.00%
2.00%
3.00%
4.00%
5.00%
6.00%
7.00%
Nov-11 Nov-12 Nov-13 Nov-14 Nov-15 Nov-16 Nov-17
Santander Chile Banco de Chile BCI
Security Itau Corpbanca Industry
20.0%
40.0%
60.0%
80.0%
100.0%
Nov-10 Nov-11 Nov-12 Nov-13 Nov-14 Nov-15 Nov-16 Nov-17
Santander Chile Banco de Chile BCI
Security Itau Corpbanca Industry
-1.0%
-0.5%
0.0%
0.5%
1.0%
1.5%
2.0%
2.5%
3.0%
Nov-10 Nov-11 Nov-12 Nov-13 Nov-14 Nov-15 Nov-16 Nov-17
Santander Chile Banco de Chile BCI
Security Itau Corpbanca Industry
-10.0%
0.0%
10.0%
20.0%
30.0%
40.0%
Nov-10 Nov-11 Nov-12 Nov-13 Nov-14 Nov-15 Nov-16 Nov-17
Santander Chile Banco de Chile BCI
Security Itau Corpbanca Industry
7.5%
10.0%
12.5%
15.0%
17.5%
Oct-10 Oct-11 Oct-12 Oct-13 Oct-14 Oct-15 Oct-16 Oct-17
Santander Chile Banco de Chile
BCI Security
Itau Corpbanca Industry
Important DisclosuresThis research report was prepared by Credicorp Capital Peru S.A and/or Credicorp Capital Colombia Sociedad Comisionista de
Bolsa and/or Credicorp Capital S.A. Corredores de Bolsa, companies authorized to engage in securities activities in Peru, Colombia
and Chile, respectively and indirect subsidiaries of Credicorp Capital Ltd. (jointly referred to as “Credicorp Capital”). None of the
companies jointly referred to as Credicorp Capital are registered as broker-dealers in the United States and, therefore, they are not
subject to U.S. rules regarding the preparation of research reports and the independence of research analysts. This research report
is provided for distribution only to “major U.S. institutional investors” in reliance on the exemption from registration provided by Rule
15a-6 of the U.S. Securities Exchange Act of 1934, as amended (the “Exchange Act”).
Any U.S. recipient of this research report wishing to effect any transaction to buy or sell securities or related financial instruments
based on the information provided in this research report can do so only through Credicorp Capital Securities Inc., a registered
broker-dealer in the United States. Under no circumstances may a U.S. recipient of this research report effect any transaction to buy
or sell securities or related financial instruments directly through Credicorp Capital.
CCSI or any of its representatives are not involved in any way in the preparation, development, or supervision of the research report
and does not have any influence whatsoever over the research content.
Any analyst whose name appears on this research report is not registered or qualified as a research analyst with the Financial
Industry Regulatory Authority (“FINRA”) and is not a registered representative of Credicorp Capital Securities Inc. and, therefore, is
not subject to applicable restrictions under FINRA Rules on communications with a subject company, public appearances and
trading securities held by a research analyst account.
A. Analyst Disclosures
The functional job title of the person(s) responsible for the recommendations contained in this report is Equity Research Analyst
unless otherwise stated on the cover.
Regulation AC - Analyst Certification: Each Equity Research Analyst listed on the front-page of this report is principally
responsible for the preparation and content of all or any identified portion of this research report and hereby certifies that with
respect to each issuer or security or any identified portion of the report with respect to an issuer or security that the Equity Research
Analyst covers in this research report, all of the views expressed in this research report accurately reflect their personal views about
those issuer(s) or securities. Each Equity Research Analyst also certifies that no part of their compensation was, is, or will be,
directly or indirectly, related to the specific recommendation(s) or view(s) expressed by that Equity Research Analyst in this research
report.
Each Equity Research Analyst certifies that he or she is acting independently and impartially from the referenced
company/shareholders, directors and is not affected by any current or potential conflict of interest that may arise from any of the
companies’ activities.
Analyst Compensation: The research analyst(s) primarily responsible for the preparation of the content of this research report
attest(s) that no part of his or her compensation was, is or will be, directly or indirectly, related to the specific recommendations that
he or she expressed in the research report.
The equity research analysts responsible for the preparation of this report receive compensation based upon various factors,
including the quality and accuracy of research, client feedback, competitive factors, and overall firm revenues.
Registration of non-US Analysts: Unless otherwise noted, the non-US analysts listed on the front of this report are employees of
one of the companies jointly referred as Credicorp Capital, which are non-US affiliates of Credicorp Capital Securities Inc., a SEC
registered and FINRA member broker-dealer. Equity Research Analysts employed by the companies jointly referred as Credicorp
Capital, are not registered/ qualified as research analysts under FINRA/NYSE rules, are not registered representatives of Credicorp
Capital Securities Inc. and may not be subject to NASD Rule 2711 and NYSE Rule 472 restrictions on communications with covered
companies, public appearances, and trading securities held by a research analyst account. Please refer to
www.credicorpcapital.com for further information relating to research and conflict of interest management.
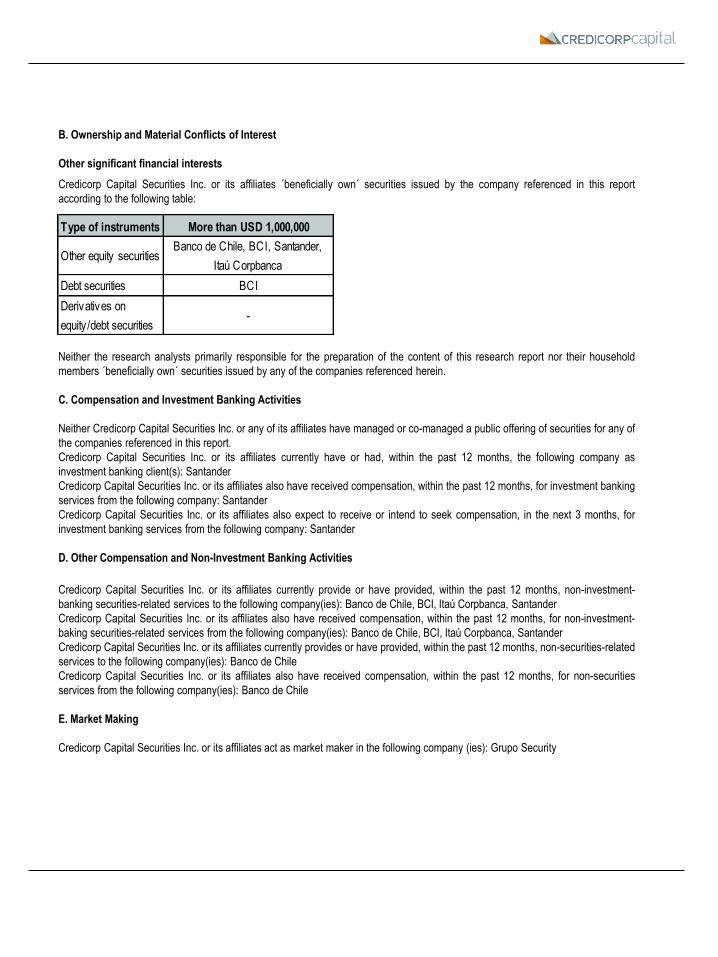
B. Ownership and Material Conflicts of Interest
Other significant financial interests
Credicorp Capital Securities Inc. or its affiliates ´beneficially own´ securities issued by the company referenced in this report
according to the following table:
Neither the research analysts primarily responsible for the preparation of the content of this research report nor their household
members ´beneficially own´ securities issued by any of the companies referenced herein.
C. Compensation and Investment Banking Activities
Neither Credicorp Capital Securities Inc. or any of its affiliates have managed or co-managed a public offering of securities for any of
the companies referenced in this report.
Credicorp Capital Securities Inc. or its affiliates currently have or had, within the past 12 months, the following company as
investment banking client(s): Santander
Credicorp Capital Securities Inc. or its affiliates also have received compensation, within the past 12 months, for investment banking
services from the following company: Santander
Credicorp Capital Securities Inc. or its affiliates also expect to receive or intend to seek compensation, in the next 3 months, for
investment banking services from the following company: Santander
D. Other Compensation and Non-Investment Banking Activities
Credicorp Capital Securities Inc. or its affiliates currently provide or have provided, within the past 12 months, non-investment-
banking securities-related services to the following company(ies): Banco de Chile, BCI, Itaú Corpbanca, Santander
Credicorp Capital Securities Inc. or its affiliates also have received compensation, within the past 12 months, for non-investment-
baking securities-related services from the following company(ies): Banco de Chile, BCI, Itaú Corpbanca, Santander
Credicorp Capital Securities Inc. or its affiliates currently provides or have provided, within the past 12 months, non-securities-related
services to the following company(ies): Banco de Chile
Credicorp Capital Securities Inc. or its affiliates also have received compensation, within the past 12 months, for non-securities
services from the following company(ies): Banco de Chile
E. Market Making
Credicorp Capital Securities Inc. or its affiliates act as market maker in the following company (ies): Grupo Security
Type of instruments More than USD 1,000,000
Other equity securitiesBanco de Chile, BCI, Santander,
Itaú Corpbanca
Debt securities BCI
Derivatives on
equity /debt securities-
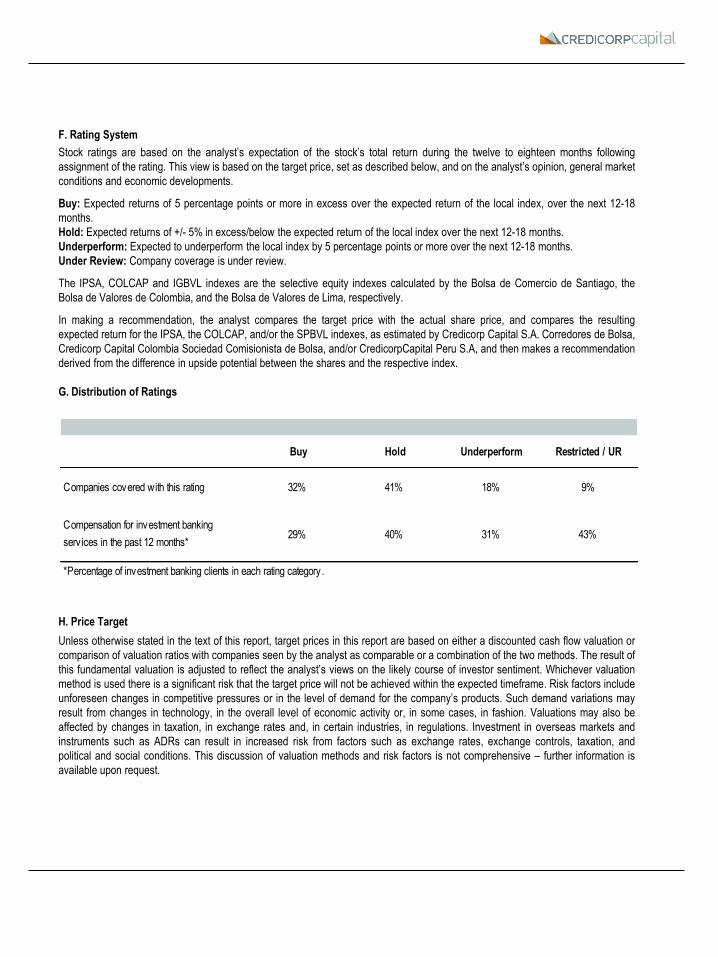
F. Rating System
Stock ratings are based on the analyst’s expectation of the stock’s total return during the twelve to eighteen months following
assignment of the rating. This view is based on the target price, set as described below, and on the analyst’s opinion, general market
conditions and economic developments.
Buy: Expected returns of 5 percentage points or more in excess over the expected return of the local index, over the next 12-18
months.
Hold: Expected returns of +/- 5% in excess/below the expected return of the local index over the next 12-18 months.
Underperform: Expected to underperform the local index by 5 percentage points or more over the next 12-18 months.
Under Review: Company coverage is under review.
The IPSA, COLCAP and IGBVL indexes are the selective equity indexes calculated by the Bolsa de Comercio de Santiago, the
Bolsa de Valores de Colombia, and the Bolsa de Valores de Lima, respectively.
In making a recommendation, the analyst compares the target price with the actual share price, and compares the resulting
expected return for the IPSA, the COLCAP, and/or the SPBVL indexes, as estimated by Credicorp Capital S.A. Corredores de Bolsa,
Credicorp Capital Colombia Sociedad Comisionista de Bolsa, and/or CredicorpCapital Peru S.A, and then makes a recommendation
derived from the difference in upside potential between the shares and the respective index.
G. Distribution of Ratings
H. Price Target
Unless otherwise stated in the text of this report, target prices in this report are based on either a discounted cash flow valuation or
comparison of valuation ratios with companies seen by the analyst as comparable or a combination of the two methods. The result of
this fundamental valuation is adjusted to reflect the analyst’s views on the likely course of investor sentiment. Whichever valuation
method is used there is a significant risk that the target price will not be achieved within the expected timeframe. Risk factors include
unforeseen changes in competitive pressures or in the level of demand for the company’s products. Such demand variations may
result from changes in technology, in the overall level of economic activity or, in some cases, in fashion. Valuations may also be
affected by changes in taxation, in exchange rates and, in certain industries, in regulations. Investment in overseas markets and
instruments such as ADRs can result in increased risk from factors such as exchange rates, exchange controls, taxation, and
political and social conditions. This discussion of valuation methods and risk factors is not comprehensive – further information is
available upon request.
Buy Hold Underperform Restricted / UR
Companies covered with this rating 32% 41% 18% 9%
29% 40% 31% 43%
*Percentage of investment banking clients in each rating category.
Compensation for investment banking
serv ices in the past 12 months*

II.ADDITIONAL DISCLOSURES
This product is not for retail clients or private individuals.
The information contained in this publication was obtained from various publicly available sources believed to be reliable, but has not
been independently verified by the companies jointly referred as Credicorp Capital, therefore they do not warrant the completeness
or accuracy of such information and does not accept any liability with respect to the accuracy or completeness of such information,
except to the extent required by applicable law.
This publication is a brief summary and does not purport to contain all available information on the subjects covered. Further
information may be available on request. This report may not be reproduced for further publication unless the source is quoted. This
publication is for information purposes only and shall not be construed as an offer or solicitation for the subscription or purchase or
sale of any securities, or as an invitation, inducement or intermediation for the sale, subscription or purchase of any securities, or for
engaging in any other transaction. This publication is not for private individuals.
Any opinions, projections, forecasts or estimates in this report are those of the author only, who has acted with a high degree of
expertise. They reflect only the current views of the author at the date of this report and are subject to change without notice. The
companies jointly referred to as Credicorp Capital have no obligation to update, modify or amend this publication or to otherwise
notify a reader or recipient of this publication in the event that any matter, opinion, projection, forecast or estimate contained herein,
changes or subsequently becomes inaccurate, or if research on the subject company is withdrawn. The analysis, opinions,
projections, forecasts and estimates expressed in this report were in no way affected or influenced by the issuer. The author of this
publication benefits financially from the overall success of Credicorp Capital.
The investments referred to in this publication may not be suitable for all recipients. Recipients are urged to base their investment
decisions upon their own appropriate investigations that they deem necessary. Any loss or other consequence arising from the use
of the material contained in this publication shall be the sole and exclusive responsibility of the investor and Credicorp Capital
accepts no liability for any such loss or consequence. In the event of any doubt about any investment, recipients should contact their
own investment, legal and/or tax advisers to seek advice regarding the appropriateness of investing. Some of the investments
mentioned in this publication may not be readily liquid investments. Consequently it may be difficult to sell or realize such
investments. The past is not necessarily a guide to future performance of an investment. The value of investments and the income
derived from them may fall as well as rise and investors may not get back the amount invested. Some investments discussed in this
publication may have a high level of volatility. High volatility investments may experience sudden and large falls in their value which
may cause losses. International investing includes risks related to political and economic uncertainties of foreign countries, as well
as currency risk.
To the extent permitted by applicable law, no liability whatsoever is accepted for any direct or consequential loss, damages, costs or
prejudices whatsoever arising from the use of this publication or its contents.
This report may not be independent of Credicorp Capital’s proprietary interests. Credicorp Capital trades the securities covered in
this report for its own account and on a discretionary basis on behalf of certain clients. Such trading interests may be contrary to the
recommendation(s) offered in this report
Credicorp Capital (and its affiliates) has implemented written procedures designed to identify and manage potential conflicts of
interest that arise in connection with its research business, which are available upon request. The Credicorp Capital research
analysts and other staff involved in issuing and disseminating research reports operate independently of Credicorp Capital’s
Investment Banking business. Information barriers and procedures are in place between the research analysts and staff involved in
securities trading for the account of Credicorp Capital or clients to ensure that price sensitive information is handled according to
applicable laws and regulations.

Country and region disclosures
United Kingdom: This document is for persons who are Eligible Counterparties or Professional Clients only and is exempt from the
general restriction in section 21 of the Financial Services and Markets Act 2000 on the communication of invitations or inducements
to engage in investment activity on the grounds that it is being distributed in the United Kingdom only to persons of a kind described
in Articles 19(5) (Investment professionals) and 49(2) (High net worth companies, unincorporated associations, etc.) of the Financial
Services and Markets Act 2000 (Financial Promotion) Order 2005 (as amended). It is not intended to be distributed or passed on,
directly or indirectly, to any other class of persons. Any investment to which this document relates is available only to such persons
and other classes of person should not rely on this document.
United States: This communication is only intended for, and will only be distributed to, persons residing in any jurisdictions where
such distribution or availability would not be contrary to local law or regulation. This communication must not be acted upon or relied
on by persons in any jurisdiction other than in accordance with local law or regulation and where such person is an investment
professional with the requisite sophistication to understand an investment in such securities of the type communicated and assume
the risks associated therewith.
This communication is confidential and is intended solely for the addressee. It is not to be forwarded to any other person or copied
without the permission of the sender. This communication is provided for information only. It is not a personal recommendation or an
offer to sell or a solicitation to buy the securities mentioned. Investors should obtain independent professional advice before making
an investment.
Notice to U.S. Investors: This material is not for distribution in the United States, except to “major US institutional investors” as
defined in SEC Rule 15a-6 ("Rule 15a-6") and related guidance. Credicorp Capital and its affiliates has entered into arrangements
with Credicorp Capital Securities Inc., which enables this report to be furnished to certain U.S. recipients in reliance on Rule 15a-6
through Credicorp Capital Securities Inc., which is registered under the U.S. Securities Exchange Act of 1934, as amended.
Each U.S. recipient of this report represents and agrees, by virtue of its acceptance thereof, that it is a "major U.S. institutional
investor" (as such term is defined in Rule 15a-6) and that it understands the risks involved in executing transactions in such
securities. Any U.S. recipient of this report that wishes to discuss or receive additional information regarding any security or issuer
mentioned herein, or engages in any transaction to purchase or sell or solicit or offer the purchase or sale of such securities, should
contact a registered representative of the Credicorp Capital Securities Inc. that provided the report.
Credicorp Capital Securities Inc. is a broker-dealer registered with the SEC, a member of FINRA and SIPC. You can reach
Credicorp Capital Securities Inc. At 121 Alhambra Plaza, suite 1200, Coral Gables, Miami 33134, phone (305) 4480971 Equity
trading: 786 999 1633.
You may obtain information about SIPC, including the SIPC brochure, by contacting SIPC directly at 202-371-8300; website:
http://www.sipc.org

Credicorp Capital Securities Inc., is a wholly owned subsidiary of Credicorp Capital Ltd.
Nothing herein excludes or restricts any duty or liability to a customer that Credicorp Capital Securities Inc. have under applicable
law. Investment products provided by or through Credicorp Capital Securities Inc. are not insured by the Federal Deposit Insurance
Corporation and are not deposits or other obligations of any insured depository institution, may lose value and are not guaranteed by
the entity that published the research as disclosed on the front page and are not guaranteed by Credicorp Capital Securities Inc.
Investing in non-U.S. Securities may entail certain risks. The securities referred to in this report and non-U.S. issuers may not be
registered under the U.S. Securities Act of 1933, as amended, and the issuer of such securities may not be subject to U.S. reporting
and/or other requirements. Rule 144A securities may be offered or sold only to persons in the U.S. who are Qualified Institutional
Buyers within the meaning of Rule 144A under the Securities Act. The information available about non-U.S. companies may be
limited, and non-U.S. companies are generally not subject to the same uniform auditing and reporting standards as U.S. companies.
Securities of some non-U.S. companies may not be as liquid as securities of comparable U.S. companies. Securities discussed
herein may be rated below investment grade and should therefore only be considered for inclusion in accounts qualified for
speculative investment.
Analysts employed by one of the companies jointly referred to as Credicorp Capital, all of which are non-U.S. broker-dealers, are not
required to take the FINRA analyst exam. The information contained in this report is intended solely for certain "major U.S.
institutional investors" and may not be used or relied upon by any other person for any purpose. Such information is provided for
informational purposes only and does not constitute a solicitation to buy or an offer to sell any securities under the Securities Act of
1933, as amended, or under any other U.S. federal or state securities laws, rules or regulations. The investment opportunities
discussed in this report may be unsuitable for certain investors depending on their specific investment objectives, risk tolerance and
financial position.
In jurisdictions where Credicorp Capital Securities Inc. is not registered or licensed to trade in securities, or other financial products,
transactions may be executed only in accordance with applicable law and legislation, which may vary from jurisdiction to jurisdiction
and which may require that a transaction be made in accordance with applicable exemptions from registration or licensing
requirements.
The information in this publication is based on sources believed to be reliable, but Credicorp Capital Securities Inc. does not make
any representation with respect to its completeness or accuracy. All opinions expressed herein reflect the author's judgment at the
original time of publication, without regard to the date on which you may receive such information, and are subject to change without
notice.
Credicorp Capital Securities Inc. or its affiliates may have issued other reports that are inconsistent with, and reach different
conclusions from, the information presented in this report. These publications reflect the different assumptions, views and analytical
methods of the analysts who prepared them. Past performance should not be taken as an indication or guarantee of future
performance, and no representation or warranty, express or implied, is provided in relation to future performance.
Credicorp Capital Securities Inc. and any company affiliated with it may, with respect to any securities discussed herein: (a) take a
long or short position and buy or sell such securities; (b) act as investment and/or commercial bankers for issuers of such securities;
(c) act as market makers for such securities; (d) serve on the board of any issuer of such securities; and (e) act as paid consultant or
advisor to any issuer. The information contained herein may include forward-looking statements within the meaning of U.S. federal
securities laws that are subject to risks and uncertainties. Factors that could cause a company's actual results and financial condition
to differ from expectations include, without limitation: political uncertainty, changes in general economic conditions that adversely
affect the level of demand for the company's products or services, changes in foreign exchange markets, changes in international
and domestic financial markets and in the competitive environment, and other factors relating to the foregoing. All forward-looking
statements contained in this report are qualified in their entirety by this cautionary statement.
Other countries: Laws and regulations of other countries may also restrict the distribution of this report. Persons in possession of
this document should inform themselves about possible legal restrictions and observe them accordingly.

Heinrich Lessau Hugo Horta
Director of Research Director of Sales & Trading
[email protected] [email protected]
# (562) 2446 1704 # (511) 416 3333 Ext 36088
CHILE PERU COLOMBIA CHILE PERU COLOMBIA
Carolina Ratto Mallie Héctor Collantes Juan Camilo Dauder René Ossa Rodrigo Zavala Juan A. Jiménez
Head of Equity Research - Retail Head of Equity Research - Mining Head of Equity Research International Equity Sales Head of Equity - Peru Head of International Equity Sales
[email protected] [email protected] [email protected] [email protected] [email protected] [email protected]
# (562) 2446 1768 # (511) 416 3333 Ext 33052 # (571) 339 4400 Ext 4155 # (562) 2651 9324 # (511) 313 2918 Ext 36044 # (571) 339 4400 Ext 1701
Tomás Sanhueza Luis Vicente Sebastián Gallego Sebastian Kreis Santiago Castro
Senior Analyst: Utilities & Small-Caps Associate: Banks Head Equity Sales Chile International Sales & Trading
[email protected] [email protected] [email protected] [email protected]
[email protected] # (511) 416 3333 Ext 37854 # (571) 339 4400 Ext 1594 # (562) 2446 1738 # (571) 339 4400 Ext 1344
# (562) 2446 1751
Ursula Mitterhofer
Andrés Cereceda Raúl F. Jacob Steffania Mosquera Sales & Trading
Analyst: Cement & Construction Senior Analyst: Infraestructure, [email protected]
[email protected] consumption # (562) 2450 1613
[email protected] # (511) 416 3333 Ext 36065 [email protected]
# (562) 2446 1798 # (571) 339 4400 Ext 1025 Credicorp Capital UK Ltd.
Frederic Cartallier, CFA Ángela María González Marilyn Macdonald Cristián Castillo
Senior Analyst: Utilities Senior Analyst: Transport, TMT & NBFS International Equity Sales International Sales Trader
[email protected] [email protected] [email protected] [email protected]
# (562) 2651 9332 # (571) 339 4400 Ext 1365 # (4477) 7151 5855 # (786) 999 1633
Felipe Navarro
Analyst
# (562) 2450 1688 Andrés Nariño Alfredo Bejar
Director Sales Offshore Head of International FI
Ana María Bauzá [email protected] [email protected]
Research Coordinator # (571) 339-4400 Ext. 1459 # (511) 205 9190 Ext 36148
# (562) 2450 1609 CHILE PERU COLOMBIA
Gonzalo Covarrubias Evangeline Arapoglou Carlos Sanchez
Head of Capital Markets Head of international FI Sales Head of Fixed Income
CHILE PERU COLOMBIA [email protected] [email protected] [email protected]
# (562) 2450 1635 # (511) 416 3333 Ext 36099 # (571) 323 9154
Maria Eugenia Diaz Diego Cavero Daniel Velandia, CFA
Head of Fixed Income Research Senior Fixed Income Analyst Head of Research & Chief Economist Guido Riquelme Andrés Valderrama Camilo Moreno
[email protected] [email protected] [email protected] Head of Sales Fixed Income Sales Head of Sales
# (562) 2651 9308 # (511) 416 3333 Ext 37946 # (571) 339 4400 Ext 1505 [email protected] [email protected] [email protected]
# (562) 2446 1712 # (511) 416 3333 Ext 40352 # (571) 323 9252
Ignacio Sabelle Juan Pablo Brosset Camilo A. Durán
Fixed Income Analyst Fixed Income Analyst Macro Analyst Belén Larraín Natalia Jurado Andrés Agudelo
[email protected] [email protected] [email protected] Head of International FI Sales Fixed Income Sales Fixed Income Sales
# (562) 2651 9368 # (511) 416 3333 Ext 36018 # (5511) 339 4400 Ext. 1383 [email protected] [email protected] [email protected]
# (562) 2446 1720 # (511) 416 3333 Ext 36027 # (571) 339 4400 Ext 1768
Felipe Guzmán
Senior Economist Juan Francisco Mas Lizeth Espiritu Emilio Luna
[email protected] Fixed Income Sales Fixed Income Sales Fixed Income Sales
# (562) 2651 9385 [email protected] [email protected] [email protected]
# (562) 2446 1792 # (511) 416 3333 Ext 36143 # (571) 339 4400 Ext 1761
Rafael Gaete Guillermo Arana
Local Fixed Income Sales Fixed Income Sales
[email protected] [email protected]
# (562) 2651 9336 # (511) 313 2902 Ext. 36144
Diego Hidalgo Patricio Luza
Local Fixed Income Sales Fixed Income Sales
[email protected] [email protected]
# (562) 2450 1693 # (511) 416 3333 Ext. 36168
Jhonathan Rico Michael Tafur
Fixed Income Sales Fixed Income Sales
[email protected] [email protected]
# 1 (786) 999 1614 # 1 (786) 999 1607
Credicorp Capital Securities INC
Senior Analyst: Food & Beverages,
Transport, Telecom & I.T.
CONTACT LIST
ANDEAN RESEARCH TEAM SALES & TRADING
EQUITY RESEARCH EQUITY SALES & TRADING
Senior Analyst: Healthcare, Pension
Funds, Pulp & Paper.
FIXED INCOME SALES & TRADING
FIXED INCOME & ECONOMICS RESEARCH
Credicorp Capital Securities INC