Children’s Food Security and Intakes from School Meals ...
135
Abstract Using 2005 data from the U.S. Department of Agriculture’s Third School Nutrition Dietary Assessment survey, this study examines the contribution of school meals to the food and nutrient intake of children in food-secure, marginally secure, and food-insecure households. The study finds that children from food-insecure and marginally secure households receive a larger proportion of their food and nutrient intakes at school than do children from highly secure households. This difference is partially explained by the higher participation rates of the insecure and marginally secure in school meal programs. The average amount of foods and nutrients consumed were similar across food security levels, except that children from marginally secure households consumed fewer calories (and thus nutrients) than both other groups. Breakfast skipping was significantly more common among the food-insecure and marginally secure children. Even at schools with breakfast programs, 20 percent of children from food-insecure and marginally secure households did not eat breakfast, for reasons that will require further study to explore. Keywords: School nutrition, food insecurity, 24-hour intakes, marginal food security, NSLP, SBP, MPEs, breakfast skipping By Elizabeth Potamites and Anne Gordon, Mathematica Policy Research, Inc. Children’s Food Security and Intakes from School Meals Final Report Contractor and Cooperator Report No. 61 May 2010 This study was conducted by Mathematica Policy Research, Inc., under a cooperative research contract with USDA’s Economic Research Service (ERS) Food and Nutrition Assistance Research Program (FANRP): contract number 59-5000-8-0101 (ERS project representative: Katherine Ralston). The views expressed are those of the authors and not necessarily those of ERS or USDA.
Transcript of Children’s Food Security and Intakes from School Meals ...
Abstract
Using 2005 data from the U.S. Department of Agriculture’s Third School Nutrition Dietary Assessment survey, this study examines the contribution of school meals to the food and nutrient intake of children in food-secure, marginally secure, and food-insecure households. The study finds that children from food-insecure and marginally secure households receive a larger proportion of their food and nutrient intakes at school than do children from highly secure households. This difference is partially explained by the higher participation rates of the insecure and marginally secure in school meal programs. The average amount of foods and nutrients consumed were similar across food security levels, except that children from marginally secure households consumed fewer calories (and thus nutrients) than both other groups. Breakfast skipping was significantly more common among the food-insecure and marginally secure children. Even at schools with breakfast programs, 20 percent of children from food-insecure and marginally secure households did not eat breakfast, for reasons that will require further study to explore.
Keywords: School nutrition, food insecurity, 24-hour intakes, marginal food security, NSLP, SBP, MPEs, breakfast skipping
By Elizabeth Potamites and Anne Gordon, Mathematica Policy Research, Inc.
Children’s Food Security and Intakes from School MealsFinal ReportContractor and Cooperator Report No. 61May 2010
This study was conducted by Mathematica Policy Research, Inc., under a cooperative research contract with USDA’s Economic Research Service (ERS) Food and Nutrition Assistance Research Program (FANRP): contract number 59-5000-8-0101 (ERS project representative: Katherine Ralston). The views expressed are those of the authors and not necessarily those of ERS or USDA.

Mathematica Reference Number:
06527.050
Submitted to:
USDA Economic Research Service
1800 M Street, NW
Washington, DC 20036
Project Officer: Katherine Ralston
Submitted by:
Mathematica Policy Research
P.O. Box 2393
Princeton, NJ 08543-2393
Telephone: (609) 799-3535
Facsimile: (609) 799-0005
Project Director: Anne Gordon
Children’s Food Security and Intakes
from School Meals
Final Report
Elizabeth Potamites
Anne Gordon

Children’s Food Security and School Meals Mathematica Policy Research
iii
ACKNOWLEDGMENTS
We would like to express appreciation for the support from the Economic Research Service (ERS) of the U.S. Department of Agriculture (USDA) for this study. Katherine Ralston of ERS, our project officer, provided helpful feedback and support throughout. Mark Nord of ERS reviewed the food security data from the third School Nutrition Dietary Assessment Study (SNDA-III) to check its psychometric properties, advised us on food security measures, and provided very helpful comments on the draft report.es. Others at ERS who provided comments and encouragement included Joanne Guthrie and David Smallwood. The two external expert reviewers of the report, Dr. Barbara Devaney of Mathematica and Professor Helen Jensen of Iowa State University, provided important insights that substantially improved the report.
This study would not have been possible without the contributions of many Mathematica colleagues. Ronette Briefel first suggested the idea for this study and provided helpful comments and suggestions throughout. Brittany English conducted the analysis programming, with assistance in early stages from Ander Wilson. Liz Condon, a nutrition analyst at Mathematica, created the “percentage of portion consumed” variables discussed in Chapter V, with programming assistance from Ander Wilson. Ms. Condon also contributed to the detailed documentation of these variables in Appendix C Jim Ohls provided quality assurance review of the draft report. Walt Brower edited the report and it was produced by Jane Nelson.
We gratefully acknowledge these contributions and accept full responsibility for any errors that remain.


Children’s Food Security and School Meals Mathematica Policy Research
v
CONTENTS
EXECUTIVE SUMMARY........................................................................................ xi
I INTRODUCTION ................................................................................................. 1
A. Study Goals ................................................................................................. 2
B. Previous Research ....................................................................................... 4
1. Relationships Among Food Security, Dietary Intake, and
Developmental Outcomes ...................................................................... 4 2. Relationship of Food Security and NSLP and SBP Participation ................. 5
C. Overview of Report ...................................................................................... 7
II DATA AND METHODS ......................................................................................... 9
A. Overview of SNDA-III Data ............................................................................ 9
1. Sample Design ....................................................................................... 9 2. Data Collection on School Breakfast and Lunch Menus ......................... 10
3. Data Collection from Students and Parents ........................................... 11
B. Dietary and Participation Measures ............................................................ 12
1. Food and Nutrient Coding .................................................................... 12
2. Definitions of Breakfast, Lunch, and On-Menu Foods ............................ 13
3. Student Participation in NSLP and SBP ................................................... 15
C. Food Security Measures ............................................................................. 15
D. Analysis Methods and Issues ..................................................................... 21
III CHARACTERISTICS OF FOOD-INSECURE AND MARGINALLY SECURE STUDENTS .. 25
A. Student and Household Characteristics...................................................... 25
B. Student Health, Physical Activity, and Eating Habits ................................... 32
C. School Characteristics ............................................................................... 32
IV COMPARISONS OF DIETARY INTAKES BY FOOD SECURITY STATUS ..................... 39
A. Approach to Food and Nutrient Analyses ................................................... 39

Children’s Food Security and School Meals Mathematica Policy Research
vi
Contents (continued)
B. Mean Nutrient Intakes by Food Security Status........................................... 41
1. Intakes over 24 Hours .......................................................................... 41
2. Breakfast Intakes .................................................................................. 47
3. Lunch Intakes ....................................................................................... 52 4. Contributions of On-Menu School Foods to Nutrient Intake .................. 57
C. Food Group Servings (MyPyramid Equivalents) ........................................... 61
1. Intakes of MPEs over 24 Hours ............................................................. 61
2. Breakfast Intakes .................................................................................. 65 3. Lunch Intakes ....................................................................................... 65
4. Contributions of On-Menu School Foods ............................................... 65
D. Conclusions .............................................................................................. 72
V PERCENTAGE OF SCHOOL LUNCH FOODS CONSUMED ....................................... 77
A. Method for Estimating Percentage Consumed/Plate Waste in School
Meals ........................................................................................................ 77
B. Results ...................................................................................................... 83
VI FOOD SECURITY AND BREAKFAST SKIPPING ...................................................... 85
VII CONCLUSION ................................................................................................... 97
A. Key Findings ............................................................................................... 97
B. Two Puzzles .............................................................................................. 98
1. Why Did So Many Less-Secure Children Skip Breakfast, When the SBP
Was Available? ...................................................................................... 98
2. Why Did Marginally Food-Insecure Children Eat Less, on Average,
than Both Food Insecure and Highly Food-Secure Children? .................. 98
REFERENCES ................................................................................................... 101
APPENDIX A: REGRESSION MODELS AND RESULTS ...........................................A.1
APPENDIX B: PERCENTAGE CONSUMED FOR SCHOOL LUNCH FOODS ............... B.1

Children’s Food Security and School Meals Mathematica Policy Research
vii
TABLES
II. I Percentage Responding Affirmatively to Each Food Security Item, by the
Number of Affirmative Answers on the Adult Scale.......................................... 17
II.2 Adult Food Security Is Closely Related to Other Food Security Measures .......... 20
III.1 Household Income and Program Participation, by Food Security Status ........... 26
III.2 Demographics by Food Security and NSLP Participation ................................... 30
III.3 Health, Physical Activity, and Eating Habits, by Food Security and NSLP
Participation ................................................................................................... 33
III.4 Characteristics of Schools Attended, by Food Security and NSLP Participation
Status ............................................................................................................. 36
IV.1a 24-Hour Nutrient Intakes ................................................................................ 42
IV.1b Regression-Adjusted 24-Hour Nutrient Intakes ............................................... 44
IV.2a Breakfast Nutrient Intakes ............................................................................... 48
IV.2b Regression-Adjusted Breakfast Nutrient Intakes .............................................. 50
IV.3a Lunch Nutrient Intakes .................................................................................... 53
IV.3b Regression-Adjusted Lunch Nutrient Intakes ................................................... 55
IV.4a Proportion of 24-hour Nutrient Intakes Contributed by On-Menu School
Foods ............................................................................................................. 58
IV.4b Proportion of 24-hour Nutrient Intakes Contributed by On-Menu School
Foods, Regression-Adjusted Means ................................................................. 59
IV.5a MyPyramid Equivalents Eaten Over 24 Hours, by Food Security Status and
NSLP Participation ........................................................................................... 62
IV.5b Regression-Adjusted MyPyramid Equivalents Eaten Over 24 Hours .................. 63
IV.6a MyPyramid Equivalents Eaten at Breakfast, by Food Security Status and SBP
Participation ................................................................................................... 66
IV.6b Regression-Adjusted MyPyramid Equivalents Eaten at Breakfast ...................... 67
IV.7a MyPyramid Equivalents Eaten at Lunch, by Food Security Status and
NSLP Participation ........................................................................................... 69
IV.7b Regression-Adjusted MyPyramid Equivalents Eaten at Lunch ........................... 70
Children’s Food Security and School Meals Mathematica Policy Research
viii
Tables (continued)
IV.8a Proportion of 24 Hour MyPyramid Equivalents Contributed by On-Menu
School Foods, by Food Security Status and NSLP or SBP Participation ............... 73
IV.8b Regression-Adjusted Proportion of 24-Hour MyPyramid Equivalents
Contributed by On-Menu School Foods ........................................................... 75
V.1 Percentage of School Lunch Portions Consumed by NSLP Participants,
by Food Security Status ................................................................................... 81
VI.1 Meal Skipping Behavior and Food Security Status ............................................ 86
VI.2 24-Hour Intakes by Food Security Status and Breakfast Skipping Behavior
Among Students at Schools that Serve Breakfast ............................................. 89
VI.3 Student Characteristics by Food Security and Breakfast Skipping Behavior,
Among Students at Schools that Serve Breakfast ............................................. 91
VI.4 Health, Physical Activity, Eating Habits, and School Characteristics,
by Breakfast Skipping Behavior, Among Students at Schools that
Serve Breakfast ............................................................................................... 94
Children’s Food Security and School Meals Mathematica Policy Research
ix
FIGURES
V.1 Matching Process To Obtain Portion Offered For Dietary Recall Foods
From SNDA-III Menu Survey Data ..................................................................... 80


Children’s Food Security and School Meals Mathematica Policy Research
xi
EXECUTIVE SUMMARY
The National School Lunch Program (NSLP) and the School Breakfast Program (SBP) seek to provide nutritious meals to low-income children for free or at a reduced price and are important parts of the nation’s safety net. In 2007, 16 percent of households with children experienced food insecurity (Nord 2009). Given President Obama’s goal of ending childhood hunger by 2015 and the upcoming reauthorization of the NSLP and the SBP, understanding the role of school meals in the diets of disadvantaged children is crucial.
What Is the Issue?
School nutrition policies are faced with balancing the needs of children from food insecure households and concerns about childhood obesity. Although there is recent work on the relationship of school meals and obesity, less is known about the dietary intakes of children from less-food-secure households and the contribution of school meals to their diets. This report, therefore, focuses on the diets of children from food-insecure and marginally food-secure households and the school meals they consume.
Using data from the third School Nutrition Dietary Assessment Study (SNDA-III), this study examines the school-day diets of a national sample of children who attended public schools in 2005. Children from food-insecure households are compared with children from marginally food-secure households and highly food-secure households in five areas: (1) background characteristics; (2) intakes of calories, nutrients, and foods; (3) the contribution of school meals to their daily intakes; (4) percentage of school lunch portions consumed; and (5) rate of meal skipping.
What Did the Study Find?
Children from food-insecure or marginally food-secure households were more disadvantaged than highly food-secure children in household income, family structure, and parent education. For example, 90 percent and 85 percent of the food-insecure and marginally secure households, respectively, reported incomes below 185 percent of the federal poverty level (and hence were eligible for free or reduced-price meals) compared with 27 percent of the highly food-secure households. Correspondingly large majorities of children from food-insecure and marginally food-secure households participated in NSLP. However, far fewer participated in SBP: 37 percent of those from food-insecure households and 26 percent of those from marginally secure households.
Daily calories consumed were similar for children from food-insecure and highly secure households. Furthermore, very few significant differences emerged from the analysis of diet quality in terms of either nutrients or types of foods eaten when comparing the insecure with the highly secure. Both groups consumed similarly low amounts of fruits and vegetables relative to U.S. Department of Agriculture (USDA) recommendations (less than one and one-quarter cups of each food group). However, children from marginally secure households consumed significantly fewer calories than those in either of the other two groups (and, accordingly, smaller amounts of many other nutrients).
School meals represented a larger proportion of the school-day caloric and nutrient intakes of children from food-insecure and marginally secure households relative to children from highly secure households. On average, children from highly secure households obtained 16 percent of their daily calories from school meals while children from insecure and marginally secure households

Children’s Food Security and School Meals Mathematica Policy Research
xii
obtained 26 and 24 percent, respectively. This difference is only partially explained by the lower participation rates of the highly secure in the school meal programs. Participants from highly secure households obtained 27 percent of their daily calories from school meals while participants from insecure households obtained 32 percent. The same pattern was observed for many nutrients and foods. One large significant difference was for calcium intakes; participants from insecure households obtained 47 percent of their daily calcium from school meals compared with 38 percent for participants from highly secure households.
This study also examined whether food-insecure lunch participants were more or less likely to consume all of the items they selected. Exploratory analysis of this topic, also known as “plate waste,” took advantage of the SNDA-III menu survey to construct a measure of the percentage consumed by NSLP participants among foods selected as part of school lunches. The values for this variable ranged widely and sometimes exceeded 100 percent, indicating some possible food trading or sharing. The median amount consumed was approximately 100 percent for all major food groups, except for vegetables, for which the median percentage consumed was 68 percent. No significant differences were found in percentages consumed across the food security groups. Limitations of this approach were small sample sizes and lack of data on foods selected but not even tasted.
Lastly, breakfast skipping was significantly more common among food-insecure and marginally secure children. Even at schools with breakfast programs, 20 percent of children from food-insecure and marginally secure households did not eat any breakfast. Regardless of food-security status, breakfast skippers, on average, did not make up calories missed later in the day. Furthermore, breakfast skippers tended to be from households with lower incomes than consumers, to be obese more often, and were less likely to be reported as in excellent health.
This analysis raises two areas for future research.
1. Why did children from insecure and marginally secure households skip breakfast at a higher rate than other children when the SBP was available to them? What policies could increase SBP participation?
2. Is the finding that children from marginally secure households consume less corroborated by other databases and, if so, what might explain this surprising finding?
How Was the Study Conducted?
SNDA-III data are from a nationally representative sample of public school students in grades 1 to 12 in 2005. Data collected include 24-hour dietary recalls of students and parent surveys on background characteristics and the USDA food-security module. In addition, the study collected detailed data on foods offered on school menus. Using the publicly available data from SNDA-III, this report compares average food and nutrient intakes on a single school-day across the three food security groups. Intakes were assessed over the full day and for breakfast and lunch separately. Mean intakes are presented both with and without adjusting for other background characteristics.

Children’s Food Security and School Meals Mathematica Policy Research
1
I. INTRODUCTION
The National School Lunch Program (NSLP) and the School Breakfast Program (SBP) are
intended to promote children’s health and well-being by providing nutritious meals to low-income
children for free or at a reduced price (and to higher-income children at a subsidized price) and are
important parts of the nation’s safety net. Established in 1946, the NSLP in fiscal year (FY) 2008
served more than 30.5 million children per school day, of whom 60 percent received lunches free or
at a reduced price (USDA FNS 2009a). The SBP was piloted starting in 1966 and became a
permanent program in 1975 (USDA FNS 2009b). Although targeted to districts serving low-income
children and children who traveled a long way to school, the program is now offered in 85 percent
of public schools that offer the NSLP (Gordon et al. 2007a). It still predominantly serves children
from low-income families—81 percent of SBP breakfasts were served free or at a reduced price in
FY 2008. Both programs are federally funded and are administered at the federal level by the U.S.
Department of Agriculture (USDA), Food and Nutrition Service (FNS); FY2008 expenditures were
more than $9.3 billion for the NSLP and more than $2.4 billion for the SBP (USDA FNS 2009a,
2009b).
One part of USDA’s mission (as outlined in its 2005-2010 strategic plan) is “improvements in
access to federal nutrition assistance programs as the centerpiece of the federal strategy to reduce
and prevent hunger among low-income people” (USDA 2006). USDA developed and uses food
security measures to monitor the extent of food insecurity in the population and to identify those
groups most in need of nutrition assistance. It defines food insecurity as “the lack of access to
adequate food because of insufficient money or other resources for food” (Nord 2007).
The NSLP and SBP are up for reauthorization in 2010, so it is an opportune time to consider
how well the programs are meeting their goals. In the past decade, the goals of school nutrition
policy have broadened from ensuring that children receive adequate nutrition to include addressing

Children’s Food Security and School Meals Mathematica Policy Research
2
childhood obesity. In considering changes to the school meal programs, policymakers face the
challenge of making changes sufficiently flexible that the school meal programs remain a safety net
for children from food-insecure households, while also promoting healthy diets. For example, some
observers (such as Besharov [2002]) have recommended reducing portion sizes in school meals to
help prevent excessive energy intakes. This report may indirectly inform the debate about potential
tradeoffs between providing less food-secure children with a high-quality diet and preventing them
from consuming too much.1 However, the focus of this study is not to examine links between food
security and obesity2 (or school meals and obesity3).
Given the large number of families with children who use emergency food sources (Mabli et al.
2010) and the higher levels of food insecurity during summer months (Nord and Romig 2006), it
seems likely that some students (and parents) from food-insecure households rely on school meals
to meet students’ daily energy needs. Therefore our aim is to provide descriptive evidence on the
relationship between household food security, school meals, and children’s diets using a rich data
source, the third School Nutrition Dietary Assessment Study (SNDA-III).
A. Study Goals
School meal issues are currently under the spotlight of reauthorization debates, the economic
recession, and continuing concerns about childhood obesity. Nonetheless, the role of school meals
in the diets of children in families with some degree of food insecurity has not been extensively
1 This report presents descriptive information on the weight status of children by their level of food security (see
Chapter III) but does not otherwise address the relationship between food insecurity and obesity.
2 The relationship between food security and obesity in children is still an open question. See Appendix B of Nord
(2009) for a summary of this literature (such as Alaimo et al. [2001], Bhargava et al. [2008], Bronte-Tinkew et al. [2007], Jyoti et al. [2005], and Winicki and Jemison [2003]).
3 There is some recent work on the relationship between school meals and obesity. Gleason et al. (2009) finds that lunch participation is not associated with higher BMI, while Millimet et al. (forthoming) and Schanzenbach (2009) argue that, after controlling for selection, participation in NSLP may contribute to childhood obesity. Gleason et al. (2009) and Millimet et al. (forthcoming) both find that participation in SBP may protect against it.
Children’s Food Security and School Meals Mathematica Policy Research
3
studied. Because food insecurity may affect or be affected by school meal participation, it is hard to
establish the direction of causality, particularly using cross-sectional data. The goal of this project is
to use data from SNDA-III, based on a 2005 national sample of U.S. public school students in
grades 1 through 12, to examine the degree to which the USDA school meal programs provide a
safety net for schoolchildren from food-insecure and marginally secure households.4 This study
addresses the following descriptive research questions:
How do the nutrients consumed by children from food-insecure and marginally food-secure households compare to consumption by highly secure children at breakfast, lunch, and over 24 hours? Do food-insecure and marginally secure children obtain a larger proportion of their nutrients and energy on school days from school meals than highly food-secure children?
How do the foods consumed by children from food-insecure and marginally food-secure households compare to consumption by highly secure children at breakfast, lunch, and over 24 hours? Do food-insecure and marginally secure children consume a larger proportion of their daily servings of key food groups (such as milk, fruits, vegetables, and meats) from school meals than highly food-secure children?
Do food-insecure and marginally secure children who participate in the NSLP consume larger portions of lunch menu items (relative to the portions offered) than other participants? In other words, do they waste less food?
Are food-insecure and marginally secure children more likely to skip meals than highly secure children?
The USDA food security scales classify households on a gradient from “highly secure” to
“insecure,” with “marginally food secure” in between. The research questions mention both food-
insecure and marginally food-secure children because we also sought to assess whether children “on
the margin” eat differently or have characteristics different from children in households that are
classified as insecure or highly secure. To address these questions, this study uses SNDA-III data on
4 In the rest of this report, at times, for the sake of brevity, we refer to children as “food insecure” (or “marginally
secure”) to mean that they are part of a household that is food insecure (or marginally secure). However it is possible that only the adults in these households experience food insecurity (or marginal food security). Our measures of food insecurity will be discussed in more detail in Chapter II.

Children’s Food Security and School Meals Mathematica Policy Research
4
both foods and nutrients offered in the meal programs at public schools, as well as data from 24-
hour dietary recalls on students’ consumption on a typical school day. By matching these two
sources of data, we can gain insight into the role of school meals in children’s diets for children from
households with different levels of food security, and assess the extent to which differences reflect
such factors as greater participation among less-food-secure students, as well as differences in food
choices among participants at various levels of food security.5
B. Previous Research
To provide context for our analyses, this section reviews previous literature that examined
relationships between food security and children’s dietary intakes and other developmental
outcomes, as well as research on food security and school meal participation.
1. Relationships Among Food Security, Dietary Intake, and Developmental Outcomes
Previous studies indicate that the relationship between food security and dietary and
developmental outcomes is complex. Some studies indicate that food insecurity is associated with
lower dietary intakes, but some point in the opposite direction. At the same time, food insecurity
may have little relation to schoolchildren’s diets because, in most food-insecure households with
children, the younger children are shielded from effects of the family’s food insecurity (Nord and
Hopwood 2007). Rose (1999), in an analysis of the 1989-1991 Continuing Survey of Food Intake by
Individuals (CSFII), reported that preschoolers from food-insufficient households did not have
significantly lower nutrient intakes than those from food-sufficient households, but that the rest of
the household members did have lower intakes. Using the 1994-1996 CSFII, Casey et al. (2001)
found that children from low-income households had similar intakes, whether they were food
sufficient or food insufficient. However, Olson (1999) and Kleinman et al. (1998) reported that
5 We use the term “less-food-secure” to refer to students from food-insecure and marginally food-secure
households as one group—all who are not from highly food secure households.

Children’s Food Security and School Meals Mathematica Policy Research
5
hunger in children (as measured by the Community Childhood Hunger Identification Project) was
associated with negative psychosocial outcomes, as measured by the parent-completed Pediatric
Symptom Checklist. In addition, Jyoti et al. (2005), using longitudinal data on elementary school
children from the Early Childhood Longitudinal Survey, Kindergarten Cohort (ECLS-K), concluded
that food insecurity was linked to undesired developmental consequences.
2. Relationship of Food Security and NSLP and SBP Participation
Only a few studies have looked at food insecurity and school meals. In a series of papers
funded under USDA Small Grants, Dunifon and Kowaleski-Jones (2003, 2004) examined factors
associated with NSLP participation (including food security) and the effect of both food security
and NSLP participation on health and developmental outcomes. An interesting feature of their
model was the use of sibling fixed effects to look at the effect of participation. However, their use of
sibling fixed effects was not a strong identification strategy: it relied on one sibling participating and
the other not participating, which reduced their sample sizes and may have led to a biased sample.
Outcomes they examined included math and reading test scores, parental reports of the child’s
health limitations, and measures from the Behavioral Problems Index. They found that the
probability of a student having a health limitation was positively correlated with both food insecurity
and NSLP participation. However, after controlling for self-selection into the NSLP program (also
known as “selection bias”) by sibling comparison, they concluded that the association between
NSLP participation and child heath limitations was due to unmeasured family-specific factors.6
Although they did not find a positive effect of NSLP participation after adjusting for selection bias,
their findings suggested that the seemingly negative effect was likely to be due to selection into the
program.
6 In general, in estimating the effects of program participation on an outcome, “selection bias” occurs when the
outcome is affected by unmeasured factors correlated with program participation and with the outcome of interest.
Children’s Food Security and School Meals Mathematica Policy Research
6
Bartfeld et al. (2009) included a section on the relationship between food security and the
availability of school breakfasts among low-income third grade students. Using the ECLS-K, they
found that, unconditionally, there is a strong inverse relationship between a student’s access to SBP
and food insecurity, measured using both the standard USDA definition of food insecurity and a less
restrictive definition that included the marginally secure. After controlling for many household and
geographical characteristics, they found that access to SBP is not significantly related to the
likelihood of being food insecure (USDA definition), but that it does significantly decrease the
likelihood of being marginally secure or insecure. As they note, only a small minority of low-income
children do not have access to the SBP, which makes it more difficult to measure the possible effect
of SBP availability. Furthermore, while studying the effect of access to SBP (instead of the effect of
SBP participation) addresses the issues of individual selection, there may still be selection bias
because schools select into the SBP. To address this concern, they used variation in state-level
mandates about whether SBP must be offered.7 Using this technique, they did not find any
significant relationship between access to SBP and either measure of food insecurity.
Bhattacharya et al. (2004a) compared the nutritional status of school-aged children during the
summer to their nutritional status during the school year, using the National Health and Nutrition
Examination Survey (NHANES) III, 1988-1994, and concluded that the SBP improved children’s
diets.8 This may explain their finding in a related study that neither poverty nor food insecurity was
related to nutritional outcomes among school-aged children (2004b).
7 Since these mandates are highly predictive of whether schools offer SBP, this variation can be used to identify the
impact of access to SBP on food insecurity as long as these mandates are not related to food insecurity except through its association with SBP. The possibility that such mandates could be a response to higher levels of food security is not discussed in the report.
8 Furthermore, they found some evidence of spillover effects to adults in the household.

Children’s Food Security and School Meals Mathematica Policy Research
7
Nord and Romig (2006) took a similar approach to assessing the impact of the NSLP. They first
described the differences in seasonal rates of food insecurity for households with school-aged
children and for households without them. They found greater seasonal changes for households
with school-aged children; specifically, such households had more food insecurity in the summer,
which may be associated with school meals not being available. Next, they looked at differences
across states in the size of their Summer Food Service Program (SFSP)—a much smaller federal
child nutrition program that serves school-aged children during the summer-- and reported that the
seasonal changes in food security were greater in states that served fewer SFSP meals relative to their
NSLP meals served during the school year. This macro (state-level) approach is another way to
address the self-selection issues that affect estimates of the impact of food assistance programs using
individual-level data.9
C. Overview of Report
Chapter II provides additional background on the SNDA-III data and sample and the food
security measures used in this report. Chapter III describes the background characteristics of
schoolchildren at various levels of food security for both the overall sample and the subsample of
NSLP participants, as context for interpreting the results regarding their diets. Chapters IV to VI
present the core results of the study. Chapter IV addresses the first two sets of research questions by
examining mean intakes of nutrients and MyPyramid food groups by food security status at
breakfast, lunch, and over 24 hours, as well as the proportion of daily intakes contributed by school
meals. Chapter V presents analysis of a measure of “percentage consumed” by school lunch
participants for items from school lunch menus, by food group (at the whole food level), and by
children’s food security status. Chapter VI describes the relationship between food security and
9 There is a much larger literature on the impact of food stamps on participants’ food security and dietary status.
See Wilde et al. (2008) for a recent survey.

Children’s Food Security and School Meals Mathematica Policy Research
8
skipping breakfast among children in public school. Chapter VII summarizes key findings and
reflects on remaining puzzles.

Children’s Food Security and School Meals Mathematica Policy Research
9
II. DATA AND METHODS
This chapter contains an overview of the SNDA-III data used in this report; a discussion of
dietary measures, measures of school meal program participation, and food security measures used
to classify students; and some notes on the analysis methods used.
A. Overview of SNDA-III Data
SNDA-III provides data that are nationally representative of public school districts, the schools
in them, and the students who attended those schools in school year (SY) 2004-2005. School- and
district-level survey data provide a wide range of characteristics of the meal programs, basic school
characteristics such as enrollment, and demographic and socioeconomic characteristics of the
students. Detailed data on the foods and nutrients provided in reimbursable school meals are also
available.
Student-level data, of most interest for this study, were derived from a student interview about
opinions of school meals and, for older students, questions about eating habits and other activities
related to health. In addition, students participated in a 24-hour dietary recall interview (with parent
help for elementary school students), which, when coded using a nutrient database, provided
detailed data on foods and nutrients consumed over a typical school day. Students’ heights and
weights were also measured. Finally, parents completed an interview that included collection of
family background characteristics; child characteristics; socioeconomic variables such as parents’
education and employment, household income, and participation in public assistance programs; and
last, the full USDA food security scale (discussed in Section C).
1. Sample Design
The SNDA-III three-stage sample design is representative of all public School Food Authorities
(SFAs) participating in the NSLP in SY 2004-2005, schools in those SFAs, and students in grades 1-
12 in those schools. Sample sizes were chosen based on the ability to detect statistically significant

Children’s Food Security and School Meals Mathematica Policy Research
10
differences in nutrient intakes between school meal participants and nonparticipants. To achieve the
desired level of precision for student estimates, we selected sampled SFAs and schools with
probability proportional to size, that is, we assigned SFAs and schools a higher probability of
selection if they had a higher student enrollment. In general, within each SFA, we selected one
elementary school, one middle school, and one high school. (In districts without all three levels, we
selected three schools from the levels available.) Students were randomly sampled within schools.
SFAs, schools, or students who declined to participate in the data collection were replaced by
randomly chosen substitutes.
In the end, 130 SFAs participated in the study, and we collected school-level data from 398
schools in these SFAs. Student-level data were collected on site in a random subset of 287 schools in
94 SFAs. About 8 students per school both completed a 24-hour dietary recall themselves and had a
parent complete an interview on child and family background characteristics; 2,314 students were
included in the SNDA-III analysis sample.
2. Data Collection on School Breakfast and Lunch Menus
School foodservice managers completed surveys of their menus for one school week—generally
five days. Most schools provided both breakfast and lunch menus, but schools that did not offer the
SBP provided only lunch menus; one school provided only breakfast menus; 397 schools completed
the menu survey for lunch, 331 for breakfast. The menu survey included a set of forms for each
meal (if applicable) for each day of the school week. The main forms asked foodservice managers to
write down every food offered for lunch (or breakfast) on the specific weekday, described in as
much detail as possible. To make this task easier, the forms pre-listed many common foods.
Manufacturers’ and product codes were requested when available. The foodservice managers were
also asked to provide the portion size for each food, as well as the number of servings selected as
part of a reimbursable meal. Special forms were used to record recipes for foods prepared on site, as

Children’s Food Security and School Meals Mathematica Policy Research
11
well as to list the offerings on self-serve salad bars or other food bars. In addition, foodservice
managers provided information on the numbers of reimbursable breakfasts and lunches served each
day, as well as the types of milk offered. To assist with the large number of forms and reduce
burden, each school foodservice manager received regular calls from specially trained technical
assistants who could answer questions and provide encouragement. These assistants also called the
respondents back if key information was missing or unclear.
3. Data Collection from Students and Parents
The focal point of the student interview was an in-person 24-hour dietary recall. Interviewers
used the Automated Multiple Pass Method (AMPM) software (Version 2.3, 2003, Agricultural
Research Service, Food Surveys Research Group, Beltsville, MD) on laptop computers. Elementary
school children were interviewed in school about foods eaten since they woke up on the interview
day, and were interviewed with a parent assisting on the next day (or within 48 hours) about what
they ate over the rest of the target day. Older children were interviewed about what they had eaten
from midnight to midnight on the day before the interview. All recalls covered school days (and thus
weekdays). Details on intakes of dietary supplements were not collected, but parents were asked
whether their child, and older children were asked whether they themselves, took any supplements.
Interviewers used the USDA two-dimensional food models booklet to help children and parents
describe portion sizes. After the dietary recall interview, field interviewers measured each child’s
height and weight using standardized equipment and procedures. Measures were taken in school, in
a location selected to keep the process private.
Parents of elementary school students were interviewed in person after they helped their child
complete the dietary recall; parents of older students were interviewed by telephone. About a week
after their initial interview, a randomly selected 29 percent of students who completed a recall also

Children’s Food Security and School Meals Mathematica Policy Research
12
completed a second 24-hour recall, which was used to estimate the distribution of usual nutrient
intakes.
Field interviewers were generally experienced in working with children and/or in collecting
dietary intake data. The interviewers received extensive training over an 8- to 11-day period in a
central location, including about 5 days of training in the use of AMPM to conduct dietary recalls
with children.
B. Dietary and Participation Measures
The key outcomes for this study are (1) school-day intakes of nutrients and other dietary
components; and (2) intakes of serving equivalents of the MyPyramid food groups at breakfast, at
lunch, and over 24 hours. As described in Chapter IV, the mean differences in these dietary
outcomes across food security groups, for both the full sample and school meal participants, are the
focus of this report.1 This section explains (1) how nutrient intakes and MyPyramid Equivalents
(MPEs) were estimated for each food in the dietary recall file, (2) how foods were classified as
breakfast or lunch foods and how foods were designated as “on menu,” and (3) how students were
classified as SBP or NSLP participants or nonparticipants. These classifications and estimations are
all based on Gordon et al. (2007a, 2007b) except for the MPEs, which are from the work of Fox et
al. (forthcoming).
1. Food and Nutrient Coding
Analysts with strong nutrition backgrounds food- and nutrient-coded dietary recall interviews
with the USDA Agricultural Research Service (ARS) SurveyNet software, which draws on USDA’s
Food and Nutrient Database for Dietary Studies (FNDDS). They also used SurveyNet to do food
and nutrient coding of the five days of school menu data collected from foodservice directors. ARS
1 Chapter V is an exception: to address the third research question, it looks exclusively at “on menu” foods eaten
by NSLP participants.

Children’s Food Security and School Meals Mathematica Policy Research
13
staff developed nutrient profiles for 100 common commercially prepared foods that were developed
specifically for school meals (and thus were not in the FNDDS). SNDA-III staff used data for these
100 foods to impute nutrients for less-common but similar commercially prepared foods that did
not match to FNDDS. These extra steps ensured that schools received credit for serving pre-
prepared foods that were modified to help schools meet nutrition guidelines (Gordon et al 2007c).
In addition, each food included in the 24-hour dietary recall file was linked to the MyPyramid
Equivalents Database (MPED) (Version 1.0 for USDA Survey Food Codes, 2006), also developed
by ARS. The MPED provides, for all foods in the USDA nutrient database, the number of
equivalents (cups, ounces, grams, teaspoons) in 100 grams of a food for 32 MyPyramid food groups
and subgroups (listed in table below). Foods were also linked to the CNPP 01-02 Fruit Database
(USDA Center for Nutrition and Policy Promotion 2007), which includes values for whole fruit and
fruit juice for all MPED foods that contain any amount of fruit or juice.2 MPEs were not coded for
foods in the school menu data, because many more menu data foods did not match to the MPED,
and imputing MPEs for such foods would have required more resources than were available.
2. Definitions of Breakfast, Lunch, and On-Menu Foods
The definitions of lunch and breakfast foods were the same as those used in the SNDA-III
reports (Gordon et al. 2007a, 2007b, 2007c), which in turn were adapted from the time-of-day and
meal-type definitions used by Gleason and Suitor (2001). All foods reported between 5 a.m. and 9:30
a.m. and foods reported between 9:30 a.m. and 10:30 a.m. and called “breakfast” by the student
were counted as breakfast foods. A small number of breakfasts from earlier in the day (before 5
a.m.) and later in the day (after 10:30 a.m.) were clearly the first meals consumed after waking up
2 Detailed documentation on these databases is available at [www.ars.usda.gov/Services/docs.htm?docid=17562]
and [www.cnpp.usda.gov/HealthyEatingIndex-2005report.htm].

Children’s Food Security and School Meals Mathematica Policy Research
14
MyPyramid Equivalents Database 1.0: Major Food Groups and Subgroups
Total grain (oz. equivalents) Meat, poultry, fish (oz. equivalents) Whole grain Meat (beef, pork, lamb, game) Non-whole grain/refined grain Organ meat
Total vegetables (cup equivalents) Frankfurters, sausages, luncheon meats Dark-green vegetables Poultry Orange vegetables Fish and shellfish high in omega-3 fatty acids White potatoes Fish and shellfish low in omega-3 fatty acids Other starchy vegetables Eggs (oz. equivalents) Tomatoes Cooked dry beans and peas (oz. equivalents) Other vegetables Soybean products (tofu, meat analogs) (oz. equivalents)
Total fruits (cup equivalents) Nuts and seeds (oz. equivalents) Citrus fruits, melons, and berries Discretionary oil (grams) Other fruits Discretionary solid fat (grams) Whole fruita Added sugars (teaspoon equivalents) Fruit juicea Alcohol (drinks)
Total milk (cup equivalents) Milk Yogurt Cheese
a From CNPP 01-02 Fruit Database.
and these were also counted as breakfast. The following were counted as lunch: (1) all foods
reported between 10 A.M. and 2 P.M. unless reported as breakfast; (2) all foods reported between
9:30 A.M. and 10 A.M. that were reported as lunch, supper, or dinner; and (3) all foods reported
between 2 P.M. and 3:30 P.M. that were reported as lunch.
To help determine whether students ate school breakfasts and lunches, we matched foods
reported by students to the breakfast and lunch menu foods offered in their schools on or around
the recall day. For example, if a child reported having a donut obtained in school for breakfast, and
the school breakfast menu offered donuts as an option, that was one piece of evidence that the child
had eaten a school meal. However, the process of matching recall data and menu data was
challenging. Foods were defined to be “on menu” if the reported food (or a similar food) was found
to be on the menu (1) on the day of the recall, the day before, or the day after; or (2) in the rare
situations where recall and menu survey dates did not overlap, the reported food was on the menu

Children’s Food Security and School Meals Mathematica Policy Research
15
two or more times during the week of the menu survey or there was evidence of a comparable meal
(for example, cold cereals offered every day).3
3. Student Participation in the NSLP and SBP
Students were counted as NSLP participants on the target day if they reported consuming either
(1) a school lunch and at least one item counting toward a reimbursable meal; or (2) food items from
all the food groups required for a reimbursable meal and also found on the school lunch menu. The
SBP participation measure used for the analyses was based on whether the student reported having
consumed at least one breakfast item that was obtained at school and was on the school breakfast
menu. More detail on how these measures were constructed and why they were selected over
possible alternatives, such as self-reports, can be found in Gordon et al. (2007b), Appendix A.
C. Food Security Measures
The USDA food security scales are household measures of access to food over the course of
the past year. The three related scales are meant to measure the degree to which financial constraints
affected the diets of children in the household (the children’s scale), adults in the household (the
adult scale), and the entire household (the household, or full, scale). All three scales are household-
level measures of food security during the past 12 months. None of them is meant to measure the
food security status of a particular individual.4 For reasons explained below, this report uses the
adult scale to identify food-insecure and marginally secure households.
The 18 items on the full scale are (1) yes/no questions such as “In the last 12 months, did you
ever eat less than you felt you should because there wasn’t enough money for food?”; (2) a follow-
3 Items from other days were accepted as matches because many schools served certain items every day, and
because they sometimes served leftovers or ran out of food and served items that had been planned for later in the week.
4 The NHANES has collected an individual-level measure of food security for several years (Nord and Hopwood 2007), but this was not used in SNDA-III.
Children’s Food Security and School Meals Mathematica Policy Research
16
up question about how many months a year such a thing happened5; or (3) statements such as “We
couldn’t afford to eat balanced meals,” to which respondents are asked to say whether it was often,
sometimes, or never true in the past 12 months. Every item on the scale specifies a lack of money as
the reason for the condition reported. Responses of yes, more than two months a year, “often,” or
“sometimes” are coded as affirmative answers.6 Table II.1 lists (in abbreviated form) the 18 items
and the percentage of parents responding affirmatively to each item (see the “Total” column in
Table II.1), as estimated using weighted SNDA-III data.
The household scale is based on all 18 items if there are children 18 and under in the
household. For households without children, the household scale is the same as the adult scale (the
8 child-focused questions are omitted). The adult scale is based on 10 questions, including those that
ask about the household overall (3 questions), the experiences of the adult respondent (3 questions),
and the experiences of all adults in the household (4 questions). The child scale is based on the 8
questions that ask the respondent about the experiences of all children 18 and under in the
household, as shown in Table II.1.
Both the household scale and the child scale are known to be sensitive to the age of the oldest
child in the household (Nord and Bickel 2002). Typically, younger children are shielded from
household food shortages, while teenagers have experiences more similar to those of adults. Hence,
household food shortages are more likely to be reported as having affected a child in the household
5 Three of the yes/no questions were followed up on (in the event of a “yes” response) with questions about how
many months a year something happened: (1) Did you or other adults in the household ever cut the size of your meals or skip meals because there wasn’t enough money for food? (2) Did you or other adults in your household ever not eat for a whole day because there wasn’t enough money for food? (3) Did any of the children ever skip a meal because there wasn’t enough money for food?
6 Therefore, households may have experienced these conditions (such as worrying whether their food would run out, not being able to eat balanced meals, or skipping meals) at only some points during the past year.

17
Table II.1 Percentage Responding Affirmatively to Each Food Security Item, by the Number of Affirmative Answers on the Adult Scale
Number of Affirmative Responses on Adult Scale
High Marginal Low Very low
Food Security Items 0 1 2 3 4-5 6-7 8-10 Total
HOUSEHOLD
Worried food would run out 0.0 59.6 93.8 94.3 95.1 100.0 100.0 20.6
Food bought just didn't last 0.0 10.6 69.0 86.6 87.9 95.1 96.0 15.6
Couldn't afford balanced meals 0.0 29.3 28.1 89.0 79.9 90.3 98.9 14.7
ADULTS
Cut size of meals or skipped 0.0 0.5 4.6 8.3 54.9 94.1 100.0 6.8
3 or more months a year 0.0 0.0 0.7 2.3 19.7 54.8 88.6 3.7
Ate less because not enough $ 0.0 0.0 3.8 18.0 69.1 100.0 100.0 7.9
Hungry because not enough $ 0.0 0.0 0.0 0.8 18.2 73.6 95.6 4.2
Lost weight because not enough $ 0.0 0.0 0.0 0.8 2.9 25.2 86.7 2.2
Didn't eat for whole day 0.0 0.0 0.0 0.0 3.0 13.0 65.3 1.5
3 or more months a year 0.0 0.0 0.0 0.0 0.0 3.6 47.2 0.9
CHILDREN (aged 0-18)a
Relied on few kinds of low-cost food 1.5 24.8 61.8 74.0 81.1 90.1 85.5 16.1
Couldn't eat balanced meals 0.5 14.0 26.4 62.2 64.2 79.0 88.0 11.5
Not eating enough because not enough $ 0.2 0.3 9.7 27.4 40.1 47.1 76.7 6.0
Cut size of meals because not enough $ 0.0 0.0 0.0 4.5 14.9 34.2 35.5 2.2
Hungry because not enough $ 0.0 0.0 0.0 0.3 7.4 20.8 31.5 1.3
Skipped meal because not enough $ 0.0 0.0 0.0 0.9 5.8 9.0 20.1 0.8
3 or more months a year 0.0 0.0 0.0 0.0 3.6 5.3 14.4 0.5
Didn't eat for a whole day 0.0 0.0 0.0 1.8 0.4 4.3 2.3 0.3
Sample Size 1,638 163 121 123 110 70 45 2,270
Percentage of Total Sample (Row %) 76.12
6.12 4.58
5.10 3.98
2.45 1.66
100.0
Source: SNDA-III Parent Interviews, school year 2004-2005. Tabulations are weighted to be nationally representative of students in public NSLP
schools. The Adult Food Security Scale is based on the three household items and the seven adult items.
a
Sample size is 2,202 for households with children 0 to 18.

Children’s Food Security and School Meals Mathematica Policy Research, Inc.
18
if at least one child is a teenager. Therefore, in any analysis using the household food security scale,
it is important to control for the age of the oldest child. Since the SNDA-III parent survey did not
include a full household roster and specifically did not ask the age of each member, the age of the
oldest child in the household is not known (except in households with only one child).7 Lacking this
information, we cannot distinguish households with lower levels of food security than average for
children of a given age from households that have lower levels of food security because they include
older children. Therefore, we conduct our analysis using the adult scale so that we have a consistent
measure across different types of households.
The adult scale is grouped into four categories: (1) high food security for those with zero
affirmative answers, (2) marginal food security for those with 1 or 2 affirmative answers, (3) low
food security for those with 3 to 5 affirmative answers, and (4) very low food security for those with
6 or more affirmative answers. On the USDA adult and household food security scales, marginally
and highly food-secure households are both classified as food secure. In this study, we report on
each group separately because of research suggesting that marginal food security is associated with
lower academic performance and worse health outcomes, and that families with this status are more
similar to low- than to high-food-security families (Children’s HealthWatch 2009; Jyoti et al. 2005;
Winicki and Jemison 2003). Furthermore, less is known about the marginally secure group, as they
are typically pooled with the much larger group of children from high-food-security households.
In light of these issues, this report presents results—using the adult scale throughout—for both
students from food-insecure households (low or very low food security) and students from
marginally secure households. The food-insecure group combines the low and very low groups
because of the small sample size for the very low group when taken separately—115 students in the
7 The number of children in the household is asked, but not their ages. Only the age of the sampled child is known.
Children’s Food Security and School Meals Mathematica Policy Research, Inc.
19
SNDA-III sample (versus 348 combining the low and very low groups). The marginally food-secure
group includes 284 students. The comparison group is 1,638 students from households with a high
level of food security, whom we refer to as highly food-secure students. The total sample size of
students with a known food security status is 2,270.
Table II.2 shows the relationships between our indicator variables for food insecurity and
marginal food security—both based on the adult scale—and the detailed adult, household, and child
scales.8 In general, the different food security measures tend to classify households similarly. There is
a lot of overlap across the three scales (as expected given the overlap in questions included on each
scale). Nevertheless, there are some important differences. For example, 28 percent of households
with children that were food insecure on the adult scale would have been classified as having food
security among children (Table II.2, column 1) which is consistent with earlier research findings9 that
adults usually shield children from the effects of the household’s food insecurity if possible.10
Other differences across the scales highlight the desirability of looking at the marginally food-
secure group separately from the highly secure one. Thirty-four percent of the marginally secure
households on the adult scale would have been classified as having low food security on the
8 The response patterns for the SNDA-III data were assessed by Dr. Mark Nord of the USDA Economic Research
Service, a leading authority on the measurement of food security, using conditional maximum likelihood estimation based on the Rasch Model. Since Dr. Nord recommended that we use the adult scale, we report on his assessment of that scale in particular. The overall model fit and the item discrimination were good, which means that respondents appeared to be giving thoughtful responses in general. Item severities, the likelihood of a positive response given responses to other food security questions, were very similar to the CPS, with the exception of the items about adults cutting and skipping meals, which were less likely to be reported in the SNDA-III data (given answers to the other food security items). The differences were not large and, according to Dr. Nord, result in only a slight downward bias in the prevalence of very low food security in the data. His conclusion was that we should “use the adult food security classification with confidence” (email from Mark Nord to Liz Potamites on January 2, 2009).
9 Nord and Bickel (2002), Nord (2003), and Nord (2009).
10 Note, however, that the child scale does not include a separate category for marginal food security among children; households with one affirmative response to any of the eight children questions are classified as secure. Table II.1 shows that many of the households in the low-food-security group on the adult scale did answer at least one question on the child scale positively.

Children’s Food Security and School Meals Mathematica Policy Research, Inc.
20
Table II.2 Adult Food Security Is Closely Related to Other Food Security Measures
Adult Food
Insecurity
Adult
Marginal
Adult High
Security Total
Food Security Status, Adult
High Security (0)a
0.0 0.0 100 76.1
Marginal Security (1-2) 0.0 100 0.0 10.7
Low Security (3-5) 68.9 0.0 0.0 9.1
Very Low Security (6-10) 31.1 0.0 0.0 4.1
Food Security Status, Household b
High Security (0) 0.0 0.0 98.3 74.8
Marginal Security (1-2) 0.0 66.2 1.6 8.3
Low Security (3-7) 63.2 33.8 0.1 12.0
Very Low Security (8-18) 36.8 0.0 0.0 4.9
Food Security Status, Child
(n=2202, households with children)
Secure (0-1) 28.0 83.9 99.5 88.4
Low Security (2-4) 63.9 16.1 0.5 10.6
Very Low Security (5-8) 8.1 0.0 0.0 1.1
Sample Size 348 284 1,638 2,270
Source: SNDA-III Parent Interviews, school year 2004-2005. Tabulations are weighted to be nationally
representative of students in public NSLP schools.
a
Numbers in parentheses refer to the number of affirmative responses for each level on the food security
scale.
b
The household measure for households with no children is the same as for the adult scale. The number
of affirmative answers given in the parentheses is for households with children.
household scale (Table II.2, column 2),11 whereas 98 percent of the highly food secure on the adult
scale also had high security on the household scale. If the child scale had been used, all but 0.5
percent of the highly food secure with children would have been secure on the child scale as well
(Table II.2, column 3), whereas 16 percent of adult marginally secure households with children
would have been classified as insecure. These statistics further support the decision to look at the
marginally secure group separately from the highly secure one, as the former appears to be more
disadvantaged.
11 This is because, as Table II.1 shows, many of the marginally secure households answered two questions
affirmatively on the adult scale, and many of those also answered at least one of the child questions affirmatively. Therefore, they would have had at least three affirmative answers total and thus would have been considered to have low security on the household scale.

Children’s Food Security and School Meals Mathematica Policy Research, Inc.
21
D. Analysis Methods and Issues
As noted, SFAs and schools were not selected with equal probability. Thus, to make statements
about SFAs, schools, or students nationally, we reweighted the sample so that all SFAs, schools, or
students in the population, as applicable, were equally represented. (The basic sampling weight at
each level is the inverse of the probability of selection, as this makes the weighted probability of
selection for each SFA, school, or student equal to one.) In addition, SFA-, school-, and student-
level data were all weighted to adjust for nonresponse. Full details on the sampling and weighting
procedures are in Gordon et al. (2007c).
Much of the analysis involves tabulations of means and frequency distributions. Taylor series
linearization methods available in SUDAAN (Release 10, 2008, Research Triangle Institute,
Research Triangle Park, NC) were used to estimate standard errors adjusted for the complex sample
design. In addition, SUDAAN was used to conduct chi-squared tests for differences in categorical
variables by food security status as well as t-tests for differences in mean. SUDAAN was also used
to adjust the standard errors of coefficient estimates from regression analyses for clustering at the
level of the primary sampling unit, which in most cases was the local SFA. Analyses used a minimum
95 percent level of confidence for statistical significance (P<0.05).
Both weighted unadjusted means and regression-adjusted means were calculated for all dietary
outcomes presented in Chapter IV. The unadjusted means give a representative picture of the
average experiences of students from families with various levels of food security. The regression-
adjusted estimates allow us to examine the extent to which controlling for other differences between
food security groups reduces the raw differences observed. Thus, the adjustment allows us to isolate
the relationship between food security and dietary intakes, since there are many observable
differences in factors such as age, gender, and household income across the three food security
groups. Differences in the regression-adjusted means represent differences among students with

Children’s Food Security and School Meals Mathematica Policy Research, Inc.
22
other characteristics held constant. Since there may still be important unobserved differences
between less-food-secure and highly food-secure students not accounted for in the regression
adjustment, differences between the two groups still do not represent causal effects of food security
status. Nonetheless, the regression adjustment accounts for some of the differences between the
three groups. Details on the regression adjustment are in Appendix A.
Dietary outcomes, whether regression adjusted or not, have to be interpreted with particular
care because, unlike outcomes in many program evaluations, desired changes in foods and nutrients
consumed are not in the same direction for each child. For some children, consuming more calories
than average could be a positive finding, while for many others, it would be cause for concern.
Furthermore, differences in mean amounts of nutrients are not always substantively meaningful
(even if statistically significant), as the levels of many nutrients are “acceptable” over a wide range.
Policy concerns in the nutrition area generally focus on the tails of nutrient intake distributions—
that is, on avoiding both inadequate and excessive intakes.
Since we are focusing on children from families with adult food insecurity, the prevalence of
inadequate intakes among the children is naturally of interest. However, more than one day of
intakes is needed to identify inadequacies in usual intakes, since people’s intakes during one day are
quite variable.12 Since the focus of this study is on the role of school meals in the diets of children
from less-food-secure households, comparisons of mean outcomes are relevant, as they provide a
12 For most nutrients, methods have been developed to use a second 24-hour intake from a random subsample of
the population to estimate the distribution of usual intakes, to separate within- (day-to-day) and between-person variability in intake (Nusser et al. 1996). To take advantage of these methods, SNDA-III collected a second-day dietary recall data on a subsample. Usual nutrient intake distributions can thus be estimated for the full sample and large subgroups. Since 94 food-insecure students and 92 marginally secure students have a second day of dietary intake data, the Nusser et al. approach could potentially be used to assess usual nutrient intakes for these populations. However, usual food intakes cannot be estimated because there are many more zero observations for foods consumed compared to nutrients. Furthermore, the usual intakes are estimates for populations, not for individuals, so the regression approach cannot be used to control for observable differences between the food-secure and food-insecure groups.

Children’s Food Security and School Meals Mathematica Policy Research, Inc.
23
general sense of whether these children consume different amounts of key nutrients, energy, and
other dietary components such as fiber and cholesterol, as well as different amounts of
underconsumed foods such as fruits and vegetables. Even more, examining intakes from school
meals as a percentage of daily intakes provides a measure of the importance of the school meals in
the diets of less-food-secure children.


Children’s Food Security and School Meals Mathematica Policy Research
25
III. CHARACTERISTICS OF FOOD-INSECURE AND MARGINALLY SECURE
STUDENTS
To provide context for the analysis of the main research questions, this chapter presents
descriptive background information on food-insecure and marginally secure students and their
families, and contrasts them to highly food-secure students and families. Before we consider the
dietary outcomes, which are the focus of our research questions, we describe how similar or
different the food-insecure, the marginally secure, and the highly secure students were. Our
description of the various food security groups is of interest in its own right, especially for the
marginally food-secure students, who have been studied less often. There are six comparisons that
the tables in this chapter detail. The first three comparisons are between the highly food-secure
students, the food-insecure students, and the marginally secure students. The next three examine the
same three groups but use a subsample restricted to NSLP participants in each group. Participants
are those most directly affected by the program, and the dietary intakes of NSLP participants will be
presented separately in Chapter IV to provide in-depth answers to our research questions.
To assess these comparisons, we ran six independent chi-squared tests per categorical row
variable for tables III.1 through III.4. These are not to be interpreted as tests for causal
relationships; they are simply a measure of whether there were, between each pair of groups,
differences not likely to have occurred by chance.
A. Student and Household Characteristics
As expected, students lived in households whose food security status (on the adult scale) was
closely related to their income and program participation. Household income (relative to the poverty
line) was highly correlated with food security: 72 percent of food-insecure students (and 60 percent
of marginally secure students) were from households with incomes below 130 percent of the poverty
line, compared to 19 percent of highly food-secure students (Table III.1). Participation in the school

26
Table III.1 Household Income and Program Participation, by Food Security Status
All Students NSLP Participants
Insecure Marginal High Total Insecure Marginal High
Total
Household Income as a % of Poverty β γ β γ
0-130 71.8 60.3 18.5 30.0 70.5 60.6 23.5 36.2
131-185 18.0 24.5 8.6 11.6 20.0 24.5 10.9 14.2
186-300 4.8 10.2 21.5 18.1 3.8 10.6 21.3 17.0
301-400 1.5 2.2 19.2 15.0 0.7 1.1 16.9 12.1
Greater than 400 3.9 2.8 32.3 25.4 5.1 3.2 27.4 20.5
Applied for Free/Reduced Price
Lunch 92.6α 83.6
β 32.5
γ 45.9 94.4
α 87.1
β 41.4
γ 56.3
Eats School Lunch 1+ times/week a
93.4 90.3β 84.5
γ 86.3 99.6 97.6 99.3 99.1
Eats School Lunch 3+ times/week a
85.5 80.1β 68.3
γ 71.9 96.3 91.9 91.7
γ 92.5
NSLP Participant (on recall day) 75.8 78.3β 56.7
γ 61.5 100.0 100.0 100.0 100.0
Usually Eats Breakfast
Sometimes 14.5 16.2 11.4 12.4 10.4 13.7 9.1 10.0
Yes 74.3 73.9 80.2 78.6 78.5 77.3 83.1 81.4
No 11.2 9.9 8.4 9.0 11.1 9.0 7.8 8.6
Eats School Breakfast
1+ times/week a, b
80.4α 67.9
β 44.9
γ 52.8 84.8
α 74.8
β 57.2
γ 64.7
Eats School Breakfast
3+ times/week a, b
48.9α 40.2
β 25.2
γ 30.5 57.9
α 46.5
β 36.2
γ 41.6
SBP Participant (on recall day)b
36.7α 25.9
β 17.1
γ 21.0 43.2
α 31.0 25.4
γ 29.4
Sample Size 348 284 1,638 2,270 249 197 914 1,360
Households with Income to Poverty Line Ratios 185% or below
Family Receives Food Stamps 46.0α 32.3 24.1
γ 32.2 46.6 32.5 26.2
γ 33.6
Any Emergency Food Past 30 Daysc
18.7α 2.1 3.4
γ 7.5 20.6
α 2.4 4.1
γ 8.5
Family Receives WIC Benefitsd
22.4 16.3 14.6γ 17.2 23.2 16.9 16.5 18.5
Receives TANF/Other Cash Welfare 17.7 12.1 10.1γ 12.7 17.8 12.1 12.0 13.7
Receives Medicaid or SCHIP 58.8 53.4 47.1γ 51.8 62.3 55.9 50.5
γ 55.1
Sample Size 308 229 444 981 218 160 310 688

Table III.1 (continued)
27
Source: SNDA-III Parent Interviews, school year 2004-2005. Tabulations are weighted to be nationally representative of students in public
NSLP schools.
Note: The insecure, marginal, and high columns refer to the food security status of a student's household as measured by the adult
scale. NSLP participation refers to participation on the recall day.
α, β, and γ represent the results from individual χ2 tests for categorical variables:
α Difference between the insecure and the marginal group is significant at the .05 level.
β Difference between the marginal and the high security group is significant at the .05 level.
γ Difference between the high security and the insecure group is significant at the .05 level.
aBased on child’s response if available about usual breakfast or lunch participation. If not available, then filled in with parent’s response.
bRestricted to students at schools that serve breakfast, n=1970.
cFrom a food pantry, soup kitchen, or shelter.
dWIC is the Special Supplemental Nutrition Program for Women, Infants, and Children.
eSCHIP is the State Children’s Health Insurance Program. Because in some states it is part of Medicaid, the interview asked about them
jointly. The income cutoffs for SCHIP are higher than for Medicaid, and exceed 185 percent of poverty in some states.

Children’s Food Security and School Meals Mathematica Policy Research
28
meal programs and food insecurity were also closely related. Insecure and marginally secure students
were much more likely than highly secure ones to have applied for free or reduced-price lunches (93
percent and 84 percent, respectively, compared to 33 percent of the highly secure). In addition,
larger proportions of the insecure and marginally secure groups than of the highly secure group
reported eating a school lunch one or more times a week. The contrast is also evident when we look
at proportions that reported usually eating school meals three or more times a week (86 percent of
the insecure, 80 percent of the marginally secure, and 68 percent of the highly secure).
Reports by students on whether they usually eat breakfast were not significantly different
among the food security groups, but it is worth noting that the percentages that said they do not eat
breakfast or sometimes eat breakfast increased as food security decreased (see Chapter VI for more
discussion of breakfast skipping). However, less food secure students were significantly more likely
to report eating breakfast at school (both at least once a week and at least three times a week).
The primary measure of participation for either the NSLP or the SBP refers to participation on
the day covered by the child’s 24-hour recall interview, not the self-reported measures of usual
participation, because it covers the same day as the dietary recalls. Food-insecure students and
marginally secure students were more likely to participate in the NSLP (76 percent and 78 percent,
respectively) on the recall day than highly food-secure students (57 percent).1 The food-insecure
students were also more likely than the marginally and highly food-secure students to have eaten a
school breakfast. Nonetheless, only 37 percent of the food-insecure students in schools that served
breakfast participated in the SBP on the recall day.
1 If it seems somewhat surprising that 24 percent of children from food-insecure households did not participate in
the NSLP, recall that food security is a measure of household access to food over the past 12 months, while our measure of participation is for one particular day.

Children’s Food Security and School Meals Mathematica Policy Research
29
Among students from households at or below 185 percent of the poverty level, the households
of food-insecure students were more likely than those of marginally and highly food-secure students
to be receiving food stamps or emergency food (from a food pantry, soup kitchen, or shelter). Again
looking only at lower-income households, food-insecure households were more likely than highly
food-secure ones to be receiving WIC benefits (see lower panel of Table III.1).2,3 Other researchers
have also found that food-insecure households are more likely than low-income families who are
food secure to participate in food assistance programs (Briefel et al. 2003).
The food-insecure and marginally secure students differed from the highly secure in terms not
only of income and program participation, but also of basic demographic characteristics, and on the
whole tended to be more disadvantaged. They were on average slightly, but not significantly, older
than the highly secure students (Table III.2). The marginally secure students were disproportionately
female (the insecure, disproportionately male). Both the marginally secure and the insecure were less
likely to be non-Hispanic white and more likely to be non-Hispanic black or Hispanic. They were
also more likely than the highly food secure to speak Spanish at home. Both insecure and marginally
secure students were more likely than highly secure students to be from households with only one
adult. Their parents were less educated and worked fewer hours. Lower levels of food security were
also associated with more children under 18 in the household.
2 WIC is the Special Supplemental Nutrition Program for Women, Infants, and Children. It is available only to
pregnant and postpartum women and children less than five years old, so the differences in participation can reflect differences in household composition as well as overall interest in or need for assistance.
3 Results regarding participation in public assistance and emergency food programs are based on a sample restricted to households with incomes at or below 185 percent of the poverty line, in order to compare participation rates across households that are likely to be eligible. Furthermore, families with incomes above 200 percent of the poverty level were not supposed to be asked the questions about food stamps, WIC benefits, TANF or other cash welfare, or Medicaid/SCHIP. Compliance with this was not perfect, and some families above 200 percent did respond, but because the sample was limited to those under 185 percent of the poverty level, the statistics reported in Table III.1 are unaffected by this inconsistency.

30
Table III.2 Demographics by Food Security and NSLP Participation
All Students NSLP Participants
Insecure Marginal High Total Insecure Marginal High
Total
Age (years)
5-8 18.6 21.5 24.4 23.3 23.1 24.9 29.2 27.6
9-10 15.5 15.8 18.9 18.1 17.8 19.9 21.5 20.7
11-13 26.3 26.5 22.7 23.6 27.6 26.0 25.0 25.5
14-19 39.6 36.2 34.0 35.0 31.4 29.2 24.4 26.2
Average Age 12.2 11.9 11.6 11.7 11.6 11.3 10.9γ
11.1
Sex α β
Male 54.1 42.5 50.0 49.8 55.5 43.7 54.0 52.9
Female 45.9 57.5 50.0 50.2 44.5 56.3 46.0 47.1
Race/Ethnicity β γ β γ
Hispanic 42.5 34.3 17.2 22.4 41.9 35.3 18.6 24.7
White, non-Hispanic 28.3 38.4 61.3 54.5 30.7 37.6 57.5 50.5
Black, non-Hispanic 22.3 24.0 14.4 16.5 20.5 24.4 17.2 18.7
Other 6.9 3.2 7.0 6.6 6.9 2.7 6.6 6.1
Language Spoken at Home β γ β γ
Spanish 27.2 15.6 6.4 10.1 28.0 16.4 7.9 12.3
Other than Spanish or English 5.1 5.9 2.9 3.5 4.5 5.0 2.7 3.3
Number of Adults in
Household β γ β γ
1 30.9 24.1 13.1 16.6 31.5 24.0 15.7 19.4
2 46.4 53.8 65.0 61.3 47.0 54.8 63.5 59.6
3 15.7 16.5 17.3 17.0 16.3 15.7 15.8 15.9
4 or more 7.0 5.7 4.7 5.1 5.2 5.5 4.9 5.1
Number of Children Under 18
in Household β γ β γ
0 2.0 1.7 2.6 2.4 1.6 1.7 1.7 1.7
1 15.5 14.7 26.5 23.8 13.6 13.7 26.6 22.8
2 26.1 33.6 40.6 38.0 25.3 30.2 38.8 35.4
3 31.4 28.1 18.7 21.4 32.3 30.6 19.8 23.3
4 or more 25.0 21.9 11.7 14.5 27.1 23.8 13.1 16.9

Table III.2 (continued)
31
All Students NSLP Participants
Insecure Marginal High Total Insecure Marginal High
Total
Parent’s Highest Education
Level α β γ α β γ
Less than HS 32.0 18.4 6.4 11.1 33.5 17.0 8.1 13.5
High School/GED 30.1 40.7 20.8 24.1 31.4 40.1 24.5 27.8
Some postsecondary 31.6 28.3 37.3 35.5 31.3 30.6 38.6 36.3
College Grad 6.4 12.7 35.6 29.3 3.7 12.3 28.7 22.4
Parent’s Hours Worked per
Week β γ γ
0 30.1 31.1 23.0 24.8 31.4 30.8 22.4 25.0
1-20 18.8 16.3 11.5 13.0 18.3 15.6 10.9 12.7
21-35 10.4 10.7 15.3 14.2 11.7 10.6 14.6 13.6
36-40 26.0 28.0 29.2 28.6 23.8 29.0 29.2 28.3
More than 40 14.6 13.8 21.0 19.4 14.8 13.9 22.9 20.3
Sample Size 348 284 1,638 2,270 249 197 914 1,360
Source: SNDA-III Parent Interviews, school year 2004-2005. Tabulations are weighted to be nationally representative of students in
public NSLP schools.
Note: The insecure, marginal, and high columns refer to the food security status of a student's household as measured by the
adult scale. NSLP participation refers to participation on the recall day.
α, β, and γ represent the results from individual χ2
tests for categorical variables:
α
Difference between the insecure and the marginal group is significant at the .05 level.
β
Difference between the marginal and the high security group is significant at the .05 level.
γ
Difference between the high security and the insecure group is significant at the .05 level.
Differences in the average age were tested using independent two-tailed t-tests.

Children’s Food Security and School Meals Mathematica Policy Research
32
B. Student Health, Physical Activity, and Eating Habits
Marginally food-secure and food-insecure students were more likely than highly food-secure
students to be overweight or obese (at or above the 95th percentile for Body Mass Index), less likely
to participate in community sports, and less likely to be reported as in excellent health by their
parents (Table III.3). There was also a significant difference between the insecure and the highly
secure in the nights per week that their families eat together (measured only among students aged 12
or older). While 34 percent of both groups reported eating together 7 nights a week, 16 percent of
the highly secure reported eating dinner with their families 5 to 6 nights a week, compared to 8
percent of the insecure. On the other end of the scale, 26 percent of the highly secure reported
eating 0 to 2 dinners a week with their families, compared to 36 percent of the insecure.
Food-insecure students were more likely than highly secure ones to be considered very or
somewhat picky eaters by their parents, but both groups had similar eating habits related to fat
consumption (Table III.3). The marginally secure were more likely than the highly secure to be very
picky, but their overall pickiness (the total of very and somewhat picky) was similar to that of the
highly secure. Reported eating habits of students at all food security levels, as measured by parent
reports of whether they drink skim milk, eat fried chicken, add fat to potatoes, or have a lot of fat
spread on their bread, were similar across the groups in the sense that the distribution of habits
within each group was very similar, in general. One exception was that highly food-secure students
were more likely than food-insecure students to be served low-fat milk all the time.
C. School Characteristics
Marginally secure and insecure students were disproportionately in secondary schools (versus
elementary schools), because families with older children were more likely than families with
younger children to report adult food insecurity or marginal security (Table III.4). Consistent with
their higher household incomes, highly food-secure students were more likely to attend a school

33
Table III.3 Health, Physical Activity, and Eating Habits, by Food Security and NSLP Participation
All Students NSLP Participants
Insecure Marginal High Total Insecure Marginal High Total
Body Mass Index (BMI) β γ β γ
< 5th percentile 3.3 5.8 6.4 5.9 3.6 6.7 5.0 5.0
≥5th percentile & <85th percentile 52.3 49.6 58.1 56.4 51.3 49.6 59.4 56.8
≥85th percentile & <95th percentile 13.8 15.7 16.4 16.0 12.9 15.4 14.8 14.6
≥95th percentile 30.6 28.9 19.1 21.7 32.1 28.3 20.8 23.7
Physical Activities
(Child report, multiple yes’s possiblea)
Taking physical education in school 72.9 76.7 79.5γ
78.3 76.0 80.5 84.1γ 82.3
On a school sports team 20.4 13.4β
25.4 23.4 20.0 12.3β 23.5 21.4
Participate in community sports 37.9 39.2β 54.0
γ 50.3 38.7 40.1
β 54.1
γ 49.6
Walks or bikes to school 22.9 23.4 19.1 20.1 22.1 23.2 17.8 19.2
Physically active outside of school 91.2 92.4 94.6 93.8 96.4 94.1 94.7 95.0
Child’s General Health β γ β γ
Excellent 37.6 40.4 53.4 49.9 37.9 41.5 52.0 48.3
Very good 32.1 29.9 33.1 32.6 33.8 32.5 33.2 33.2
Good 20.0 21.2 10.9 13.2 18.5 16.4 11.9 13.6
Fair 9.3 8.2 2.1 3.7 8.6 9.4 2.3 4.3
Poor 0.9 0.2 0.5 0.6 1.2 0.2 0.7 0.7
Nights per Week Family Eats Dinner
Together
(Child report, age 12 & up only, n=1,544) γ
Every Night 34.4 38.2 34.1 34.7 34.7 38.5 35.6 35.8
5 or 6 7.5 9.5 15.6 13.7 7.8 6.3 14.7 12.1
3 or 4 22.0 24.9 24.6 24.2 24.0 23.8 26.0 25.3
1 or 2 19.7 14.9 16.8 17.0 20.3 17.2 13.9 15.6
None 16.4 12.5 8.9 10.5 13.2 14.3 9.9 11.2
Amount Child Eats Compared with
Other Children the Same Age
Larger Amount 26.4 24.8 22.1 22.9 23.5 24.2 22.7 23.0
Same Amount 56.2 54.5 63.4 61.5 57.5 54.4 63.0 61.0
Smaller Amount 17.4 20.6 14.6 15.6 19.1 21.4 14.3 16.0
Pickiness α β γ α β γ
Very picky eater 28.2 29.8 19.0 21.4 29.5 27.5 18.8 21.7
Somewhat picky eater 47.4 35.0 45.7 44.8 47.1 33.8 45.5 44.1
Not a picky eater 24.4 35.2 35.3 33.8 23.4 38.8 35.8 34.2
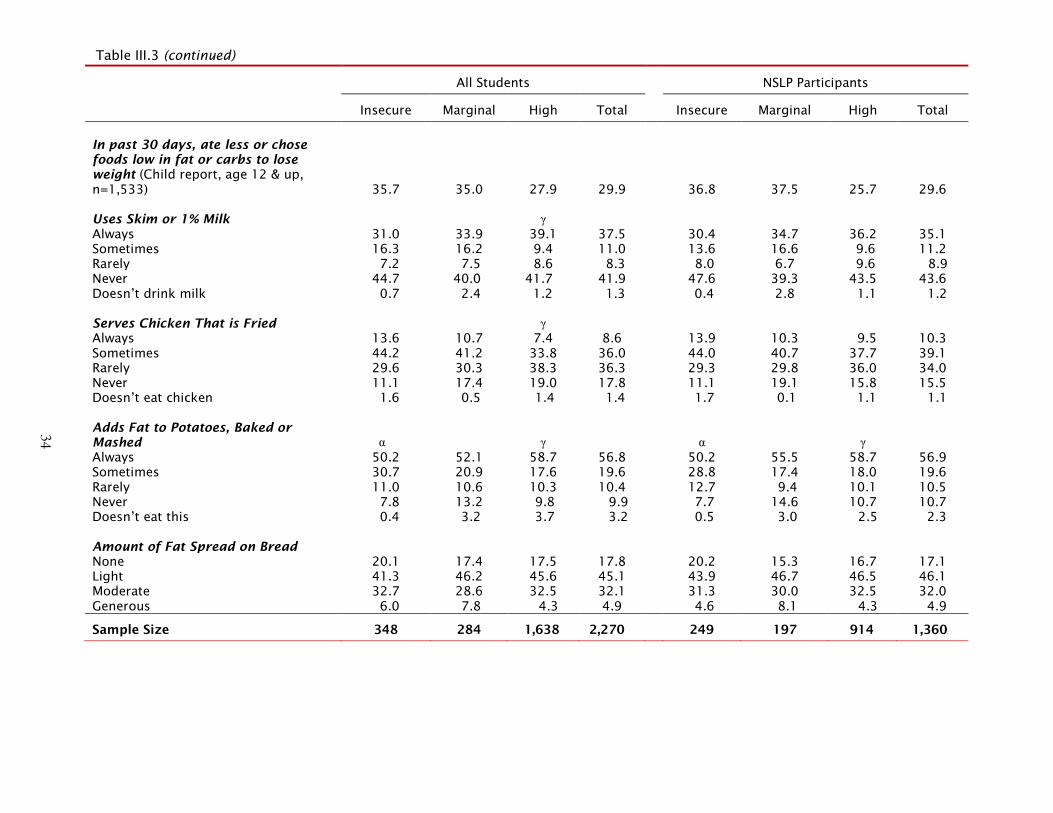
Table III.3 (continued)
34
All Students NSLP Participants
Insecure Marginal High Total Insecure Marginal High Total
In past 30 days, ate less or chose
foods low in fat or carbs to lose
weight (Child report, age 12 & up,
n=1,533) 35.7 35.0 27.9 29.9 36.8 37.5 25.7 29.6
Uses Skim or 1% Milk γ
Always 31.0 33.9 39.1 37.5 30.4 34.7 36.2 35.1
Sometimes 16.3 16.2 9.4 11.0 13.6 16.6 9.6 11.2
Rarely 7.2 7.5 8.6 8.3 8.0 6.7 9.6 8.9
Never 44.7 40.0 41.7 41.9 47.6 39.3 43.5 43.6
Doesn’t drink milk 0.7 2.4 1.2 1.3 0.4 2.8 1.1 1.2
Serves Chicken That is Fried γ
Always 13.6 10.7 7.4 8.6 13.9 10.3 9.5 10.3
Sometimes 44.2 41.2 33.8 36.0 44.0 40.7 37.7 39.1
Rarely 29.6 30.3 38.3 36.3 29.3 29.8 36.0 34.0
Never 11.1 17.4 19.0 17.8 11.1 19.1 15.8 15.5
Doesn’t eat chicken 1.6 0.5 1.4 1.4 1.7 0.1 1.1 1.1
Adds Fat to Potatoes, Baked or
Mashed α γ α γ
Always 50.2 52.1 58.7 56.8 50.2 55.5 58.7 56.9
Sometimes 30.7 20.9 17.6 19.6 28.8 17.4 18.0 19.6
Rarely 11.0 10.6 10.3 10.4 12.7 9.4 10.1 10.5
Never 7.8 13.2 9.8 9.9 7.7 14.6 10.7 10.7
Doesn’t eat this 0.4 3.2 3.7 3.2 0.5 3.0 2.5 2.3
Amount of Fat Spread on Bread
None 20.1 17.4 17.5 17.8 20.2 15.3 16.7 17.1
Light 41.3 46.2 45.6 45.1 43.9 46.7 46.5 46.1
Moderate 32.7 28.6 32.5 32.1 31.3 30.0 32.5 32.0
Generous 6.0 7.8 4.3 4.9 4.6 8.1 4.3 4.9
Sample Size 348 284 1,638 2,270 249 197 914 1,360

Table III.3 (continued)
35
Source: SNDA-III Parent and Child Interviews, school year 2004-2005. Tabulations are weighted to be nationally representative of
students in public NSLP schools. Body Mass Index was calculated by Mathematica based on direct measurement of
student’s height and weight. Other data are from Parent Interview unless otherwise noted.
Note: The insecure, marginal, and high columns refer to the food security status of a student's household as measured by the
adult scale. NSLP participation refers to participation on the recall day.
α,β, and γ represent the results from individual χ2
tests for categorical variables:
α
Difference between the insecure and the marginal group is significant at the .05 level.
β
Difference between the marginal and the high security group is significant at the .05 level.
γ
Difference between the high security and the insecure group is significant at the .05 level.
a
Since multiple yes’s are allowed with respect to a child’s physical activities, chi-squared tests were performed individually for each
activity.

36
Table III.4 Characteristics of Schools Attended, by Food Security and NSLP Participation Status
All Students NSLP Participants
Insecure Marginal High Total Insecure Marginal High
Total
School Type β γ
Elementary 43.7 44.6 52.4 50.4 52.8 53.0 62.0 59.3
Middle 25.2 26.3 18.3 20.0 22.9 24.2 18.2 19.7
High 31.2 29.2 29.3 29.6 24.4 22.9 19.8 21.0
Percentage of Students
Certified for
Free or Reduced Luncha
β γ γ
Low (< 20%) 23.0 30.7 41.8 38.2 21.2 31.7 34.6 32.0
Medium (20-60%) 39.8 41.2 41.2 41.0 38.2 41.8 42.0 41.3
High (60%more) 37.2 28.1 16.9 20.8 40.6 26.5 23.4 26.6
School Participates in SBP 93.3 90.7β 80.6
γ 83.4 95.4 91.3 83.1
γ
86.2
School Size (enrollment) β γ γ
Small 25.4 25.4 28.3 27.6 18.4 20.9 20.9 20.5
Medium 56.5 50.7 39.6 43.0 61.6 51.1 44.1 47.9
Large 18.1 23.9 32.2 29.4 20.0 28.1 35.0 31.6
Metropolitan Status γ
Urban 50.1 42.5 34.8 37.6 46.8 40.5 32.9 36.2
Suburban 28.9 38.9 45.2 42.4 29.9 39.6 42.7 40.2
Rural 20.9 18.5 20.1 20.0 23.3 19.9 24.4 23.6
FNS Region β γ β γ
Mid-Atlantic 7.6 10.8 11.0 10.5 7.4 8.0 11.5 10.4
Midwest 11.3 10.5 18.4 16.6 11.2 10.4 18.6 16.3
Mountain/Plains 2.4 7.4 8.9 7.9 1.6 8.8 8.7 7.6
Northeast 5.4 6.5 9.6 8.7 5.6 5.5 7.7 7.1
Southeast 24.4 25.2 21.8 22.5 26.1 27.9 26.0 26.3
Southwest 25.0 15.0 14.1 15.6 25.4 14.4 14.7 16.4
Western 23.8 24.6 16.2 18.1 22.7 25.0 12.7 16.0
Sample Size 348 284 1,638 2,270 249 197 914 1,360

Table III.4 (continued)
37
Source: SNDA-III Initial Contact Survey, school year 2004-2005. Tabulations are weighted to be nationally representative of students
in public NSLP schools.
Note: The insecure, marginal, and high columns refer to the food security status of a student's household as measured by the
adult scale. NSLP participation refers to participation on the recall day.
α, β, and γ represent the results from individual χ2
tests for categorical variables:
α
Difference between the insecure and the marginal group is significant at the .05 level.
β
Difference between the marginal and the high security group is significant at the .05 level.
γ
Difference between the high security and the insecure group is significant at the .05 level.
a
Based on 2003-04 U.S. Department of Education Common Core of Data.

38
with a low percentage of students (less than 20 percent) certified for free or reduced-price lunch (42
percent for the highly secure compared to 31 percent for the marginally secure and 23 percent for
the insecure). Highly food-secure students were modestly (but significantly) less likely to attend
schools that participate in the SBP. Overall, 83 percent of students attended schools that serve
breakfasts, but 93 percent of insecure and 91 percent of marginally secure students attended such
schools, compared to 81 percent of the highly food secure.
Only 18 percent of food-insecure students attended large schools (more than 1,000 enrolled)
compared to 24 percent of the marginally food-secure and 32 percent of the highly food-secure
students. The latter result is surprising, since food insecurity was reported more frequently by
parents of secondary school students, and secondary schools tend to be larger. From 19 to 21
percent of each group attended schools in rural areas, but 50 percent of the food-insecure students
attended urban schools, compared to 43 percent of the marginally secure and 35 percent of the
highly secure.4 The insecure and marginally secure were more likely than the highly secure to live in
the West and less likely to live in the Midwest. The insecure were also more likely than the
marginally secure and highly secure to live in the Southwest and less likely to live in either the
Mountain/Plains or the Mid-Atlantic region.
4 Geographic region and metropolitan status for each student in SNDA-III is based upon the school’s location.

Children’s Food Security and School Meals Mathematica Policy Research
39
IV. COMPARISONS OF DIETARY INTAKES BY FOOD SECURITY STATUS
This chapter examines the key outcomes for this study: intakes on school days of (1) food
energy, nutrients, and other dietary components such as fiber, and (2) MyPyramid Equivalents
(MPEs) of key food groups. It also examines the proportions of children’ daily intakes of nutrients
and specific food groups from on-menu school foods (that is, foods offered as part of reimbursable
school meals).
1. Research Questions
This chapter addresses two sets of research questions:
1. How do the energy and nutrients consumed by children from food-insecure and marginally food-secure households compare to consumption by highly secure children at breakfast, lunch, and over 24 hours? Do food-insecure and marginally secure children obtain a larger proportion of their nutrients and energy on school days from school meals than highly food-secure children?
2. How do the foods consumed by children from food-insecure and marginally food-secure households compare to consumption by highly secure children at breakfast, lunch, and over 24 hours? Do food-insecure and marginally secure children consume a larger percentage of servings of key food groups (such as milk, fruits, vegetables, and meats) from school meals than highly food-secure children?
A. Approach to Food and Nutrient Analyses
There are three ways in which less-food-secure children could consume (proportionately) more
foods and nutrients from school breakfasts and lunches than highly food-secure children: (1) they
could be more likely to participate in the school meal programs; (2) when they do participate, they
could eat more calories than highly secure participants, since the marginal cost of additional school
meal items is often zero (and, in fact, schools require that children take a certain number of items);
and (3) they could eat less outside school meals than highly secure participants, either in school or
outside school. To help sort out the drivers of any differences, we also compared less-food-secure
school meal participants to highly food-secure participants in each of the data tables. As discussed in the
next two sections, compared to highly secure children, insecure and marginally secure children

Children’s Food Security and School Meals Mathematica Policy Research
40
obtained a higher proportion of their school-day intakes of energy, nutrients, and key food groups
from on-menu foods.
Intakes from key food groups such as milk, fruits, vegetables, and meats are measured by
MPEs, as described in Chapter II. Nutrient intakes are presented in Tables IV.1a through IV.4b, and
MPEs in Tables IV.5a through IV.8b.1 For each set of tables, the discussion examines (1) mean 24-
hour dietary intakes, (2) mean intakes at breakfast, (3) mean intakes at lunch, and (4) proportions
contributed by on-menu school foods to 24-hour intakes.2
For all these outcomes, we compared food-insecure and marginally secure children to highly
food-secure children and present results showing both the unadjusted mean values (Tables IV.1a to
IV.8a) and regression-adjusted means from a multivariate analysis that adjusts for observable
differences between the food security groups, such as age, gender, household income, and
participation in school meals (Tables IV.1b to IV.8b).3 To isolate the relationship between food
security and dietary intakes, the regressions control for differences among the groups other than
food security. Details on the regression adjustments are in Appendix A; they are based on the
regression adjustments used in the SNDA-III study (Gordon et al. 2007b).
The adjusted results are very similar to the unadjusted results for the tables that look at the
mean intakes consumed (compare Tables IV.1a to IV.3a and IV.5a to IV.7a to the b versions of
these tables). However, when considering the proportion of intakes from on-menu school foods, the
results differ (compare Table IV.4a to IV.4b and IV.8a to IV.8b.) Whether or not we control for
school meal participation matters for these results, because participation rates are so much higher
1 Table presentation begins in Section B.
2 Since this report is descriptive, we have not in any way restricted the number of outcome variables, and our reporting on the individual significant differences at the 5 percent level for each comparison is strictly for descriptive purposes.
3 The full list of covariates is shown in Table A.1 in Appendix A.

Children’s Food Security and School Meals Mathematica Policy Research
41
for the insecure and the marginally secure than for the highly secure, and because participants
consume more on-menu school foods than nonparticipants.4
The tables describing breakfast and lunch intakes include only children who reported eating
something during breakfast or lunch. (See Chapter II, Section B.2 for definitions of breakfast and
lunch foods). Thus, the sample sizes are larger for the 24-hour intake tables (IV.1a, b and IV.5 a, b),
since everyone ate something during the 24-hour recall period. An alternative would have been to
include zeros for those children who skipped each meal, but then any differences would be harder to
interpret. Thus, the meal-specific tables focus only on children that ate something at that meal. Meal
skipping and, in particular, breakfast skipping (which is much more prevalent than lunch skipping)
are discussed in Chapter VI.
B. Mean Nutrient Intakes by Food Security Status
1. Intakes over 24 Hours
Over the 24-hour recall period, there were only a few significant differences in nutrient intakes
between highly food-secure and insecure children (Tables IV.1a and IV.1b). Significant differences
at the 5 percent level between these groups are indicated by a γ in the high column (column 4 in the
tables). Significant differences between the insecure and the marginally secure are shown by an α in
the insecure column, and significant differences between the marginally secure and the highly secure
are shown by a β in the marginal column. The entry in the food energy row and high column shows that
the average highly food-secure student consumed 2,121 calories over the course of 24 hours
(Table IV.1a, unadjusted) and that this was not significantly different from what the average insecure
4 As a sensitivity test, we also ran the regression controlling for just a few basic observable characteristics (age,
gender, and height) and not participation. These (unreported) results were very similar to the unadjusted results.

42
Table IV.1a 24-Hour Nutrient Intakes
All Students NSLP Participants
Insecure Marginal High Total Insecure Marginal High Total
Food Energy (kcal) 2,166α 1,945
β 2,121 2,108 2,195
α 1,933
β 2,150 2,129
Macronutrients: Total Amount (g)
Total fat 80.4α 69.7
β 76.3 76.2 81.0
α 69.0
β 77.2 76.8
Saturated fat 27.5α 23.7
β 26.5 26.3 27.9
α 23.5
β 26.9 26.6
Monounsaturated 30.9α 26.8
β 29.4 29.3 30.8
α 26.5
β 29.7 29.4
Polyunsaturated 16.0α 14.0 15.0 15.0 16.3
α 13.9 15.0 15.1
Carbohydrate 285.2α 263.1
β 289.2 285.8 289.5
α 261.8
β 292.6 287.8
Protein 81.6α 70.7
β 75.4
γ 75.8 83.3
α 70.9
β 77.3 77.5
Macronutrients: Percentage of Food Energy from
Total fat 32.2 32.1 31.8 31.9 32.2 32.1 31.8 31.9
Saturated fat 11.1 10.9 11.0 11.0 11.2 11.0 11.1 11.1
Monounsaturated 12.4 12.4 12.3 12.3 12.3 12.4 12.2 12.3
Polyunsaturated 6.3 6.4 6.3 6.3 6.4 6.4 6.2 6.2
Carbohydrate 53.6 54.1 55.0 54.7 53.5 54.0 54.8 54.4
Protein 15.2 14.7 14.4γ 14.6 15.4 14.8 14.5
γ 14.7
Vitamins and Minerals
Vitamin A (mcg RAE) 591.3 544.4β 635.3 621.2 625.8 548.8
β 665.4 644.2
Vitamin C (mg) 91.9 94.5 90.8 91.5 91.4 95.6 89.5 90.9
Vitamin E (mg) 6.7α 5.5
β 6.3 6.2 6.7 5.3
β 6.0 6.0
Vitamin B6 (mg) 1.9α 1.6
β 1.8 1.8 1.9
α 1.6
β 1.8 1.7
Vitamin B12 (mcg) 5.5α 4.8 5.3 5.3 5.7
α 4.7
β 5.3 5.3
Folate (mg DFE) 565.0 528.9β 599.5 586.9 553.6 529.6 585.0 572.0
Calcium (mg) 1,116α 973.6
β 1,101 1,090 1,176
α 1,006
β 1,174 1,151
Iron (mg) 15.9 14.1β 15.6 15.4 15.7
14.1 15.3 15.2
Magnesium (mg) 261.0α 229.2
β 254.0 252.2 269.5
α 230.5
β 257.0 255.2
Phosphorus (mg) 1,434α 1,258
β 1,368 1,366 1,497
α 1,275
β 1,417 1,411
Potassium (mg) 2,597α 2,352
β 2,498 2,498 2,696
α 2,357
β 2,600 2,584
Sodium (mg) 3,499α 3,136
β 3,419 3,400 3,578
α 3,124
β 3,492 3,458
Zinc (mg) 12.2α 10.6
β 11.6 11.6 12.3
α 10.6
β 11.6 11.6
Other Dietary Components
Fiber (g) 14.6α 12.9
β 14.1 14.0 15.1
α 13.2
β 14.3 14.3
Cholesterol (mg) 231.6α 202.9 210.7 213.1 233.5
α 197.0 207.4 211.2
Number of Students 348 284 1,638 2,270 249 197 914 1,360

Table IV.1a (continued)
43
Source: School Nutrition Dietary Assessment-III, 24-Hour Dietary Recalls, school year 2004–2005. Weighted tabulations based on first 24-hour
recall prepared by Mathematica Policy Research. Intakes of both NSLP participants and nonparticipants include all foods and beverages
eaten over 24 hours. For participants, this may include, in addition to foods/beverages obtained as part of the reimbursable meal,
foods/beverages that were obtained in school from non-reimbursable sources and foods/beverages brought from home or consumed
at home.
Note: The insecure, marginal, and high columns refer to the food security status of a student's household as measured on the adult scale.
NSLP participation refers to participation on the recall day.
αDifference between the insecure and the marginal group is significant at the .05 level.
βDifference between the marginal and the high security group is significant at the .05 level.
γDifference between the high security and the insecure group is significant at the .05 level.
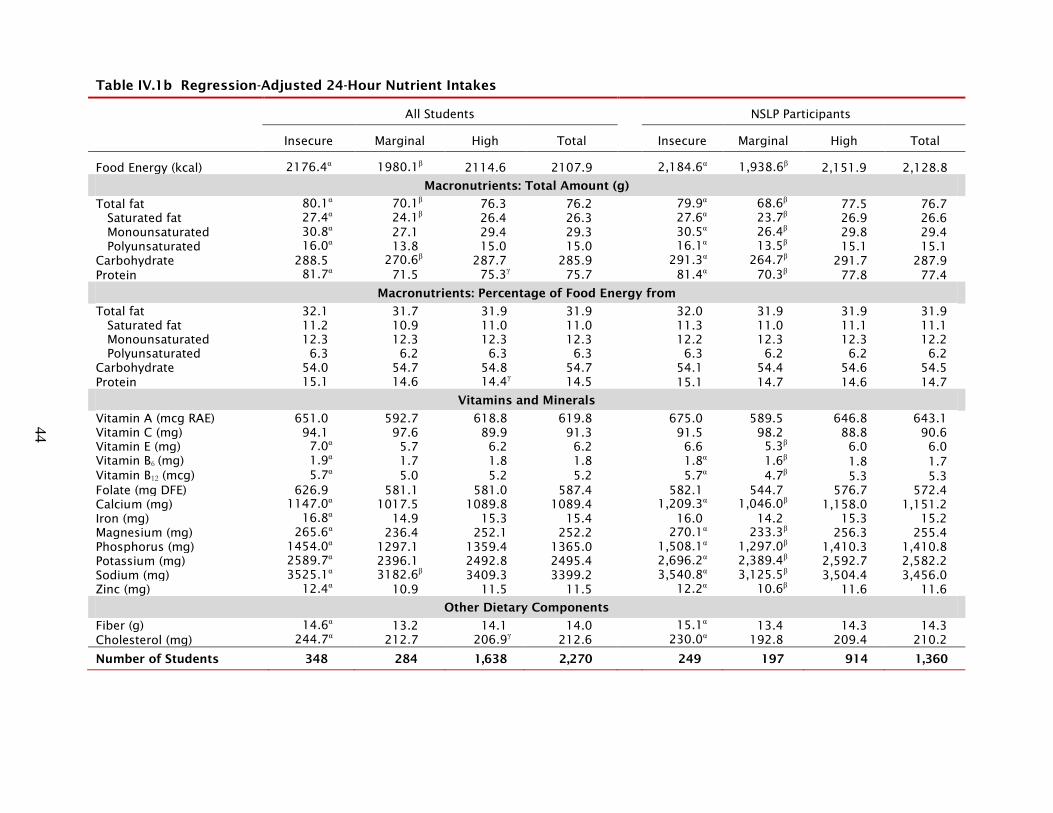
44
Table IV.1b Regression-Adjusted 24-Hour Nutrient Intakes
All Students NSLP Participants
Insecure Marginal High Total Insecure Marginal High Total
Food Energy (kcal) 2176.4α 1980.1
β 2114.6 2107.9 2,184.6
α 1,938.6
β 2,151.9 2,128.8
Macronutrients: Total Amount (g)
Total fat 80.1α 70.1
β 76.3 76.2 79.9
α 68.6
β 77.5 76.7
Saturated fat 27.4α 24.1
β 26.4 26.3 27.6
α 23.7
β 26.9 26.6
Monounsaturated 30.8α 27.1 29.4 29.3 30.5
α 26.4
β 29.8 29.4
Polyunsaturated 16.0α 13.8 15.0 15.0 16.1
α 13.5
β 15.1 15.1
Carbohydrate 288.5 270.6β 287.7 285.9 291.3
α 264.7
β 291.7 287.9
Protein 81.7α 71.5 75.3
γ 75.7 81.4
α 70.3
β 77.8 77.4
Macronutrients: Percentage of Food Energy from
Total fat 32.1 31.7 31.9 31.9 32.0 31.9 31.9 31.9
Saturated fat 11.2 10.9 11.0 11.0 11.3 11.0 11.1 11.1
Monounsaturated 12.3 12.3 12.3 12.3 12.2 12.3 12.3 12.2
Polyunsaturated 6.3 6.2 6.3 6.3 6.3 6.2 6.2 6.2
Carbohydrate 54.0 54.7 54.8 54.7 54.1 54.4 54.6 54.5
Protein 15.1 14.6 14.4γ 14.5 15.1 14.7 14.6 14.7
Vitamins and Minerals
Vitamin A (mcg RAE) 651.0 592.7 618.8 619.8 675.0 589.5 646.8 643.1
Vitamin C (mg) 94.1 97.6 89.9 91.3 91.5 98.2 88.8 90.6
Vitamin E (mg) 7.0α 5.7 6.2 6.2 6.6 5.3
β 6.0 6.0
Vitamin B6 (mg) 1.9α 1.7 1.8 1.8 1.8
α 1.6
β 1.8 1.7
Vitamin B12 (mcg) 5.7α 5.0 5.2 5.2 5.7
α 4.7
β 5.3 5.3
Folate (mg DFE) 626.9 581.1 581.0 587.4 582.1 544.7 576.7 572.4
Calcium (mg) 1147.0α 1017.5 1089.8 1089.4 1,209.3
α 1,046.0
β 1,158.0 1,151.2
Iron (mg) 16.8α 14.9 15.3 15.4 16.0 14.2 15.3 15.2
Magnesium (mg) 265.6α 236.4 252.1 252.2 270.1
α 233.3
β 256.3 255.4
Phosphorus (mg) 1454.0α 1297.1 1359.4 1365.0 1,508.1
α 1,297.0
β 1,410.3 1,410.8
Potassium (mg) 2589.7α 2396.1 2492.8 2495.4 2,696.2
α 2,389.4
β 2,592.7 2,582.2
Sodium (mg) 3525.1α 3182.6
β 3409.3 3399.2 3,540.8
α 3,125.5
β 3,504.4 3,456.0
Zinc (mg) 12.4α 10.9 11.5 11.5 12.2
α 10.6
β 11.6 11.6
Other Dietary Components
Fiber (g) 14.6α 13.2 14.1 14.0 15.1
α 13.4 14.3 14.3
Cholesterol (mg) 244.7α 212.7 206.9
γ 212.6 230.0
α 192.8 209.4 210.2
Number of Students 348 284 1,638 2,270 249 197 914 1,360
Table IV.1b (continued)
45
Source: School Nutrition Dietary Assessment-III, 24-Hour Dietary Recalls, school year 2004–2005. Weighted tabulations based on first 24-hour
recall prepared by Mathematica Policy Research. Intakes of both NSLP participants and nonparticipants include all foods and beverages
eaten over 24 hours. For participants, this may include, in addition to foods/beverages obtained as part of the reimbursable meal,
foods/beverages that were obtained in school from non-reimbursable sources and foods/beverages brought from home or consumed
at home.
Note: The insecure, marginal, and high columns refer to the food security status of a student's household as measured on the adult scale.
NSLP participation refers to participation on the recall day. All mean estimates have been regression-adjusted for differences in
personal, family, and school characteristics between food security groups including age, sex, household income relative to poverty,
ethnicity, height, region and several other characteristics listed in Appendix B.
αDifference between the insecure and the marginal group is significant at the .05 level.
βDifference between the marginal and the high security group is significant at the .05 level.
γDifference between the high security and the insecure group is significant at the .05 level.

Children’s Food Security and School Meals Mathematica Policy Research
46
student consumed (2,166 calories, Table IV.1a). Of the 21 distinct outcome variables,5 there are only
two significant differences between the insecure and highly secure children: the latter consumed less
protein and obtained a lower percentage of food energy from protein.6 As noted in Section D in
Chapter II, given the wide range of acceptable nutrient levels, not all statistically significant
differences are substantively important.
However, the marginally secure children consistently consumed significantly less than both
other groups, whether we look at all children or NSLP participants. When compared to the insecure,
the marginally secure consumed significantly fewer calories, and less of most macronutrients,
vitamins, minerals, and other dietary components.7 The differences in the macronutrients (fat,
carbohydrates, and protein) are due to more calories being consumed by the insecure group, because
there are no differences in the percentage of food energy from each macronutrient. This pattern
occurs in both the unadjusted and the regression-adjusted results.8 Therefore, the fact that more of
the marginally secure were female, compared to the insecure, for example, does not explain their
lower intakes of calories and key nutrients.9
5 While all the dietary intakes in the table are related to the total food energy consumed throughout the day and are
thus not completely independent from one another, there are seven rows that are strictly dependent on the other rows in the table and are hence excluded from this count of outcomes. Total fat is the sum of saturated fat, monounsaturated fat, and polyunsaturated fat, and the rows that give the percentage of food energy from fats, carbohydrates, and protein are derived directly from these variables and total food energy. So if the 21 outcomes were independent, at least one significant difference at the 5 percent level would be expected just by chance.
6 For the adjusted results, there are three significant differences; highly secure students also consumed significantly
less cholesterol (Table IV.1b).
7 Over 24 hours, marginally secure students consumed 221 fewer calories than the insecure and 176 fewer than the highly secure (Table IV.1a, unadjusted).
8 If we compare the marginally secure group to the highly secure group, we find some differences between the unadjusted and adjusted results. In the adjusted results, there are fewer significant differences in the vitamins and minerals consumed. The sign of the difference is the always the same (and usually the marginally secure students consumed less than the highly secure), but the regression adjustment tends to reduce the size of the differences because part of the differences are due to other observable differences besides food security.
9 The regression-adjusted intakes are the average predicted values from the regression, assuming that the entire sample is either insecure or marginal but otherwise holding their characteristics constant. The effects of food security status are assumed to be the same for all sample members, regardless of their other characteristics. The regression-
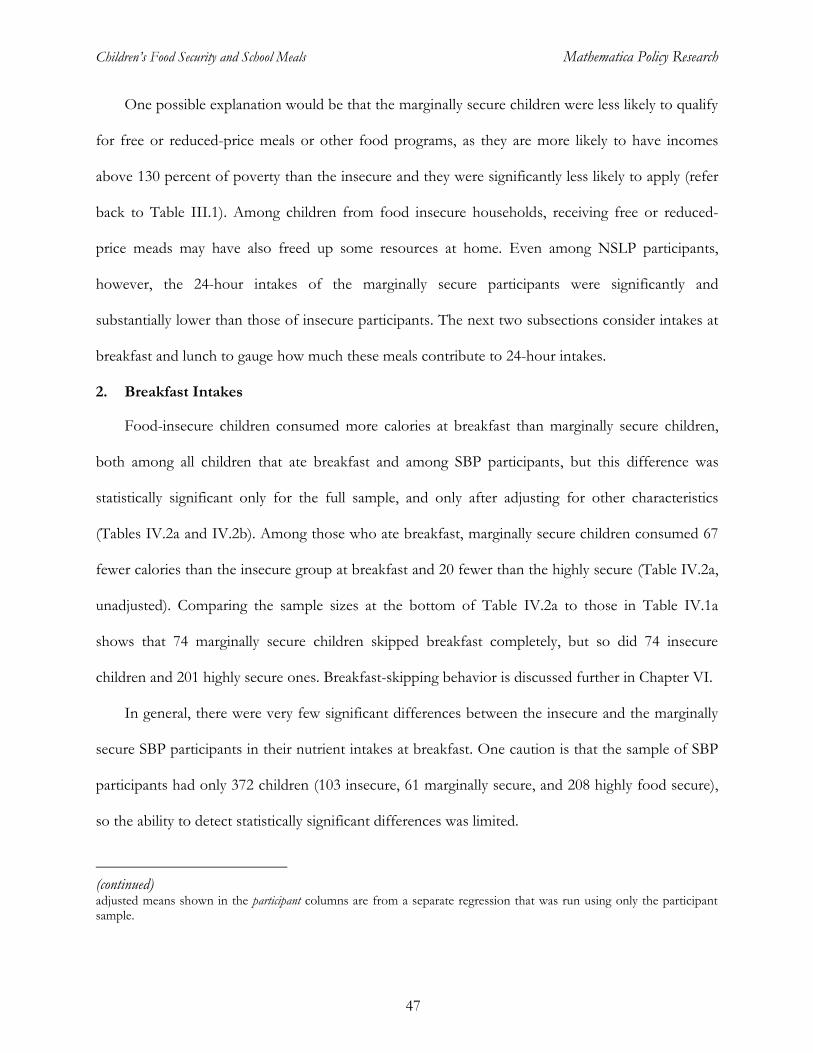
Children’s Food Security and School Meals Mathematica Policy Research
47
One possible explanation would be that the marginally secure children were less likely to qualify
for free or reduced-price meals or other food programs, as they are more likely to have incomes
above 130 percent of poverty than the insecure and they were significantly less likely to apply (refer
back to Table III.1). Among children from food insecure households, receiving free or reduced-
price meads may have also freed up some resources at home. Even among NSLP participants,
however, the 24-hour intakes of the marginally secure participants were significantly and
substantially lower than those of insecure participants. The next two subsections consider intakes at
breakfast and lunch to gauge how much these meals contribute to 24-hour intakes.
2. Breakfast Intakes
Food-insecure children consumed more calories at breakfast than marginally secure children,
both among all children that ate breakfast and among SBP participants, but this difference was
statistically significant only for the full sample, and only after adjusting for other characteristics
(Tables IV.2a and IV.2b). Among those who ate breakfast, marginally secure children consumed 67
fewer calories than the insecure group at breakfast and 20 fewer than the highly secure (Table IV.2a,
unadjusted). Comparing the sample sizes at the bottom of Table IV.2a to those in Table IV.1a
shows that 74 marginally secure children skipped breakfast completely, but so did 74 insecure
children and 201 highly secure ones. Breakfast-skipping behavior is discussed further in Chapter VI.
In general, there were very few significant differences between the insecure and the marginally
secure SBP participants in their nutrient intakes at breakfast. One caution is that the sample of SBP
participants had only 372 children (103 insecure, 61 marginally secure, and 208 highly food secure),
so the ability to detect statistically significant differences was limited.
(continued) adjusted means shown in the participant columns are from a separate regression that was run using only the participant sample.

48
Table IV.2a Breakfast Nutrient Intakes
All Students SBP Participants
Insecure Marginal High Total Insecure Marginal High Total
Food Energy (kcal) 463.5 396.0 416.1 420.3 462.7 391.6β 485.8 464.4
Macronutrients: Total Amount (g)
Total fat 14.1 11.8 11.4γ 11.8 12.5 12.1 14.8 13.8
Saturated fat 5.3 4.4 4.2 4.4 4.6α 4.1
β 5.1 4.8
Monounsaturated 5.2 4.3 4.1γ 4.3 4.9 4.7 5.5 5.2
Polyunsaturated 2.4 2.2 2.2 2.2 2.3 2.5 3.0γ 2.7
Carbohydrate 71.1 62.1 67.9 67.8 74.8 60.0β 74.8 72.3
Protein 14.7α 11.6 12.1
γ 12.4 14.2 11.9
β 14.8 14.2
Macronutrients: Percentage of Food Energy from
Total fat 24.7 23.1 23.1 23.4 22.9 25.5 25.7 25.0
Saturated fat 9.6 9.2 8.1γ 9.0 8.8 8.9 9.0 9.0
Monounsaturated 9.0 8.4 8.2 8.4 8.9 9.7 9.6 9.4
Polyunsaturated 4.3 4.2 4.3 4.3 4.1 5.1 5.2γ 4.9
Carbohydrate 63.8 67.0 67.0γ 66.6 64.9 63.6 63.3 63.7
Protein 12.9α 11.1 11.6
γ 11.7 13.2 12.1 12.1 12.4
Vitamins and Minerals
Vitamin A (mcg RAE) 214.7 201.1 231.2 225.8 208.4α 162.4 208.3 201.2
Vitamin C (mg) 28.7 21.6 28.5 27.9 35.7 23.2 30.2 30.9
Vitamin E (mg) 1.0 0.9 1.1 1.1 0.8 0.9 1.1γ 1.0
Vitamin B6 (mg) 0.6 0.5β 0.6 0.6 0.5 0.4 0.4 0.4
Vitamin B12 (mcg) 1.9 1.6 1.8 1.8 1.7α 1.3 1.5 1.5
Folate (mg DFE) 211.6 203.1 238.0 230.9 170.4 151.3 178.3 172.8
Calcium (mg) 324.3 288.6 313.2 311.6 343.6α 301.3 344.5 338.2
Iron (mg) 5.2 4.6 5.3 5.2 4.7 4.2 4.3 4.4
Magnesium (mg) 58.1 49.3 55.9 55.4 57.3 47.6β 59.2 56.8
Phosphorus (mg) 356.5 308.1 315.5 319.4 370.6α 311.4 364.1 356.0
Potassium (mg) 606.2α 500.2 539.4 543.2 646.5 521.5
β 631.9 619.5
Sodium (mg) 633.2α 495.1 546.5 552.9 640.6 516.3
β 679.6 643.5
Zinc (mg) 3.1 2.6β 3.1 3.0 3.0
α 2.3 2.8 2.8
Other Dietary Components
Fiber (g) 2.7 2.1β 2.7 2.6 2.6 2.1
β 2.7 2.6
Cholesterol (mg) 60.8α 36.5 39.7
γ 42.3 39.3 24.8
β 36.9 35.6
Number of Students 274 210 1,437 1,921 103 61 208 372

Table IV.2a (continued)
49
Source: School Nutrition Dietary Assessment-III, 24-Hour Dietary Recalls, school year 2004–2005. Weighted tabulations based on first 24-hour
recall prepared by Mathematica Policy Research. Sample excludes students who did not consume a breakfast. Intakes of both SBP
participants and nonparticipants include all foods and beverages eaten at breakfast. For participants, this may include, in addition to
foods/beverages obtained as part of the reimbursable meal, foods/beverages that were obtained in school from non-reimbursable
sources and foods/beverages brought from home or consumed at home.
Note: The insecure, marginal, and high columns refer to the food security status of a student's household as measured on the adult scale.
SBP participation refers to participation on the recall day.
αDifference between the insecure and the marginal group is significant at the .05 level.
βDifference between the marginal and the high security group is significant at the .05 level.
γDifference between the high security and the insecure group is significant at the .05 level.

50
Table IV.2b Regression-Adjusted Breakfast Nutrient Intakes
All Students SBP Participants
Insecure Marginal High Total Insecure Marginal High Total
Food Energy (kcal) 476.5α 405.9 412.5
γ 420.0 463.0 412.8 475.2 466.3
Macronutrients: Total Amount (g)
Total fat 13.9 11.4 11.5γ 11.8 11.1 12.1 14.1
γ 13.8
Saturated fat 5.1 4.2 4.3 4.4 4.0 4.3 4.9 4.8
Monounsaturated 5.2 4.1 4.1γ 4.3 4.4 4.8 5.3 5.3
Polyunsaturated 2.6 2.2 2.1 2.2 2.1 2.3 2.8γ 2.8
Carbohydrate 75.2 65.7 66.7γ 67.7 79.1
α 65.1 73.9 72.7
Protein 14.4α 11.4 12.1
γ 12.4 13.0 12.1 14.6 14.2
Macronutrients: Percentage of Food Energy from
Total fat 24.1 22.3 23.3 23.3 20.1 24.7 25.0γ 25.0
Saturated fat 9.2 8.8 8.9 9.0 7.7 9.0 8.9γ 9.0
Monounsaturated 8.8 8.2 8.3 8.3 7.9 9.6 9.4γ 9.4
Polyunsaturated 4.4 4.2 4.3 4.3 3.9 4.6 4.9γ 4.9
Carbohydrate 65.2 68.1 66.7 66.6 68.4 64.2 63.7γ 63.8
Protein 12.3 10.9 11.7 11.7 12.3 12.2 12.4 12.4
Vitamins and Minerals
Vitamin A (mcg RAE) 244.3 226.0 223.4 226.2 217.0 195.6 202.7 201.7
Vitamin C (mg) 33.7 24.8 27.2 27.9 40.3α 24.1 31.7 30.6
Vitamin E (mg) 1.3 1.1 1.0 1.1 0.9 0.9 1.1 1.0
Vitamin B6 (mg) 0.7 0.6 0.6 0.6 0.5 0.4 0.4 0.4
Vitamin B12 (mcg) 2.1 1.8 1.8 1.8 1.7 1.6 1.5 1.5
Folate (mg DFE) 272.3 242.8 223.4 231.3 203.3 173.1 172.2 172.4
Calcium (mg) 347.9 316.8 305.2 312.2 336.0 338.3 338.0 338.1
Iron (mg) 6.4 5.4 5.1γ 5.3 5.2 4.7 4.3
γ 4.4
Magnesium (mg) 63.3 52.1 54.6 55.5 57.4 48.8β 58.5 57.1
Phosphorus (mg) 366.7 320.7 311.8γ 319.8 345.8 340.5 361.2 358.2
Potassium (mg) 628.4α 517.7 532.8
γ 543.8 649.1 555.9 630.5 619.8
Sodium (mg) 635.8α 498.3 545.9
γ 552.2 582.2 538.3 664.2 646.1
Zinc (mg) 3.5α 2.8 3.0 3.0 3.1 2.7 2.8 2.8
Other Dietary Components
Fiber (g) 3.1α 2.3 2.6 2.6 2.4 2.2 2.7 2.6
Cholesterol (mg) 62.8α 34.1 39.7
γ 42.0 37.3 28.9 37.0 35.8
Number of Students 274 210 1,437 1,921 103 61 208 372

Table IV.2b (continued)
51
Source: School Nutrition Dietary Assessment-III, 24-Hour Dietary Recalls, school year 2004–2005. Weighted tabulations based on
first 24-hour recall prepared by Mathematica Policy Research. Sample excludes students who did not consume a breakfast.
Intakes of both SBP participants and nonparticipants include all foods and beverages eaten at breakfast. For participants,
this may include, in addition to foods/beverages obtained as part of the reimbursable meal, foods/beverages that were
obtained in school from non-reimbursable sources and foods/beverages brought from home or consumed at home.
Note: The insecure, marginal, and high columns refer to the food security status of a student's household as measured on the
adult scale. SBP participation refers to participation on the recall day. All mean estimates have been regression-adjusted for
differences in personal, family, and school characteristics between food security groups including age, sex, household
income relative to poverty, ethnicity, height, region and several other characteristics listed in Appendix B.
αDifference between the insecure and the marginal group is significant at the .05 level.
βDifference between the marginal and the high security group is significant at the .05 level.
γDifference between the high security and the insecure group is significant at the .05 level.

Children’s Food Security and School Meals Mathematica Policy Research
52
There were just a few significant differences between insecure and highly secure children in
nutrient intakes at breakfast. The highly secure consumed less in total fat, monounsaturated fat,
protein, and cholesterol (Table IV.2a, unadjusted). However, among SBP participants, none of these
differences were significant.10
3. Lunch Intakes
There are four significant differences between the insecure and highly secure in their mean
nutrient intakes at lunch; the insecure consumed more energy from protein, vitamin B12, calcium,
and potassium (Table IV.3a).11 Among NSLP participants, there are no significant differences
between the insecure and highly secure.
Table IV.3a shows that the marginally secure consumed 48 fewer calories than the insecure and
56 fewer than the highly secure at lunch, but only the latter difference was significant.12 A back-of-
the-envelope calculation, assuming that everyone eats breakfast and lunch, suggests that these two
meals could account for at most 115 of the 221 calories that the insecure consumed relative to the
marginally secure over the course of 24 hours and 76 of the 176 additional calories that the highly
secure consumed.13 Among participants, a similar rough calculation suggests that if everyone ate
both the school breakfast and the school lunch, these two meals could account for 100 of the 262
calories that the insecure ate relative to the marginally secure and 137 of the 217 additional calories
10 Though, highly secure participants consumed significantly more polyunsaturated fat and vitamin E than insecure
participants (Table IV.2a, unadjusted).
11 Within the regression-adjusted results (Table IV.3b), none of these differences are significant.
12 Again, lunch differences are only for students who ate something for lunch, but only a few students skipped lunch completely.
13 This calculation uses columns 2 though 4 of tables IV.1a through IV.3a and ignores the fact that students who did not eat breakfast and/or lunch are included in Table IV.1 and excluded from Table IV.2a and/or Table IV.3a respectively. Calculations done with the adjusted tables (IV.1b, IV.2b, and IV.3b) yielded similar results.

53
Table IV.3a Lunch Nutrient Intakes
All Students NSLP Participants
Insecure Marginal High Total Insecure Marginal High Total
Food Energy (kcal) 629.2 581.3β 637.6 631.1 617.9 589.1 632.3 625.4
Macronutrients: Total Amount (g)
Total fat 24.1 22.1β 24.6 24.3 23.5 21.8 23.9 23.7
Saturated fat 8.2α 7.1
β 8.0 8.0 8.2
α 7.1
β 8.1 8.0
Monounsaturated 9.5 8.8 β 9.9 9.7 9.1 8.6 9.4 9.3
Polyunsaturated 4.9 4.7 5.1 5.0 4.7 4.7 4.9 4.8
Carbohydrate 79.9 74.6β 82.2 81.0 77.4 76.3 80.7 79.5
Protein 24.9 22.7 23.9 24.0 25.7 23.7β 25.5 25.5
Macronutrients: Percentage of Food Energy from
Total fat 33.0 33.5 33.0 33.1 33.2 32.9 33.0 33.1
Saturated fat 11.5 11.0 10.9 11.0 11.8 10.9 11.3 11.3
Monounsaturated 12.9 13.4 13.1 13.1 12.8 12.8 12.9 12.9
Polyunsaturated 6.4 6.9 6.8 6.8 6.5 7.0 6.7 6.7
Carbohydrate 51.9 51.5 53.3 52.9 50.8 51.6 51.7 51.4
Protein 16.1 16.1β 15.0
γ 15.3 17.1 16.8 16.4 16.6
Vitamins and Minerals
Vitamin A (mcg RAE) 170.3 151.2 155.2 157.8 193.8α 170.2
β 197.0 194.1
Vitamin C (mg) 23.6 25.5 20.4 21.3 21.6 27.3 19.6 20.9
Vitamin E (mg) 1.9 1.8 2.0 2.0 1.8 1.8 1.8 1.8
Vitamin B6 (mg) 0.4 0.4 0.4 0.4 0.4 0.4 0.4 0.4
Vitamin B12 (mcg) 1.4 1.2 1.2γ 1.3 1.5
α 1.3
β 1.5 1.5
Folate (mg DFE) 118.7 109.6β 122.8 121.1 119.1 113.7 122.2 120.9
Calcium (mg) 387.5α 337.1 339.8
γ 347.1 420.0
α 368.0
β 407.6 405.5
Iron (mg) 3.7 3.4β 3.7 3.7 3.7 3.5
β 3.8 3.8
Magnesium (mg) 79.3 71.7β 78.1 77.6 82.1 75.4 80.7 80.2
Phosphorus (mg) 453.1α 409.5 424.0 427.5 480.6
α 430.8
β 468.4 466.9
Potassium (mg) 841.6 772.4 774.0γ 783.6 893.9 808.2 864.1 862.4
Sodium (mg) 1,080 1,014β 1,096 1,088 1,098 1,039
β 1,134 1,119
Zinc (mg) 3.31α 2.8 3.0 3.1 3.4
α 2.9
β 3.2 3.3
Other Dietary Components
Fiber (g) 4.7α 4.1
β 4.5 4.5 4.8 4.3 4.7 4.7
Cholesterol (mg) 54.1 57.9 60.2 59.4 54.9 59.2 58.7 58.7
Number of Students 333 273 1,582 2,188 249 197 913 1,359
Table IV.3a (continued)
54
Source: School Nutrition Dietary Assessment-III, 24-Hour Dietary Recalls, school year 2004–2005. Weighted tabulations based on first 24-hour
recall prepared by Mathematica Policy Research. Sample excludes students who did not consume a lunch. Intakes of both NSLP
participants and nonparticipants include all foods and beverages eaten at lunch. For participants, this may include, in addition to
foods/beverages obtained as part of the reimbursable meal, foods/beverages that were obtained in school from non-reimbursable
sources and foods/beverages brought from home or consumed at home.
Note: The insecure, marginal, and high columns refer to the food security status of a student's household as measured on the adult scale.
NSLP participation refers to participation on the recall day.
αDifference between the insecure and the marginal group is significant at the .05 level.
βDifference between the marginal and the high security group is significant at the .05 level.
γDifference between the high security and the insecure group is significant at the .05 level.

55
Table IV.3b Regression-Adjusted Lunch Nutrient Intakes
All Students NSLP Participants
Insecure Marginal High Total Insecure Marginal High Total
Food Energy (kcal) 645.2 611.8 630.4 630.5 618.1 604.9 630.4 624.1
Macronutrients: Total Amount (g)
Total fat 24.7 23.4 24.3 24.3 23.2 22.4 23.9 23.5
Saturated fat 8.3 7.5 7.9 7.9 8.1 7.3β 8.1 7.9
Monounsaturated 9.7 9.4 9.7 9.7 8.9 8.9 9.4 9.2
Polyunsaturated 5.1 4.9 5.0 5.0 4.7 4.8 4.9 4.8
Carbohydrate 82.6 79.2 81.1 81.1 78.7 78.7 80 79.5
Protein 25.1 23.1 23.8 23.9 25.4 23.9 25.6 25.3
Macronutrients: Percentage of Food Energy from
Total fat 33.1 33.6 33.0 33.0 32.9 33.2 33.1 33.0
Saturated fat 11.5 11.0 10.9 11.0 11.7 10.9 11.3 11.3
Monounsaturated 12.9 13.4 13.1 13.1 12.7 13.0 12.9 12.9
Polyunsaturated 6.6 6.9 6.8 6.8 6.4 7.0 6.7 6.7
Carbohydrate 52.2 52.1 53.2 53.0 51.3 51.6 51.5 51.5
Protein 15.8 15.5 15.1 15.3 16.9 16.5 16.5 16.6
Vitamins and Minerals
Vitamin A (mcg RAE) 160.0α 135.3β 159.9 156.7 197.2
α 166.4
β 197.6 192.8
Vitamin C (mg) 22.6 25.2 20.7 21.4 18.5 26.7 20.5 21.0
Vitamin E (mg) 2.0 1.8 2.0 2.0 1.7 1.8 1.9 1.8
Vitamin B6 (mg) 0.4 0.4 0.4 0.4 0.4 0.4 0.4 0.4
Vitamin B12 (mcg) 1.3 1.1 1.3 1.2 1.5α 1.3
β 1.5 1.4
Folate (mg DFE) 119.9 112.7 122.1 120.8 118.2 115.1 122.1 120.6
Calcium (mg) 371.5α 321.0 345.5 345.8 421.5
α 366.4
β 408.0 404.2
Iron (mg) 3.7 3.5 3.7 3.7 3.7 3.6 3.8 3.8
Magnesium (mg) 79.5α 72.9 77.9 77.6 80.2 75.8 81.1 80.2
Phosphorus (mg) 446.3α 405.0 426.2 426.2 478.6
α 431.8
β 469.5 465.2
Potassium (mg) 806.1 752.2 783.5 782.7 874.9 810.6 869.6 861.4
Sodium (mg) 1104.1 1056.8 1086.1 1085.1 1103.1 1065.4 1129.9 1114.8
Zinc (mg) 3.1α 2.8 3.1 3.0 3.3
α 2.9
β 3.3 3.2
Other Dietary Components
Fiber (g) 4.6 4.2 4.5 4.5 4.8 4.4 4.7 4.7
Cholesterol (mg) 62.4 65.8 57.3 59.1 51.5 58.8 59.9 58.1
Number of Students 333 273 1,582 2,188 249 197 913 1,359
Table IV.3b (continued)
56
Source: School Nutrition Dietary Assessment-III, 24-Hour Dietary Recalls, school year 2004–2005. Weighted tabulations based on first 24-hour
recall prepared by Mathematica Policy Research. Intakes of both NSLP participants and nonparticipants include all foods and beverages
eaten over 24 hours. For participants, this may include, in addition to foods/beverages obtained as part of the reimbursable meal,
foods/beverages that were obtained in school from non-reimbursable sources and foods/beverages brought from home or consumed
at home.
Note: The insecure, marginal, and high columns refer to the food security status of a student's household as measured on the adult scale.
NSLP participation refers to participation on the recall day. All mean estimates have been regression-adjusted for differences in
personal, family, and school characteristics between food security groups including age, sex, household income relative to poverty,
ethnicity, height, region and several other characteristics listed in Appendix B.
αDifference between the insecure and the marginal group is significant at the .05 level.
βDifference between the marginal and the high security group is significant at the .05 level.
γDifference between the high security and the insecure group is significant at the .05 level.
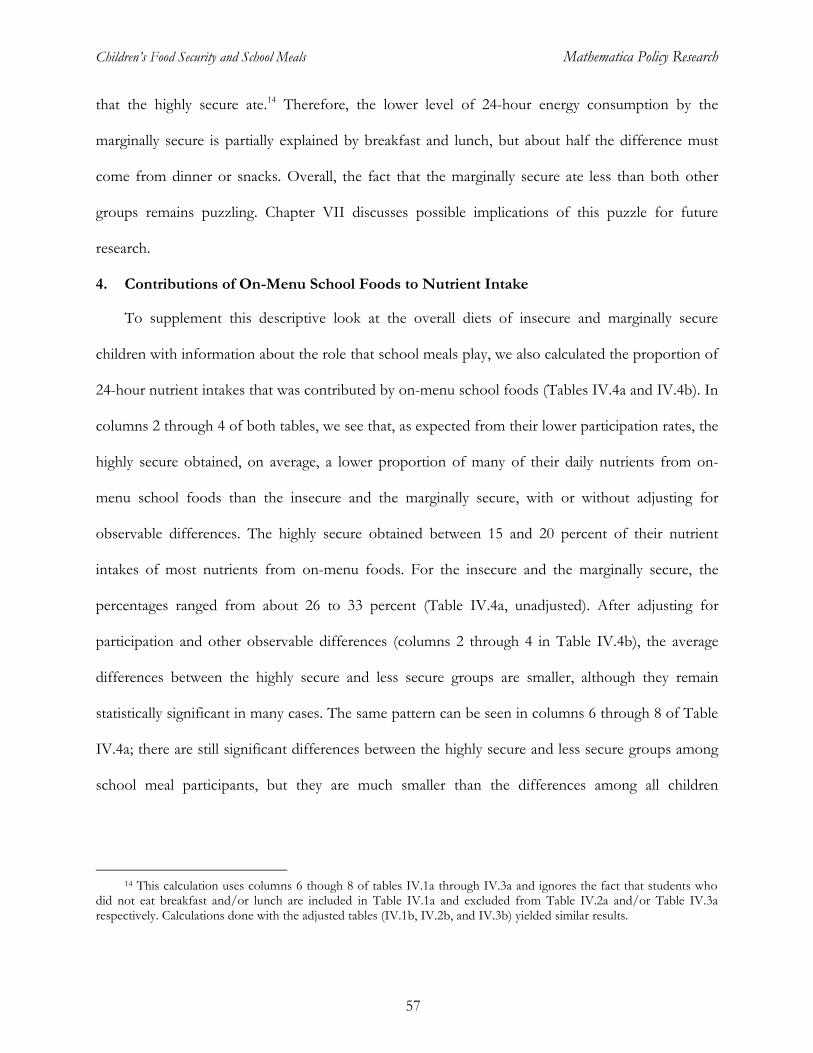
Children’s Food Security and School Meals Mathematica Policy Research
57
that the highly secure ate.14 Therefore, the lower level of 24-hour energy consumption by the
marginally secure is partially explained by breakfast and lunch, but about half the difference must
come from dinner or snacks. Overall, the fact that the marginally secure ate less than both other
groups remains puzzling. Chapter VII discusses possible implications of this puzzle for future
research.
4. Contributions of On-Menu School Foods to Nutrient Intake
To supplement this descriptive look at the overall diets of insecure and marginally secure
children with information about the role that school meals play, we also calculated the proportion of
24-hour nutrient intakes that was contributed by on-menu school foods (Tables IV.4a and IV.4b). In
columns 2 through 4 of both tables, we see that, as expected from their lower participation rates, the
highly secure obtained, on average, a lower proportion of many of their daily nutrients from on-
menu school foods than the insecure and the marginally secure, with or without adjusting for
observable differences. The highly secure obtained between 15 and 20 percent of their nutrient
intakes of most nutrients from on-menu foods. For the insecure and the marginally secure, the
percentages ranged from about 26 to 33 percent (Table IV.4a, unadjusted). After adjusting for
participation and other observable differences (columns 2 through 4 in Table IV.4b), the average
differences between the highly secure and less secure groups are smaller, although they remain
statistically significant in many cases. The same pattern can be seen in columns 6 through 8 of Table
IV.4a; there are still significant differences between the highly secure and less secure groups among
school meal participants, but they are much smaller than the differences among all children
14 This calculation uses columns 6 though 8 of tables IV.1a through IV.3a and ignores the fact that students who
did not eat breakfast and/or lunch are included in Table IV.1a and excluded from Table IV.2a and/or Table IV.3a respectively. Calculations done with the adjusted tables (IV.1b, IV.2b, and IV.3b) yielded similar results.
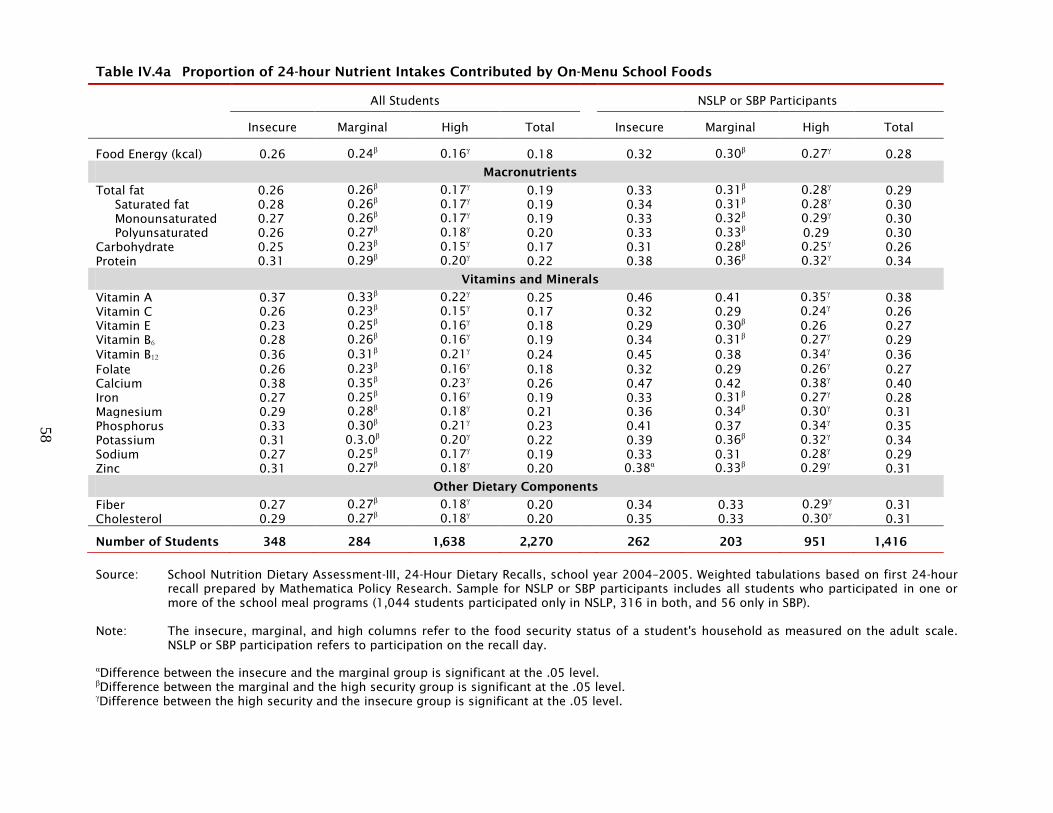
58
Table IV.4a Proportion of 24-hour Nutrient Intakes Contributed by On-Menu School Foods
All Students NSLP or SBP Participants
Insecure Marginal High Total Insecure Marginal High Total
Food Energy (kcal) 0.26 0.24β 0.16
γ 0.18 0.32 0.30
β 0.27
γ 0.28
Macronutrients
Total fat 0.26 0.26β 0.17
γ 0.19 0.33 0.31
β 0.28
γ 0.29
Saturated fat 0.28 0.26β 0.17
γ 0.19 0.34 0.31
β 0.28
γ 0.30
Monounsaturated 0.27 0.26β 0.17
γ 0.19 0.33 0.32
β 0.29
γ 0.30
Polyunsaturated 0.26 0.27β 0.18
γ 0.20 0.33 0.33
β 0.29 0.30
Carbohydrate 0.25 0.23β 0.15
γ 0.17 0.31 0.28
β 0.25
γ 0.26
Protein 0.31 0.29β 0.20
γ 0.22 0.38 0.36
β 0.32
γ 0.34
Vitamins and Minerals
Vitamin A 0.37 0.33β 0.22
γ 0.25 0.46 0.41 0.35
γ 0.38
Vitamin C 0.26 0.23β 0.15
γ 0.17 0.32 0.29 0.24
γ 0.26
Vitamin E 0.23 0.25β 0.16
γ 0.18 0.29 0.30
β 0.26 0.27
Vitamin B6 0.28 0.26β 0.16
γ 0.19 0.34 0.31
β 0.27
γ 0.29
Vitamin B12 0.36 0.31β 0.21
γ 0.24 0.45 0.38 0.34
γ 0.36
Folate 0.26 0.23β 0.16
γ 0.18 0.32 0.29 0.26
γ 0.27
Calcium 0.38 0.35β 0.23
γ 0.26 0.47 0.42 0.38
γ 0.40
Iron 0.27 0.25β 0.16
γ 0.19 0.33 0.31
β 0.27
γ 0.28
Magnesium 0.29 0.28β 0.18
γ 0.21 0.36 0.34
β 0.30
γ 0.31
Phosphorus 0.33 0.30β 0.21
γ 0.23 0.41 0.37 0.34
γ 0.35
Potassium 0.31 0.3.0β 0.20
γ 0.22 0.39 0.36
β 0.32
γ 0.34
Sodium 0.27 0.25β 0.17
γ 0.19 0.33 0.31 0.28
γ 0.29
Zinc 0.31 0.27β 0.18
γ 0.20 0.38
α 0.33
β 0.29
γ 0.31
Other Dietary Components
Fiber 0.27 0.27β 0.18
γ 0.20 0.34 0.33 0.29
γ 0.31
Cholesterol 0.29 0.27β 0.18
γ 0.20 0.35 0.33 0.30
γ 0.31
Number of Students 348 284 1,638 2,270 262 203 951 1,416
Source: School Nutrition Dietary Assessment-III, 24-Hour Dietary Recalls, school year 2004–2005. Weighted tabulations based on first 24-hour
recall prepared by Mathematica Policy Research. Sample for NSLP or SBP participants includes all students who participated in one or
more of the school meal programs (1,044 students participated only in NSLP, 316 in both, and 56 only in SBP).
Note: The insecure, marginal, and high columns refer to the food security status of a student's household as measured on the adult scale.
NSLP or SBP participation refers to participation on the recall day.
αDifference between the insecure and the marginal group is significant at the .05 level.
βDifference between the marginal and the high security group is significant at the .05 level.
γDifference between the high security and the insecure group is significant at the .05 level.

59
Table IV.4b Proportion of 24-Hour Nutrient Intakes Contributed by On-Menu School Foods, Regression-Adjusted Means
All Students NSLP or SBP Participants
Insecure Marginal High Total Insecure Marginal High Total
Food Energy (kcal) 0.20 0.22β 0.18
γ 0.18 0.27 0.28 0.26 0.26
Macronutrients: Total Amount (g)
Total fat 0.21 0.23β 0.18 0.19 0.29 0.30 0.27 0.28
Saturated fat 0.22 0.23β 0.19 0.19 0.30 0.29 0.27 0.28
Monounsaturated 0.21 0.24β 0.19 0.19 0.30 0.31 0.28 0.28
Polyunsaturated 0.22 0.25β 0.19 0.20 0.30 0.32
β 0.28 0.29
Carbohydrate 0.19 0.20β 0.17
γ 0.17 0.25 0.26 0.24 0.24
Protein 0.25 0.26β 0.21
γ 0.22 0.34 0.34 0.32 0.32
Vitamins and Minerals
Vitamin A 0.29 0.27 0.24γ 0.25 0.37 0.34 0.34 0.35
Vitamin C 0.19 0.19 0.16 0.17 0.25 0.24 0.23 0.23
Vitamin E 0.19 0.23β 0.16 0.17 0.27 0.29
β 0.25 0.25
Vitamin B6 0.22 0.23β 0.18
γ 0.19 0.29 0.29 0.26 0.26
Vitamin B12 0.28 0.26 0.23γ 0.24 0.37 0.33 0.33 0.34
Folate 0.19 0.20 0.17 0.18 0.25 0.25 0.25 0.25
Calcium 0.30 0.29 0.25γ 0.26 0.39 0.36 0.37 0.37
Iron 0.20 0.22β 0.18 0.18 0.27 0.28 0.26 0.26
Magnesium 0.23 0.24β 0.20
γ 0.20 0.30 0.31 0.29 0.29
Phosphorus 0.26 0.26β 0.22
γ 0.23 0.34 0.33 0.33 0.33
Potassium 0.25 0.26β 0.21
γ 0.22 0.33 0.33 0.31 0.31
Sodium 0.21 0.23β 0.18
γ 0.19 0.29 0.29 0.28 0.28
Zinc 0.24 0.23β 0.19
γ 0.20 0.32 0.30 0.28
γ 0.29
Other Dietary Components
Fiber 0.22 0.24β 0.19 0.20 0.30 0.31 0.29 0.29
Cholesterol 0.23 0.24β 0.19
γ 0.20 0.31 0.32 0.30 0.30
Number of Students 348 284 1,638 2,270 262 203 951 1,416
Table IV.4b (continued)
60
Source: School Nutrition Dietary Assessment-III, 24-Hour Dietary Recalls, school year 2004–2005. Weighted tabulations based on first 24-hour
recall prepared by Mathematica Policy Research. Sample for NSLP or SBP participants includes all students who participated in one or
more of the school meal programs (1,044 students participated only in NSLP, 316 in both, and 56 only in SBP).
Note: The insecure, marginal, and high columns refer to the food security status of a student's household as measured on the adult scale. NSLP
or SBP participation refers to participation on the recall day. All mean estimates have been regression-adjusted for differences in
personal, family, and school characteristics between food security groups including age, sex, household income relative to poverty,
ethnicity, height, region and several other characteristics listed in Appendix B.
αDifference between the insecure and the marginal group is significant at the .05 level.
βDifference between the marginal and the high security group is significant at the .05 level.
γDifference between the high security and the insecure group is significant at the .05 level.

Children’s Food Security and School Meals Mathematica Policy Research
61
(columns 2 through 4 of Table IV.4a). Participation accounts for roughly half the original difference
across the food security groups for all children. Among participants, adjusting for observable
differences in columns 6 through 8 of Table IV.4b, the differences are even smaller and are generally
not significant.
C. Food Group Servings (MyPyramid Equivalents)
1. Intakes of MPEs over 24 Hours
Over the course of 24 hours, the average MPEs that children consumed from key food groups
were similar across the three food security groups (Tables IV.5a and IV.5b). Although the mean
servings for all five major food groups (milk products, fruits and juices, vegetables, meat and beans,
and grains) were higher for the food insecure than for the marginally secure, the difference was
statistically significant only for the meat-and-beans category (with or without regression adjustment).
The food insecure also ate significantly more of the soy products, nuts, and seeds category and more
cheese than the marginally secure. The highly secure ate more milk products and grains than the
marginally secure. The only significant differences between the insecure and the highly secure were
that the insecure ate less yogurt, more legumes, and more meat and beans (Table IV.5a,
unadjusted).15
Policymakers and public health and nutrition experts are concerned about the low number of
servings of fruits and vegetables consumed by American schoolchildren (and adults). These data
show that at least the school-day diets of children from food-insecure households contain roughly
the same number of servings of fruit and vegetables as those of children from highly food-secure
households-between two and two-and-a-half MPEs per day. Both groups of children, however, need
to eat more fruits and vegetables.
15 The regression adjustment changes this slightly. The magnitude of the differences between the highly secure and
the insecure is smaller, so the differences are no longer significant. Within the adjusted results (Table IV.5b), the only significant difference between the insecure and the highly secure was that the insecure ate more dark-green vegetables (but both groups consumed very small amounts).

62
Table IV.5a MyPyramid Equivalents Eaten Over 24 Hours by Food Security Status and NSLP Participation
Mean Cup or Oz. Equivalents of the MyPyramid Food Groups
All Students NSLP Participants
Insecure Marginal High Total Insecure Marginal High Total
Total Milk Products (cup equivalents) 2.48 2.18β 2.46 2.44 2.69
α 2.28
β 2.70 2.64
Milk 1.68 1.57 1.70 1.69 1.86 1.63β 1.90 1.86
Yogurt 0.02 0.05 0.06γ 0.05 0.01 0.06 0.04 0.03
Cheese 0.78α 0.55
β 0.70 0.69 0.81
α 0.58
β 0.75 0.74
Total Fruits & Juices (cup equivalents) 1.27 1.14 1.27 1.25 1.30 1.12 1.26 1.25
Whole fruita
0.60 0.50 0.61 0.60 0.67α 0.48 0.59 0.59
Fruit juicea
0.67 0.64 0.66 0.66 0.63 0.64 0.67 0.66
Total Vegetables (cup equivalents) 1.16 1.13 1.11 1.12 1.19 1.11 1.15 1.15
Dark-green vegetables 0.05 0.04 0.05 0.05 0.05 0.04 0.05 0.05
Orange vegetables 0.04 0.04 0.05 0.05 0.04 0.04 0.05 0.05
Potatoes & other starchy vegetables 0.41 0.44 0.42 0.42 0.41 0.42 0.44 0.43
Other vegetables 0.67 0.62 0.58 0.60 0.70 0.61 0.61 0.63
Legumes (cup equivalents) 0.09 0.09 0.06γ 0.07 0.10 0.10 0.06 0.07
Total Meat & Beans (oz. equivalents) 5.03α 4.11 4.39
γ 4.45 4.92 4.01 4.21 4.32
Meat b
2.41 2.11 2.14 2.19 2.38α 2.07 2.14 2.19
Poultry 1.48 1.23 1.22 1.26 1.48 1.20 1.18 1.24
Fish & Shellfish 0.33 0.31 0.21 0.24 0.29 0.29 0.22 0.24
Eggs 0.22 0.17 0.16 0.17 0.22 0.16 0.15 0.17
Soy products, nuts, & seeds 0.59α 0.29
β 0.65 0.6 0.54 0.30
β 0.51 0.49
Total Grains (oz. equivalents) 7.34 6.67β 7.44 7.34 7.52 6.82
β 7.72 7.55
Whole grains 0.55 0.44β 0.61 0.58 0.57 0.45 0.56 0.55
Non-whole grains/ refined grains 6.80 6.23β 6.82 6.75 6.95 6.36
β 7.16 7.01
Number of Students 348 284 1,638 2,270 249 197 914 1,360
Source: School Nutrition Dietary Assessment-III, 24-Hour Dietary Recalls, school year 2004–2005. Weighted tabulations based on first 24-hour recall
prepared by Mathematica Policy Research. Intakes of both NSLP participants and nonparticipants include all foods and beverages eaten over
24 hours. For participants, this may include, in addition to foods/beverages obtained as part of the reimbursable meal, foods/beverages that
were obtained in school from non-reimbursable sources and foods/beverages brought from home or consumed at home.
Note: The insecure, marginal, and high columns refer to the food security status of a student's household as measured on the adult scale. NSLP
participation refers to participation on the recall day.
a
Fruit juice and whole fruit were defined using the Center for Nutrition and Policy Promotion 01-02 Database.
b
The meat category includes all beef, pork, lamb, organ meat, frankfurters, sausages, and luncheon meats consumed.
αDifference between the insecure and the marginal group is significant at the .05 level.
βDifference between the marginal and the high security group is significant at the .05 level.
γDifference between the high security and the insecure group is significant at the .05 level.

63
Table IV.5b Regression-Adjusted MyPyramid Equivalents Eaten Over 24 Hours
Mean Cup or Oz. Equivalents of the MyPyramid Food Groups
All Students
NSLP Participants
Insecure Marginal High Total Insecure Marginal High Total
Total Milk Products (cup equivalents) 2.51 2.26 2.44 2.43
2.73α 2.37
β 2.67 2.64
Milk 1.70 1.65 1.69 1.68 1.92 1.76 1.87 1.86
Yogurt 0.04 0.07 0.05 0.05 0.02 0.05 0.04 0.04
Cheese 0.76α 0.53
β 0.70 0.69 0.79
α 0.56
β 0.76 0.74
Total Fruits & Juices (cup equivalents) 1.28 1.17 1.26 1.25 1.28 1.09 1.27 1.25
Whole fruita
0.61 0.53 0.60 0.60 0.66α 0.45
β 0.60 0.59
Fruit juicea
0.67 0.64 0.65 0.66 0.62 0.64 0.67 0.66
Total Vegetables (cup equivalents) 1.17 1.14 1.10 1.12 1.21 1.14 1.14 1.15
Dark-green vegetables 0.07 0.05 0.04γ 0.05 0.08 0.05 0.04
γ 0.05
Orange vegetables 0.05 0.04 0.05 0.05 0.04 0.04 0.05 0.05
Potatoes & other starchy vegetables 0.41 0.44 0.42 0.42 0.44 0.44 0.43 0.43
Other vegetables 0.64 0.61 0.59 0.60 0.65 0.60 0.63 0.63
Legumes (cup equivalents) 0.07 0.08 0.06 0.07 0.08 0.09 0.06 0.07
Total Meat & Beans (oz. equivalents) 4.98α 4.08 4.40 4.44 4.57 3.8 4.33 4.30
Meatb
2.25 2.02 2.18 2.17 2.11 1.89 2.24 2.17
Poultry 1.43 1.20 1.23 1.26 1.38 1.16 1.21 1.23
Fish & Shellfish 0.38 0.30 0.21 0.24 0.33 0.26 0.22 0.24
Eggs 0.24 0.18 0.16 0.17 0.23 0.15 0.15 0.17
Soy products, nuts, & seeds 0.69α 0.38
β 0.62 0.60 0.53 0.35 0.51 0.49
Total Grains (oz. equivalents) 7.46 6.81 7.40 7.34 7.62 6.94β 7.67 7.57
Whole grains 0.62 0.48 0.59 0.59 0.64 0.48 0.54 0.55
Non-whole grains/ refined grains 6.84 6.33 6.80 6.76 6.98 6.46β 7.13 7.02
Number of Students 348 284 1,638 2,270 249 197 914 1,360

Table IV.5b (continued)
64
Source: School Nutrition Dietary Assessment-III, 24-Hour Dietary Recalls, school year 2004–2005. Weighted tabulations based on first 24-hour
recall prepared by Mathematica Policy Research. Intakes of both NSLP participants and nonparticipants include all foods and beverages
eaten over 24 hours. For participants, this may include, in addition to foods/beverages obtained as part of the reimbursable meal,
foods/beverages that were obtained in school from non-reimbursable sources and foods/beverages brought from home or consumed at
home.
Note: The insecure, marginal, and high columns refer to the food security status of a student's household as measured on the adult scale.
NSLP participation refers to participation on the recall day. All mean estimates have been regression-adjusted for differences in
personal, family, and school characteristics between food security groups including age, sex, household income relative to poverty,
ethnicity, height, region and several other characteristics listed in Appendix B.
a
Fruit juice and whole fruit were defined using the Center for Nutrition and Policy Promotion 01-02 Database.
b
The meat category includes all beef, pork, lamb, organ meat, frankfurters, sausages, and luncheon meats consumed.
αDifference between the insecure and the marginal group is significant at the .05 level.
βDifference between the marginal and the high security group is significant at the .05 level.
γDifference between the high security and the insecure group is significant at the .05 level.
Children’s Food Security and School Meals Mathematica Policy Research
65
2. Breakfast Intakes
Tables IV.6a and IV.6b show that children from all food security groups who ate breakfast
obtained, on average, roughly the same number of MPEs of key food groups at breakfast; MPEs
consumed at breakfast were also similar among SBP participants from all three food security groups.
The food insecure consumed significantly more MPEs of meat and beans than either the marginally
secure or the highly secure and significantly more MPEs of fruit than the marginally secure, but
neither difference was significant among SBP participants (Table IV.6a).
3. Lunch Intakes
There are also relatively few differences across the food security groups in consumption of key
food groups at lunch (Tables IV.7a and IV.7b). The insecure and marginally secure ate significantly
fewer MPEs of grain-based foods at lunch than the highly secure overall and among NSLP
participants (Table IV.7a, unadjusted).16 The insecure consumed significantly more milk at lunch
than the marginally secure among all children and participants, with or without regression
adjustment.
4. Contributions of On-Menu School Foods
As might be expected from lower rates of school meal participation, the highly food secure
obtained smaller proportions of MPEs of their key food groups from on-menu school foods than
the insecure and the marginally secure (columns 2 to 4 in Table IV.8a). Compared to the insecure
and the marginally secure, they consumed a lower proportion of MPEs of all five major food groups
from school foods. When the sample was limited to children who participated in at least one school
meal (columns 6 through 8 of Table IV.8a, unadjusted), the differences between the marginally
16 This is another example of a difference that the regression adjustment reduces and renders nonsignificant
(Table V.7b).

66
Table IV.6a MyPyramid Equivalents Eaten at Breakfast, by Food Security Status and SBP Participation
Mean Cup or Oz. Equivalents of the MyPyramid Food Groups
All Students SBP Participants
Insecure Marginal High Total Insecure Marginal High Total
Total Milk Products (cup equivalents) 0.76 0.72 0.68 0.69 0.85 0.79 0.86 0.84
Milk 0.71 0.67 0.63 0.64 0.81 0.73 0.74 0.75
Yogurt 0.00 0.01 0.01γ 0.01 0.00 0.00
β 0.01 0.01
Cheese 0.05 0.04 0.04 0.04 0.04 0.06 0.11γ 0.08
Total Fruits & Juices (cup equivalents) 0.46α 0.30 0.40 0.40 0.52 0.39 0.47 0.47
Whole fruita
0.13 0.06β 0.11 0.11 0.09 0.09 0.07 0.07
Fruit juicea
0.34 0.23 0.29 0.29 0.44 0.30 0.40 0.40
Total Vegetables (cup equivalents) 0.02 0.06 0.03 0.03 0.02 0.02 0.07 0.05
Dark-green vegetables 0.00 0.01 0.00 0.00 0.00 0.00 0.00 0.00
Orange vegetables 0.00 0.00 0.00 0.00 0.00 0.00 0.01 0.00
Potatoes & other starchy vegetables 0.01 0.02 0.01 0.01 0.01 0.00 0.02 0.01
Other vegetables 0.01 0.02 0.02 0.02 0.01 0.02 0.04 0.03
Legumes (cup equivalents) 0.01 0.00 0.00 0.00 0.00 0.00 0.00 0.00
Total Meat & Beans (oz. equivalents) 0.52α 0.27 0.28
γ 0.31 0.36 0.29 0.40 0.38
Meat, Poultry
& Fishb
0.30α 0.13 0.13
γ 0.15 0.24 0.15 0.23 0.23
Eggs 0.17 0.07 0.08γ 0.09 0.09 0.02 0.04 0.05
Soy products, nuts, & seeds 0.05 0.07 0.07 0.07 0.03 0.12 0.12 0.10
Total Grains (oz. equivalents) 1.72 1.52 1.72 1.70 1.91 1.65 1.99 1.92
Whole grains 0.24 0.24 0.32 0.30 0.23 0.16 0.24 0.22
Non-whole grains/ refined grains 1.48 1.28 1.40 1.40 1.69 1.48 1.75 1.70
Number of Students 274 210 1,437 1,921 103 61 208 372
Source: School Nutrition Dietary Assessment-III, 24-Hour Dietary Recalls, school year 2004–2005. Weighted tabulations based on first 24-hour recall
prepared by Mathematica Policy Research. Sample excludes students who did not consume a breakfast. Intakes of both SBP participants and
nonparticipants include all foods and beverages eaten at breakfast. For participants, this may include, in addition to foods/beverages
obtained as part of the reimbursable meal, foods/beverages that were obtained in school from non-reimbursable sources and
foods/beverages brought from home or consumed at home.
Note: The insecure, marginal, and high columns refer to the food security status of a student's household as measured on the adult scale. SBP
participation refers to participation on the recall day.
a
Fruit juice and whole fruit were defined using the Center for Nutrition and Policy Promotion 01-02 Database.
b
The meat, poultry, and fish category includes all beef, pork, lamb, organ meat, frankfurters, sausages, luncheon meats, poultry, fish, and shellfish
consumed.
αDifference between the insecure and the marginal group is significant at the .05 level.
βDifference between the marginal and the high security group is significant at the .05 level.
γDifference between the high security and the insecure group is significant at the .05 level.

67
Table IV.6b Regression-Adjusted MyPyramid Equivalents Eaten at Breakfast
Mean Cup or Oz. Equivalents of the MyPyramid Food Groups
All Students
SBP Participants
Insecure Marginal High Total Insecure Marginal High Total
Total Milk Products (cup equivalents) 0.71 0.72 0.69 0.69 0.81 0.89 0.87 0.85
Milk 0.68 0.69 0.63 0.64 0.79 0.82 0.74 0.76
Yogurt 0.00 0.01 0.01 0.01 0.00 0.01 0.01 0.01
Cheese 0.03 0.02 0.05 0.04 0.02 0.06 0.11γ 0.08
Total Fruits & Juices (cup equivalents) 0.53α 0.33 0.39
γ 0.40 0.58
α 0.35 0.46 0.47
Whole fruita
0.15 0.09 0.10 0.11 0.09 0.07 0.07 0.08
Fruit juicea
0.37α 0.24 0.28 0.29 0.49
α 0.28 0.38 0.39
Total Vegetables (cup equivalents) 0.03 0.06 0.03 0.03 0.02 0.04 0.06γ 0.05
Dark-green vegetables 0.00 0.01 0.00 0.00 0.00 0.00 0.00 0.00
Orange vegetables 0.00 0.00 0.00 0.00 0.00 0.00 0.00 0.00
Potatoes & other starchy vegetables 0.01 0.02 0.01 0.01 0.01 0.01 0.01 0.01
Other vegetables 0.01 0.03 0.02 0.02 0.01 0.02 0.05γ 0.03
Legumes (cup equivalents) 0.01 0.00 0.00 0.00 0.00 0.00 0.00 0.00
Total Meat & Beans (oz. equivalents) 0.47α 0.19 0.30 0.31 0.27 0.26 0.44 0.37
Meat, Poultry, & Fishb
0.23α 0.06 0.15 0.15 0.15 0.14 0.27
γ 0.22
Eggs 0.18α 0.06 0.08
γ 0.09 0.07 0.04 0.04 0.05
Soy products, nuts, & seeds 0.06 0.06 0.07 0.07 0.05 0.08 0.12 0.10
Total Grains (oz. equivalents) 1.89 1.65 1.68 1.70 2.00 1.59 1.95 1.92
Whole grains 0.31 0.27 0.30 0.30 0.21 0.24 0.23 0.22
Non-whole grains/ refined grains 1.58 1.38 1.37 1.40 1.79 1.35 1.72 1.70
Number of Students 274 210 1,437 1,921 103 61 208 372
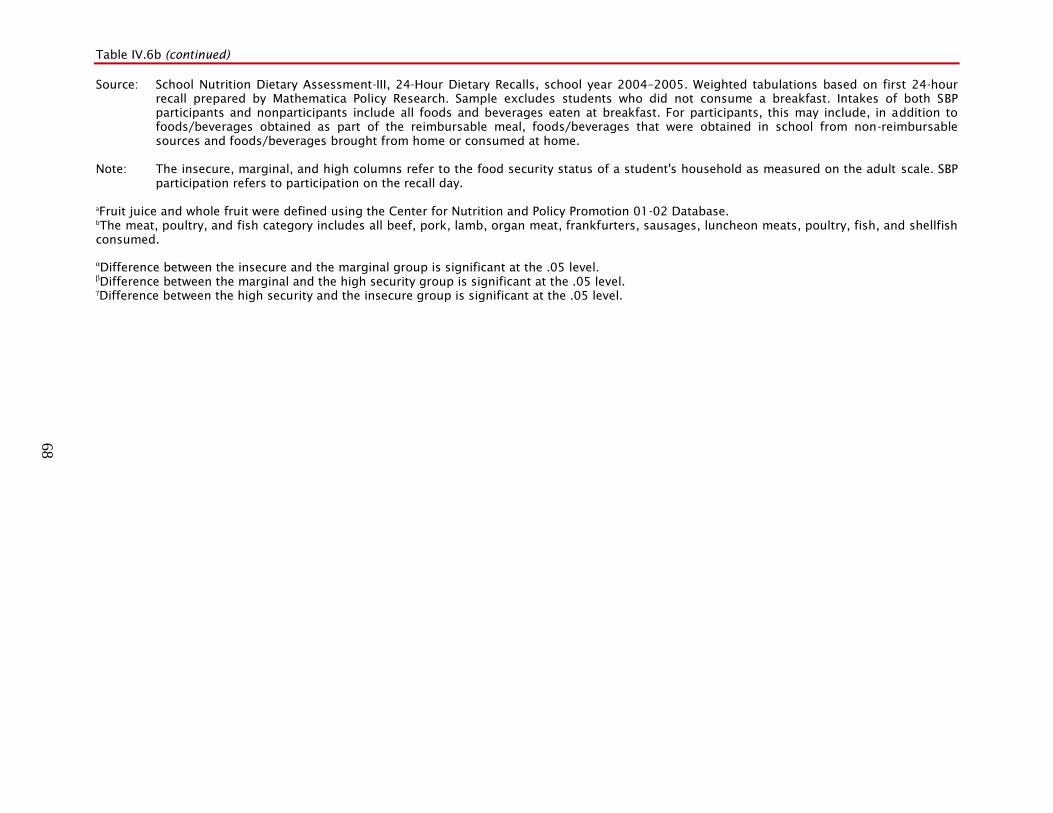
Table IV.6b (continued)
68
Source: School Nutrition Dietary Assessment-III, 24-Hour Dietary Recalls, school year 2004–2005. Weighted tabulations based on first 24-hour
recall prepared by Mathematica Policy Research. Sample excludes students who did not consume a breakfast. Intakes of both SBP
participants and nonparticipants include all foods and beverages eaten at breakfast. For participants, this may include, in addition to
foods/beverages obtained as part of the reimbursable meal, foods/beverages that were obtained in school from non-reimbursable
sources and foods/beverages brought from home or consumed at home.
Note: The insecure, marginal, and high columns refer to the food security status of a student's household as measured on the adult scale. SBP
participation refers to participation on the recall day.
a
Fruit juice and whole fruit were defined using the Center for Nutrition and Policy Promotion 01-02 Database.
b
The meat, poultry, and fish category includes all beef, pork, lamb, organ meat, frankfurters, sausages, luncheon meats, poultry, fish, and shellfish
consumed.
αDifference between the insecure and the marginal group is significant at the .05 level.
βDifference between the marginal and the high security group is significant at the .05 level.
γDifference between the high security and the insecure group is significant at the .05 level.
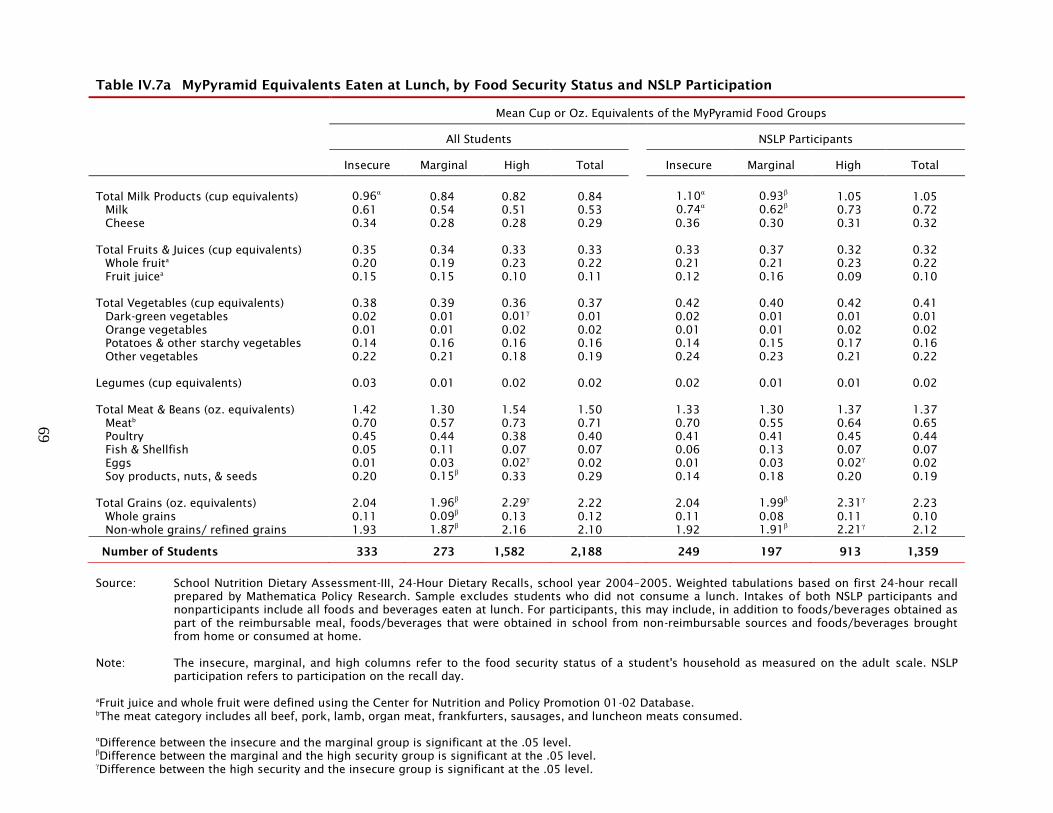
69
Table IV.7a MyPyramid Equivalents Eaten at Lunch, by Food Security Status and NSLP Participation
Mean Cup or Oz. Equivalents of the MyPyramid Food Groups
All Students NSLP Participants
Insecure Marginal High Total Insecure Marginal High Total
Total Milk Products (cup equivalents) 0.96α 0.84 0.82 0.84 1.10
α 0.93
β 1.05 1.05
Milk 0.61 0.54 0.51 0.53 0.74α 0.62
β 0.73 0.72
Cheese 0.34 0.28 0.28 0.29 0.36 0.30 0.31 0.32
Total Fruits & Juices (cup equivalents) 0.35 0.34 0.33 0.33 0.33 0.37 0.32 0.32
Whole fruita
0.20 0.19 0.23 0.22 0.21 0.21 0.23 0.22
Fruit juicea
0.15 0.15 0.10 0.11 0.12 0.16 0.09 0.10
Total Vegetables (cup equivalents) 0.38 0.39 0.36 0.37 0.42 0.40 0.42 0.41
Dark-green vegetables 0.02 0.01 0.01γ 0.01 0.02 0.01 0.01 0.01
Orange vegetables 0.01 0.01 0.02 0.02 0.01 0.01 0.02 0.02
Potatoes & other starchy vegetables 0.14 0.16 0.16 0.16 0.14 0.15 0.17 0.16
Other vegetables 0.22 0.21 0.18 0.19 0.24 0.23 0.21 0.22
Legumes (cup equivalents) 0.03 0.01 0.02 0.02 0.02 0.01 0.01 0.02
Total Meat & Beans (oz. equivalents) 1.42 1.30 1.54 1.50 1.33 1.30 1.37 1.37
Meatb
0.70 0.57 0.73 0.71 0.70 0.55 0.64 0.65
Poultry 0.45 0.44 0.38 0.40 0.41 0.41 0.45 0.44
Fish & Shellfish 0.05 0.11 0.07 0.07 0.06 0.13 0.07 0.07
Eggs 0.01 0.03 0.02γ 0.02 0.01 0.03 0.02
γ 0.02
Soy products, nuts, & seeds 0.20 0.15β 0.33 0.29 0.14 0.18 0.20 0.19
Total Grains (oz. equivalents) 2.04 1.96β 2.29
γ 2.22 2.04 1.99
β 2.31
γ 2.23
Whole grains 0.11 0.09β 0.13 0.12 0.11 0.08 0.11 0.10
Non-whole grains/ refined grains 1.93 1.87β 2.16 2.10 1.92 1.91
β 2.21
γ 2.12
Number of Students 333 273 1,582 2,188 249 197 913 1,359
Source: School Nutrition Dietary Assessment-III, 24-Hour Dietary Recalls, school year 2004–2005. Weighted tabulations based on first 24-hour recall
prepared by Mathematica Policy Research. Sample excludes students who did not consume a lunch. Intakes of both NSLP participants and
nonparticipants include all foods and beverages eaten at lunch. For participants, this may include, in addition to foods/beverages obtained as
part of the reimbursable meal, foods/beverages that were obtained in school from non-reimbursable sources and foods/beverages brought
from home or consumed at home.
Note: The insecure, marginal, and high columns refer to the food security status of a student's household as measured on the adult scale. NSLP
participation refers to participation on the recall day.
a
Fruit juice and whole fruit were defined using the Center for Nutrition and Policy Promotion 01-02 Database.
b
The meat category includes all beef, pork, lamb, organ meat, frankfurters, sausages, and luncheon meats consumed.
αDifference between the insecure and the marginal group is significant at the .05 level.
βDifference between the marginal and the high security group is significant at the .05 level.
γDifference between the high security and the insecure group is significant at the .05 level.

70
Table IV.7b Regression-Adjusted MyPyramid Equivalents Eaten at Lunch
Mean Cup or Oz. Equivalents of the MyPyramid Food Groups
All Students
NSLP Participants
Insecure Marginal High Total Insecure Marginal High Total
Total Milk Products (cup equivalents) 0.91α 0.77 0.84 0.84 1.12
α 0.92
β 1.05 1.04
Milk 0.56 0.48 0.53 0.53 0.76α 0.63 0.72 0.71
Cheese 0.31 0.26 0.29 0.29 0.35 0.27 0.32 0.32
Total Fruits & Juices (cup equivalents) 0.34 0.34 0.33 0.33 0.31 0.34 0.33 0.33
Whole fruita
0.20 0.19 0.23 0.22 0.21 0.19 0.23 0.22
Fruit juicea
0.14 0.15 0.10 0.11 0.11 0.15 0.09 0.10
Total Vegetables (cup equivalents) 0.36 0.38 0.37 0.37 0.42 0.42 0.41 0.41
Dark-green vegetables 0.02 0.01 0.01γ 0.01 0.02 0.01 0.01
γ 0.01
Orange vegetables 0.01 0.01 0.02 0.02 0.01 0.01 0.02 0.02
Potatoes & other starchy vegetables 0.14 0.17 0.16 0.16 0.15 0.17 0.17 0.16
Other vegetables 0.19 0.19 0.19 0.19 0.23 0.22 0.22 0.22
Legumes (cup equivalents) 0.03α 0.01 0.02
γ 0.02 0.02 0.01 0.02 0.02
Total Meat & Beans (oz. equivalents) 1.58 1.47 1.48 1.50 1.27 1.34 1.38 1.36
Meatb
0.71 0.65 0.71 0.71 0.61 0.56 0.66 0.64
Poultry 0.48 0.45 0.38 0.40 0.46 0.44 0.43 0.44
Fish & Shellfish 0.07 0.10 0.07 0.07 0.06 0.11 0.07 0.08
Eggs 0.00 0.02 0.03γ 0.02 0.00
α 0.03 0.03
γ 0.02
Soy products, nuts, & seeds 0.31 0.25 0.30 0.30 0.14 0.20 0.19 0.19
Total Grains (oz. equivalents) 2.10 2.02β 2.27 2.22 2.10 2.06 2.28 2.23
Whole grains 0.12 0.10 0.13 0.12 0.11 0.07 0.11 0.10
Non-whole grains/ refined grains 1.98 1.92β 2.14 2.10 1.99 1.98 2.18 2.12
Number of Students 333 273 1,582 2,188 249 197 913 1,359

Table IV.7b (continued)
71
Source: School Nutrition Dietary Assessment-III, 24-Hour Dietary Recalls, school year 2004–2005. Weighted tabulations based on first 24-hour
recall prepared by Mathematica Policy Research. Sample excludes students who did not consume a lunch. Intakes of both NSLP
participants and nonparticipants include all foods and beverages eaten at lunch. For participants, this may include, in addition to
foods/beverages obtained as part of the reimbursable meal, foods/beverages that were obtained in school from non-reimbursable
sources and foods/beverages brought from home or consumed at home.
Note: The insecure, marginal, and high columns refer to the food security status of a student's household as measured on the adult scale.
NSLP participation refers to participation on the recall day. All mean estimates have been regression-adjusted for differences in
personal, family, and school characteristics between food security groups including age, sex, household income relative to poverty,
ethnicity, height, region and several other characteristics listed in Appendix B.
a
Fruit juice and whole fruit were defined using the Center for Nutrition and Policy Promotion 01-02 Database.
b
The meat category includes all beef, pork, lamb, organ meat, frankfurters, sausages, and luncheon meats consumed.
αDifference between the insecure and the marginal group is significant at the .05 level.
βDifference between the marginal and the high security group is significant at the .05 level.
γDifference between the high security and the insecure group is significant at the .05 level.

Children’s Food Security and School Meals Mathematica Policy Research
72
secure and the highly secure are not significant (except in the cheese and soy-nuts-seeds categories).
The differences between the insecure and the highly secure are still significant for all major food
groups, except vegetables.
Table IV.8b shows that the results that are regression-adjusted for school meal participation
and many other characteristics differ from the unadjusted results (Table IV.8a). Since participation is
highly correlated with lower food security, the unadjusted results are more informative for the
question of the role of school meals in the diets of less-food-secure children overall. The results that
are limited to participants only (columns 6 through 8 of Table IV.8a) and the results that control for
participation and other characteristics (Table IV.8b) are relevant to the question of whether there are
differences across the food security groups beyond the differences in participation rates. Columns 6
through 8 of Table IV.8a show that the higher proportion of on-menu foods in the diets of the food
insecure relative to the highly secure is not due solely to the higher participation rates of the
insecure.
D. Conclusions
The goal of this chapter was to describe the school-day diets of less-food-secure children
relative to highly secure children. In general, there were few differences between the insecure and
the highly secure in terms of the nutrients and foods consumed at breakfast, lunch, and over 24
hours. The marginally secure consumed less than both the insecure and the highly secure over 24
hours. This is a result partially of differences at lunch and breakfast, but roughly 50 percent is due to
differences during the rest of the day.
The contribution of school foods was higher for the marginally secure and the insecure than for
the highly secure. Lower school meal participation among the highly secure explains part of this
difference, but even among participants, the insecure and marginally secure obtained a higher
proportion of their nutrients and major food groups from school meals.

73
Table IV.8a Proportion of 24 Hour MyPyramid Equivalents Contributed by On-Menu School Foods, by Food Security Status and
NSLP or SBP Participation
Proportion of Mean Cup or Oz. Equivalents of the MyPyramid Food Groups
All Students NSLP or SBP Participants
Insecure Marginal High Total Insecure Marginal High Total
Total Milk Products 0.46 0.40β 0.28
γ 0.32 0.56 0.49 0.45
γ 0.47
Milk 0.52 0.42β 0.32
γ 0.36 0.63
α 0.51 0.50
γ 0.52
Cheese 0.38 0.39β 0.23
γ 0.27 0.46 0.47
β 0.38 0.40
Total Fruits & Juices 0.29 0.26β 0.17
γ 0.19 0.36 0.32 0.28
γ 0.30
Whole fruita
0.33 0.34β 0.22
γ 0.24 0.39 0.41 0.35 0.37
Fruit juicea
0.25 0.21β 0.13
γ 0.15 0.32 0.25 0.21
γ 0.23
Total Vegetables 0.26 0.28β 0.18
γ 0.20 0.32 0.34 0.28 0.30
Dark-green vegetables 0.36 0.25 0.13γ 0.18 0.43 0.33 0.25
γ 0.29
Orange vegetables 0.43 0.25 0.19γ 0.23 0.49 0.30 0.31 0.34
Potatoes & other starchy vegetables 0.26 0.29 0.20 0.22 0.30 0.34 0.31 0.32
Other vegetables 0.27 0.26β 0.16
γ 0.19 0.33 0.30 0.26 0.28
Legumes 0.29 0.18 0.16 0.18 0.33 0.20 0.22 0.23
Total Meat & Beans 0.37 0.31β 0.20
γ 0.24 0.45 0.37 0.31
γ 0.35
Meatb
0.44 0.42β 0.30
γ 0.34 0.53 0.52 0.46 0.49
Poultry 0.33 0.38β 0.27 0.29 0.37 0.46 0.44 0.43
Fish & Shellfish 0.20 0.29 0.15 0.17 0.29 0.38 0.22 0.25
Eggs 0.27 0.28 0.18 0.20 0.33 0.34 0.28 0.29
Soy products, nuts, & seeds 0.44 0.49β 0.29
γ 0.33 0.54 0.59
β 0.46 0.48
Total Grains 0.28 0.26β 0.18
γ 0.20 0.35 0.32 0.30
γ 0.31
Whole grains 0.35 0.33β 0.20
γ 0.23 0.41 0.39 0.32 0.34
Non-whole grains/ refined grains 0.29 0.26β 0.19
γ 0.21 0.36 0.32 0.31
γ 0.32
Number of Students 348 284 1,638 2,270 262 203 951 1,416

Table IV.8a (continued)
74
Source: School Nutrition Dietary Assessment-III, 24-Hour Dietary Recalls, school year 2004–2005. Weighted tabulations based on first 24-hour
recall prepared by Mathematica Policy Research. Sample for NSLP or SBP participants includes all students who participated in one or
more of the school meal programs (1,044 students participated only in NSLP, 316 in both, and 56 only in SBP).
Note: The insecure, marginal, and high columns refer to the food security status of a student's household as measured on the adult scale.
NSLP or SBP participation refers to participation on the recall day.
a
Fruit juice and whole fruit were defined using the Center for Nutrition and Policy Promotion 01-02 Database.
b
The meat category includes all beef, pork, lamb, organ meat, frankfurters, sausages, and luncheon meats consumed.
αDifference between the insecure and the marginal group is significant at the .05 level.
βDifference between the marginal and the high security group is significant at the .05 level.
γDifference between the high security and the insecure group is significant at the .05 level.
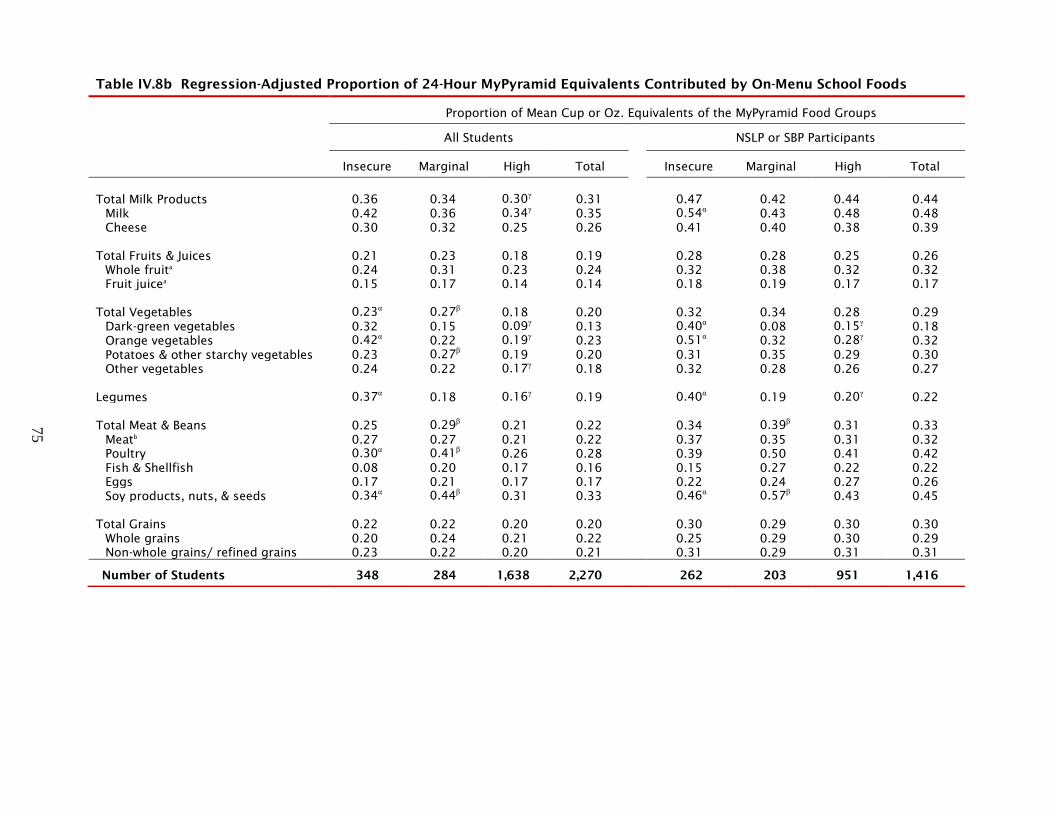
75
Table IV.8b Regression-Adjusted Proportion of 24-Hour MyPyramid Equivalents Contributed by On-Menu School Foods
Proportion of Mean Cup or Oz. Equivalents of the MyPyramid Food Groups
All Students
NSLP or SBP Participants
Insecure Marginal High Total Insecure Marginal High Total
Total Milk Products 0.36 0.34 0.30γ 0.31 0.47 0.42 0.44 0.44
Milk 0.42 0.36 0.34γ 0.35 0.54
α 0.43 0.48 0.48
Cheese 0.30 0.32 0.25 0.26 0.41 0.40 0.38 0.39
Total Fruits & Juices 0.21 0.23 0.18 0.19 0.28 0.28 0.25 0.26
Whole fruita
0.24 0.31 0.23 0.24 0.32 0.38 0.32 0.32
Fruit juicea
0.15 0.17 0.14 0.14 0.18 0.19 0.17 0.17
Total Vegetables 0.23α 0.27
β 0.18 0.20 0.32 0.34 0.28 0.29
Dark-green vegetables 0.32 0.15 0.09γ 0.13 0.40
α 0.08 0.15
γ 0.18
Orange vegetables 0.42α 0.22 0.19
γ 0.23 0.51
α 0.32 0.28
γ 0.32
Potatoes & other starchy vegetables 0.23 0.27β 0.19 0.20 0.31 0.35 0.29 0.30
Other vegetables 0.24 0.22 0.17γ 0.18 0.32 0.28 0.26 0.27
Legumes 0.37α 0.18 0.16
γ 0.19 0.40
α 0.19 0.20
γ 0.22
Total Meat & Beans 0.25 0.29β 0.21 0.22 0.34 0.39
β 0.31 0.33
Meatb
0.27 0.27 0.21 0.22 0.37 0.35 0.31 0.32
Poultry 0.30α 0.41
β 0.26 0.28 0.39 0.50 0.41 0.42
Fish & Shellfish 0.08 0.20 0.17 0.16 0.15 0.27 0.22 0.22
Eggs 0.17 0.21 0.17 0.17 0.22 0.24 0.27 0.26
Soy products, nuts, & seeds 0.34α 0.44
β 0.31 0.33 0.46
α 0.57
β 0.43 0.45
Total Grains 0.22 0.22 0.20 0.20 0.30 0.29 0.30 0.30
Whole grains 0.20 0.24 0.21 0.22 0.25 0.29 0.30 0.29
Non-whole grains/ refined grains 0.23 0.22 0.20 0.21 0.31 0.29 0.31 0.31
Number of Students 348 284 1,638 2,270 262 203 951 1,416

Table IV.8b (continued)
76
Source: School Nutrition Dietary Assessment-III, 24-Hour Dietary Recalls, school year 2004–2005. Weighted tabulations based on first 24-hour
recall prepared by Mathematica Policy Research. Sample for NSLP or SBP participants includes all students who participated in one or
more of the school meal programs (1,044 students participated only in NSLP, 316 in both, and 56 only in SBP).
Note: The insecure, marginal, and high columns refer to the food security status of a student's household as measured on the adult scale.
NSLP or SBP participation refers to participation on the recall day. All mean estimates have been regression-adjusted for differences
in personal, family, and school characteristics between food security groups including age, sex, household income relative to
poverty, ethnicity, height, region and several other characteristics listed in Appendix B.
a
Fruit juice and whole fruit were defined using the Center for Nutrition and Policy Promotion 01-02 Database.
b
The meat category includes all beef, pork, lamb, organ meat, frankfurters, sausages, and luncheon meats consumed.
αDifference between the insecure and the marginal group is significant at the .05 level.
βDifference between the marginal and the high security group is significant at the .05 level.
γDifference between the high security and the insecure group is significant at the .05 level.
Children’s Food Security and School Meals Mathematica Policy Research
77
V. PERCENTAGE OF SCHOOL LUNCH FOODS CONSUMED
This chapter addresses our third research question, which asked whether food-insecure and
marginally food-secure children who participate in the school lunch program consume larger
fractions of school menu items (relative to the portions served) and waste less than other
participants. We did not find evidence to support this hypothesis—proportions wasted were
generally similar across food security groups. However, these data provide interesting information
on plate waste in school meals in general. A limitation of this work is that we cannot observe school
meal items that were selected or served but not consumed at all. They are not counted as wasted, as
they were not reported in dietary recalls. In addition, students can purchase school meal items à la
carte or share or trade them with friends and thus consume more than one serving. However, these
limitations apply to students at all levels of food security. This work is a first attempt to compare
recall and menu survey portion sizes in order to estimate plate waste in school meals, which may be
useful in future research.
A. Method for Estimating Percentage Consumed/Plate Waste in School
Meals
Previous research on nutrition programs has generally measured plate waste out of concern
about whether resources are used efficiently, so as to minimize costs. The focus here is to assess
differences between children with varying levels of food security in how much they consumed (and,
implicitly, how much they left on their plates) relative to the portion size offered, as an indicator of
their potential need for school meals. Regardless of the reason for studying plate waste, previous
studies have generally measured it in one of three ways: (1) direct measurement of participants’
plates before and after they eat (weighing or otherwise measuring amounts); (2) visual assessment of
plate waste by trained observers; or (3) dietary recall interviews in which participants are asked to
report all foods selected and portion sizes served, as well as the amount consumed (Buzby and
Guthrie 2002). None of these approaches was used in SNDA-III.

Children’s Food Security and School Meals Mathematica Policy Research
78
Given the data available, this study focused on foods consumed as part of school meals, and
assessed the “percentage of portion consumed” by matching foods reported in dietary recalls to the
school menu foods, for which the data included the typical amount offered. To construct the
percentage-consumed variable, we needed to know the portion size offered on the school lunch
menu and the portion size the child reported consuming.1 However, the typical portion size of the
school lunch menu item was not always available.2 The “percentage of portion consumed” is thus
defined only for school lunch participants and only for foods consumed that were on the school
lunch menu (coded as “on menu”).3 As noted, this measure can be constructed only for foods that
students reported eating. Foods served to or selected by students as part of the school lunch that
were not eaten are not reported in the SNDA-III recall data. Hence, the percentage-consumed
variable is always greater than zero.4 Thus, the proportion not consumed is a measure of plate waste
for items selected from the school menu that were at least tasted.
In construction of the percentage-consumed variable, the first step was to match the foods in
the recall data to the SNDA-III school lunch menu data. Each food reported by SNDA-III sample
members during the dietary recall interview (during which interviewers enter detailed food
descriptions and amounts consumed) was assigned a USDA food code and associated nutrient
amounts. As discussed in Chapter II, the SNDA-III study team developed a variable that designated
which foods in the recall data were “on the menu” for the school lunch or breakfast on the target
day. To construct the variable, they matched foods in the dietary recall data that students said were
1 Portion sizes were measured in grams.
2 The portion sizes of individual items offered as part of a self-serve food bar (e.g., salad bar) or prepackaged lunch were not available in the school lunch menu data. This will be discussed in detail later in this chapter.
3 This measure could also have been created for on-menu breakfast items, but given the small sample of SBP participants and the exploratory nature of this analysis, we focused on items served at lunch.
4 Some students reported eating just a small taste of certain foods (consuming less than 1 percent of the portion).

Children’s Food Security and School Meals Mathematica Policy Research
79
obtained in school during lunch to the corresponding school menu data on foods offered at lunch.
When they found a match, they coded the recall food as “on menu.”
To improve the accuracy of the data, the SNDA-III team often replaced the food code and
nutrients of the on-menu recall food with those of the matched menu survey food as well as well as
marking the “on-menu” indicator.. For these foods, we could easily determine the menu food they
were matched with (because the detailed food code was the same) and extract information on the
portion size offered from the menu data file. However, a challenge in creating the percentage-
consumed variable was that nearly half the on-menu recall foods did not have their nutrients
replaced, so the recall food record did not have an ithe food code for the specific menu food
matched to it. We used multiple strategies sequentially in matching the recall foods and the menu
foods, as shown in Figure V.1 and described in detail in Appendix B. The first major step, restricting
the sample to on-menu foods, involved using the variable constructed as part of the SNDA-III
study to select foods that had previously been matched to the menu data. The remaining steps
involved reconstructing that match as part of this study. In the end, we matched fully 95 percent of
on-menu foods to a menu record that indicated the “portion size offered.” Most of the remaining
five percent did not have a specific portion in the menu data (for example, some self-serve items).
We analyzed the data on percentage consumed separately for each menu food group used in
NSLP food-based menu planning (milk, entrees or meat/meat alternates, vegetables, fruits, and
grains) and each food security group.5 Table V.1 first shows a categorical breakdown of the
percentage consumed among NSLP participants who consumed that food group at lunch on the
5 Note that the menu food groups used in this chapter are different from the MPE groups used in Chapter IV. To
assess vegetable MPEs, we summed the number of servings of vegetables consumed by each student across all foods eaten at the meal that contained any vegetables, whereas in this chapter we calculated the percentage of vegetables consumed only for foods that were reported as discrete vegetable items. For example, the vegetables in a serving of lasagna are not included in the percentage of vegetables consumed, because the lasagna would be classified as an entrée and the percentage of the entire entrée consumed is what is identifiable from the data.

Children’s Food Security and School Meals Mathematica Policy Research
80
Figure V.1 Matching Process to Obtain Portion Offered for Dietary Recall Foods from
SNDA-III Menu Survey Data
Lunch Foods Consumed by NSLP
Participants (n = 5,304)
Note: See Appendix B for additional details. Major and minor food groups are
whole food categories used in SNDA-III (Gordon et al. 2007b, Appendix D).
Match to Menu Foods by Exact
USDA Food Code
Select “On-Menu” Foods
(n = 3,770)
Match by Major and Minor
Food Group
Manual Matching by Nutritionist
n = 3,130 matched
n = 342 matched
n = 118 matched
n = 3,590
Final Sample
n = 180 not matched –
dropped from sample
n = 298 not matched
n = 640 not matched

Children’s Food Security and School Meals Mathematica Policy Research
81
Table V.1 Percentage of School Lunch Portions Consumed by NSLP Participants, by Food
Security Status
Food Group
Food Insecure
Participants
Marginally Secure
Participants
Highly Secure
Participants All Participantsa
Milk *
(0, 45%)b
4.3 3.7 4.6 4.4
[45, 90)c
18.3 27.2 17.7 19.0
[90, 110) 76.1 68.6 74.0 73.7
[110, 190) 0.5 0.0 0.3 0.3
[190, 210) 0.8 0.6 3.3 2.5
210% or more 0.0 0.0 0.1 0.1
Mean 90.1 86.0 91.9 90.9
(Standard Error) (2.6) (2.9) (1.6) (1.3)
Median 99.1 99.8 100.0 100.0
Sample Size 175 117 635 927
Weighted % d
76.9 66.7 73.1 72.8
Vegetables
(0, 45%)b
25.5 25.6 25.4 25.4
[45, 90)c
33.6 36.5 31.8 32.7
[90, 110) 17.2 19.1 17.5 17.7
[110, 190) 11.9 14.2 16.3 15.3
[190, 210) 4.1 1.0 4.1 3.7
210% or more 7.7 3.7 4.9 5.2
Mean 93.2 79.2 90.8 89.8
(Std. Error) (15.8) (7.8) (6.2) (5.8)
Median 66.2 57.2 70.8 68.2
Sample Size 98 74 363 535
Weighted % d
42.2 38.6 41.8 41.4
Fruits
(0, 45%)b
4.7 13.1 8.9 8.7
[45, 90)c
34.1 25.8 24.4 26.4
[90, 110) 35.6 28.1 40.7 38.0
[110, 190) 10.3 23.9 18.1 17.5
[190, 210) 10.7 5.4 5.0 6.1
210% or more 4.5 3.8 3.0 3.4
Mean 110.8 104.9 100.9 103.3
(Standard Error) (11.2) (11.0) (4.1) (4.5)
Median 99.8 98.3 99.7 99.8
Sample Size 80 59 246 385
Weighted % d
36.9 33.2 31.7 32.7

Children’s Food Security and School Meals Mathematica Policy Research
82
Food Group
Food Insecure
Participants
Marginally Secure
Participants
Highly Secure
Participants All Participantsa
Entrée or
Meat/Meat
Alternative
(0, 45%)b
12.6 13.0 12.9 12.8
[45, 90)c
18.5 25.4 16.4 18.1
[90, 110) 56.2 45.1 53.1 52.5
[110, 190) 9.4 11.2 11.0 10.8
[190, 210) 1.5 2.5 3.4 2.9
210% or more 1.8 2.8 3.3 3.0
Mean 91.6 94.2 98.4 96.6
(Standard Error) (4.2) (5.2) (3.3) (2.8)
Median 98.0 96.2 100.0 100.0
Sample Size 208 162 696 1,066
Weighted % d
85.8 85.3 78.5 80.6*
Grains
(0, 45%)b
15.1 -- 14.5 14.1
[45, 90)c
17.9 -- 27.0 26.7
[90, 110) 48.1 -- 47.1 46.7
[110, 190) 11.0 -- 6.2 7.0
[190, 210) 5.6 -- 3.9 3.8
210% or more 2.3 -- 1.4 1.7
Mean 95.1 -- 86.3 87.4
(Standard Error) (8.1) -- (5.3) (4.6)
Median 99.4 -- 100.0 100.0
Sample Size 51 23 191 265
Weighted % d
18.7 12.7 24.0 22.6*
Source: School Nutrition Dietary Assessment-III, 24-hour Dietary Recalls, school year 2004-2005.
Weighted tabulations based on first 24-hour recall, prepared by Mathematica Policy Research.
Note: The insecure, marginal, and high columns refer to the food security status of a student's
household as measured by the adult scale. NSLP participation refers to participation on the
recall day.
-- Statistics not reported due to small sample size of marginally secure NSLP participants who
reported eating grains at lunch.
a
Stars in the “All Participants” column represent the results of chi-squared tests across the food security
categories and the percentage consumed categories. The means were also compared (15 independent
two-tailed t-tests). No significant differences in the means were found across any of the groups for any of
the meal components.
b
The (0, 45%) row shows the percent of the sample that consumed greater than 0 percent and less than 45
percent.
c
The [45, 90) row shows the percent of the sample that consumed greater than or equal to 45 percent and
less than 90 percent.
d
The “Weighted %” row shows the weighted percent of the sample that consumed any food in that food
group. The denominator is all NSLP participants in that food security group. These were compared using a
chi-squared test for each food group. Only entrees and grains reached the level of statistical significance.
*=Significantly different at the .05 level. **=Significantly different at the .01 level.
Children’s Food Security and Intakes from School Meals Mathematica Policy Research
83
recall day. Next, the average and the median percentage consumed are listed for each food group.
Appendix B provides details on the construction of the variables and the analysis.
B. Results
Results for All Students. Overall, vegetables had the lowest median percentage consumed of
any of the food groups, at 68 percent, whereas the median percentage consumed for each of the
other four food groups was 100 percent (see Table V.1). Fully 58 percent of participants who had a
vegetable at lunch consumed less than 90 percent of it, and 25 percent of participants consumed less
than 45 percent. The distribution of the percentage consumed of the other food groups was much
more concentrated in the range of 90 to 110 percent.
Some students reported eating more than 100 percent of the portion offered. Such findings may
reflect general measurement error in 24-hour recalls and the particular challenge of estimating
portion sizes. In addition, some percentages greater than 100 percent may reflect problems in
matching data from two different sources. Nonetheless, there are small spikes in the distributions
around 200 percent consumed, which suggests that some participants may have consumed two
entire portions. Furthermore, 24 percent of participants who reported eating vegetables and 27
percent who reported eating fruits said that they consumed over 110 percent of the portion offered,
compared to 17 percent for entrees, 13 percent for grains, and 3 percent for milk. Fruits and
vegetables may be the food groups where it is easiest to ask for (or take) a second serving or part of
a second serving, because USDA guidance encourages serving additional fruits and vegetables.
Additional servings of fruits or vegetables or other foods may also be available à la carte or through
trading or sharing with other students.6
6 Looking specifically at vegetables, we found that most of the reported multiple servings were for French fries.

Children’s Food Security and Intakes from School Meals Mathematica Policy Research
84
Results by Food Security Status. There are almost no significant differences among the food
security groups in the percentages consumed of the major food groups. Using the categorical
breakdown of the percentage consumed shown in Table V.1, we applied chi-squared tests across the
three groups to test for statistical significance. The only significant finding is for milk, which appears
to be driven by the fact that over 30 percent of marginally secure participants consumed less than 90
percent of their milk portions, compared to roughly 22 percent of the food insecure or the highly
food secure. We also compared the mean percentages consumed within each food group using two-
tailed t-tests of the differences between the food security groups taken two at a time. No significant
differences were found.
Percentages consumed for foods in each group, such as for fruits or vegetables, were calculated
among those who ate some of a discrete fruit or vegetable at lunch. We were concerned that the
results could be distorted if highly food-secure students reported eating fruits or vegetables at lunch
more (or less) often than less-secure students. However, the percentage of NSLP participants who
had a fruit or vegetable at lunch does not vary much across the three food security groups (see the
Weighted % rows in Table V.1).
If food-insecure students consistently wasted less, it might indicate that they had unmet need,
but these data do not support such concerns. Nonetheless, the small sample sizes of students who
ate something from some of the food groups limit the power to detect differences between the food
security groups.

Children’s Food Security and School Meals Mathematica Policy Research
85
VI. FOOD SECURITY AND BREAKFAST SKIPPING
In previous chapters, we examined intakes at breakfast only for students who ate breakfast and
intakes at lunch only for students who ate lunch. Therefore, for a full description of the patterns of
intakes by food security status, we must also examine meal-skipping behavior. Particularly important
is breakfast skipping, which is more common than lunch skipping. This chapter examines the
relationship between food security status and meal skipping by children and adolescents.
Meal skipping is defined by the timing and eating-occasion names that the children reported for
each food consumed during the 24-hour recall period. In the SNDA-III data, breakfast foods are all
foods eaten between 5 A.M. and 9:30 A.M., plus foods that students called breakfast and ate between
9:30 A.M. and 10:30 A.M.1 If a student did not report consuming any foods classified as breakfast
foods, then that student was counted as having skipped breakfast. But consuming even a very small
amount of food during these times was counted as having eaten breakfast. Similarly, lunch foods
included all foods eaten between 10 A.M. and 2 P.M., unless reported as a breakfast food, and also
foods that students called lunch and ate between 2 P.M. and 3:30 P.M.2 If students did not report
consuming any lunch foods, then they were counted as having skipped lunch.
Breakfast skipping was relatively common among students overall (13 percent skipped
breakfast) but it was almost twice as common among the marginally secure (21 percent) and insecure
(20 percent) students as among the highly food-secure students (11 percent) (Table VI.1). Among
students who attended schools that served breakfast, food-insecure and marginally secure students
were still roughly twice as likely as the highly secure to skip breakfast. Breakfast skipping was most
common among secondary school students (18 percent skipped breakfast). At the secondary level,
1 We classified as breakfast a few reported breakfasts eaten before 5 A.M. or after 10:30 A.M., after checking that no
other breakfast was reported and, in the case of the late breakfasts, that late lunches were also reported.
2 We also counted as lunch food all foods eaten from 9:30 A.M. to 10 A.M. and reported as lunch, supper, or dinner.

Children’s Food Security and School Meals Mathematica Policy Research
86
Table VI.1 Meal Skipping Behavior and Food Security Status
Percentage of students Insecure Marginal High Total
All Students
Consume Both 79.1 75.9β
88.3γ 85.7
Skip Lunch 3.3 3.8 2.5 2.7
Skip Breakfast 19.5 20.8β
10.5γ
12.8
Skip Breakfast (students at schools w/
breakfast) 19.2 21.5β 11.3
γ 13.7
Predicted Skip Breakfast a
16 19 β 12
Sample Size 348 284 1,638 2,270
Secondary Students
Consume Both 69.4 65.6β 83.6
γ 79.3
Skip Lunch 5.8 6.9 3.6 4.3
Skip Breakfast 28.0 28.3β 14.2
γ 18.0
Skip Breakfast (students at schools w/
breakfast) 27.3 30.4β 15.3
γ 19.1
Predicted Skip Breakfast a
25 25β 17
γ
Sample Size 260 209 1,083 1,552
Source: SNDA-III 24-hour Dietary Recalls, school year 2004-2005. Weighted tabulations
based on first 24-hour recall prepared by Mathematica Policy Research.
Note: The insecure, marginal, and high columns refer to the food security status of a
student's household as measured by the adult scale.
α,β, and γ represent the results from individual χ2
tests for all rows except the predicted
breakfast skipping row: α
Difference between the insecure and the marginal group is significant at the .05 level.
β
Difference between the marginal and the high security group is significant at the .05 level.
γ
Difference between the high security and the insecure group is significant at the .05 level.
a
For predicted row α, β, and γ are from logistic regressions with controls for the food security
status of each student and whether they attend a school that serves breakfast as well as age,
sex, and other socioeconomic differences that may influence breakfast-skipping behavior.

Children’s Food Security and School Meals Mathematica Policy Research
87
less-food-secure students were also about twice as likely as highly food-secure students to skip
breakfast, even among students who attended schools that served breakfast.3
Lunch skipping was much less common overall—only 3 percent of students skipped lunch
(Table VI.1). Although marginally secure and insecure students had slightly higher rates of skipping
lunch (4 percent and 3 percent of them skipped lunch, respectively, compared to 2 percent for
highly food-secure students)— these rates are not significantly different.4 Very few students skipped
both lunch and breakfast. Therefore, we focus on breakfast skipping for the rest of this chapter.
Of course, the relationship between food security status and breakfast skipping may in fact
reflect other characteristics of the less-food-secure children. To examine this possibility, we
estimated multivariate models of breakfast skipping, including indicator variables for children from
food-insecure and marginally secure families, with children from highly food-secure families as the
omitted category.5 The adjusted predicted probability of skipping breakfast for each food security
group is shown in the next-to-last row of each panel in Table VI.1.
When controlling for a wide range of characteristics, the difference between marginally food-
secure and highly food-secure students in their predicted likelihood of skipping breakfast was similar
in magnitude to the unadjusted difference and statistically significant at the p<.05 level. However,
the difference between insecure and highly secure students in their predicted probability of skipping
breakfast was slightly smaller than the unadjusted difference and no longer significant at the p<.05
3 Since breakfast skipping (and lunch skipping) is more common among older students and there is a tendency for
insecure and marginally secure students to be older, we wanted to verify that we saw the same pattern when considering secondary-school students only. Among secondary students who attended schools that served breakfast, 27 percent of the insecure, 30 percent of the marginally secure, and 15 percent of the highly secure skipped breakfast.
4 Among secondary students, 6 percent of the insecure, 7 percent of the marginally secure, and 4 percent of the highly secure skipped lunch (not shown in table). These rates are also not significantly different.
5 See Appendix B for a detailed discussion of the model and its results.

Children’s Food Security and School Meals Mathematica Policy Research
88
level (although significant at the p<.10 level).6 The findings that skipping breakfast was more
common for older students and less-food-secure students are consistent with previous literature,
which also notes that breakfast skipping is more common among adolescents than among younger
children, and among children of low versus higher socioeconomic status (Rampersaud et al. 2005;
Affenito 2007; Berkey et al. 2003).
Skipping breakfast would be of less concern if skippers made up for needed calories or
nutrients later in the day. However, regardless of food security status, breakfast skippers did not
make up the calories during the rest of the day by eating more snacks or consuming more at other
meals (Table VI.27). This finding is also consistent with previous research (Rampersaud et al. 2005).
Average calories consumed over the 24-hour recall period were significantly lower for breakfast
skippers than for other students (1,691 compared to 2,173). Furthermore, breakfast skippers
consumed significantly fewer calories over the day within each of the three food security groups:
insecure, marginally secure, and highly secure. Of more concern, breakfast skippers, overall and
within each of the three groups, also had significantly lower 24-hour intakes of key nutrients,
including vitamin A, vitamin B6, vitamin B12, calcium, iron, magnesium, potassium, and dietary fiber.8
Examining background characteristics of breakfast skippers and consumers provides additional
insight into how these groups of children differ (Table VI.3). Among the food insecure and in the
overall sample, breakfast skippers were significantly poorer than consumers, which may indicate an
unmet need for SBP breakfasts. Within each food security category, skippers and consumers were
about as likely to have applied for free or reduced-price meals, although for the full sample, skippers
were significantly more likely to have applied than consumers (61 percent versus 51 percent).
6 In contrast, for secondary school students, even after controlling for other characteristics, food-insecure students
are still significantly more likely to skip breakfast than highly secure students at the p<.05 level. 7 This table presents weighted means which have not been regression adjusted.
8 Breakfast skippers also had less sodium and saturated fat.
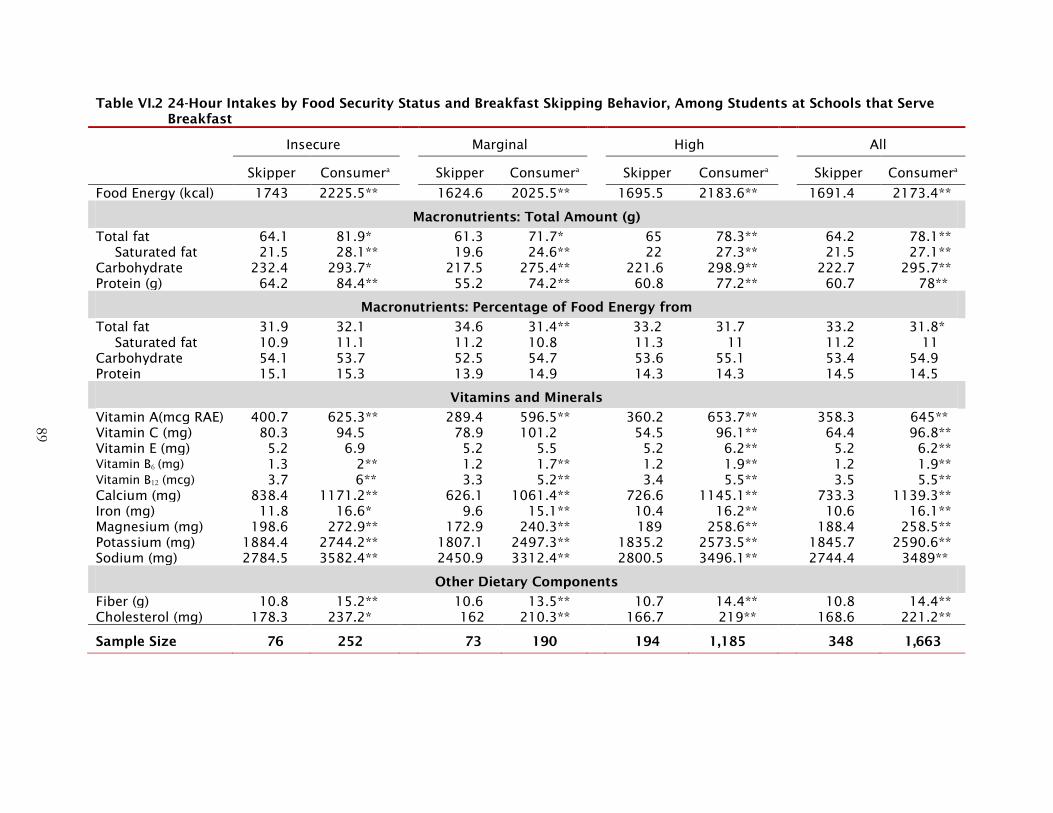
89
Table VI.2 24-Hour Intakes by Food Security Status and Breakfast Skipping Behavior, Among Students at Schools that Serve
Breakfast
Insecure Marginal High All
Skipper Consumer
a
Skipper Consumera
Skipper Consumera
Skipper Consumera
Food Energy (kcal) 1743 2225.5** 1624.6 2025.5** 1695.5 2183.6** 1691.4 2173.4**
Macronutrients: Total Amount (g)
Total fat 64.1 81.9* 61.3 71.7* 65 78.3** 64.2 78.1**
Saturated fat 21.5 28.1** 19.6 24.6** 22 27.3** 21.5 27.1**
Carbohydrate 232.4 293.7* 217.5 275.4** 221.6 298.9** 222.7 295.7**
Protein (g) 64.2 84.4** 55.2 74.2** 60.8 77.2** 60.7 78**
Macronutrients: Percentage of Food Energy from
Total fat 31.9 32.1 34.6 31.4** 33.2 31.7 33.2 31.8*
Saturated fat 10.9 11.1 11.2 10.8 11.3 11 11.2 11
Carbohydrate 54.1 53.7 52.5 54.7 53.6 55.1 53.4 54.9
Protein 15.1 15.3 13.9 14.9 14.3 14.3 14.5 14.5
Vitamins and Minerals
Vitamin A(mcg RAE) 400.7 625.3** 289.4 596.5** 360.2 653.7** 358.3 645**
Vitamin C (mg) 80.3 94.5 78.9 101.2 54.5 96.1** 64.4 96.8**
Vitamin E (mg) 5.2 6.9 5.2 5.5 5.2 6.2** 5.2 6.2**
Vitamin B6 (mg) 1.3 2** 1.2 1.7** 1.2 1.9** 1.2 1.9**
Vitamin B12 (mcg) 3.7 6** 3.3 5.2** 3.4 5.5** 3.5 5.5**
Calcium (mg) 838.4 1171.2** 626.1 1061.4** 726.6 1145.1** 733.3 1139.3**
Iron (mg) 11.8 16.6* 9.6 15.1** 10.4 16.2** 10.6 16.1**
Magnesium (mg) 198.6 272.9** 172.9 240.3** 189 258.6** 188.4 258.5**
Potassium (mg) 1884.4 2744.2** 1807.1 2497.3** 1835.2 2573.5** 1845.7 2590.6**
Sodium (mg) 2784.5 3582.4** 2450.9 3312.4** 2800.5 3496.1** 2744.4 3489**
Other Dietary Components
Fiber (g) 10.8 15.2** 10.6 13.5** 10.7 14.4** 10.8 14.4**
Cholesterol (mg) 178.3 237.2* 162 210.3** 166.7 219** 168.6 221.2**
Sample Size 76 252 73 190 194 1,185 348 1,663

Table VI.2 (continued)
90
Source: School Nutrition Dietary Assessment-III, 24-Hour Dietary Recalls, school year 2004–2005. Weighted tabulations based on
first 24-hour recall prepared by Mathematica Policy Research. Means are not regression adjusted.
Note: The insecure, marginal, and high columns refer to the food security status of a student's household as measured by the
adult scale.
a
Consumers are students that reported consuming some breakfast foods on the recall day. Stars in the consumer column represent
the results of two tailed t-tests comparing consumers to skippers. *=Significantly different at the .05 level. **=Significantly different
at the .01 level.
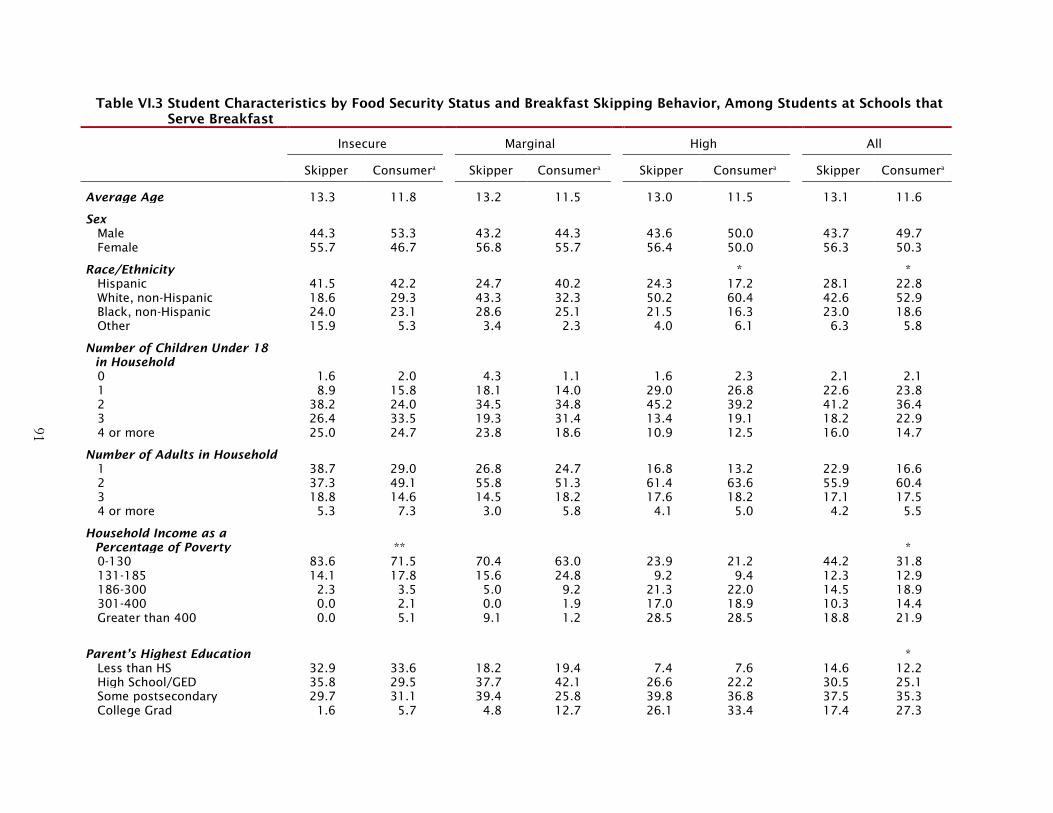
91
Table VI.3 Student Characteristics by Food Security Status and Breakfast Skipping Behavior, Among Students at Schools that
Serve Breakfast
Insecure Marginal High All
Skipper Consumer
a
Skipper Consumera
Skipper Consumera
Skipper Consumera
Average Age 13.3 11.8 13.2 11.5 13.0 11.5 13.1 11.6
Sex
Male 44.3 53.3 43.2 44.3 43.6 50.0 43.7 49.7
Female 55.7 46.7 56.8 55.7 56.4 50.0 56.3 50.3
Race/Ethnicity
* *
Hispanic 41.5 42.2 24.7 40.2 24.3 17.2 28.1 22.8
White, non-Hispanic 18.6 29.3 43.3 32.3 50.2 60.4 42.6 52.9
Black, non-Hispanic 24.0 23.1 28.6 25.1 21.5 16.3 23.0 18.6
Other 15.9 5.3 3.4 2.3 4.0 6.1 6.3 5.8
Number of Children Under 18
in Household
0 1.6 2.0 4.3 1.1 1.6 2.3 2.1 2.1
1 8.9 15.8 18.1 14.0 29.0 26.8 22.6 23.8
2 38.2 24.0 34.5 34.8 45.2 39.2 41.2 36.4
3 26.4 33.5 19.3 31.4 13.4 19.1 18.2 22.9
4 or more 25.0 24.7 23.8 18.6 10.9 12.5 16.0 14.7
Number of Adults in Household
1 38.7 29.0 26.8 24.7 16.8 13.2 22.9 16.6
2 37.3 49.1 55.8 51.3 61.4 63.6 55.9 60.4
3 18.8 14.6 14.5 18.2 17.6 18.2 17.1 17.5
4 or more 5.3 7.3 3.0 5.8 4.1 5.0 4.2 5.5
Household Income as a
Percentage of Poverty ** *
0-130 83.6 71.5 70.4 63.0 23.9 21.2 44.2 31.8
131-185 14.1 17.8 15.6 24.8 9.2 9.4 12.3 12.9
186-300 2.3 3.5 5.0 9.2 21.3 22.0 14.5 18.9
301-400 0.0 2.1 0.0 1.9 17.0 18.9 10.3 14.4
Greater than 400 0.0 5.1 9.1 1.2 28.5 28.5 18.8 21.9
Parent’s Highest Education *
Less than HS 32.9 33.6 18.2 19.4 7.4 7.6 14.6 12.2
High School/GED 35.8 29.5 37.7 42.1 26.6 22.2 30.5 25.1
Some postsecondary 29.7 31.1 39.4 25.8 39.8 36.8 37.5 35.3
College Grad 1.6 5.7 4.8 12.7 26.1 33.4 17.4 27.3

Table VI.3 (continued)
92
Insecure Marginal High All
Skipper Consumer
a
Skipper Consumera
Skipper Consumera
Skipper Consumera
Parent’s Hours Worked per
Week
0 26.6 29.6 27.8 32.9 23.2 23.2 25.4 24.9
1-20 21.9 18.6 19.8 14.8 9.9 11.8 14.0 13.1
21-35 4.8 11.7 11.5 10.9 12.8 14.1 10.7 13.7
36-40 31.9 25.9 27.4 27.1 29.8 30.3 29.7 29.4
More than 40 14.8 14.1 13.4 14.3 24.3 20.6 20.1 18.9
Applied for Free/Reduced Price
Meals 94.2 94.3 91.4 85.3 40.5 37.1 60.7 50.5**
Eats School Lunch at least once
a weekb
93.0 94.2 90.4 91.5 83.9 85.6 87.2 87.6
Eats School Lunch at least three
times a weekb
87.3 85.9 73.1 82.6 63.4 69.8 70.4 73.4
NSLP Participant (on recall day) 69.8 79.3 68.0 81.8 50.6 59.4* 57.9 64.8
Eats School Breakfast at least
once a weekb
66.2 83.8 50.2 72.5 41.5 45.3 48.0 53.7
Eats School Breakfast at least
three times a weekb
19.6 55.9** 16.9 46.6** 13.5 26.7** 15.2 32.8**
SBP Participant (on recall day) 0.0 45.4** 0.0 33.0** 0.0 19.3** 0.0 24.6**
Sample Size 76 252 73 190 194 1,185 348 1,663
Source: SNDA-III Parent Interviews, school year 2004-2005. Tabulations are weighted to be nationally representative of students in public NSLP
schools.
Note: The insecure, marginal, and high columns refer to the food security status of a student's household as measured by the adult scale.
a
Consumers are students that reported consuming some breakfast foods on the recall day. Stars in the consumer column represent the results of
chi-squared tests comparing consumers to skippers. *=Significantly different at the .05 level. **=Significantly different at the .01 level.
b
Based on child’s response if available about usual breakfast or lunch participation. If not available, parent’s response was used.

Children’s Food Security and School Meals Mathematica Policy Research
93
Skippers were as likely as consumers to report eating a school lunch at least once a week (87 percent
of both groups) and were not significantly less likely to eat a school lunch on the recall day (except
among the highly food secure). Insecure and marginal skippers were not significantly less likely than
corresponding consumers to report eating a school breakfast at least once a week (about 66 percent
of insecure skippers and 50 percent of marginally secure skippers did). However, they were
significantly less likely than consumers to report eating a school breakfast three times per week
(about 15 to 20 percent of skippers versus about 50 percent of consumers).
Among adolescents, obesity, inactivity, and poor health all have been associated with skipping
breakfast (Rampersaud et al. 2005). All these issues were somewhat more common among less-food-
secure students in the SNDA-III data, but highly food-secure breakfast skippers were also more
likely than highly food-secure consumers to have some of these characteristics (Table VI.4). In
particular, highly food-secure breakfast skippers and skippers overall were significantly more likely to
be overweight or obese than the respective groups of breakfast consumers. Insecure breakfast
skippers and consumers show the same pattern, but it is not statistically significant. However,
marginally secure skippers and consumers have very similar distributions of weight status. Breakfast
skippers were generally less likely to participate in school- or community-organized sports—again,
the marginal group is the exception. Finally, breakfast skippers in each group were less likely than
consumers to be in excellent health and more likely to be in good, fair, or poor health, although the
differences between skippers and consumers were significant only for the full sample.
An important caveat concerning these results is that breakfast skippers may be underreporting
their consumption or eating less in an attempt to lose weight (although our models controlled for
reported dieting, secondary students may not want to have reported dieting, and elementary students
were not asked the question). Because breakfast skippers were more likely to be overweight or
obese, they must have consumed more calories than they used over time more than breakfast
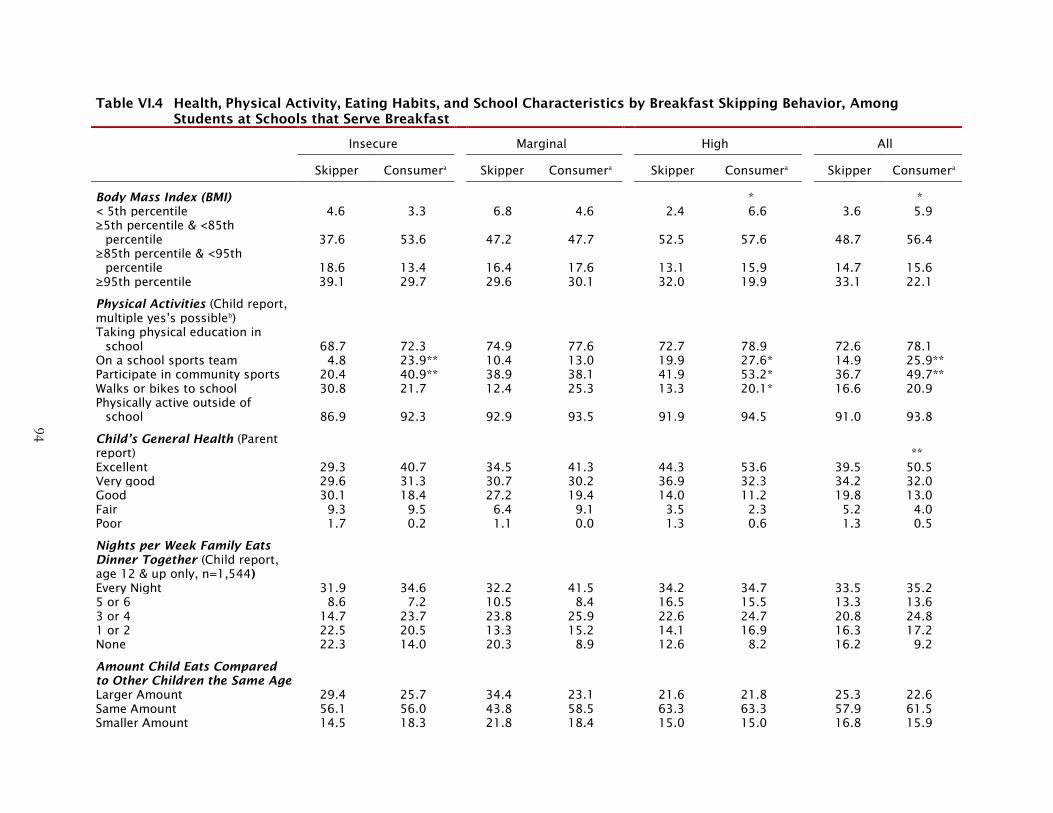
94
Table VI.4 Health, Physical Activity, Eating Habits, and School Characteristics by Breakfast Skipping Behavior, Among
Students at Schools that Serve Breakfast
Insecure Marginal High All
Skipper Consumer
a
Skipper Consumera
Skipper Consumera
Skipper Consumera
Body Mass Index (BMI) * *
< 5th percentile 4.6 3.3 6.8 4.6 2.4 6.6 3.6 5.9
≥5th percentile & <85th
percentile 37.6 53.6 47.2 47.7 52.5 57.6 48.7 56.4
≥85th percentile & <95th
percentile 18.6 13.4 16.4 17.6 13.1 15.9 14.7 15.6
≥95th percentile 39.1 29.7 29.6 30.1 32.0 19.9 33.1 22.1
Physical Activities (Child report,
multiple yes’s possibleb
)
Taking physical education in
school 68.7 72.3 74.9 77.6 72.7 78.9 72.6 78.1
On a school sports team 4.8 23.9** 10.4 13.0 19.9 27.6* 14.9 25.9**
Participate in community sports 20.4 40.9** 38.9 38.1 41.9 53.2* 36.7 49.7**
Walks or bikes to school 30.8 21.7 12.4 25.3 13.3 20.1* 16.6 20.9
Physically active outside of
school 86.9 92.3 92.9 93.5 91.9 94.5 91.0 93.8
Child’s General Health (Parent
report) **
Excellent 29.3 40.7 34.5 41.3 44.3 53.6 39.5 50.5
Very good 29.6 31.3 30.7 30.2 36.9 32.3 34.2 32.0
Good 30.1 18.4 27.2 19.4 14.0 11.2 19.8 13.0
Fair 9.3 9.5 6.4 9.1 3.5 2.3 5.2 4.0
Poor 1.7 0.2 1.1 0.0 1.3 0.6 1.3 0.5
Nights per Week Family Eats
Dinner Together (Child report,
age 12 & up only, n=1,544)
Every Night 31.9 34.6 32.2 41.5 34.2 34.7 33.5 35.2
5 or 6 8.6 7.2 10.5 8.4 16.5 15.5 13.3 13.6
3 or 4 14.7 23.7 23.8 25.9 22.6 24.7 20.8 24.8
1 or 2 22.5 20.5 13.3 15.2 14.1 16.9 16.3 17.2
None 22.3 14.0 20.3 8.9 12.6 8.2 16.2 9.2
Amount Child Eats Compared
to Other Children the Same Age
Larger Amount 29.4 25.7 34.4 23.1 21.6 21.8 25.3 22.6
Same Amount 56.1 56.0 43.8 58.5 63.3 63.3 57.9 61.5
Smaller Amount 14.5 18.3 21.8 18.4 15.0 15.0 16.8 15.9

95
Table VI.4 (continued)
Insecure Marginal High All
Skipper Consumer
a
Skipper Consumera
Skipper Consumera
Skipper Consumera
Pickiness
Very picky eater 20.4 30.5 31.3 30.4 24.7 19.1 25.0 21.8
Somewhat picky eater 57.6 45.0 48.7 29.9 43.9 45.0 47.5 43.5
Not a picky eater 22.0 24.5 20.0 39.7 31.4 35.8 27.5 34.7
In past 30 days, ate less or
chose foods low in fat or
carbohydrates to lose weight
(age 12 or above only, n=1,563) 42.7 34.0 41.7 35.7 25.7 28.4 32.4 29.7
Percentage of Students
Certified for Free or Reduced
Lunch
Low (< 20%) 13.1 24.0 22.5 32.2 33.6 34.5 27.4 32.6
Medium (20-60%) 48.1 35.9 45.3 37.1 42.2 45.0 43.7 42.7
High (> 60%) 38.9 40.1 32.2 30.7 24.2 20.6 28.9 24.7
School Type ** ** ** **
Elementary 20.9 49.9 21.4 50.7 33.8 53.1 29.0 52.4
Middle 37.5 23.5 40.6 23.1 28.9 18.6 33.1 19.8
High 41.6 26.6 38.0 26.3 37.4 28.3 37.9 27.7
Sample Size 76 252 73 190 194 1,185 348 1,663
Source: SNDA-III Parent and Child Interviews, school year 2004-2005. Tabulations are weighted to be nationally representative of
students in public NSLP schools. BMI was calculated by Mathematica. Other data are from Parent Interview unless
otherwise noted.
Note: The insecure, marginal, and high columns refer to the food security status of a student's household as measured by the
adult scale.
a
Consumers are students that reported consuming some breakfast foods on the recall day. Stars in the consumer column represent
the results of chi-squared tests comparing consumers to skippers. *=Significantly different at the .05 level. **=Significantly different
at the .01 level.
b
Since multiple yes’s are allowed with respect to a child’s physical activities, chi-squared tests were performed individually for each
activity.
c
Based on 2003-04 U.S. Department of Education Common Core of Data.

Children’s Food Security and School Meals Mathematica Policy Research
96
consumers. In turn, differential underreporting of either eating or dieting may contribute to the differences in
reported calorie consumption of skippers and consumers.

Children’s Food Security and School Meals Mathematica Policy Research
97
VII. CONCLUSION
The descriptive results from this study provide policy-relevant information but also raise
questions for future research. While school meals play an important role in the diets of students
from food-insecure and marginally secure households, one day of dietary intake provides only a
snapshot, which cannot give us a full understanding of this role. In addition, the reasons these
students did not take full advantage of school meals are unclear.
A. Key Findings
Food-insecure children were more disadvantaged than highly food-secure children in many respects, such as income, family structure, and parental education. Marginally food-secure children fell between the other two groups in most cases, but they were generally more similar to food-insecure than to highly food-secure children.
Although large proportions of less-food-secure children (over 75 percent) ate a school lunch on the recall day, far fewer ate a school breakfast (37 percent of food-insecure and 26 percent of marginally secure students).
On school days, students from food-insecure households consumed, on average, levels of calories, nutrients, and MPEs from major food groups similar to the levels consumed by students from highly food-secure households.
Students from marginally food-secure households consumed fewer calories and nutrients on a typical school day than students from insecure or highly secure households.
Less food-secure students (the insecure or marginally secure) obtained higher proportions of their daily calories, nutrients, and foods from on-menu school foods than highly secure students. This is partially explained by the higher participation rates of the less secure, but even among school meal participants, some differences among the food security groups persist.
Food security status was not significantly related to the percentage of offered portions eaten by participants at lunch, but samples were small because we could calculate this measure only for NSLP participants who ate an on-menu food from the specific food group being considered.
Insecure and marginally secure students skipped breakfast at a rate twice as high as that of highly secure students—about 21 percent of the less secure skipped versus 11 percent of the highly food secure, despite the fact that more than 80 percent of the less secure were eligible for free or reduced-price meals. Secondary-school students skipped breakfast much more frequently than elementary students at all levels of food security.
Regardless of food security status, breakfast skippers, on average, did not make up calories missed later in the day.
Breakfast skippers tended to be from households with lower incomes than consumers, to be obese more often, and to have lower reported health status. These patterns held

Children’s Food Security and School Meals Mathematica Policy Research
98
for both insecure and highly secure breakfast skippers, but not for marginally secure skippers.
B. Two Puzzles
These findings leave us with two puzzles for researchers and policymakers.
1. Why Did So Many Less-Secure Children Skip Breakfast, When the SBP Was Available?
Less-food-secure students repeated skipping breakfast at twice the rate of highly food-secure
students, even though most insecure and marginally secure students qualified for free or reduced-
price breakfasts and attended schools that offered them. These students were more likely to either
skip breakfast or to consume an SBP breakfast (see Tables III.1 and VI.1). This suggests that they
have more limited access to breakfast at home and that there were barriers or costs to SBP
participation for the group that skipped breakfast, even when the meal was free or very low in cost.
Given that about half the less-secure breakfast skippers reported participating in the SBP at
least once a week (see Table VI.3), children who skipped breakfast were often aware of the SBP and
at least somewhat interested in participating. On the specific day covered by the dietary recall (and,
since few participated regularly, on some other days), they may have faced barriers that made
participation difficult. Such barriers could be in their family life, in their relationships with peers, in
their neighborhoods, or in school policies that affected the convenience or attractiveness of school
breakfasts; they could also have reflected unobserved behavioral issues (such as sleeping late or
skipping class).
2. Why Did Marginally Food-Insecure Children Eat Less, on Average, than Both Food- Insecure and Highly Food-Secure Children?
A second puzzle is that marginally food-secure children consumed fewer calories on average
than both insecure and highly secure children despite skipping breakfast at roughly the same rate as
insecure children (unadjusted). However, after adjusting for other factors, marginally secure children
were slightly more likely to skip breakfast (refer back to Table VI.1). Marginally secure skippers were
less likely than insecure skippers to report eating an SBP breakfast at least once a week (50 percent

Children’s Food Security and School Meals Mathematica Policy Research
99
versus 66 percent). Marginally secure breakfast consumers were less likely than insecure consumers
to participate in the SBP on the recall day (33 percent versus 45 percent)
Overall, parents of marginally food-secure children were less likely than parents of food-
insecure children to report having applied for free or reduced-price school meals, even though over
80 percent of both groups had incomes at or below 185 percent of poverty. However, marginally
secure children were more likely than insecure children to be eligible only for reduced-price and not
free school meals (Table III.1). Having to pay the reduced price may be a barrier to participation for
marginally food-secure students, particularly for school breakfasts, which may be less attractive than
lunches because of stigma or inconvenience.
Students from insecure and marginally food-secure families may experience more volatility than
highly secure students in their family situations and the challenges they face. The results on usual
SBP participation among breakfast skippers support this hypothesis. Although caution should be
used in generalizing the results from one day and from these relatively small samples, they suggest
some interesting areas for future research, including analysis of differences in usual intakes, studies
of patterns of breakfast skipping over time, and exploration of barriers to SBP participation and
how they may be reduced.


Children’s Food Security and School Meals Mathematica Policy Research
101
REFERENCES
Affenito, S. ―Breakfast: A Missed Opportunity.‖ Journal of the American Dietetic Association, vol. 107, no.4, pp. 565–569.
Alaimo, Katherine, Christine M. Olsen, and Edward A. Frongillo Jr.. ―Low Family Income and Food Insufficiency in Relation to Overweight in Children: Is There a Paradox?‖ Archives of Pediatrics and Adolescent Medicine, vol. 155, no. 10, 2001, pp. 1161–1167.
Bartfeld, J., M. Kim, J. Ryu, and H-M. Ahn. ―The School Breakfast Program: Participation and Impacts.‖ Contractor and Cooperator Report No. 54. Washington, DC: U.S. Department of Agriculture, Economic Research Service, July 2009.
Berkey, C. S., H. R. H. Rockett, M. W. Gillman, A. E. Field, and G. A. Colditz. ―Longitudinal Study of Skipping Breakfast and Weight Change in Adolescents.‖ International Journal of Obesity, vol. 27, 2003, pp. 1258–1266.
Besharov, Douglas J. ―We’re Feeding the Poor as if They’re Starving.‖ The Washington Post, December 8, 2002. Retrieved from http://www.aei.org/publications/filter.all,pubID. 31/pub_detail.asp on May 14, 2008.
Bhargava, Alok, Dean Jolliffe, and Larry L. Howard. ―Socioeconomic, behavioural and environmental factors predicted body weights and household food insecurity scores in the Early Childhood Longitudinal Study—Kindergarten,‖ British Journal of Nutrition, vol. 100, no. 2, 2008, pp. 438–444.
Bhattacharya, Jayanta, Janet Currie, and Steven Haider. ―Evaluating the Impact of School Nutrition Programs.‖ Final Report to the U.S. Department of Agriculture, Economic Research Service. Washington, DC: USDA, ERS, 2004a.
Bhattacharya, Jayanta, Janet Currie, and Steven Haider. ―Poverty, Food Insecurity, and Nutritional Outcomes in Children and Adults.‖ Journal of Health Economics, vol. 23, no. 4, 2004b, pp. 839–862.
Briefel, Ronette, Jonathan Jacobson, Nancy Clusen, Teresa Zavitsky, Miki Satake, Brittany Dawson, and Rhoda Cohen. ―The Emergency Food Assistance System: Findings from the Client Survey. Final Report.‖ Washington, DC: Mathematica Policy Research, July 2003.
Bronte-Tinkew, Jacinta, Martha Zaslow, Randolph Capps, Allison Horowitz, and Michelle McNamara. ―Food Insecurity Works through Depression, Parenting, and Infant Feeding to Influence Overweight and Health in Toddlers.‖ Journal of Nutrition, vol. 137, 2007, pp. 2160–2165.
Casey, Patrick H., Kitty Szeto, Shelly Lensing, Margaret Bogle, and Judy Weber. ―Children in Food-Insufficient, Low-Income Families: Prevalence, Health, and Nutrition Status.‖ Archives of Pediatrics Adolescent Medicine, vol. 155, no. 4, April 1, 2001, pp. 508–514.
Children’s HealthWatch. Children’s HealthWatch Policy Action Brief: Even Very Low Levels of Food Insecurity Found to Harm Children’s Health. May, 2009. Retrieved from

Children’s Food Security and School Meals Mathematica Policy Research
102
http://www.childrenshealthwatch. org/upload/resource/LowLevelFoodInsecurityBrief5_09.pdf on May 2009.
Dunifon, Rachel, and Lori Kowaleski-Jones. ―The Influences of Participation in the National School Lunch Program and Food Insecurity on Child Well-Being.‖ Social Service Review, vol. 77, no. 1, 2003, pp. 72–92.
Dunifon, Rachel, and Lori Kowaleski-Jones. ―Exploring the Influence of the National School Lunch Program on Children.‖ IRP Discussion Paper No. 1277-04. Madison, WI: University of Wisconsin-Madison, 2004.
Fox, Mary Kay, Melissa Clark, Elizabeth Condon, and Ander Wilson. ―Diet Quality of School-Aged Children in the United States and Association with Participation in the School Meal Programs.‖ Cambridge, MA: Mathematica Policy Research, forthcoming.
Gleason, Philip, Ronette Briefel, Ander Wilson, and Allison Hedley Dodd. ―School Meal Program Participation and Its Association with Dietary Patterns and Obesity.‖ Final report submitted to the U.S. Department of Agriculture, Economic Research Service. Princeton, NJ: Mathematica Policy Research, July 2009.
Gleason, P., and C. Suitor. ―Children’s Diets in the Mid-1990s: Dietary Intake and Its Relationship with School Meal Participation.‖ Special Nutrition Programs, Report No. CN-01-CD1. Alexandria, VA: U.S. Department of Agriculture, Food and Nutrition Service, 2001.
Gordon, Anne, Mary Kay Crepinsek, Renée Nogales, and Elizabeth Condon. ―School Nutrition Dietary Assessment Study-III: Volume I: School Food Service, School Food Environment, and Meals Offered and Served.‖ Princeton, NJ: Mathematica Policy Research, November 2007a.
Gordon, Anne, Mary Kay Fox, Melissa Clark, Renée Nogales, Elizabeth Condon, Philip Gleason, and Ankur Sarin. ―School Nutrition Dietary Assessment Study-III: Volume II: Student Participation and Dietary Intakes.‖ Princeton, NJ: Mathematica Policy Research, November 2007b.
Gordon, Anne, John Hall, Eric Ziedman, Mary Kay Crepinsek, Melissa Clark, and Elizabeth Condon. ―School Nutrition Dietary Assessment Study-III: Volume III: Sampling and Data Collection.‖ Princeton, NJ: Mathematica Policy Research, November 2007c.
Jyoti, Diana F., Edward A. Frongillo, and Sonya J. Jones. ―Food Insecurity Affects School Children’s Academic Performance, Weight Gain, and Social Skills.‖ Journal of Nutrition, vol. 135, no. 12, December 1, 2005, pp. 2831–2839.
Kleinman, Ronald E., J. Michael Murphy, Michelle Little, Maria Pagano, Cheryl A. Wehler, Kenneth Regal, and Michael S. Jellinek. ―Hunger in Children in the United States: Potential Behavioral and Emotional Correlates.‖ Pediatrics, vol. 101, no. 1, January 1, 1998, p. e3.
Mabli, James, Rhoda Cohen, Frank Potter, and Zhanyun Zhao. ―Hunger in America 2010: National Report Prepared for Feeding America.‖ Princeton, NJ: Mathematica Policy Research, January 2010.

Children’s Food Security and School Meals Mathematica Policy Research
103
Millimet, Daniel L., Rusty Tchernis, and Muna Husain. ―School Nutrition Programs and the Incidence of Childhood Obesity.‖ Journal of Human Resources, forthcoming.
Nord, Mark. ―Food Insecurity in Households with Children.‖ Food Assistance and Nutrition Research Report No. FANRR34-13. Washington, DC: U.S. Department of Agriculture, Economic Research Service, 2003.
Nord, Mark. ―Characteristics of Low-Income Households with Very Low Food Security.‖ U.S. Department of Agriculture Economic Information Bulletin No. 25. Washington, DC: USDA, Economic Research Service, 2007.
Nord, Mark. ―Food Insecurity in Households with Children: Prevalence, Severity, and Household Characteristics.‖ U.S. Department of Agriculture Economic Information Bulletin No. 56. Washington, DC: USDA, Economic Research Service, 2009.
Nord, Mark, and Gary Bickel. ―Measuring Children’s Food Security in U.S. Households, 1995–99.‖ Food Assistance and Nutrition Research Report No. FANRR25. Washington, DC: U.S. Department of Agriculture, Economic Research Service, April 2002.
Nord, Mark, and Kathleen Romig. ―Hunger in the Summer.‖ Journal of Children and Poverty, vol. 12, no. 2, 2006, p. 141-158.
Nord, Mark, and Heather Hopwood. ―Recent Advances Provide Improved Tools for Measuring Children’s Food Security.‖ Journal of Nutrition, vol. 137, no. 3, March 1, 2007, pp. 533–536.
Nusser, S. M., A. L. Carriquiry, K. W. Dodd, and W. A. Fuller. ―A Semiparametric Transformation Approach to Estimating Usual Daily Intake Distributions.‖ Journal of the American Statistical Association, vol. 91, 1996, pp. 1440–1449.
Olson, Christine M. ―Nutrition and Health Outcomes Associated with Food Insecurity and Hunger.‖ Journal of Nutrition, vol. 129, no. 2, February 1, 1999, p. 521.
Rampersaud, Gail C., Mark A. Pereira, Beverly L. Girard, Judi Adams, and Jordan D. Metzl. ―Breakfast Habits, Nutritional Status, Body Weight, and Academic Performance in Children and Adolescents.‖ Journal of the American Dietetic Association, vol. 105, no. 5, 2005, pp.743–760.
Rose, Donald. ―Economic Determinants and Dietary Consequences of Food Insecurity in the United States.‖ Journal of Nutrition, vol. 129, no. 2, February 1, 1999, p. 517.
Schanzenbach, Diane W. ―Do School Lunches Contribute to Childhood Obesity?‖ Journal of Human Resources, vol. 44, no. 3, 2009, pp. 684–709.
U.S. Department of Agriculture. ―Strategic Plan for 2005-2010.‖ Washington, DC: USDA, 2006. Retrieved from http://www.ocfo.usda.gov/usdasp/sp2005/sp2005.pdf on October 15, 2009.
U.S. Department of Agriculture Food and Nutrition Service. ―National School Lunch Program.‖ Washington, DC, USDA, FNS, August 2009a. Retrieved from http://www.fns.usda.gov/cnd/ lunch/AboutLunch/NSLPFactsheet.pdf on October 15, 2009.
Children’s Food Security and School Meals Mathematica Policy Research
104
U.S. Department of Agriculture Food and Nutrition Service. ―The School Breakfast Program.‖ Washington, DC: USDA, FNS, August 2009b. Retrieved from http://www.fns.usda.gov/CND/Breakfast/AboutBFast/SBPFactSheet.pdf on October 15, 2009.
Wilde, Parke E., Lisa M. Troy, and Beatrice L. Rogers. ―Household Food Security and Tradeoffs in the Food Budget of Food Stamp Program Participants: An Engel Function Approach.‖ Contractor and Cooperator Report No. 38. Washington, DC: U.S. Department of Agriculture, Economic Research Service, 2008.
Winicki, J., and K. Jemison. ―Food Insecurity and Hunger in the Kindergarten Classroom: Its Effects on Learning and Growth.‖ Contemporary Economic Policy, vol. 2, no. 1, April 1, 2003, pp.145–157.
APPENDIX A
REGRESSION MODELS AND RESULTS

Children’s Food Security and School Meals Mathematica Policy Research
A.3
This appendix describes the methodology used for the analysis of the regression-adjusted
mean dietary intakes of school meal program participants and nonparticipants. As noted in the
report, less-food-secure students differ from highly food-secure students in many ways, both
observable and unobservable. Because of these differences between food security groups, it is
likely that their dietary intakes would differ even if the school meal programs were not available.
To adjust for some of the underlying differences between the three food security groups, the
mean dietary intakes were regression-adjusted for observable factors that may be correlated with
a student’s food security status, with their decision to participate in the school meal programs
and with their dietary intakes.
The process used to generate the regression-adjusted estimates had two steps. First, linear
regression models of students’ intakes of each nutrient were estimated (both at breakfast or lunch
and over 24 hours), with food security status, NSLP and SBP participation status and other
relevant observable factors included as covariates (Table A.1).1 Second, the estimated
coefficients from the regression models were used to calculate three different predicted intake
levels for each sample member—one assuming they were highly food secure, one assuming
marginally secure, and one assuming food insecure. So the regression-adjusted estimate of mean
intakes for each group was computed as the weighted mean value of the predicted intake levels
assuming all students were members of that group.
The difference between the predicted intakes of the highly food secure and the insecure is
equal to the estimated coefficient on the indicator variable for being food insecure (since being
highly food secure was the reference category). The difference is statistically significant if the
1 Regression models for the “all students” columns were estimated on the full sample of students with
completed 24-hour dietary recalls and parent interviews. For students with two dietary recalls, only the first was
included.

Children’s Food Security and School Meals Mathematica Policy Research
A.4
coefficient is. As in the SNDA-III student-level analyses (Gordon et al. 2007b), standard errors
were adjusted for clustering at the primary sampling units, which in most cases was the local
School Food Authority.
Table A.1 lists the covariates included in the model.2 The model used essentially the same
covariates as those included in the SNDA-III student-level analyses (Gordon et al. 2007b).
Table A.2 presents the full results of these regression models for the energy consumed over the
course of 24 hours for all students and for the NSLP participants. For participants, the
regression-adjusted estimates of mean intakes were computed similarly; however, the weighted
mean value of the predicted intake levels were based on separate regressions only including
participants.
Table A.2 also shows the results from the logistic models that were run to predict breakfast
skipping behavior, as discussed in Chapter VI. These are raw coefficients; selected predicted
probabilities from these models are presented in Table VI.1.
2 When the value for a particular covariate was missing for a particular student, the value for this covariate was
imputed. Across the different covariates included in the analysis, the percentage of sample members with missing
values ranged from zero to 8 percent. Missing values of continuous school-level variables were imputed as the mean
value of that variable by region and grade level (elementary, middle, or high school), and missing values of
continuous student-level variables were imputed as the mean value of that variable by region, grade level, and
gender. Missing values of school-level binary and categorical variables were imputed as the modal value for that
variable by region and grade level, and missing values of student-level binary and categorical variables were
imputed as the modal value for that variable by region, grade level, and gender. The models included 16 imputation
indicators.

Children’s Food Security and School Meals Mathematica Policy Research
A.5
Table A.1 Covariates Included in Regression Models of Mean Dietary Intakes
Covariate Description
Food Insecure A binary variable indicating student’s household was food insecure on
adult scale
Marginally Secure A binary variable indicating student’s household was marginally
secure on adult scale.
NSLP Participation A binary variable indicating the student participated in the NSLP on
the recall day
SBP Participation A binary variable indicating the student participated in the SBP on the
recall day
Female A binary variable indicating the student’s gender
Race/Ethnicity A set of three binary variables indicating the student’s race/ethnicity
Age A set of 12 binary variables indicating the student’s age
Hearty Eater A set of two binary variables indicating how much the student eats
relative to others
Picky Eater A set of two binary variables indicating whether the student is not
picky, somewhat picky, or very picky
Height The student’s height in feet
Food Allergies A binary variable indicating whether the student has food allergies or
special dietary needs
Dieting A binary variable indicating whether the student is on a diet
Dietary Supplement Use A binary variable indicating whether the student takes dietary
supplements
Health Status A set of three binary variables indicating how healthy the student is,
based on parent reports
Physical Activity A set of three binary variables indicating the student’s level of
physical activity relative to others
TV Watching A set of three binary variables indicating the amount of television the
student watches per day
Family Income A set of four binary variables indicating the student’s family income
relative to poverty
Public Assistance A binary variable indicating whether the student’s family receives
public assistance
Number of Children
in Household
A set of two binary variables indicating the number of children in the
household

Children’s Food Security and School Meals Mathematica Policy Research
Table A.1 (continued)
A.6
Covariate Description
Relationship of
Respondent to Student
A binary variable indicating whether the respondent was the student’s
parent or partner of parent (versus guardian or other relative)
Parental Employment A set of four binary variables indicating the employment status of the
student’s parent(s)
Primary Language
Spoken
at Home
A set of two binary variables indicating the primary language spoken
in the student’s home (Spanish, other non-English)
Parental Education A binary variable indicating the highest level of education completed
by the student's parent(s) was college or more.
Family Dining Habits A binary variable indicating whether the student’s family eats dinner
together 5 nights a week or more
School SBP Participation A binary variable indicating whether the student’s school participated
in the SBP
Competitive Foods
Offered During
Mealtimes
A binary variable indicating whether the student’s school offers
competitive foods during mealtimes
Healthy Foods Offered
Competitively
A binary variable indicating whether the student’s school offers
healthy foods in vending machines, snack bars, or school store
Recess A binary variable indicating whether the student’s school offers recess
Urbanicity A set of three binary variables indicating whether the student's school
serves an urban area, urban fringe, town, or rural area
Region A set of six binary variables indicating region of the country in which
the student lives (based on FNS regions)
School Size A set of two binary variables indicating school size
School Poverty Rate A set of two binary variables indicating poverty rate in the school
district
Day of Week A set of four binary variables indicating the day of the week covered
by the student's dietary recall
Imputation Indicators A set of 16 binary variables indicating whether the values of particular
covariates were imputed for that student

Children’s Food Security and School Meals Mathematica Policy Research
A.7
Table A.2 Sample Regression Results
Dependent Variable and Sample
Food Energy over 24 hours
(kcal)
Skip Breakfast
All
NSLP
Participants All Secondary
Food Insecure 61.71 32.76 0.4 0.63*
Marginally Secure -134.55* -213.23** 0.66** 0.58*
NSLP Participation 60.33 . -0.33* -0.28
SBP Participation 131.37* 157.7* . .
Female -362.16** -281.25** 0.37* 0.39*
Black, Non-Hispanic -55.69 -126.77 -0.01 0.22
White, Non-Hispanic 3.33 -67.23 -0.16 -0.11
Other Race, Non-Hispanic 72.9 -20.53 0.01 -0.15
Age 7 -52.08 -7.62 -0.05 .
Age 8 32.28 91.99 -0.42 .
Age 9 50.07 180.6 -0.97 .
Age 10 -47.5 89.46 -1.36 .
Age 11 104.25 219.73 -0.89 1.25
Age 12 -9.48 245.94 -0.76 0.49
Age 13 80.16 444.51* -0.47 0.96
Age 14 -57.16 405.37* -0.17 1.32
Age 15 89.02 466.46* -0.71 1.03
Age 16 167.49 655.34** -0.99 0.76
Age 17 168.47 547.28* -0.92 0.83
Age 18+ 171.74 674.43* -0.79 0.9
Student Eats More than Others 170.02** 142.48 -0.08 -0.15
Student Eats the Same as Others 70.21 55.53 -0.16 -0.1
Student Somewhat Picky Eater -125* -76.3 0.14 -0.18
Student Not Picky Eater -27.98 -3.94 -0.27 -0.6**
Student’s Height in Feet 202.63 155.75 0.81* 0.7*
Student Has Food Allergies or Special
Dietary Needs -31.97 -47.86 -0.14 -0.01
Student on a Diet (Middle & High
School) -296.68** -195.27** 0.12 0.15
Student Takes Dietary Supplements 15.92 105.04* -0.38* -0.59**
Student in Good Health (Parent Report) 49.27 -147.69 0.08 -0.11
Student in Very Good Health (Parent
Report) 78.48 -33.73 -0.1 0.01
Student in Excellent Health (Parent
Report) 168.24* 64.7 -0.33 -0.27
Student About as Physically Active as
Others 36.52 97.76 -0.04 -0.11
Student More Physically Active than
Others 99.11 120.47 -0.08 -0.45
Student Much More Physically Active
than Others 172.94* 155.97 -0.32 -0.49

Children’s Food Security and School Meals Mathematica Policy Research
Table A.2 (continued)
A.8
Dependent Variable and Sample
Food Energy over 24 hours
(kcal)
Skip Breakfast
All
NSLP
Participants All Secondary
Student Watches 0.1 to 1 Hours of TV a
Day 38.2 -31.51 -0.4 -0.16
Student Watches 1.1 to 2.9 Hours of TV
a Day 85.32 0.25 -0.29 -0.15
Student Watches More than 3 Hours of
TV a Day 6.82 -129.95 -0.09 0.17
Family Income 130 to 185 Percent of
Poverty -17.68 33.8 -0.32 -0.64*
Family Income 185 to 300 Percent of
Poverty -178.61** -131.76 0.08 -0.38
Family Income 300 to 400 Percent of
Poverty -91.27 9.98 -0.16 -0.53
Family Income More than 400 Percent
of Poverty -144.35 -166.45 0.33 0
Family Receives Public Assistance -25.65 17.86 -0.18 -0.21
Two Children in Household 11.01 32.78 0.29 0.28
Three or More Children in Household 2.89 37.7 0.06 0.18
Respondent Was Parent or Partner of
Parent 28.66 -148.27 -0.65 -0.48
Two Parents, Both Employed Full Time 91.65 159.99 -0.71* -0.26
Two Parents, One Employed Full Time 24.28 77.27 -0.52 0.07
Two Parents, Neither Employed Full
Time 199.3 415.78** -0.09 0.32
One Parent, Employed, Full Time -6.72 120.67 -0.15 0.27
Primary Language Spoken at Home:
Spanish -99.39 -70.64 0.24 -0.04
Primary Language Spoken at Home:
Other -238.86* -86.95 0.66 0.88*
Highest Level of Parental Education:
College or More 10.87 -39.58 -0.48* -0.28
Family Eats Dinner Together 5+ Nights
a Week 27.18 -33.2 -0.08 -0.06
School Participating in SBP 68.44 121.76 0.36 0.91**
Competitive Foods Offered During
Mealtimes -74.95 -107.57 -0.06 -0.16
Healthy Foods Offered in Vending
Machines, Snack Bars, or School Store -25.34 -77.26 0.07 0.24
School Has Recess (Elementary &
Middle Schools) -47.25 76.94 0.18 0.58*
School Serves Urban Fringe of City -145.49** -134.69* 0.16 -0.05
School Serves Town -202 -303.36** 0.68* -0.3
School Serves Rural Area -127.56* -128.9 0.49* 0.59*
Midwest 33.84 75.54 0.2 0.11
Mountain -39.31 -24.43 0.28 0.04
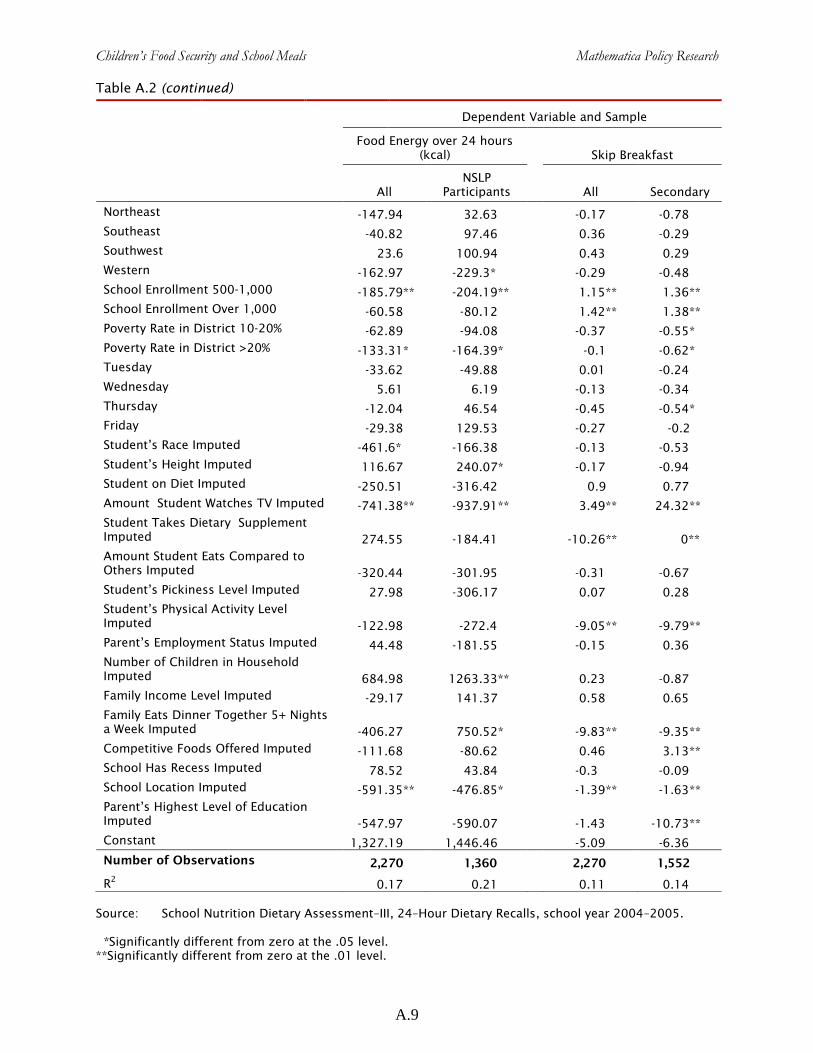
Children’s Food Security and School Meals Mathematica Policy Research
Table A.2 (continued)
A.9
Dependent Variable and Sample
Food Energy over 24 hours
(kcal)
Skip Breakfast
All
NSLP
Participants All Secondary
Northeast -147.94 32.63 -0.17 -0.78
Southeast -40.82 97.46 0.36 -0.29
Southwest 23.6 100.94 0.43 0.29
Western -162.97 -229.3* -0.29 -0.48
School Enrollment 500-1,000 -185.79** -204.19** 1.15** 1.36**
School Enrollment Over 1,000 -60.58 -80.12 1.42** 1.38**
Poverty Rate in District 10-20% -62.89 -94.08 -0.37 -0.55*
Poverty Rate in District >20% -133.31* -164.39* -0.1 -0.62*
Tuesday -33.62 -49.88 0.01 -0.24
Wednesday 5.61 6.19 -0.13 -0.34
Thursday -12.04 46.54 -0.45 -0.54*
Friday -29.38 129.53 -0.27 -0.2
Student’s Race Imputed -461.6* -166.38 -0.13 -0.53
Student’s Height Imputed 116.67 240.07* -0.17 -0.94
Student on Diet Imputed -250.51 -316.42 0.9 0.77
Amount Student Watches TV Imputed -741.38** -937.91** 3.49** 24.32**
Student Takes Dietary Supplement
Imputed 274.55 -184.41 -10.26** 0**
Amount Student Eats Compared to
Others Imputed -320.44 -301.95 -0.31 -0.67
Student’s Pickiness Level Imputed 27.98 -306.17 0.07 0.28
Student’s Physical Activity Level
Imputed -122.98 -272.4 -9.05** -9.79**
Parent’s Employment Status Imputed 44.48 -181.55 -0.15 0.36
Number of Children in Household
Imputed 684.98 1263.33** 0.23 -0.87
Family Income Level Imputed -29.17 141.37 0.58 0.65
Family Eats Dinner Together 5+ Nights
a Week Imputed -406.27 750.52* -9.83** -9.35**
Competitive Foods Offered Imputed -111.68 -80.62 0.46 3.13**
School Has Recess Imputed 78.52 43.84 -0.3 -0.09
School Location Imputed -591.35** -476.85* -1.39** -1.63**
Parent’s Highest Level of Education
Imputed -547.97 -590.07 -1.43 -10.73**
Constant 1,327.19 1,446.46 -5.09 -6.36
Number of Observations 2,270 1,360 2,270 1,552
R2
0.17 0.21 0.11 0.14
Source: School Nutrition Dietary Assessment–III, 24–Hour Dietary Recalls, school year 2004–2005.
*Significantly different from zero at the .05 level.
**Significantly different from zero at the .01 level.


APPENDIX B
CONSTRUCTION OF PERCENTAGE CONSUMED FOR ON-MENU
SCHOOL LUNCH FOODS


Children’s Food Security and School Meals Mathematica Policy Research
B.3
The analysis presented in Chapter V of the “percentage of portion consumed” for specific food
groups focused on foods consumed as part of school lunches, because it was only possible to match
foods that school lunch participants reported in dietary recalls to amounts offered for school menu
foods. The “percentage of portion consumed” is thus the amount consumed (from the recall data)
divided by the portion size offered (from the menu data).1 However, the typical portion size of the
school lunch menu item was not always available.2 The “percentage of portion consumed” is thus
defined only for school lunch participants and only for foods consumed that were on the school
lunch menu (coded as “on menu”) and had a defined portion size.3
To construct the percentage consumed variable, the first step was to match the “on menu”
foods in the recall data to the SNDA-III school lunch menu data. As discussed in Chapter II, the
SNDA-III study team developed a variable that designated which foods in the recall data were “on
the menu” for the school lunch or breakfast on the target day, to help identify school lunch and
breakfast participants.4 In order to construct the variable, foods in the dietary recall data that
students said were obtained in school during lunch were matched to the corresponding school menu
data on foods offered at lunch. When a match was found, the recall food was coded as “on menu.”
This linkage also allowed SNDA-III researchers to replace, in many cases, the nutrients in the
recall data for a particular food with the nutrients associated with the matched food in the school
menu data. The reason for this replacement was that foodservice managers were more likely to
provide detailed and accurate food descriptions than the schoolchildren they served. The recall
1 Portion sizes were measured in grams.
2 The portion sizes of individual items offered as part of a self-serve food bar (e.g., salad bar) or prepackaged lunch were not available in the school lunch menu data. This will be discussed in further detail later in this appendix.
3 This measure could also have been created for on-menu breakfast items, but given the small sample of SBP participants and the exploratory nature of this analysis, we focused on items served at lunch.
4 The on-menu variable from the SNDA-III data set takes on three different values: “not on menu”, “on menu”, and “similar on-menu item.” For the purposes of this study, the latter two categories were both considered on menu and we attempted to determine the portion size for foods in both categories.
Children’s Food Security and School Meals Mathematica Policy Research
B.4
foods with nutrients replaced can easily be matched back to the corresponding menu data to retrieve
the portion size offered, since the recall food was given the same food code as the matched menu
food as part of the linking and nutrient replacement.
Some recall foods did not need to have their nutrients replaced because their food code
matched exactly to a menu food (for example, simple foods such as milk). Determining the amount
offered for theses foods is not a problem, in general, because the food codes matched and the
offered portions for such foods can thus be obtained from the menu data. Besides these foods, there
were 1,133 on-menu foods consumed that could not be matched using the exact USDA food codes
and the school menus from the same day (plus or minus one day) as the recall day. The linking of
the foods that were not exact food code matches to menu foods required additional steps.
First, we broadened our search to school menus that were from days farther away from the
recall day. This is because sometimes schools make last-minute changes to their menus or serve
leftover items from a previous day. Our second strategy for assessing the likely portion size offered
was to attempt to match the recall food to the school menu using SNDA-III major and minor food
groups (the most detailed categories defined in the food grouping system developed specifically for
the SNDA-III data; see Gordon et al. 2007b, Appendix D). These food groupings characterize the
“whole food” as, in the menu data, mixed dishes were generally coded as single items, not as a
combination of items (for example, sandwiches). The groups are based on the meal components
used in USDA meal patterns (meat/meat alternates, milk, vegetables, fruits, and grain/bread items),
but also distinguish desserts, accompaniments (condiments, dressings, sauces that are not integral to
the dish, garnishes), and “other” foods. When we were unable to link recall foods either by matching
with a school menu item from a different day or by matching major and minor food groups, manual
matching was attempted.

Children’s Food Security and School Meals Mathematica Policy Research
B.5
Of the 5,304 foods reported consumed at lunch by NSLP participants, 3,770 (71 percent) were
“on menu” and hence eligible to be matched with a portion size.5 Of the 3,770 on-menu foods, 95
percent (3,590) were successfully matched by one of the methods described above (refer back to
Figure V.1).6 The main reason foods could not be matched to a known portion size is because they
were obtained from a self-serve food bar, such as a salad bar or sandwich bar, or from a
prepackaged lunch. The food-level portion sizes for the items offered on food bars were collected,
but were not linked to the final school menu data for the study, and would not have been very useful
for this purpose, as students could often select multiple servings. Some of the unmatched foods
were multi-component foods, such as sandwiches, where the child reported eating only some
components of the food (for example, eating only the hamburger patty and not the bun). These
foods could not be matched to corresponding portion sizes from the school menu, since the portion
size (in grams) for the menu food did not include separate weights for each component (the patty
and the bun).
Lastly, there were cases where a reported recall food could be matched with more than one
“on-menu” food and a definite match could not be made (for example, a child reported “lettuce”
and the menu included a side salad, an entrée salad, and a salad bar). For these foods, both the
smallest and the largest possible portion size offered were recorded in the data set and the
corresponding lower and upper bounds on the percentage consumed were constructed. For 98
percent of the matched foods, the lower and upper bounds were the same. For foods where there
was a difference between the upper and lower bounds, we used the average percentage consumed
5 Both of these food counts exclude foods that have been classified as accompaniments.
6Among the 3,590 foods matched, 88 percent were matched by food code using the closest matching day in the school menu data (when the recall food did not match to the corresponding menu day, the next closest day was used – 81 percent were from the same week and only 7 percent were from a different week), 10 percent were matched by food group using the closest matching day in the school menu data (9 percent from same week, 1 percent from a different week), and 3 percent were manually matched. Percentages do not add up to 100 percent due to rounding.

Children’s Food Security and School Meals Mathematica Policy Research
B.6
for the purposes of the analysis presented in the text, except that we did not include foods where the
difference between the lower and upper bounds of the percentage consumed was greater than 30
percent (only 21 foods).7
These omissions and the other foods that could not be matched are a non-random set of foods,
and thus have the potential to bias the results. However, since 95 percent of “on-menu” food items
consumed by NSLP participants in the SNDA-III recall data were matched, possible bias in the
statistics reported due to omission of unmatched foods is likely to be small.8
Key limitations of the percentage consumed measure are:
No information on foods taken and completely discarded is available from the dietary recalls.
Because we only have portion size offered information on school meals, the measure can only reflect foods selected from school meals.
Only foods that could be matched to the menu data and were not part of self-serve food bars or prepackaged lunches are included.
Menus provide typical or planned portion sizes, but the extent of variation at the point of service is unknown.
When measures of percentage consumed are aggregated by food group, as in the current analysis, samples become even smaller, as only students who consumed an on-menu food from a particular food group are included in the tabulations for that group.
Analysis Note. Statistics on the percentage of portions consumed were estimated at the
student level. Since it is possible that students might have had more than one fruit or vegetable at
lunch, an average for each student of each food group was constructed by calculating the total
weight in grams each student consumed of that food group and then dividing by the total weight (of
7 The percent difference between the percentage consumed variables was constructed as the difference between the
bounds divided by the upper bound. The average percent difference between the lower and upper bounds of the 36 foods for which there was a difference in the bounds (and the difference was less than 30 percent) was 7 percent.
8 The percentage of food items matched does vary slightly by food group. Specifically, 99.8 percent of milk items were matched with a menu portion size compared to 94.3 percent of vegetables, 94.0 percent of fruits, 92.3 percent of the entrees or meat/meat alternatives, and 93.6 percent of grains.
Children’s Food Security and School Meals Mathematica Policy Research
B.7
those foods) offered to each student.9 Because some food groups were consumed by few students,
sample sizes for the food group means and distributions presented in Table V.1 are sometimes
small. In addition, vegetables and grains were frequently offered as parts of entrees, so some school
menus did not offer separate vegetables or bread/grain items, which further limited the available
sample consuming these items.
9 An alternative method would have simply been to take an average of the percentage consumed of all food items
in each food group at the food level, ignoring the fact that some students had more than two items within that group. However, that method has a small risk of underestimating the amount of food wasted if a student ate 100 percent of a two smaller foods but only 40 percent of a food with a larger portion size in the same group and overestimating the plate waste in the opposite situation. In practice, the food-level averages were very similar to the student-level averages.

www.mathematica-mpr.com
Improving public well-being by conducting high-quality, objective research and surveys
Princeton, NJ ■ Ann Arbor, MI ■ Cambridge, MA ■ Chicago, IL ■ Oakland, CA ■ Washington, DC
Mathematica® is a registered trademark of Mathematica Policy Research