Children and adolescents who try to harm, hurt or kill ...
71
A report of further analysis from the national survey of the mental health of children and adolescents in Great Britain in 1999 Children and adolescents who try to harm, hurt or kill themselves Howard Meltzer Richard Harrington Robert Goodman Rachel Jenkins
Transcript of Children and adolescents who try to harm, hurt or kill ...

A report of furtheranalysis from thenational survey ofthe mental healthof children andadolescents inGreat Britain in 1999
Children and adolescentswho try to harm, hurt orkill themselves
Howard Meltzer
Richard Harrington
Robert Goodman
Rachel Jenkins

Children and adolescentswho try to harm, hurt orkill themselves
Howard Meltzer, Office for National Statistics
Richard Harrington, The University of Manchester, School of Psychiatryand Behavioural Sciences
Robert Goodman, Department of Child and Adolescent Psychiatry,Institute of Psychiatry, London
Rachel Jenkins, WHO Collaborating Centre for Mental Health,Institute of Psychiatry, London
A report of further analysis from thenational survey of the mental healthof children and adolescents in GreatBritain in 1999
Crown copyright 2001Published with the permission of the Controller of
Her Majesty’s Stationery Office (HMSO).
ISBN 1 85774 445 4
Applications for reproduction should be submitted
to HMSO under HMSO’s Class Licence:[email protected]
Alternatively applications can be made in writing to:HMSOLicensing Division
St. Clement’s House2-16 ColegateNorwich
NR3 1BQ
Contact pointsFor enquiries about this publication, contact
Howard MeltzerTel: 020 7533 5391E-mail: [email protected]
To order this publication, call National StatisticsDirect on 01633 812078 or fax 01633 812762.
For general enquiries, contact the National StatisticsPublic Enquiry Service on 0845 601 3034(minicom: 01633 812399)E-mail: [email protected]: 01633 652747
Letters: Room DG/18, 1 Drummond Gate,London SW1V 2QQ
You can also find National Statistics on the Internetat www.statistics.gov.uk
About the Office for National StatisticsThe Office for National Statistics (ONS) is the
government agency responsible for compiling,analysing and disseminating many of the UnitedKingdom’s economic, social and demographic
statistics, including the retail prices index, tradefigures and labour market data, as well as theperiodic census of the population and health
statistics. The Director of ONS is also the NationalStatistician and the Registrar General for Englandand Wales, and the agency that administers the
registration of births, marriages and deaths there.
A National Statistics PublicationNational Statistics are produced to high
professional standards set out in the NationalStatistics Code of Practice. They undergo regularquality assurance reviews to ensure that they meet
customer needs. They are produced free from anypolitical interference.

Contents
page
List of tables 2
Notes to tables 5
Summary of the report 7
1. Background, aims and coverage of the report1.1 Background 111.2 Definition and focus 111.3 Coverage of the report 12
2. Sampling and survey procedures2.1 The sampling frame 132.2 Sampling procedures and response 13
3. Attempts by 5-10 year olds to harm, hurt or kill themselves3.1 Introduction 153.2 Prevalence of self harm 153.3 Characteristics of children who had ever tried to harm,
hurt or kill themselves 21
4. Attempts by 11-15 year olds to harm, hurt or kill themselves4.1 Introduction 294.2 Prevalence of self harm 294.3 Characteristics of children who had ever tried to harm,
hurt or kill themselves 38
5. Comparison of data from different sources5.1 Introduction 495.2 Characteristics of children who had ever tried to harm,
hurt or kill themselves as reported by both parents and children 50
Glossary of terms 61
Addresses 67
Children and adolescents who try to harm, hurt or kill themselves 1
NAVIGATION
Navigate through this document by using Bookmarks, or Links from the Contents or List of tables. There are more sub-categories in the Bookmarks than there are in the Contents . Prevent the printing of these instructions by unchecking ‘Annotations’ in the Print dialogue box.
NAVIGATION
Select the HAND tool. and position it over the Contents list. When an ARROW appears on the hand click the mouse button once to enlarge the text. Continue clicking the arrowed hand tool to advance down the page. When the HAND tool changes to a POINTED FINGER click the mouse button once to link to the listed item.
2 Children and adole
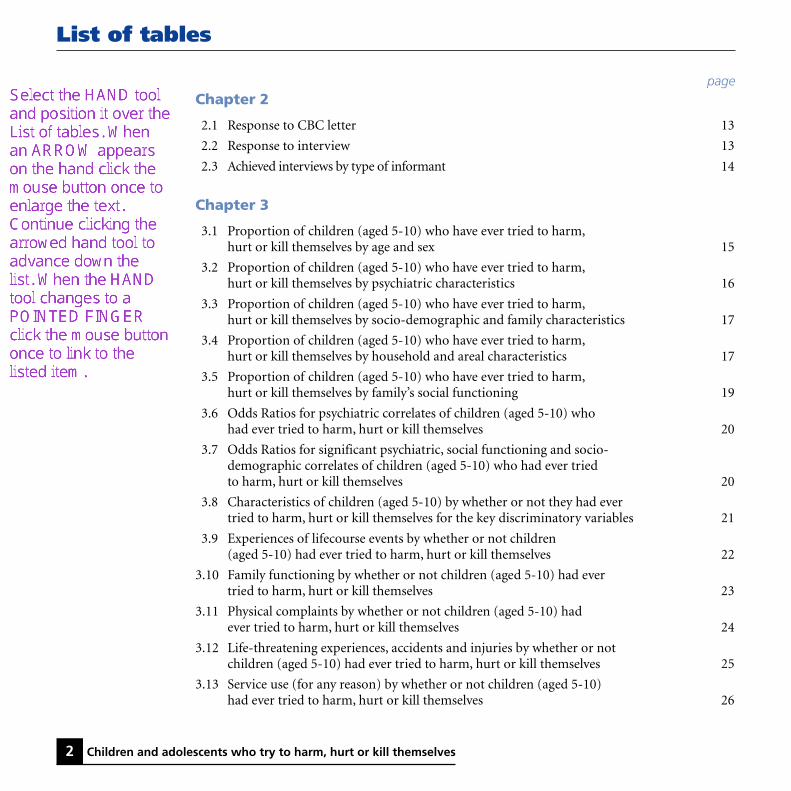
List of tables
page
Chapter 22.1 Response to CBC letter 13
2.2 Response to interview 13
2.3 Achieved interviews by type of informant 14
Chapter 3
3.1 Proportion of children (aged 5-10) who have ever tried to harm,hurt or kill themselves by age and sex 15
3.2 Proportion of children (aged 5-10) who have ever tried to harm,hurt or kill themselves by psychiatric characteristics 16
3.3 Proportion of children (aged 5-10) who have ever tried to harm,hurt or kill themselves by socio-demographic and family characteristics 17
3.4 Proportion of children (aged 5-10) who have ever tried to harm,hurt or kill themselves by household and areal characteristics 17
3.5 Proportion of children (aged 5-10) who have ever tried to harm,hurt or kill themselves by family’s social functioning 19
3.6 Odds Ratios for psychiatric correlates of children (aged 5-10) whohad ever tried to harm, hurt or kill themselves 20
3.7 Odds Ratios for significant psychiatric, social functioning and socio-demographic correlates of children (aged 5-10) who had ever triedto harm, hurt or kill themselves 20
3.8 Characteristics of children (aged 5-10) by whether or not they had evertried to harm, hurt or kill themselves for the key discriminatory variables 21
3.9 Experiences of lifecourse events by whether or not children(aged 5-10) had ever tried to harm, hurt or kill themselves 22
3.10 Family functioning by whether or not children (aged 5-10) had evertried to harm, hurt or kill themselves 23
3.11 Physical complaints by whether or not children (aged 5-10) hadever tried to harm, hurt or kill themselves 24
3.12 Life-threatening experiences, accidents and injuries by whether or notchildren (aged 5-10) had ever tried to harm, hurt or kill themselves 25
3.13 Service use (for any reason) by whether or not children (aged 5-10)had ever tried to harm, hurt or kill themselves 26
scents who try to harm, hurt or kill themselves
NAVIGATION
Select the HAND tool and position it over the List of tables. When an ARROW appears on the hand click the mouse button once to enlarge the text. Continue clicking the arrowed hand tool to advance down the list. When the HAND tool changes to a POINTED FINGER click the mouse button once to link to the listed item.

List of tables
Crown copyright 2001
page
3.14 Specialist services used by children (aged 5-10) who had ever triedto harm, hurt or kill themselves 27
3.15 Scholastic achievement by whether or not children (aged 5-10)had ever tried to harm, hurt or kill themselves 27
Chapter 4
4.1 Proportion of children (aged 11-15) who have ever tried to harm,hurt or kill themselves by age and sex and by source of information 30
4.2 Proportion of children (aged 11-15) who have ever tried to harm, hurt orkill themselves by type of mental disorder and by source of information 31
4.3 Proportion of children (aged 11-15) who have ever tried to harm, hurt orkill themselves by socio-demographic and family characteristics andby source of information 32
4.4 Proportion of children (aged 11-15) who have ever tried to harm, hurt or killthemselves by household and areal characteristics and by source of information 33
4.5 Proportion of children (aged 11-15) who have ever tried to harm, hurt orkill themselves by family’s social functioning and by source of information 35
4.6 Odds Ratios for psychiatric correlates of children (aged 11-15) who hadever tried to harm, hurt or kill themselves by source of information 36
4.7 Odds Ratios for significant psychiatric, social functioning andsocio-demographic correlates of children (aged 11-15) who hadever tried to harm, hurt or kill themselves by source of information 37
4.8 Characteristics of children (aged 11-15) by whether or not they had evertried to harm, hurt or kill themselves for the key discriminatory variablesby source of information 39
4.9 Experience of lifecourse events by whether or not children (aged 11-15)had ever tried to harm, hurt or kill themselves by source of information 40
4.10 Family functioning by whether or not children (aged 11-15) had evertried to harm, hurt or kill themselves by source of information 42
4.11 Physical complaints by whether or not children (aged 11-15) had ever triedto harm, hurt or kill themselves by source of information 43
4.12 Life-threatening experiences, accidents and injuries by whether or notchildren (aged 11-15) had ever tried to harm, hurt or kill themselves bysource of information 44
Children and adolescents who try to harm, hurt or kill themselves 3

4 Children and adole
List of tables
Crown copyright 2001
page
4.13 Service use (for any reason) by whether or not children (aged 11-15) hadever tried to harm, hurt or kill themselves by source of information 45
4.14 Specialist services used by children (aged 11-15) who had ever tried toharm, hurt or kill themselves by source of information 46
4.15 Scholastic achievement by whether or not children (aged 11-15) hadever tried to harm, hurt or kill themselves by source of information 46
Chapter 5
5.1 Proportion of children (aged 11-15) who had ever tried to harm, hurtor kill themselves (a) parent by child, and (b) child by parent 49
5.2 Distribution of psychiatric characteristics of children (aged 11-15) who hadever tried to harm, hurt or kill themselves by combined source of information 50
5.3 Distribution of socio-demographic characteristics of children (aged 11-15) whohad ever tried to harm, hurt or kill themselves by combined source of information 51
5.4 Distribution of household and areal characteristics of children (aged 11-15) whohad ever tried to harm, hurt or kill themselves by combined source of information 53
5.5 Distribution of social functioning characteristics of children (aged 11-15) whohad ever tried to harm, hurt or kill themselves by combined source of information 54
5.6 Experience of life course events of children (aged 11-5) who had evertried to harm, hurt or kill themselves by combined source of information 55
5.7 Family functioning characteristics of children (aged 11-15) who had evertried to harm, hurt or kill themselves by combined source of information 56
5.8 Physical complaints of children (aged 11-15) who had ever tried toharm, hurt or kill themselves by combined source of information 57
5.9 Physical harmful experiences of children (aged 11-15) who had evertried to harm, hurt or kill themselves by combined source of information 58
5.10 Service use (for any reason) of children (aged 11-15) who had ever triedto harm, hurt or kill themselves by combined source of information 59
5.11 Specialist services used by children (aged 11-15) who had ever triedto harm, hurt or kill themselves by combined source of information 60
5.12 Scholastic achievement of children (aged 11-15) who had ever triedto harm, hurt or kill themselves by combined source of information 60
scents who try to harm, hurt or kill themselves

Children and adolescents who try to harm, hurt or kill themselves 5
Notes to tables
1. Tables showing percentagesThe row or column percentages may add to 99% or 101% because of rounding.
The varying positions of the percentage signs and bases in the tables denote the presentation ofdifferent types of information. Where there is a percentage sign at the head of a column and thebase at the foot, the whole distribution is presented and individual percentages add up to between99% and 100%. Where there is no percentage sign in the table and an italicised note above thefigures, the figures refer to the proportion of people who had the attribute being discussed, andthe complementary proportion to add to 100% is not shown in the table.
The following conventions have been used in the tables showing percentages:
- no cases0 values less than 0.5%
2. Small basesVery small bases have been avoided wherever possible because of the relative large sampling errorsthat attach to small numbers. Often where the numbers are not large enough to justify the use ofall categories, classifications have been condensed. However, an item within a classification isoccasionally shown separately, even though the base is small because to combine it with anotherlarge category would detract from the value of each. In general, percentage distributions are shownif the base is 30 or more. Where the base is smaller than this, actual numbers are shown withinsquare brackets.
3. Significant differencesThe bases for some subgroups presented in the tables were small such that the standard errors aroundestimates for these groups are biased. Confidence intervals, which take account of these biased standarderrors were calculated, and although they are not presented in the tables, they were used in testing forstatistically significant differences. Unless otherwise stated, changes and differences mentioned in thetext have been found to be statistically different.

6 Children and adolescents who try to harm, hurt or kill themselves

Children and adolescents who try to harm, hurt or kill themselves 7
Summary
Background, aims and coverage of the report (Chapter 1)● The main aim of this report is to present prevalence rates of self-harm among children and
adolescents aged 5-15 in England, Scotland and Wales during the first half of 1999.
● The way the questions were phrased means that it is difficult to distinguish between self-harmwith the intention of committing suicide and self-harm without that intention, i.e. self-mutilation.Therefore, most of the analysis in this report is presented by source and covers any attempt bychildren to harm, hurt or kill themselves.
Sampling and survey procedures (Chapter 2)● Information was collected on 83% of the 12,529 children eligible for interview from up to
three sources resulting in at least some data for 10,438 children and adolescents aged 5-15 inGreat Britain.
Attempts by 5–10 year olds to harm, hurt or kill themselves(Chapter 3)● According to parents, approximately 1.3% of 5-10 year olds had ever tried to harm, hurt or kill
themselves. The lowest rate, 0.4% was found among 5-7 year old girls rising to 2.1% of 8-10 yearold boys.
● The rate of self harm among the sample of young children with no mental disorder was0.8%. The rate increased dramatically to 6.2% of children diagnosed as having an anxietydisorder and 7.5% of those who had a conduct disorder, hyperkinetic disorder or a less commonmental disorder.
The prevalence of self harm among 5-10 year olds was greater for children in:
● Lone parent compared with two-parent families (1.9% and 1.1%)
● Single child families compared to those with 3 or more children (1.8% and 1.1%)
● Social Class V families (2.6%) compared with Social Class I families (0.9%)
● Families living in terraced houses and maisonettes (1.8-2.0%) compared with those in detachedand semi-detached houses (0.8-1.0%)
● Families who were social sector tenants or private renters (1.8-2.1%) compared with owneroccupiers (1.0%)
● England (1.4%) rather than Scotland (0.8%) or Wales (0.7%)

8 Children and adolescents who try to harm, hurt or kill themselves
The prevalence of self-harm among 5-10 year olds increased with:
● an increase in the number of stressful life events: 0.8% among those with none compared with2.3% of children who had experienced 3 events and 13.3% among 5-10 year olds who had had 5or more stressful life events
● an increase in the parent’s GHQ score: 1.0% of children with a parental GHQ12 score of 0-2rising to 3.7% of children with parents who had the highest scores (10-12) on the GHQ12.
● an increase in the degree of family discord (measured by the FAD-GFS): 1.1% among childrenwith no family discord (healthy functioning) rising to 3.7% of children in the mostdysfunctional families.
● an increase in the frequency of punishment: 1.0% of children seldom or occasionally punishedcompared with 1.8% of those frequently punished.
Attempts by 11–15 year olds to harm, hurt or kill themselves(Chapter 4)
● According to parents, approximately 2.1% of 11-15 year olds had ever tried to harm, hurt or killthemselves. The highest rate, 3.1%, was found among 13-15 year old girls.
● The rate of self harm among the sample of 11-15 year olds with no mental disorder was 1.2%.The rate increased markedly to 9.4% of those with anxiety disorders, 18.8% of childrendiagnosed as having depression, 12.6% of those who had a conduct disorder and 8.5% amongchildren with a hyperkinetic disorder
The prevalence of self harm among 11-15 year olds was greater for children in:
● Lone parent compared with two-parent families (3.1% and 1.8%)
● Families with step children as distinct from those without (3.7% and 1.9%)
● Families with 5 or more children compared with those with less children (6.2% and 2.0%)
● Families who were social sector tenants (3.7%) or private renters (3.2%) compared with owneroccupiers (1.5%)
● Wales (2.8%) and England (2.2%) rather than Scotland (1.0%)
Summary
Crown copyright 2001

Children and adolescents who try to harm, hurt or kill themselves 9
The prevalence of self-harm among 11-15 year olds increased with:
● an increase in the number of stressful life events: 1.2% among those with none compared with3.6% of children who had experienced 3 events and 9.5% among 11-15 year olds who had had 5or more stressful life events
● an increase in the parents’ GHQ score: 1.4% of children with a parental GHQ12 score of 0-2rising to 7.1% of children with parents who had the highest scores (10-12) on the GHQ12.
● an increase in the degree of family discord (measured by the FAD-GFS): 1.5% amongchildren with no family discord (very healthy functioning) to 8.4% of children in the mostdysfunctional families.
● an increase in the frequency of punishment: 1.9% of children seldom or occasionally punishedcompared with 2.9% of those frequently punished.
Comparison of data from different sources (Chapter 5)
● Overall, 248 children (out of 4,249, 11-15 year olds) reported trying to harm, hurt or killthemselves compared with 78 of parents’ reports about their children. Using the children’s reportsas the base number, only 15% of parents concurred whereas using the parents’ report as thedenominator the agreement level approached 50%.
● Similarly, among the 4,000 children who said they had not tried to harm themselves, 1% of theirparents said they had whereas of the 4,171 children whose parents said they had not tried toharm themselves, 5% of children said they had done so.
● Among the thirty-eight, 11-15 year olds whose parents confirmed their children’s self-harmreports, 60% were assessed as having a mental disorder: 27% with depression, 16% with anxietyand 16% with another mental disorder.
Summary
Crown copyright 2001

10 Children and adolescents who try to harm, hurt or kill themselves
Summary
Crown copyright 2001

Children and adolescents who try to harm, hurt or kill themselves 11
self-mutilation. Therefore, most of the analysis inthis report is presented by source and covers anyattempt to harm, hurt or kill oneself.
Questions to parents if child was feelingdepressed/irritable/a lack of interest
Over the whole of his/her lifetime has s/he evertried to harm himself/herself or kill himself?
During the time when s/he was feeling (depressed,irritable/a lack of interest) did s/he ever try triedto harm himself/herself or kill himself?
Questions to parents if child was feelingneither depressed nor irritable nor a lackof interest
Over the past month, has s/he ever tried toharm or hurt himself/herself?
Over the whole of his/her lifetime has s/he evertried to harm or hurt himself/herself?
Questions to child, aged 11-15 if child wasfeeling depressed/irritable/lacking interest
Over the whole of your lifetime have you evertried to harm yourself or kill yourself?
During the time when you were feeling(depressed/irritable/lacking interest) did youever try tried to harm yourself or kill yourself?
Questions to child, aged 11-15 if s/he wasfeeling neither depressed nor irritable norlacking of interest
Over the past month, have you ever tried toharm or hurt yourself?
Over the whole of your lifetime have you evertried to harm or hurt yourself?
Chapter 1Background, aims and coverage of the report
1.1 BackgroundThe national survey of the mental health ofchildren and adolescents in Great Britain includeda wide range of emotional, behavioural andhyperkinetic disorders (Meltzer et al., 2000). Themain aims of the survey were:
● to produce prevalence rates of these threemain categories of mental disorder based onICD-10 and DSM-IV criteria
● to determine the impact (consequence forchild) and burden (consequence for others)of the child’s mental health problems
● to examine the provision of services ofchildren with mental disorders
The primary purpose of this further analysis is tolook in more detail at children and adolescentswho had ever attempted to harm, hurt or killthemselves. Questions on these topics were askedof all parents and the children who were eligiblefor a face to face interview, i.e., all those aged11-15 at the time of the interview.
1.2 Definition and focusQuestions on self-harm by children were includedin several parts of the questionnaire. Whichquestions were asked were dependant on whetherthe parent or child was being interviewed andwhether the child was feeling depressed, irritableor showing a lack of interest.
The way the questions were phrased means thatit is difficult to distinguish between self-harmwith the intention of committing suicideand self-harm without that intention, i.e.

12 Children and adolescents who try to harm, hurt or kill themselves
Chapter 1: Background, aims and coverage of the report
Crown copyright 2001
1.3 Coverage of this reportThe main aim of this report is to presentprevalence rates of self-harm among children andadolescents aged 5-15 in England, Scotland andWales during the first half of 1999.
In order to interpret these results it is importantto understand the methods adopted for theoriginal survey, thus, the sampling andinterviewing procedures of the main survey aresummarised in Chapter 2.
Chapter 3 focuses on children aged 5-10 who hadever tried to harm, hurt or kill themselves asreported by their parents. The first half of thechapter presents prevalence rates by psychiatric,personal, family and household characteristics.The second half of the chapter compares thedistribution of these characteristics by whetheror not the children have tried to harm, hurt orkill themselves.
Chapter 4 follows the same format as Chapter 3but presents data on older children, the 11-15 yearolds. However the tables are more complex asthey present data by whether the children’sattempts to harm, hurt or kill themselves werereported by the parents, the children or eitherparent or child.
Chapter 5 re-examines the survey data presentedin Chapter 4 by combining the source ofinformation. Four groups of 11-15 year olds havebeen created:
● Both parent and child reported that childever attempted to harm him/herself.
● Parent reported that child ever attempted toharm him/herself, child did not.
● Child reported that s/he ever attempted toharm him/herself, parent did not
● Neither parent nor child reported that childever attempted to harm him/herself
ReferencesMeltzer, H., Gatwood, R., Goodman, R., andFord, T. (2000) Mental health of children andadolescents in Great Britain, London: TheStationery Office.

Children and adolescents who try to harm, hurt or kill themselves 13
Chapter 2Sampling and survey procedures
2.1 The sampling frameThe sample was drawn from Child BenefitRecords held by the Child Benefit Centre (CBC).Using centralised records as a sampling framewas preferred to carrying out a postal sift of over100,000 addresses and to sampling throughschools. The postal sift would have been timeconsuming and expensive. We did not want tosample through schools because we wanted ourinitial contact to be parents who then would givesigned consent to approach the child’s teacher.
2.2 Sampling procedures andresponse
Table 2.1 shows that 14,250 letters were des-patched by the Child Benefit Centre (CBC) onbehalf of ONS: 30 letters for each of the 475postal sectors. Nine hundred and thirty one ofthe sampled addresses (6.5%) contacted ONS viaa free phone number to opt out and a further 790addresses (5.5%) were found to be ineligible. Themain reason for ineligibility was that the familyhad moved and could not be traced. Thisaccounted for 629 of the 790 ineligibles – 4.4%overall. Other reasons for ineligibility were: thechild was deceased, fostered out, outside the agecriteria, 5-15 or the family had emigrated.Therefore, just over twelve and a half thousandaddresses were allocated to around 300 inter-viewers. (Table 2.1)
Table 2.1 Response to initial CBC letter
Number %
Sampled children 14,250 100Opt outs 931 6.5Ineligibles 790 5.5Children eligible for interview 12,529 88.0
Information was collected on 83% of the 12,529children eligible for interview from up to threesources resulting in at least some data for 10,438children. (Table 2.2)
Table 2.2 Response to interview
Number %
All interviews 10,438 83Refusals 1,774 15Non-contacts 317 2
Base = set sample 12,529 100

14 Children and adolescents who try to harm, hurt or kill themselves
Table 2.3 Achieved interviews by typeof informant
Number %
Parent interviews 10,405 (99.7%)Child interviews/ assessments 9,347 (95.3%)Teacher questionnaire 8,382 (80.3%)
Base = achieved interviews 10,438
Among the co-operating families, almost allthe parents and most of the children took part.Four out of five teachers also returned theirquestionnaires, based on an initial mail out andone reminder letter. (Table 2.3)
To improve the representativeness of the survey,the data were weighted (a) to take account ofdifferential sampling of postal sectors by country,(b) to match the age/sex distribution of 5-15 yearolds in the population at the time of the survey,and (c) to compensate for response variability bymetropolitan and non-metropolitan regions, i.e.poorer response in inner cities. Finally, the datawere adjusted to take account of the missingteacher data.
Chapter 2: Sampling and survey procedures
Crown copyright 2001

Children and adolescents who try to harm, hurt or kill themselves 15
Table 3.1 Proportion of children who have ever tried to harm, hurt or kill themselvesby age and sex
Children aged 5-10
5-7 year olds 8-10 year olds All children(5-10 year olds)
Boys Girls All Boys Girls All Boys Girls All
% % % % % % % % %Child has tried toharm, hurt or killhimself/herself 1.3 0.4 0.9 2.1 1.3 1.7 1.7 0.9 1.3
Child has not tried toharm, hurt or killhimself/herself 98.7 99.6 91.9 97.9 98.7 98.3 98.3 91.9 98.7
Base 1,441 1,447 2,888 1,450 1,434 2,883 2,891 2,881 5,771
Chapter 3Attempts by 5-10 year olds to harm, hurt or kill themselves
3.1 IntroductionThis chapter is divided into two sections. Thefirst section looks at the responses of parents tothe self-harm questions and presents prevalencerates by psychiatric, biographic and socio-demographic factors. It also looks at whetherchildren try to harm, hurt or kill themselves byfamily functioning characteristics. The secondpart of the chapter looks at the family’s socialfunctioning, the child’s physical health, the use ofservices and the child’s education and scholasticachievement by whether or not the child everattempted to harm him/herself.
3.2 Prevalence of self harm
Age and sex
According to parents, approximately 1.3% of5-10 year olds had ever tried to harm, hurt orkill themselves. Higher proportions were foundamong boys than girls (1.7% and 0.9%) and8-10 year olds had twice the rate of 5-7 year olds(1.7% and 0.9%). The lowest rate, 0.4% wasfound among 5-7 year old girls rising to 2.1%of 8-10 year old boys. (Table 3.1)

16 Children and adolescents who try to harm, hurt or kill themselves
Table 3.2 Proportion of children whohad ever tried to harm, hurtor kill themselves bypsychiatric charcteristics
Children aged 5-10
Whether children had ever triedto harm, hurt or kill themselves
Hierarchical classification % Baseof mental disorders
Any depressive disorder - 14Other emotional disorder 6.2 178Other mental disorder 7.5 255No mental disorder 0.8 5,325
Psychiatric profile
Not unexpectedly, the prevalence of self-harmwas far higher among children assessed as havinga mental disorder compared with other 5-10 yearolds. The rate of self harm among the sample ofyoung children with no mental disorder was0.8%. The rate increased dramatically to 6.2% ofchildren diagnosed as having an anxiety disorderand 7.5% of those who had a conduct disorder,hyperkinetic disorder or a less common mentaldisorder (e.g. autism, tics etc.). In the survey,only 14 of the 5,772 young children, aged 5-10,were assessed as having a depressive disorder andnone of their parents indicated that thesechildren had ever tried to harm, hurt or killthemselves. (Table 3.2)
Socio-demographic and familycharacteristics
Table 3.3 shows that apart from the ageand sex differences described above, theprevalence of self harm among 5-10 year oldswas greater for children in:
● Lone parent compared with two-parentfamilies (1.9% and 1.1%)
● Single child families compared to those with3 or more children (1.8% and 1.1%)
● Whether children were in reconstitutedfamilies seemed to make little difference tothe prevalence of self-harm.
Household and areal characteristics
The prevalence of self harm among children aged5-10 was looked at for six household and arealcharacteristics: family employment status, typeof accommodation, tenure, social class (based onoccupation of head of household), a classifica-tion of regional neighbourhoods and country.Four of these factors show a marked relationshipwith the rates of self harm. (Table 3.4)
Chapter 3: Attempts by 5-10 year olds to harm, hurt or kill themselves
Crown copyright 2001

Children and adolescents who try to harm, hurt or kill themselves 17
Table 3.3 Proportion of children whohad ever tried to harm, hurtor kill themselves bysocio-demographic andfamily characteristics
Children aged 5-10
Whether children had ever triedto harm, hurt or kill themselves
Characteristics % Base
All children aged 5-10 1.3 5,772
SexBoys 1.7 2,891Girls 0.9 2,881
Age5-7 year olds 0.9 2,8888.10 year olds 1.7 2,883
EthnicityWhite 1.3 5,293Non-White 1.3 473
Family typeCouples 1.1 4,518Lone parents 1.9 1,254
Family structureWith step child 1.0 478No step children 1.3 5,293
No. of children in family1 1.8 8772 1.3 2,7563 1.1 1,4474 1.1 5235 1.2 166
Table 3.4 Proportion of children whohad ever tried to harm, hurt orkill themselves by householdand areal characteristics
Children aged 5-10
Whether children had ever triedto harm, hurt or kill themselves
Characteristics % BaseFamily employment statusAll working 1.2 3,690One working, one not working 1.3 1,261All not working 1.8 819
Type of accommodationDetached house 0.9 1,378Semi-detached house 1.0 2,162Terraced house 1.8 1,831Flat or maisonette 2.0 400
TenureOwners 1.0 3,857Social sector tenants 1.8 1,527Private renters 2.1 385
Social ClassI 0.9 429II 1.1 1,725III Nonmanual 1.2 680III Manual 1.2 1,474IV 1.7 894V 2.6 267
ACORNThriving 1.1 1,045Expanding 0.9 823Rising 2.3 345Settling 1.2 1,324Aspiring 1.5 755Striving 1.4 1,469
CountryEngland 1.4 5,013Scotland 0.8 480Wales 0.7 277
3: Attempts by 5-10 year olds to harm, hurt or kill themselves
Crown copyright 2001

18 Children and adolescents who try to harm, hurt or kill themselves
The prevalence of self harm among 5-10 yearolds was greater for children in:
● Social Class V families (2.6%) comparedwith Social Class I families (0.9%)
● Families living in terraced houses andmaisonettes (1.8-2.0%) compared with those indetached and semi-detached houses (0.8-1.0%)
● Families who were social sector tenants orprivate renters (1.8-2.1%) compared withowner occupiers (1.0%)
● England (1.4%) rather than Scotland (0.8%)or Wales (0.7%)
Family’s social functioning
The term social functioning was used in a verybroad sense to refer to several aspects of parentalattitudes and behaviour and for the purposes ofthe survey included:
● Mental health of interviewed parent
● Family functioning in terms of degree offamily discord
● Punishment regimes
● Stressful life events
The parent who was interviewed about thechild’s mental health, in most cases the mother,was also asked about her own mental healthby means of the GHQ-12 (General Health
Questionnaire, Goldberg and Williams, 1988). TheGHQ-12 is a self administered screening test oftwelve questions designed to detect non-psychoticpsychiatric disorders in community settings.
The instrument used to estimate familyfunctioning was the General Functioning Scaleof the MacMaster Family Activity Device (FAD).It comprises 12 statements that parents rate on afour point scale: strongly agree, agree, disagreeand strongly disagree. The scale has been shownto have good reliability, internal consistency andvalidity in distinguishing between non-clinicalfamilies and families attending a psychiatricservice. (Miller et al., 1985, Byles et al., 1988,Fristad. M.A., 1989)
How parents punished their children for badbehaviour was investigated by asking parents torate the frequency of their use of six punishmentregimes. Parents had a choice of saying whetherthey carried out each activity, never, seldom,sometimes or frequently.
All parents were asked if the child experiencedten stressful life events. The items in the listwere chosen because they are thought to behighly (psychologically) threatening for thechild. Goodyer (1990) has suggested thatmoderately or highly undesirable recent lifeevents exert potential causal effects on the onsetof emotional and behavioural symptoms inschool aged children.
Chapter 3: Attempts by 5-10 year olds to harm, hurt or kill themselves
Crown copyright 2001
Children and adolescents who try to harm, hurt or kill themselves 19
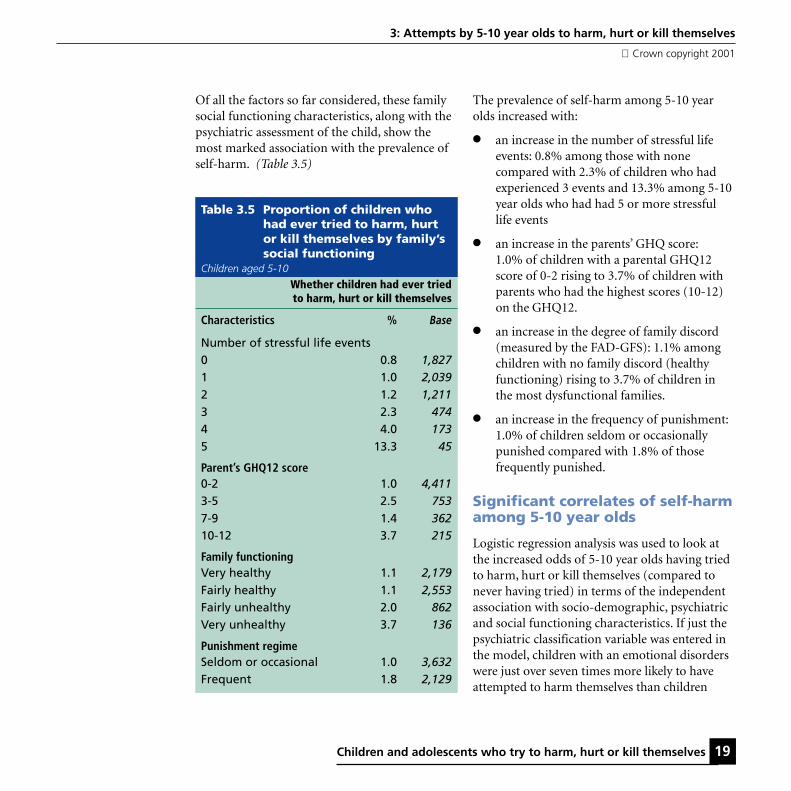
Table 3.5 Proportion of children whohad ever tried to harm, hurtor kill themselves by family’ssocial functioning
Children aged 5-10
Whether children had ever triedto harm, hurt or kill themselves
Characteristics % Base
Number of stressful life events0 0.8 1,8271 1.0 2,0392 1.2 1,2113 2.3 4744 4.0 1735 13.3 45
Parent’s GHQ12 score0-2 1.0 4,4113-5 2.5 7537-9 1.4 36210-12 3.7 215
Family functioningVery healthy 1.1 2,179Fairly healthy 1.1 2,553Fairly unhealthy 2.0 862Very unhealthy 3.7 136
Punishment regimeSeldom or occasional 1.0 3,632Frequent 1.8 2,129
Of all the factors so far considered, these familysocial functioning characteristics, along with thepsychiatric assessment of the child, show themost marked association with the prevalence ofself-harm. (Table 3.5)
The prevalence of self-harm among 5-10 yearolds increased with:
● an increase in the number of stressful lifeevents: 0.8% among those with nonecompared with 2.3% of children who hadexperienced 3 events and 13.3% among 5-10year olds who had had 5 or more stressfullife events
● an increase in the parents’ GHQ score:1.0% of children with a parental GHQ12score of 0-2 rising to 3.7% of children withparents who had the highest scores (10-12)on the GHQ12.
● an increase in the degree of family discord(measured by the FAD-GFS): 1.1% amongchildren with no family discord (healthyfunctioning) rising to 3.7% of children inthe most dysfunctional families.
● an increase in the frequency of punishment:1.0% of children seldom or occasionallypunished compared with 1.8% of thosefrequently punished.
Significant correlates of self-harmamong 5-10 year olds
Logistic regression analysis was used to look atthe increased odds of 5-10 year olds having triedto harm, hurt or kill themselves (compared tonever having tried) in terms of the independentassociation with socio-demographic, psychiatricand social functioning characteristics. If just thepsychiatric classification variable was entered inthe model, children with an emotional disorderswere just over seven times more likely to haveattempted to harm themselves than children
3: Attempts by 5-10 year olds to harm, hurt or kill themselves
Crown copyright 2001

20 Children and adolescents who try to harm, hurt or kill themselves
Table 3.7 Odds Ratios for significantpsychiatric, social functioningand socio-demographiccorrelates of children whohad ever tried to harm,hurt or kill themselves
Children aged 5-10
Whether children had ever triedto harm, hurt or kill themselves
Adjusted (95% C!)Odds Ratio
Hierarchicalclassificationof mental disorder
No mental disorder 1.00 .........Any emotional disorder 5.20 (2.48-10.93)Other mental disorder 6.83 (3.63-12.82)
Number of stressfullife events
0 1.00 .........1 1.07 (0.53-2.13)2 1.32 (0.62-2.82)3 2.28 (0.96-5.54)4 2.59 (0.90-7.37)5 and over 13.72 (4.28-45.06)
SexBoy 1.00 .........Girl 0.60 (0.36-0.99)
Other variables entered into the model which were nonsignificant were: ethnicity, family type, family’s economicstatus, tenure, type of accommodation, ACORN classificationpunishment regime, parent’s GHQ12 score, family functioningnumber of children in household and reconstituted families.
Table 3.6 Odds Ratios for psychiatriccorrelates of children whohad ever tried to harm, hurtor kill themselves
Children aged 5-10
Whether children had ever triedto harm, hurt or kill themselves
Odds Ratio (95% C!)Hierarchicalclassificationof mental disorder
No mental disorder 1.00 .........Any emotional disorder 7.31 (3.73-14.33)Other mental disorder 9.42 (5.41-16.40)
with no disorder: OR=7.31 (3.73-14.33). Thecorresponding odds ratio for children with othermental disorders was 9.42 (5.41-16.40). (Table 3.6)
When the social functioning and socio-demographic variables were entered into themodel, the odds ratios for children with anyemotional disorder fell to 5.20 (2.48-10.93) andfor children with other mental disorders,6.83.(3.63-12.82). The two other significantfactors were sex and number of stressful lifeevents: girls were 40% less likely than boys toattempt to harm themselves and children with 5or more stressful life events were nearly 14 timesmore like to self-harm compared with childrenwith none. (Table 3.7)
Chapter 3: Attempts by 5-10 year olds to harm, hurt or kill themselves
Crown copyright 2001

Children and adolescents who try to harm, hurt or kill themselves 21
Table 3.8 Characteristics of children bywhether or not they had evertried to harm, hurt or killthemselves for the keydiscriminatory variables
Children aged 5-10
Whether children had ever triedto harm, hurt or kill themselves
TriedNot tried All
Characteristic % % %
Hierarchical classificationof mental disorder
Any depressive disorder - 0 0Other emotional disorder 15 3 3Other mental disorder 25 4 4No mental disorder 60 93 92
Number of stressfullife events0 20 32 321 27 36 352 20 21 213 15 8 84 10 3 35 and over 8 1 1
SexBoy 67 50 50Girl 33 50 50
Base 75 5,697 5,772
3.3 Characteristics ofchildren who had evertried to harm, hurt orkill themselves
Whereas the previous section looked atprevalence rates by various characteristics, thissection looks at the two groups, those who havetried to harm themselves and those who havenot, and compares these two groups in terms of
● The key correlates of self harm
● The experience of particular stressfullife events
● Specific indicators of family discord
● The physical health of the child
● Life-threatening experiences, accidents andinjuries
● Use of health services and specialist care
● Scholastic achievement and education
Key correlates of self harm
Among the 5-10 years who had tried to harmhurt or kill themselves, two thirds were boys,40% had a mental disorder, and one in threeexperienced 3 or more stressful life events. Incontrast, among those who had never attemptedto harm themselves, a half were boys, 7% had amental disorder, and one in nine had three ormore stressful experiences. (Table 3.8)
3: Attempts by 5-10 year olds to harm, hurt or kill themselves
Crown copyright 2001
22 Children and adolescents who try to harm, hurt or kill themselves
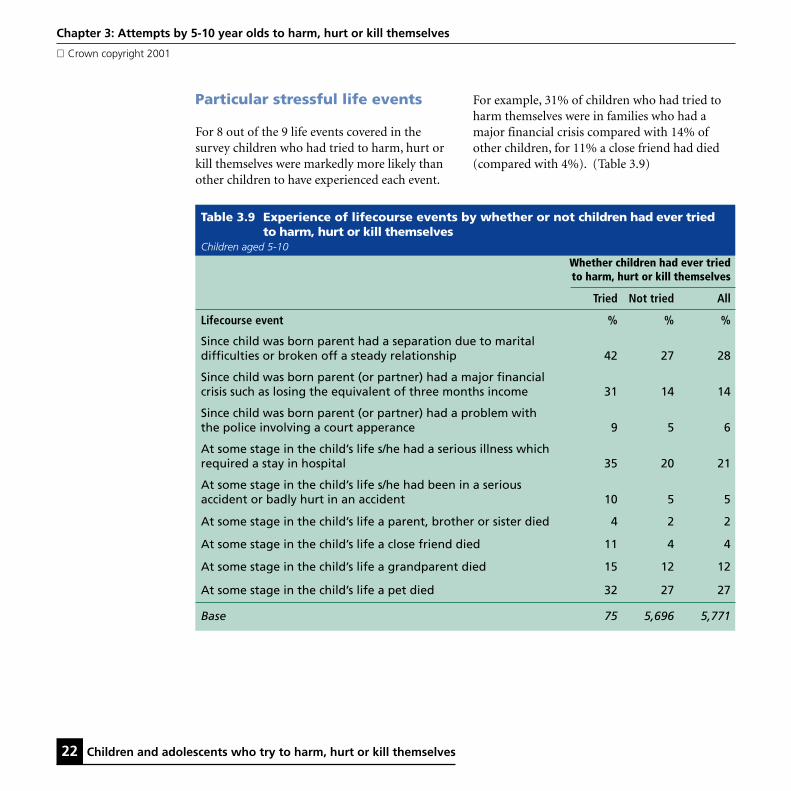
Table 3.9 Experience of lifecourse events by whether or not children had ever triedto harm, hurt or kill themselves
Children aged 5-10
Whether children had ever triedto harm, hurt or kill themselves
Tried Not tried All
Lifecourse event % % %
Since child was born parent had a separation due to maritaldifficulties or broken off a steady relationship 42 27 28
Since child was born parent (or partner) had a major financialcrisis such as losing the equivalent of three months income 31 14 14
Since child was born parent (or partner) had a problem withthe police involving a court apperance 9 5 6
At some stage in the child’s life s/he had a serious illness whichrequired a stay in hospital 35 20 21
At some stage in the child’s life s/he had been in a seriousaccident or badly hurt in an accident 10 5 5
At some stage in the child’s life a parent, brother or sister died 4 2 2
At some stage in the child’s life a close friend died 11 4 4
At some stage in the child’s life a grandparent died 15 12 12
At some stage in the child’s life a pet died 32 27 27
Base 75 5,696 5,771
Particular stressful life events
For 8 out of the 9 life events covered in thesurvey children who had tried to harm, hurt orkill themselves were markedly more likely thanother children to have experienced each event.
Chapter 3: Attempts by 5-10 year olds to harm, hurt or kill themselves
Crown copyright 2001
For example, 31% of children who had tried toharm themselves were in families who had amajor financial crisis compared with 14% ofother children, for 11% a close friend had died(compared with 4%). (Table 3.9)

Children and adolescents who try to harm, hurt or kill themselves 23
Table 3.10 Family functioning by whether or not children had ever tried to harm,hurt or kill themselves
Children aged 5-10
Whether children had ever tried to harm, hurt or kill themselves
Tried Not tried All
Family functioning % % %Planning family activities is difficult because wemisunderstand each other 23 16 17
In times of crisis we can not turn to each other for support 10 5 5
We can not talk to each other about the sadness we feel 32 15 15
Individuals are not accepted for what they are 10 5 5
We avoid discussing our fears and concerns 24 14 14
We can not express feelings to each other 14 8 8
There is lots of bad feeling in the family 15 6 6
We are not accepted for what we are 15 5 5
Making decisions is a problem for our family 22 10 10
We can not make decisions on how to solve problems 18 7 7
We do not get along well together 11 6 6
We do not confide in each other 13 7 7
Base 75 5,696 5,771
Specific indicators of family discord
For most of the 12 indicators of family discord,children who had tried to harm, hurt or killthemselves were twice as likely as other childrento live in families characterised by poor or
3: Attempts by 5-10 year olds to harm, hurt or kill themselves
Crown copyright 2001
“unhealthy” family functioning. For example,avoiding discussion of fears and concerns (24%compared with 14%), a lot of bad feeling in thefamily (15% compared with 6%) makingdecisions is a problem (22% compared with10%). (Table 3.10)

24 Children and adolescents who try to harm, hurt or kill themselves
Table 3.11 Physical complaints bywhether or not children hadever tried to harm,hurt or kill themselves
Children aged 5-10
Whether children had ever triedto harm, hurt or kill themselves
Tried Not tried All
Physical complaints % % %
Asthma 19 16 16Eczema 23 14 14Eyesight problems 14 9 9Hay fever 7 6 6Stomach or digestive problems 16 6 6Non-food allergy 18 4 5Migraine/severe headaches 8 2 2Glue ear/otitis media 10 6 6Bed wetting 20 6 7Hearing problems 15 5 5Speech or language problems 24 4 5Food allergy 11 3 3Difficulties with co-ordination 24 2 2Stiffness or deformity of foot 5 1 1Heart problems 5 2 2Soiling pants 10 1 2Muscle disease or weakness 5 1 1Kidney/urinary tract problems 3 1 1Obesity 1 1 1Congenital abnormality 4 1 1Epilepsy 12 1 1Any blood disorder 3 1 1Diabetes - 0 0
Base 75 5,696 5,771
Physical complaints
The sample of 5-10 year olds who had tried toharm, hurt or kill themselves were vastly morelikely to have a physical complaint, as reported bytheir mothers, than the other children in thesurvey. Among the self-harm group of children,nearly a quarter were reported to have speechand language problems (4% of the others), 24%had difficulties with co-ordination (2% of theother children) 12% had epilepsy and 10% weresoiling their pants compared to 1% of thosenever having tried to harm themselves.(Table 5.11)
Chapter 3: Attempts by 5-10 year olds to harm, hurt or kill themselves
Crown copyright 2001

Children and adolescents who try to harm, hurt or kill themselves 25
Table 3.12 Life-threatening experiences,accidents and injuries bywhether or not children hadever tried to harm, hurt orkill themselves
Children aged 5-10
Whether children had ever triedto harm, hurt or kill themselves
Tried Not tried All
Physically harmfulexperiences % % %
Thought child was so ill that s/he may die 27 11 12
Accident causing broken bone 15 11 11
Head injury with loss of consciousness 13 3 4
Burn requiring hospital admission 8 2 2
Accidental poisoning with hospital admission 8 2 2
Base 75 5,696 5,771
Life threatening experiences,accidents and injuriesAbout a quarter of parents who reported thattheir children had tried to harm themselves alsosaid that at one time they thought their child wasso ill that s/he may die. This is in contrast to11% of the remaining parents. However, thislife-threatening experience may have been causedby the child trying to harm, hurt or killthemselves. Nevertheless children who had triedto harm themselves were four times as likely asthe other children to have a head injury withloss of consciousness (13% compared with 3%)and to have suffered a burn or accidentalpoisoning requiring hospitalisation (8% and2% respectively). (Table 3.12)
3: Attempts by 5-10 year olds to harm, hurt or kill themselves
Crown copyright 2001

26 Children and adolescents who try to harm, hurt or kill themselves
Table 3.13 Service use (for any reason)by whether or not childrenhad ever tried to harm, hurtor kill themselves
Children aged 5-10
Whether children had ever triedto harm, hurt or kill themselves
Tried Not tried All
Characteristic % % %
GP visits in past 12 monthsNone at all 45 62 62Once 9 12 12Twice 12 10 10Three times 12 5 5Four or more times 21 10 10
A & E visits in the past 12 monthsNone at all 78 83 83Once 18 13 13Twice 1 2 3Three times - 1 1Four or more times 3 0 0
Inpatient stays in the past 12 monthsNone at all 92 94 94Once 3 5 5Twice 4 1 1Three times - 0 0Four or more times 1 0 0
Out-patient visits in the past 12 monthsNone at all 60 81 80Once 7 8 8Twice 12 5 5Three times 4 2 2Four or more times 17 4 4
Base 75 5,697 5,772
Use of services
Considering the strong association, shown above,of self-harm with mental disorders, physicalcomplaints, accidents, and injuries, it is notsurprising to note that children who had tried toharm, hurt or kill themselves were far more likelyto have made visits and more frequent visits toGPs and out-patient clinics than other children.(Table 3.13)
Chapter 3: Attempts by 5-10 year olds to harm, hurt or kill themselves
Crown copyright 2001

Children and adolescents who try to harm, hurt or kill themselves 27
Table 3.14 Specialist services used bychildren who had ever triedto harm, hurt or killthemselves
Children aged 5-10
% using each service*
Educational services 47Primary health care services 45Specialist health care services 31Social services 18Alternative therapists 7Other specialist service 10
Any of the above services 65None of the above services 35
Base 75
* Percentages add to more than 100% because children mayhave seen more than one specialist service.
Table 3.15 Scholastic achievement bywhether or not children hadever tried to harm, hurt orkill themselves
Children aged 5-10 with (a) teachers’ data (b) whocompleted BPVS and BAS assessments
Whether children had ever triedto harm, hurt or kill themselves
NotTried tried All
(a) Special educational needs % % %
None 36 80 80
Stage 1 16 8 8Stage 2 16 6 6Stage 3 13 3 3Stage 4 - 0 0Stage 5 19 2 2
Base 63 4,516 4,579
(b) Specific learning difficulties
Present 16 5 5Not present 84 95 95
Base 62 5,242 5,304
The survey only allows us to look at the use ofspecialist services for children who had tried toharm themselves whose mothers indicated theyhad a significant mental health problem. Two-thirds of children had used such services. Just lessthan half the children had received specialist helpfrom educational services with a similar propor-tion receiving help from primary health careservices. A third had seen specialist mental healthcare services such as a psychiatrist or a psycholo-gist and just less than one in five had been incontact with the social services. (Table 3.14)
3: Attempts by 5-10 year olds to harm, hurt or kill themselves
Crown copyright 2001
Scholastic achievement
Around two-thirds of children who had tried toharm themselves had special educational needscompared with 20% of other 5-10 year olds.They were also three times more likely to havespecific learning difficulties than the otherchildren: 16% compared with 5%. (Table 3.15)

28 Children and adolescents who try to harm, hurt or kill themselves
References
Byles, J., Byrne, C., Boyle, M.H., Offord, D.R.(1988) Ontario Child Health Study: Reliabilityand validity of the General Functioning Scale ofthe MacMaster Family Assessment Device.Family Process, 30(1), 116-123
Fristad, M.A. (1989) A comparison of theMacMaster and circumplex family assessmentinstruments. Journal of Marital and FamilyTherapy, 15, 259-269.
Goldberg, D and Williams, N (1988) The GeneralHealth Questionnaire, London
Goodyer, I.M., Wright, C., and Altham. P.M.E.,(1990) The Friendships and Recent Life Events ofAnxious and Depressed School-Age-Children.British Journal of Psychiatry, 156, (May), 689-698
Miller, I.W., Epstein, N.B., Bishop, D.S. and Keitner,G.I. (1985) The MacMaster Family AssessmentDevice: reliability and Validity. Journal of Maritaland Family Therapy, 11, 345-356
Patrick, M.K.S., Angold, A., Burns, B.J., andCostello, E.J., The Child and Adolescent BurdenAssessment (CABA) Parent Interview, Version 4.1,Developmental Epidemiology Program, DukeUniversity.
Chapter 3: Attempts by 5-10 year olds to harm, hurt or kill themselves
Crown copyright 2001

Children and adolescents who try to harm, hurt or kill themselves 29
Chapter 4Attempts by 11-15 year olds to harm, hurt or kill themselves
4.1 IntroductionThe first part of this chapter looks at the responsesof parents and of the children themselves to theself-harm questions and presents prevalencerates, according to source, by psychiatric,biographic and socio-demographic factors.It also looks at whether children try to harm,hurt or kill themselves by family functioningcharacteristics. The second part of the chapterlooks at the family’s social functioning, thechild’s physical health, the use of services and thechild’s education and scholastic achievement bywhether or not the child ever attempted to harmhim/herself.
Although all the tables in this chapter presentdata by source: parent’s report, child’s report andany report, the commentary will focus solely onthe parent’s report (to make it comparable withChapter 3). The significance of the children’sresponses are examined in Chapter 5.
4.2 Prevalence of self harm
Age and sex
According to parents, approximately 2.1% of 11-15 year olds had ever tried to harm, hurt or killthemselves. Higher proportions were foundamong girls than boys (2.5% and 1.8%) and 13-15 year olds had one and a half times the rate of11-12 year olds (2.5% and 1.6%). The highestrate, 3.1%, was found among 13-15 year old girls.(Table 4.1)
Psychiatric profile
Not unexpectedly, the prevalence of self-harm wasfar higher among children assessed as having amental disorder compared with other 11-15 yearolds. The rate of self harm among the sample ofchildren with no mental disorder was 1.2%. Therate increased markedly to 9.4% of those withanxiety disorders, 18.8% of children diagnosed ashaving depression, 12.6% of those who had aconduct disorder and 8.5% among children with ahyperkinetic disorder. (Table 4.2)

30 Children and adolescents who try to harm, hurt or kill themselves
Table 4.1 Proportion of children who had ever tried to harm, hurt or kill themselvesby age and sex and by source of information
Children aged 11-15
11-12 year olds 13-15 year olds All children
Boys Girls All Boys Girls All Boys Girls All
Parent’s report % % % % % % % % %
Child has tried to harm, hurtor kill himself/herself 1.6 1.5 1.6 1.9 3.1 2.5 1.8 2.5 2.1
Child has not tried to harm,hurt or kill himself/herself 98.4 98.5 98.4 98.1 96.9 97.5 98.2 97.5 97.9
Base 929 922 1,851 1,344 1,338 2,681 2,273 2,260 4,532
Child’s report % % % % % % % % %
Child has tried to harm, hurtor kill himself/herself 4.6 4.4 4.6 5.3 7.9 6.6 5.0 6.5 5.8
Child has not tried to harm,hurt or kill himself/herself 95.4 95.6 95.4 94.7 92.1 93.4 95.0 93.5 94.2
Base 884 879 1,764 1,209 1,179 2,559 2,161 2,161 4,323
Any report % % % % % % % % %
Child has tried to harm, hurtor kill himself/herself 5.7 5.2 5.5 6.1 9.0 7.5 5.9 7.5 6.7
Child has not tried to harm,hurt or kill himself/herself 94.3 94.8 94.5 93.9 91.0 92.5 94.1 92.5 93.3
Base 948 936 1,884 1,362 1,361 2,722 2,310 2,297 4,606
Chapter 4: Attempts by 11-15 year olds to harm, hurt or kill themselves
Crown copyright 2001

Children and adolescents who try to harm, hurt or kill themselves 31
Table 4.2 Proportion of children who had ever tried to harm, hurt or kill themselvesby type of mental disorder and by source of information
Children aged 11-15
Report of parent Report of children Report of parent orof child aged 11-15 aged 11-15 of child aged 11-15
Characteristics % Base % Base % Base
Emotional disorders 10.9 253 22.9 239 25.5 258
Anxiety disorders 9.4 208 22.0 193 24.4 212 Separation anxiety [4] 23 9.0 22 21.6 24 Specific Phobia 7.7 40 20.4 35 22.5 40 Social Phobia [2] 17 [2] 16 [3] 17 Panic [-] 15 [2] 15 [2] 15 Agoraphobia [-] 7 [1] 7 [1] 7 PTSD [5] 17 [3] 15 [8] 17 OCD [1] 20 [5] 21 [5] 21 General Anxiety Disorder 9.3 42 22.5 41 23.6 43 Other Anxiety 9.0 80 27.1 73 26.4 82
Depression 18.8 81 37.4 77 41.2 82 Depressive episode 16.9 59 38.9 56 41.2 60 Other depressive episode [5] 21 [7] 21 [9] 22
Conduct disorders 12.6 253 17.4 224 22.1 256Oppositional defiant disorder 5.9 84 6.8 76 11.9 85Conduct disorder (family context) [3] 9 [3] 8 [4] 9Unsocialised conduct disorder [4] 26 [5] 22 [7] 26Socialised conduct disorder 18.0 78 19.7 67 27.3 78Other conduct disorder 9.7 56 24.0 51 23.7 58
Hyperkinetic disorders 8.5 58 16.4 50 20.8 58Hyperkinesis 10.2 49 12.6 41 18.5 49Other hyperkinetic disorder [-] 10 [3] 10 [3] 10
Less common disorders [5] 28 [7] 19 [11] 27Pervasive Developmental Disorder [2] 8 [1] 4 [3] 8Psychotic disorder [-] [-] [-] [-] [-] [-]Tic Disorder [-] 4 [-] 3 [-] 4Eating Disorder [1] 12 [6] 11 [6] 12
Any mental disorder 10.1 480 18.7 432 21.8 487No mental disorder 1.2 4,053 4.4 3,891 4.9 4,119
Hierarchical classificationAny depressive disorder 18.5 81 37.7 77 41.5 82Other emotional disorder 7.0 171 16.0 162 18.2 176Other mental disorder 9.3 227 13.5 193 17.5 229No mental disorder 1.2 4,053 4.4 3,891 4.9 4,119
Chapter 4: Attempts by 11-15 year olds to harm, hurt or kill themselves
Crown copyright 2001

32 Children and adolescents who try to harm, hurt or kill themselves
Table 4.3 Proportion of children who had ever tried to harm, hurt or kill themselvesby socio-demographic and family characteristics and by source of information
Children aged 11-15
Report of parent Report of children Report of parent orof child aged 11-15 aged 11-15 of child aged 11-15
Characteristics % Base % Base % Base
All children aged 11-15 2.1 4,532 5.8 4,323 6.7 4,606
SexBoys 1.8 2,273 5.0 2,161 5.9 2,309Girls 2.4 2,259 6.5 2,161 7.5 2,297
Age11-12 year olds 1.6 1,851 4.5 1,763 5.5 1,88413-15 year olds 2.5 2,681 6.6 2,557 7.5 2,722
EthnicityWhite 2.2 4,148 5.7 3,907 6.6 4,166Non-White 1.3 381 7.0 412 7.1 435
Family typeCouples 1.8 435 5.5 3,319 6.2 3,514Lone parents 3.1 1,073 6.7 1,004 8.2 1,092
Family structureWith step child 3.7 461 8.4 439 10.1 467No step children 1.9 4,071 5.5 3,883 6.3 4,139
No. of children in family1 2.0 1,301 4.5 1,221 5.5 1,3102 2.0 1,918 6.0 1,846 6.8 1,9503 2.0 917 6.6 881 7.5 9334 2.1 283 6.4 264 6.5 2935 6.2 113 9.2 109 12.3 122
Socio-demographic and familycharacteristics
Table 4.3 shows that apart from the age and sexdifferences described above, the prevalence ofself harm among 11-15 year olds was greater forchildren in:
Chapter 4: Attempts by 11-15 year olds to harm, hurt or kill themselves
Crown copyright 2001
● Lone parent compared with two-parentfamilies (3.1% and 1.8%)
● Families with step children as distinct fromthose without (3.7% and 1.9%)
● Families with 5 or more children comparedwith those with less children (6.2% and 2.0%)

Children and adolescents who try to harm, hurt or kill themselves 33
Table 4.4 Proportion of children who had ever tried to harm, hurt or kill themselvesby household and areal characteristics and by source of information
Children aged 11-15
Report of parent Report of children Report of parent orof child aged 11-15 aged 11-15 of child aged 11-15
Characteristics % Base % Base % Base
Family employment statusAll working 2.0 3,245 5.6 3,073 6.4 3,245One working, one not working 2.4 700 6.5 647 7.4 700All not working 2.6 588 6.6 531 7.8 591
Type of accommodationDetached house 2.0 591 6.0 1,115 7.1 1,176Semi-detached house 1.9 1,792 5.3 1,683 5.9 1,804Terraced house 2.3 1,297 6.7 1,261 7.7 1,341Flat or maisonette 2.9 272 4.2 264 5.3 285
TenureOwners 1.5 3,152 5.6 3,024 6.2 3,183Social sector tenants 3.7 1,128 6.2 1,128 8.1 1,128Private renters 3.2 250 6.1 244 6.6 257
Social ClassI 2.6 257 4.9 329 6.6 348II 1.8 1,471 6.7 1,401 7.3 1,472III Nonmanual 1.1 545 5.1 513 5.5 545III Manual 1.7 1,111 6.0 1,055 6.7 1,112IV 2.9 654 5.9 596 6.9 654V 2.5 242 5.0 218 6.6 243Never worked 5.0 60 1.9 54 6.7 60
ACORNThriving 1.7 882 5.9 835 6.4 885Expanding 1.3 618 4.9 594 5.8 622Rising 1.6 255 6.6 256 7.0 271Settling 1.8 1,043 5.9 982 6.9 1,043Aspiring 2.7 629 5.5 586 6.9 637Striving 3.0 1,103 6.0 1,055 7.0 1,144
CountryEngland 2.2 3,882 6.0 3,715 7.0 3,946Scotland 1.0 404 3.9 380 4.1 411Wales 2.8 247 4.9 226 6.4 249
Chapter 4: Attempts by 11-15 year olds to harm, hurt or kill themselves
Crown copyright 2001

34 Children and adolescents who try to harm, hurt or kill themselves
Household and arealcharacteristics
The prevalence of self harm among children aged11-15 was looked at for six household and arealcharacteristics: family employment status, typeof accommodation, tenure, social class (based onoccupation of head of household), a classificationof regional neighbourhoods and country. Two ofthese factors show a marked relationship withthe rates of self harm.
The prevalence of self harm among 11-15 yearolds was greater for children in:
● Families who were social sector tenants(3.7%) or private renters (3.2%)compared with owner occupiers (1.5%)
● Wales (2.8%) and England (2.2%) ratherthan Scotland (1.0%)
Family’s social functioning
The term social functioning was used in a verybroad sense to refer to several aspects of parentalattitudes and behaviour and for the purposes ofthe survey included:
● Mental health of interviewed parent
● Family functioning in terms of degree offamily discord
● Punishment regimes
● Stressful life events
The parent who was interviewed about thechild’s mental health, in most cases the mother,was also asked about her own mental healthby means of the GHQ-12 (General HealthQuestionnaire, Goldberg and Williams, 1988).
The GHQ-12 is a self administered screening test oftwelve questions designed to detect non-psychoticpsychiatric disorders in community settings.
The instrument used to estimate family functioningwas the General Functioning Scale of the MacMasterFamily Activity Device (FAD). It comprises 12statements that parents rate on a four point scale:strongly agree, agree, disagree and stronglydisagree. The scale has been shown to have goodreliability, internal consistency and validity indistinguishing between non-clinical families andfamilies attending a psychiatric service. (Miller etal., 1985, Byles et al., 1988, Fristad. M.A., 1989)
How parents punished their children for badbehaviour was investigated by asking parents to ratethe frequency of their use of six punishment regimes.
Parents had a choice of saying whether theycarried out each activity, never, seldom, sometimesor frequently.
All parents were asked if the child experiencedten stressful life events. The items in the list werechosen because they are thought to be highly(psychologically) threatening for the child. Goodyer(1990) has suggested that moderately or highlyundesirable recent life events exert potentialcausal effects on the onset of emotional andbehavioural symptoms in school aged children.
Of all the factors so far considered, these familysocial functioning characteristics, along with thepsychiatric assessment of the child, show themost marked association with the prevalence ofself-harm. (Table 4.5)
Chapter 4: Attempts by 11-15 year olds to harm, hurt or kill themselves
Crown copyright 2001

Children and adolescents who try to harm, hurt or kill themselves 35
Table 4.5 Proportion of children who had ever tried to harm, hurt or kill themselves by family’s social functioning characteristics and by source of information
Children aged 11-15
Report of parent Report of children Report of parent orof child aged 11-15 aged 11-15 of child aged 11-15
Characteristics % Base % Base % Base
Number of stressful life events0 1.2 1,160 4.5 1,098 4.8 1,1631 1.6 1,507 5.8 1,421 6.4 1,5082 1.7 1,052 5.3 975 5.9 1,0523 3.6 506 7.0 473 8.7 5054 6.3 224 9.6 209 13.4 2245 9.5 84 17.3 75 22.6 84
Parent’s GHQ12 score0-2 1.4 3,260 4.7 3,059 5.3 3,2603-5 2.6 618 6.3 584 7.6 6187-9 3.6 360 10.0 340 11.9 36010-12 7.1 268 13.4 246 15.7 267
Family functioningVery healthy 1.5 1,442 5.0 1,358 5.8 1,442Fairly healthy 1.8 2,110 5.1 1,974 5.8 2,110Fairly unhealthy 3.0 807 8.6 760 9.5 807Very unhealthy 8.4 119 13.6 110 17.8 118
Punishment regimeSeldom or occasional 1.9 3,576 5.4 3,348 6.2 3,576Frequent 2.9 954 7.7 900 8.8 953
Chapter 4: Attempts by 11-15 year olds to harm, hurt or kill themselves
Crown copyright 2001

36 Children and adolescents who try to harm, hurt or kill themselves
Table 4.6 Odds Ratios for psychiatric correlates of children who had ever tried toharm, hurt or kill themselves by source of information
Children aged 11-15
Report of parent Report of children Report of parent orof child aged 11-15 aged 11-15 of child aged 11-15
Odds Ratio (95% C!) Odds Ratio (95% C!) Odds Ratio (95% C!)
Hierarchical classificationof mental disorderNo mental disorder 1.00 ......... 1.00 ......... 1.00 .........Any depressive disorder 20.06 (10.65-37.78) 13.27 (8.10-21.74) 13.86 (8.68-22.13)Other emotional disorder 6.54 (3.40-12.60) 4.19 (2.66-6.60) 4.31 (2.85-6.52)Other mental disorder 8.94 (5.24-15.27) 3.44 (2.19-5.39) 4.29 (2.96-6.22)
The prevalence of self-harm among 11-15 yearolds increased with:
● an increase in the number of stressful lifeevents: 1.2% among those with nonecompared with 3.6% of children who hadexperienced 3 events and 9.5% among 5-10year olds who had had 5 or more stressfullife events
● an increase in the parents’ GHQ score:1.4% of children with a parental GHQ12score of 0-2 rising to 7.1% of children withparents who had the highest scores (10-12)on the GHQ12.
● an increase in the degree of family discord(measured by the FAD-GFS): 1.5% amongchildren with no family discord (very healthyfunctioning) to 8.4% of children in the mostdysfunctional families.
● an increase in the frequency of punishment:1.9% of children seldom or occasionallypunished compared with 2.9% of thosefrequently punished.
Significant correlates of self-harmamong11-15 year olds.
Logistic regression analysis was used to look atthe increased odds of 11-15 year olds having triedto harm, hurt or kill themselves (compared tonever having tried) in terms of the independentassociation with socio-demographic, psychiatricand social functioning characteristics. If just thepsychiatric classification variable was entered inthe model, children with depressive disorderswere twenty times more likely to have attemptedto harm themselves than children with no disorder:OR=20.06 (10.65-37.78). The correspondingodds ratio for children with anxiety disordersand other mental disorders was 6.54 (3.40-12.60)and 8.94 (5.24-15.27). (Table 4.6)
When the social functioning and socio-demographic variables were entered into themodel, the odds ratios for children withdepression fell to14.05 (6.78-29.11. for anxiety,4.07 (2.00-8.31) and 7.09 (3.82-13.16) forchildren with other mental disorders. (Table 4.7)
Chapter 4: Attempts by 11-15 year olds to harm, hurt or kill themselves
Crown copyright 2001
Children and adolescents who try to harm, hurt or kill themselves 37
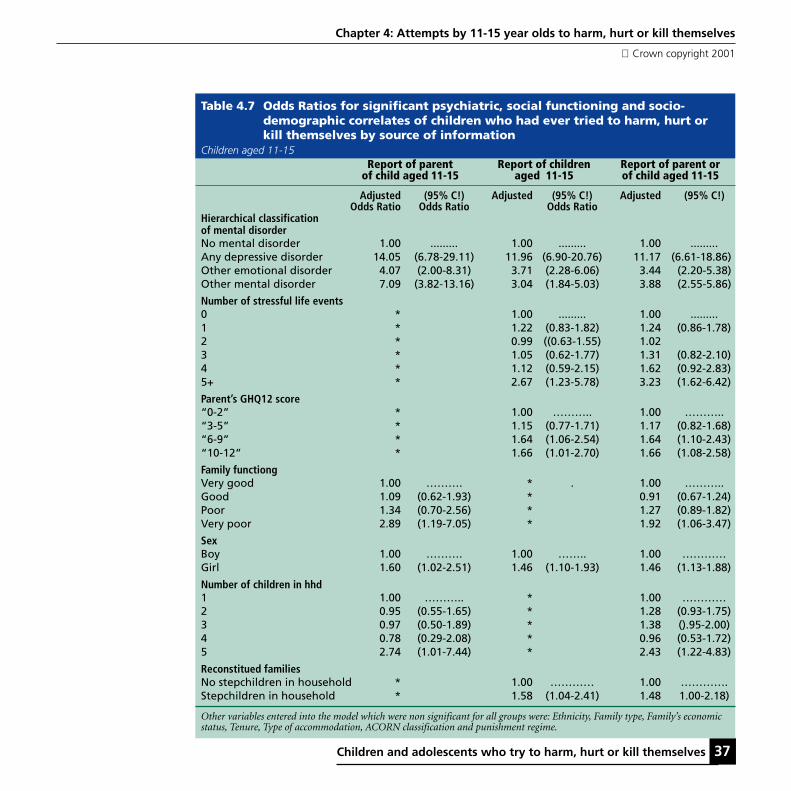
Table 4.7 Odds Ratios for significant psychiatric, social functioning and socio-demographic correlates of children who had ever tried to harm, hurt orkill themselves by source of information
Children aged 11-15Report of parent Report of children Report of parent or
of child aged 11-15 aged 11-15 of child aged 11-15
Adjusted (95% C!) Adjusted (95% C!) Adjusted (95% C!)Odds Ratio Odds Ratio Odds Ratio
Hierarchical classificationof mental disorderNo mental disorder 1.00 ......... 1.00 ......... 1.00 .........Any depressive disorder 14.05 (6.78-29.11) 11.96 (6.90-20.76) 11.17 (6.61-18.86)Other emotional disorder 4.07 (2.00-8.31) 3.71 (2.28-6.06) 3.44 (2.20-5.38)Other mental disorder 7.09 (3.82-13.16) 3.04 (1.84-5.03) 3.88 (2.55-5.86)
Number of stressful life events0 * 1.00 ......... 1.00 .........1 * 1.22 (0.83-1.82) 1.24 (0.86-1.78)2 * 0.99 ((0.63-1.55) 1.023 * 1.05 (0.62-1.77) 1.31 (0.82-2.10)4 * 1.12 (0.59-2.15) 1.62 (0.92-2.83)5+ * 2.67 (1.23-5.78) 3.23 (1.62-6.42)
Parent’s GHQ12 score“0-2” * 1.00 ……….. 1.00 ………..“3-5” * 1.15 (0.77-1.71) 1.17 (0.82-1.68)“6-9” * 1.64 (1.06-2.54) 1.64 (1.10-2.43)“10-12” * 1.66 (1.01-2.70) 1.66 (1.08-2.58)
Family functiongVery good 1.00 ………. * . 1.00 ………..Good 1.09 (0.62-1.93) * 0.91 (0.67-1.24)Poor 1.34 (0.70-2.56) * 1.27 (0.89-1.82)Very poor 2.89 (1.19-7.05) * 1.92 (1.06-3.47)
SexBoy 1.00 ………. 1.00 …….. 1.00 …………Girl 1.60 (1.02-2.51) 1.46 (1.10-1.93) 1.46 (1.13-1.88)
Number of children in hhd1 1.00 ……….. * 1.00 …………2 0.95 (0.55-1.65) * 1.28 (0.93-1.75)3 0.97 (0.50-1.89) * 1.38 ().95-2.00)4 0.78 (0.29-2.08) * 0.96 (0.53-1.72)5 2.74 (1.01-7.44) * 2.43 (1.22-4.83)
Reconstitued familiesNo stepchildren in household * 1.00 ………… 1.00 ………….Stepchildren in household * 1.58 (1.04-2.41) 1.48 1.00-2.18)
Other variables entered into the model which were non significant for all groups were: Ethnicity, Family type, Family’s economicstatus, Tenure, Type of accommodation, ACORN classification and punishment regime.
Chapter 4: Attempts by 11-15 year olds to harm, hurt or kill themselves
Crown copyright 2001
38 Children and adolescents who try to harm, hurt or kill themselves
The three other significant factors were sex,family functioning and number of childrenin household:
● girls were 60% more likely than boys toattempt to harm themselves,
● children in families with the most discordwere nearly three time as likely to harmthemselves than those with a very healthyfamily functioning rating, and
● children in households with at least fourother children were 2.74 times more likely totry to harm, hurt, or kill themselves thanlone-child families.
4.3 Characteristics ofchildren who had evertried to harm, hurt orkill themselves
Whereas the previous section looked atprevalence rates by various characteristics, thissection looks at the two groups, those who havetried to harm themselves and those who havenot, and compares these two groups in terms of:
● The key correlates of self harm
● The experience of particular stressfullife events
● Specific indicators of family discord
● The physical health of the child
● Life-threatening experiences, accidents andinjuries
● Use of health services and specialist care
● Scholastic achievement and education
Key correlates of self harm
Among the 11-15 years who had tried to harmhurt or kill themselves, 58% were girls, 50% hada mental disorder, and just over 40% hadexperienced 3 or more stressful life events. Incontrast, among those who had never attemptedto harm themselves, a half were girls, 10% had amental disorder, and 18% had three or morestressful experiences. (Table 4.8)
Particular stressful life events
For the majority of life events covered in thesurvey children who had tried to harm themselveswere markedly more likely than other children tohave experienced each event. For example, 31%of 13-15 year olds who had tried to harmthemselves had broken off a steady relationshipcompared with 9% of other children, for 10% aparent, brother or sister had died (comparedwith 4%). (Table 4.9)
Chapter 4: Attempts by 11-15 year olds to harm, hurt or kill themselves
Crown copyright 2001

Children and adolescents who try to harm, hurt or kill themselves 39
Table 4.8 Characteristics of children by whether or not they had ever tried toharm, hurt or kill themselves for the key discriminatory variables bysource of information
Children aged 11-15
Report of parent Report of children Report of parent orof child aged 11-15 aged 11-15 of child aged 11-15
Tried Not tried All Tried Not tried All Tried Not tried All
Characteristic % % % % % % % % %
Hierarchical classification of mental disorderAny depressive disorder 16 2 2 12 1 2 11 1 2Other emotional disorder 13 4 4 10 3 4 10 3 4Other mental disorder 22 5 5 10 4 5 13 4 5No mental disorder 50 90 89 68 91 90 66 91 89
Number of stressful life events0 15 26 26 20 26 26 18 26 261 25 33 33 33 34 33 31 33 332 19 23 23 21 23 23 20 23 233 19 11 11 13 11 11 14 11 114 15 5 5 8 5 5 10 5 55 and over 8 2 2 5 2 2 6 2 2
Parent’s GHQ12 score“0-2” 50 73 72 58 73 72 57 74 72“3-5” 17 14 14 15 14 14 15 14 14“6-9” 14 8 8 14 8 8 14 8 8“10-12” 20 6 6 13 5 6 14 5 6
Family functioningVery good 23 32 32 27 33 32 27 33 32Good 41 47 47 40 47 47 41 48 47Poor 26 18 18 26 18 18 25 18 18Very poor 11 3 3 6 2 3 7 2 3
SexBoy 42 50 50 44 50 50 44 51 50Girl 58 50 50 56 50 50 56 49 50
Number of children in hhd1 27 29 29 22 29 28 23 29 282 40 42 42 44 43 43 43 42 423 19 20 20 23 20 20 23 20 204 6 6 6 7 6 6 6 6 65 7 2 3 4 2 3 5 3 3
Reconstituted familiesNo stepchildren in household 82 90 90 85 90 90 85 90 90Stepchildren in household 18 10 10 15 10 10 15 10 10
Base 95 4,437 4,532 250 4,072 4,322 308 4,298 4,606
Chapter 4: Attempts by 11-15 year olds to harm, hurt or kill themselves
Crown copyright 2001

40 Children and adolescents who try to harm, hurt or kill themselves
Table 4.9 Experience of lifecourse events by whether or not children had ever triedto harm, hurt or kill themselves by source of information
Children aged 11-15Report of parent Report of children Report of parent or
of child aged 11-15 aged 11-15 of child aged 11-15Not Not Not
Tried tried All Tried tried All Tried tried All
Lifecourse event % % % % % % % % %
Since child was born parent had aseparation due to marital difficultiesor broken off a steady relationship 53 34 34 44 34 34 46 34 34
Since child was born parent (orpartner) had a major financialcrisis such as losing the equivalentof three months income 29 18 18 24 17 18 26 17 18
Since child was born parent (orpartner) had a problem with thepolice involving a court apperance 12 7 7 12 7 7 12 7 7
At some stage in the child’s lifes/he had a serious illness whichrequired a stay in hospital 25 20 20 22 20 20 23 20 20
At some stage in the child’s lifes/he had been in a serious accidentor badly hurt in an accident 16 6 6 8 6 6 10 6 6
At some stage in the child’s lifea parent, brother or sister died 10 4 4 6 4 4 6 4 4
At some stage in the child’s lifea close friend died 14 7 7 9 7 7 10 7 7
At some stage in the child’s lifea grandparent died 19 13 13 10 13 13 13 13 13
At some stage in the child’s lifea pet died 26 26 26 27 26 26 28 26 26
In the past year child has broken offa steady relationship with a boy orgirlfriend (asked if aged 13 or above) 31 9 10 21 9 10 22 9 10
Base (All children) 95 4,437 4,532 248 4,001 4,249 307 4,227 4,534Base (Children aged 13 or above) 67 2,594 2,661 169 2,331 2,500 204 2,456 2,660
Chapter 4: Attempts by 11-15 year olds to harm, hurt or kill themselves
Crown copyright 2001

Children and adolescents who try to harm, hurt or kill themselves 41
Chapter 4: Attempts by 11-15 year olds to harm, hurt or kill themselves
Crown copyright 2001
Specific indicators of family discord
For most of the 12 indicators of family discord,children who had tried to harm, hurt or killthemselves were at least twice as likely as otherchildren to live in families characterised by pooror “unhealthy” family functioning. For example,avoiding discussion of fears and concerns (29%compared with 16%), a lot of bad feeling in thefamily (18% compared with 7%), makingdecisions is a problem (27% compared with 13%).(Table 4.10)
Physical complaints
The sample of 11-15 year olds who had tried toharm, hurt or kill themselves were vastly morelikely to have a physical complaint, as reportedby their mothers, than the other children in thesurvey. Among the self-harm group of children,14% had difficulties with co-ordination (2% ofthe other children), 6% had epilepsy and 5%were soiling their pants compared to 1% of thosenever having tried to harm themselves. (Table 4.11)
Life threatening experiences,accidents and injuries
About a quarter of parents (28%) who reportedthat their children had tried to harm themselvesalso said that at one time they thought theirchild was so ill that s/he may die. This is incontrast to 11% of the remaining parents.
However, this life-threatening experience mayhave been caused by the child trying to harm,hurt or kill themselves. (Table 4.12)
Use of services
Considering the strong association, shown above,of self-harm with mental disorders, physicalcomplaints, accidents, and injuries, it is notsurprising to note that children who had tried toharm, hurt or kill themselves were far more likelyto have made visits and more frequent visits toGPs and out-patient clinics than other children.(Table 4.13)
The survey only allows us to look at the use ofspecialist services for children who had tried toharm themselves whose mothers indicated theyhad a significant mental health problem. Sixtyper cent had received specialist help fromeducational services with 42% receiving help fromprimary health care services. About a quarterof these children had seen specialist mentalhealth care services such as a psychiatrist or apsychologist and a similar proportion had beenin contact with the social services. (Table 4.14)
Scholastic achievement
Around 40% of 11-15 year olds who had tried toharm themselves had special educational needscompared with 15% of other children.(Table 4.15)

42 Children and adolescents who try to harm, hurt or kill themselves
Table 4.10 Family functioning by whether or not children had ever tried to harm,hurt or kill themselves by source of information
Children aged 11-15
Report of parent Report of children Report of parent orof child aged 11-15 aged 11-15 of child aged 11-15
Not Not NotTried tried All Tried tried All Tried tried All
Family functioning % % % % % % % % %
Planning family activities is difficultbecause we misunderstandeach other 31 21 22 31 21 22 30 21 22
In times of crisis we can not turn toeach other for support 12 4 4 9 4 4 9 4 4
We can not talk to each otherabout the sadness we feel 24 18 18 22 17 18 23 17 18
Individuals are not accepted forwhat they are 8 5 5 7 4 5 8 4 5
We avoid discussing our fearsand concerns 29 16 17 22 16 17 23 16 17
We can not express feelings toeach other 22 8 8 13 8 8 16 8 8
There is lots of bad feeling inthe family 18 7 7 15 7 7 14 7 7
We are not accepted for whatwe are 14 4 5 8 4 5 9 4 5
Making decisions is a problem forour family 27 13 13 18 12 13 20 12 13
We can not make decisions onhow to solve problems 16 8 8 13 7 8 13 7 8
We do not get along well together 12 6 6 9 6 6 10 6 6
We do not confide in each other 17 8 8 14 8 8 15 8 8
Base 94 4,417 4,511 249 3,986 4,235 307 4,206 4,513
Chapter 4: Attempts by 11-15 year olds to harm, hurt or kill themselves
Crown copyright 2001

Children and adolescents who try to harm, hurt or kill themselves 43
Table 4.11 Physical complaints by whether or not children had ever tried to harmhurt or kill themselves by source of information
Children aged 11-15Report of parent Report of children Report of parent or
of child aged 11-15 aged 11-15 of child aged 11-15
Not Not NotTried tried All Tried tried All Tried tried All
Physical complaints % % % % % % % % %
Asthma 18 15 15 18 15 15 19 15 15Eczema 15 10 10 9 10 10 10 10 10Eyesight problems 15 13 13 12 13 13 12 13 13Hay fever 20 14 14 17 14 14 18 14 14Stomach or digestive problems 11 6 6 9 6 6 9 6 6Non-food allergy 12 7 7 8 7 7 8 7 7Migraine/severe headaches 17 8 8 15 8 9 16 8 8Glue ear/otitis media 8 3 3 3 3 3 3 3 3Bed wetting 10 2 2 2 2 2 4 2 2Hearing problems 5 3 3 4 3 3 4 3 3Speech or language problems 11 2 3 5 2 2 6 2 3Food allergy 10 4 4 5 4 4 6 4 4Difficulties with co-ordination 14 2 2 4 2 2 6 2 2Stiffness or deformity of foot 5 2 2 4 2 2 4 2 2Heart problems 1 1 1 2 1 1 2 1 1Soiling pants 5 1 1 2 1 1 2 1 1Muscle disease or weakness 3 1 1 2 1 1 2 1 1Kidney/urinary tract problems 1 1 1 2 1 1 2 1 1Obesity 3 1 1 1 1 1 1 1 1Congenital abnormality 3 0 0 2 0 0 2 0 0Epilepsy 6 1 1 1 0 0 2 1 1Any blood disorder 1 0 0 1 0 0 1 0 0Diabetes 4 1 1 1 0 0 2 1 1
Base 96 4,437 4,533 248 4,001 4,249 306 4,227 4,533
Chapter 4: Attempts by 11-15 year olds to harm, hurt or kill themselves
Crown copyright 2001

44 Children and adolescents who try to harm, hurt or kill themselves
Table 4.12 Life-threatening experiences, accidents and injuries by whetheror not children had tried to harm, hurt or kill themselves by sourceof information
Children aged 11-15Report of parent Report of children Report of parent or
of child aged 11-15 aged 11-15 of child aged 11-15
Not Not Not AllTried tried All Tried tried All Tried tried All
Physically harmful experiences % % % % % % % % %
Accident causing broken bone 26 23 23 25 22 22 25 22 23
Thought child was so ill thats/he may die 28 11 12 16 11 12 18 11 12
Head injury with loss ofconsciousness 8 6 6 7 5 5 8 5 6
Burn requiring hospitaladmission 5 2 2 2 2 2 3 2 2
Accidental poisoning withhospital admission 7 2 2 4 2 2 4 2 2
Base 96 4,437 4,533 248 4,001 4,249 306 4,227 4,533
Chapter 4: Attempts by 11-15 year olds to harm, hurt or kill themselves
Crown copyright 2001
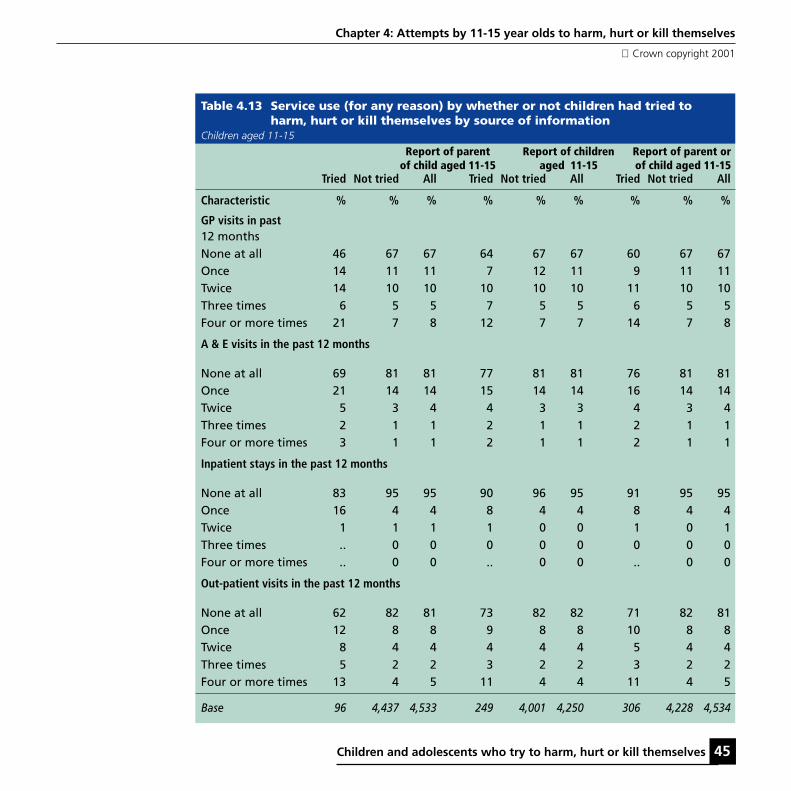
Children and adolescents who try to harm, hurt or kill themselves 45
Table 4.13 Service use (for any reason) by whether or not children had tried toharm, hurt or kill themselves by source of information
Children aged 11-15
Report of parent Report of children Report of parent orof child aged 11-15 aged 11-15 of child aged 11-15
Tried Not tried All Tried Not tried All Tried Not tried All
Characteristic % % % % % % % % %
GP visits in past12 monthsNone at all 46 67 67 64 67 67 60 67 67Once 14 11 11 7 12 11 9 11 11Twice 14 10 10 10 10 10 11 10 10Three times 6 5 5 7 5 5 6 5 5Four or more times 21 7 8 12 7 7 14 7 8
A & E visits in the past 12 months
None at all 69 81 81 77 81 81 76 81 81Once 21 14 14 15 14 14 16 14 14Twice 5 3 4 4 3 3 4 3 4Three times 2 1 1 2 1 1 2 1 1Four or more times 3 1 1 2 1 1 2 1 1
Inpatient stays in the past 12 months
None at all 83 95 95 90 96 95 91 95 95Once 16 4 4 8 4 4 8 4 4Twice 1 1 1 1 0 0 1 0 1Three times .. 0 0 0 0 0 0 0 0Four or more times .. 0 0 .. 0 0 .. 0 0
Out-patient visits in the past 12 months
None at all 62 82 81 73 82 82 71 82 81Once 12 8 8 9 8 8 10 8 8Twice 8 4 4 4 4 4 5 4 4Three times 5 2 2 3 2 2 3 2 2Four or more times 13 4 5 11 4 4 11 4 5
Base 96 4,437 4,533 249 4,001 4,250 306 4,228 4,534
Chapter 4: Attempts by 11-15 year olds to harm, hurt or kill themselves
Crown copyright 2001

46 Children and adolescents who try to harm, hurt or kill themselves
Table 4.14 Specialist services used by children who had ever tried to harm, hurt orkill themselves by source of information
Children aged 11-15
Report of parent Report of children Report of parent orof child aged 11-15 aged 11-15 of child aged 11-15
Specialist services Percentage of children using each service*
Educational services 60 22 29Primary health care services 42 16 22Specialist health care services 26 9 13Social services 27 7 12Alternative therapists 10 2 4Other specialist service 8 4 5
Base 96 251 308
* Percentages add to more than 100% because children may have seen more than one specialist service.
Table 4.15 Scholastic achievement by whether or not children had ever tried toharm, hurt or kill themselves by source of information
Children aged 11-15 with (a) teachers’ data (b) who completed BPVS and BAS assessments
Report of parent Report of children Report of parent orof child aged 11-15 aged 11-15 of child aged 11-15Tried Not tried All Tried Not tried All Tried Not tried All
(a) Special educational needs % % % % % % % % %
None 59 85 84 83 85 85 76 85 84
Stage 1 3 4 4 3 4 4 2 4 4Stage 2 10 4 4 6 4 4 7 4 4Stage 3 12 3 3 3 3 3 5 3 3Stage 4 - 0 0 - 0 0 - 0 0Stage 5 16 4 4 6 4 4 9 4 4
Base 73 3,282 3,355 201 3,028 3,229 242 3,157 3,399
(b) Specific learning difficulties
Present 4 5 5 6 6 7 4 5 5Not present 96 95 95 94 94 93 96 95 95
Base 76 3,863 3,939 234 3,740 3,974 272 3,717 3,989
Chapter 4: Attempts by 11-15 year olds to harm, hurt or kill themselves
Crown copyright 2001

Children and adolescents who try to harm, hurt or kill themselves 47
Chapter 4: Attempts by 11-15 year olds to harm, hurt or kill themselves
Crown copyright 2001
References
Byles, J., Byrne, C., Boyle, M.H., Offord, D.R.(1988) Ontario Child Health Study: Reliability andvalidity of the General Functioning Scale of theMacMaster Family Assessment Device. FamilyProcess, 30(1), 116-123
Fristad, M.A. (1989) A comparison of theMacMaster and circumplex family assessmentinstruments. Journal of Marital and FamilyTherapy, 15, 259-269.
Goldberg, D and Williams, N (1988) The GeneralHealth Questionnaire, London
Goodyer, I.M., Wright, C., and Altham. P.M.E.,(1990) The Friendships and Recent Life Events ofAnxious and Depressed School-Age-Children.British Journal of Psychiatry, 156, (May), 689-698
Miller, I.W., Epstein, N.B., Bishop, D.S. andKeitner, G.I. (1985) The MacMaster FamilyAssessment Device: reliability and Validity.Journal of Marital and Family Therapy, 11, 345-356
Patrick, M.K.S., Angold, A., Burns, B.J., andCostello, E.J., The Child and Adolescent BurdenAssessment (CABA) Parent Interview, Version 4.1,Developmental Epidemiology Program,Duke University.

48 Children and adolescents who try to harm, hurt or kill themselves

Children and adolescents who try to harm, hurt or kill themselves 49
Table 5.1 Proportion of children whohad ever tried to harm, hurt orkill themselves (a) parent bychild, and (b) child by parent
Children aged 11-15
(a) Parents’ reportas a percentage ofchildren’s report Children’s report
Yes No All
Parent’s report % % %
Yes 15.3 1.0 1.8
No 84.7 99.0 98.2
Base 248 4,001 4,249
(b) Children’s reportas a percentage ofparent’s report Parent’s report
Yes No All
Children’s report % % %
Yes 48.7 5.0 5.8
No 51.3 95.0 94.2
Base 78 4,171 4,249
Chapter 5Comparison of data from different sources for 11-15 year olds
5.1 IntroductionThis chapter looks at the relationship betweenthe responses of parents and of the childrenthemselves to the self-harm questions
The analysis differs from that in Chapter 4 as itcovers the answers to parents and children at thesame time. Thus, four groups of 11-15 year oldswere identified.
● Both parent and child reported that childever attempted to harm him/herself.
● Parent reported that child ever attempted toharm him/herself, child did not.
● Child reported that s/he ever attempted toharm him/herself, parent did not
● Neither parent nor child reported that childever attempted to harm him/herself

50 Children and adolescents who try to harm, hurt or kill themselves
Table 5.2 Distribution of psychiatric characteristics of children who had ever tried toharm, hurt or kill themselves by combined source of information
Children aged 11-15
Yes by parent Yes by parent No by parent No by parent AllYes by child No by child Yes by child No by child
Characteristics % % % % %
Hierarchical classificationAny depressive disorder 27 10 9 1 2Other emotional disorder 16 12 9 3 4Other mental disorder 16 15 9 4 4No mental disorder 40 62 72 92 90
Base 38 40 210 3,961 4,250
Overall, 248 children (out of 4249, 11-15 year olds)reported trying to harm, hurt or kill themselvescompared with 78 of parents reports about theirchildren. Using the children reports as the basenumber, only 15% of parents concurred whereasusing the parents’ report as the denominator theagreement level approached 50%.
Similarly, among the 4000 children who said theyhad not tried to harm themselves, 1% of theirparents said they had whereas of the 4171children whose parents said they had not tried toharm themselves, 5% of children said they haddone so. (Table 5.1)
Although all the remaining tables in this chapterpresent data for these four groups the commentarywill focus solely on the group where both parent
Chapter 5: Comparison of data from different sources for 11-15 year olds
Crown copyright 2001
and child have reported the child having once triedto harm, hurt or kill themselves, i.e. 38 children.
5.2 Characteristics ofchildren who had evertried to harm, hurt orkill themselves asreported by bothparents and children
Psychiatric characteristics
Among the thirty-eight, 11-15 year olds whoseparents confirmed their self-harm reports, 60%were assessed as having a mental disorder: 27%with depression, 16% with anxiety and 16% withanother mental disorder. (Table 5.2)

Children and adolescents who try to harm, hurt or kill themselves 51
Table 5.3 Distribution of the socio-demographic characterstics of children who hadever tried to harm, hurt or kill themselves by combined source of information
Children aged 11-15
Yes by parent Yes by parent No by parent No by parent AllYes by child No by child Yes by child No by child
Characteristics % % % % %
Age11-12 year olds 18 30 35 41 4113-15 year olds 82 70 65 59 59
SexBoys 35 46 45 50 50Girls 65 54 55 50 50
EthnicityWhite 95 95 89 92 92Black - 5 3 3 3Indian 3 - 3 2 2Pakistani & Bangladeshi 3 - 3 2 2Other - - 2 2 2
Family typeCouples 71 60 73 77 77Lone parents 29 40 27 23 23
Family structureWith step child 21 20 14 10 10No step children 79 80 86 90 90
No. of children in family1 24 32 21 29 282 40 37 45 43 433 16 22 24 20 204 11 5 6 6 65 8 5 4 2 2
Base 38 40 210 3,961 4,250
Socio-demographic characteristics
In terms of their socio-demographic characteristics,82% were aged 13 or older, 65% were girls, 29%
Chapter 5: Comparison of data from different sources for 11-15 year olds
Crown copyright 2001
were children living in lone parent families, and21% were in reconstituted families. Nearly 1 in 5were in families of four or more children.(Table 5.3)

52 Children and adolescents who try to harm, hurt or kill themselves
Chapter 5: Comparison of data from different sources for 11-15 year olds
Crown copyright 2001
Family and householdcharacteristics
Among the 38 children with both self andparental reports of self harm, 68% were infamilies with all parents workings (includinglone parent families), 39% lived in a terracedhouse or maisonette, 50% were living in rentedaccommodation, 47% were in families withmanual occupations and 43% were living in thepoorest neighbourhoods. (Table 5.4)
Social functioning characteristics
Thirty two per cent of children, whoseparents confirmed their self harm report, hadexperienced 3 or more stressful life events, 36%had parents whose GHQ12 score was 7 or above,41% were living with some degree of familydiscord and 32% were frequently punished.(Table 5.5)
Particular stressful life events
Of the 38 children who had tried to harm, hurtor kill themselves, as reported by parents andchildren, about a half were in families wherethere was a separation due to marital difficultiesor a relationship broken off. About a quarter ofthese children were in families that had suffered amajor financial crisis. (Table 5.6)
Specific indicators of familydiscord
Among our sample of 38 children, about 1 in 3of their parents reported that “planning familyactivities are difficult because we misunderstandeach other”. A similar proportion agreed with thestatement that “we avoid discussing our fears orconcerns”. A quarter of their parents said thatmaking decisions was a problem for the family;one in four parents also stated that there was lotsof bad feeling in the family. (Table 5.7)
Physical complaints
In relation to physical complaints the sample of11-15 year olds who had tried to harm, hurt orkill themselves reported by both parents and thechildren themselves were not particularlydifferent from those where self-harm wasmentioned from one source. About one in fivehad hay fever and eyesight problems and one insix suffered from severe headaches or migraine.(Table 5.8)
Life threatening experiences,accidents and injuries
Parents of about 30% of the sample of the 38children said that that at some time they thoughttheir child was so ill that s/he may die. (Table 5.9)

Children and adolescents who try to harm, hurt or kill themselves 53
Table 5.4 Distribution of household and areal characterstics of children who had evertried to harm, hurt or kill themselves by combined source of information
Children aged 11-15
Yes by parent Yes by parent No by parent No by parent AllYes by child No by child Yes by child No by child
Characteristics % % % % %Family employment statusAll working 68 70 69 73 73One working, one not working18 8 17 15 15All not working 13 22 14 12 12
Type of accommodationDetached house 21 31 28 26 26Semi-detached house 40 26 35 40 39Terraced house 29 33 34 28 29Flat or maisonette 10 10 3 6 6
TenureOwners 50 46 71 71 70Social sector tenants 34 49 25 24 24Private renters 16 5 4 6 6
Social ClassI 5 8 6 8 8II 37 30 38 33 33III Nonmanual 5 8 11 12 12III Manual 21 20 26 25 25IV 21 18 13 14 14V 5 5 4 5 5Armed Forces 3 - - 0 0FT student 3 2 - 1 1Never worked - 8 1 1 1Inadequate information - 2 0 1 1
ACORNThriving 19 18 20 20 20Expanding 3 8 13 14 14Rising 5 3 7 6 6Settling 16 26 25 23 23Aspiring 14 15 12 14 14Striving 43 31 22 24 24
CountryEngland 87 90 90 86 86Scotland 5 2 6 9 9Wales 8 7 3 5 5
Base 38 40 210 3,961 4,249
Chapter 5: Comparison of data from different sources for 11-15 year olds
Crown copyright 2001

54 Children and adolescents who try to harm, hurt or kill themselves
Table 5.5 Distribution of social functioning characterstics of children who had evertried to harm, hurt or kill themselves by combined source of information
Children aged 11-15
Yes by parent Yes by parent No by parent No by parent AllYes by child No by child Yes by child No by child
Characteristics % % % % %
Number of stressful life events0 19 10 20 26 261 30 35 34 34 342 10 15 21 23 233 16 18 12 11 114 11 18 8 5 55 5 15 5 1 2
Parent’s GHQ score0-2 47 50 60 74 723-5 16 28 15 14 147-9 10 20 14 8 810-12 26 12 11 5 6
Family functioningVery healthy 17 22 30 33 32Fairly healthy 42 42 40 48 47Fairly unhealthy 33 22 25 18 18Very unhealthy 8 12 5 2 3
Punishment regimeSeldom or occasional 68 66 73 79 79Frequent 32 34 27 21 21
Base 38 40 210 3,960 4,247
Chapter 5: Comparison of data from different sources for 11-15 year olds
Crown copyright 2001
Use of services
Not surprisingly, the use of services was moreprevalent among children whose parents saidthat their children had tried to hurt, harm or killthemselves. Where the child concurred with theparents report of self harm, 60% had usededucational services, 35% accessed primaryhealth care services, 21% had contact with social
services and 18% had specialist mental healthcare services. (Table 5.10, 5.11)
Scholastic achievement
A third of 11-15 year olds who had tried to harm,hurt or kill themselves, as stated by both parentand child, had special educational needs.(Table 5.12)

Children and adolescents who try to harm, hurt or kill themselves 55
Table 5.6 Experience of life course events of children who had ever tried to harm,hurt or kill themselves by combined source of information
Children aged 11-15
Yes by parent Yes by parent No by parent No by parent AllYes by child No by child Yes by child No by child
Lifecourse event % % % % %
Since child was born parent had aseparation due to marital difficultiesor broken off a steady relationship 53 55 43 33 34
Since child was born parent (orpartner) had a major financial crisissuchas losing the equivalent ofthree months income 24 27 24 17 18
Since child was born parent (orpartner) had a problem with thepolicenvolving a court apperance 10 12 12 7 7
At some stage in the child’s lifes/he had a serious illness whichrequired a stay in hospital 21 24 22 20 20
At some stage in the child’s lifes/he had been in a serious accidentor badly hurt in an accident 10 20 7 6 6
At some stage in the child’s lifea parent, brother or sister died 10 10 5 4 4
At some stage in the child’s lifea close friend died 8 15 9 7 7
At some stage in the child’s lifea grandparent died 10 28 10 13 13
At some stage in the child’s lifea pet died 13 46 29 26 26
In the past year child has broken offa steady relationship with a boy orgirlfriend (asked if aged 13 or above) 36 25 17 9 10
Base (All children) 38 44 210 3,960 4,249Base (Children aged 13 or above) 31 28 138 2,303 2,500
Chapter 5: Comparison of data from different sources for 11-15 year olds
Crown copyright 2001

56 Children and adolescents who try to harm, hurt or kill themselves
Table 5.7 Family functioning characteristics of children who had ever tried to harm,hurt or kill themselves by combined source of information
Children aged 11-15
Yes by parent Yes by parent No by parent No by parent AllYes by child No by child Yes by child No by child
Family functioning % % % % %
Planning family activities isdifficult because wemisunderstand each other 38 28 30 21 22
In times of crisis we can not turntoeach other for support 16 10 9 4 4
We can not talk to each otherabout the sadness we feel 18 32 22 17 18
Individuals are not accepted forwhat they are 3 12 8 4 5
We avoid discussing our fearsand concerns 32 32 20 16 17
We can not express feelings toeach other 19 22 12 8 8
There is lots of bad feeling inthe family 27 12 13 7 7
We are not accepted for whatwe are 16 15 6 4 5
Making decisions is a problem forour family 24 27 16 12 13
We can not make decisions onhow to solve problems 20 13 12 7 8
We do not get along well together 10 10 8 6 6
We do not confide in each other 11 20 15 8 8
Base 38 40 210 3,947 4,234
Chapter 5: Comparison of data from different sources for 11-15 year olds
Crown copyright 2001

Children and adolescents who try to harm, hurt or kill themselves 57
Table 5.8 Physical complaints of children who had ever tried to harm, hurt or killthemselves by combined source of information
Children aged 11-15
Yes by parent Yes by parent No by parent No by parent AllYes by child No by child Yes by child No by child
Physical complaints % % % & %
Asthma 14 21 19 15 15Hay fever 19 16 17 14 14Migraine/severe headaches 16 14 15 8 9Eyesight problems 19 11 11 13 13Eczema 10 13 8 10 10Stomach or digestive problems 7 10 9 6 6Non-food allergy 14 13 7 7 7Food allergy 11 13 4 4 4Speech or language problems 8 10 4 2 2Difficulties with co-ordination 11 7 3 2 2Bed wetting 5 10 2 2 2Hearing problems 5 5 4 3 3Stiffness or deformity of foot 6 5 4 2 2Glue ear/otitis media 11 5 1 3 3Kidney/urinary tract problems - 2 2 1 1Obesity 3 5 1 1 1Heart problems 3 - 2 1 1Soiling pants 5 5 1 0 1Muscle disease or weakness 3 - 1 1 1Epilepsy 3 6 1 0 1Diabetes 5 3 1 1 1Congenital abnormality 3 - 2 0 0Any blood disorder 3 - 1 0 0
Base 38 40 210 3,961 4,249
Chapter 5: Comparison of data from different sources for 11-15 year olds
Crown copyright 2001

58 Children and adolescents who try to harm, hurt or kill themselves
Table 5.9 Physically harmful experiences of children who had ever tried to harm,hurt or kill themselves by combined source of information
Children aged 11-15
Yes by parent Yes by parent No by parent No by parent AllYes by child No by child Yes by child No by child
Physically harmful experiences % % % % %
Accident causing broken bone 30 27 24 22 22
Thought child was so ill thats/he may die 29 29 13 11 12
Head injury with loss ofconsciousness 5 8 8 5 5
Accidental poisoning withhospital admission 10 5 2 2 2
Burn requiring hospital admission - 10 2 2 2
Base 38 40 210 3,961 4,250
Chapter 5: Comparison of data from different sources for 11-15 year olds
Crown copyright 2001

Children and adolescents who try to harm, hurt or kill themselves 59
Table 5.10 Service use (for any reason) of children who had ever tried to harm, hurtor kill themselves by combined source of information
Children aged 11-15
Yes by parent Yes by parent No by parent No by parent AllYes by child No by child Yes by child No by child
Characteristic % % % % %
GP visits in past 12 monthsNone at all 50 58 66 67 67Once 8 8 7 12 11Twice 10 20 10 10 10Three times 13 - 6 5 5Four or more times 18 15 11 7 7
A & E visits in the past 12 monthsNone at all 66 75 79 82 81Once 18 20 14 13 14Twice 8 - 4 3 3Three times 5 - 1 1 1Four or more times 3 5 2 1 1
Inpatient stays in the past 12 monthsNone at all 74 95 93 95 95Once 24 5 5 4 4Twice 3 - 1 0 0Three times - 1 0 0Four or more times - - - 0 0
Out-patient visits inthe past 12 monthsNone at all 66 68 74 82 82Once 8 12 9 8 8Twice 5 8 4 4 4Three times 8 5 2 2 2Four or more times 13 8 10 4 4
Base 38 40 210 3,961 4,250
Chapter 5: Comparison of data from different sources for 11-15 year olds
Crown copyright 2001

60 Children and adolescents who try to harm, hurt or kill themselves
Table 5.11 Specialist services used by children who had ever tried to harm, hurt orkill themselves by combined source of information
Children aged 11-15
Yes by parent Yes by parent No by parentYes by child No by child Yes by child
Specialist services % % %
Educational services 60 50 15Primary health care services 35 40 13Specialist health care services 18 25 8Social services 21 18 5Alternative therapists 5 10 1Other specialist service 8 8 3
Base 38 40 211
* Percentages add to more than 100% because children may have seen more than one specialist service.
Table 5.12 Scholastic achievement of children who had ever tried to harm, hurt orkill themselves by combined source of information
Children aged 11-15
Yes by parent Yes by parent No by parent No by parent AllYes by child No by child Yes by child No by child
(a) Special educational needs % % % % %
None 76 58 84 86 85
Stage 1 6 - 2 4 4Stage 2 6 12 6 4 4Stage 3 6 12 2 3 3Stage 4 - - - 0 0Stage 5 6 19 6 4 4
Base 34 26 166 2,959 3,195
(b) Specific learning difficulties
Present - 9 5 5 5Not present 100 91 95 95 95
Base 38 35 194 3,717 3,989
Chapter 5: Comparison of data from different sources for 11-15 year olds
Crown copyright 2001

Children and adolescents who try to harm, hurt or kill themselves 61
Glossary of terms
ACORN classification
ACORN is a geodemographic targetingclassification, combining geographical anddemographic characteristics to distinguishdifferent types of people in different areas inGreat Britain.(CACI Information Services,(1993), ACORN User Guide, CACI Limited 1994.All Rights Reserved. Source: ONS and GRO(S)© Crown Copyright 1991. All Rights Reserved)
Although the ACORN classification has variouslevels, 6 categories, 17 groups and 54 types, forthe purposes of this report, the highest level, i.e.the six broad categories have been chosen forcomparative analysis. The ACORN User Guidegives the following description of each category.
Thriving: wealthy achievers, suburban areas;affluent greys, rural communities; prosperouspensioners, retirement areas.Expanding: affluent executives, family areas;well-off workers, family areas.Rising: affluent urbanites, town and city areas,prosperous professionals, metropolitan areas;better off executives, inner city areas.Settling: comfortable middle agers, mature homeowning areas; skilled workers, home owning areas.Aspiring: new home owners, mature communities;white collar workers, better-off multi-ethnic areas.Striving: older people, less prosperous areas;council estate residents, better off homes; councilestate residents, high unemployment; council
estate residents, greater hardship, people inmulti-ethnic, low-income areas.
Burden of mental disorders
The burden of the child’s problem is a measureof the consequences of the symptoms in terms ofwhether they cause distress to the family bymaking the parents worried, depressed, tired orphysically ill.
Case vignettes
This case vignette approach for analysing surveydata uses clinician ratings based on a reviewof all the information of each subject. Thisinformation includes not only the questionnairesand structured interviews but also any additionalcomments made by the interviewers, and thetranscripts of informants’ comments to open-ended questions particularly those which askabout the child’s significant problems.
Educational level
Educational level was based on the highesteducational qualification obtained and wasgrouped as follows:
Degree (or degree level qualification)
Teaching qualification
HNC/HND, BEC/TEC Higher, BTEC Higher
City and Guilds Full Technological Certificate
Nursing qualifications: (SRN, SCM, RGN, RM,RHV, Midwife)

62 Children and adolescents who try to harm, hurt or kill themselves
A-levels/SCE higher
ONC/OND/BEC/TEC/not higher
City and Guilds Advanced/Final level
GCE O-level (grades A-C if after 1975)
GCSE (grades A-C)
CSE (grade 1)
SCE Ordinary (bands A-C)
Standard grade (levels 1-3)
SLC Lower SUPE Lower or Ordinary
School certificate or Matric
City and Guilds Craft/Ordinary level
GCE O-level (grades D-E if after 1975)
GCSE (grades D-G)
CSE (grades 2-5)
SCE Ordinary (bands D-E)
Standard grade (levels 4-5)
Clerical or commercial qualifications
Apprenticeship
Other qualifications
CSE ungraded
No qualifications
Ethnic Group
Household members were classified into ninegroups:
White
Black – Caribbean
Black – African
Black – Other
Indian
Pakistani
Bangladeshi
Chinese
None of these
For analysis purpose these nine groups weresubsumed under 5 headings: White, Black,Indian, Pakistani and Bangladeshi and other
Household
The standard definition used in most surveyscarried out by ONS Social Survey Division, andcomparable with the 1991 Census definition of ahousehold, was used in this survey. A householdis defined as a single person or group of peoplewho have the accommodation as their only ormain residence and who either share one meal aday or share the living accommodation. (See EMcCrossan A Handbook for interviewers. HMSO:London 1985.)
Glossary of terms
Crown copyright 2001

Children and adolescents who try to harm, hurt or kill themselves 63
Impact of mental disorders
Impact refers to the consequences of the disorderfor the child in terms of social impairment anddistress. Social impairment refers to the extent towhich the disorder interferes with the child’severyday life in terms of his or her home life,friendships, classroom learning or leisure activities.
Marital status
Two questions were asked to obtain the maritalstatus of the interviewed parent. The first asked:“Are you single, that is never married, marriedand living with your husband/wife, married andseparated from your husband/wife, divorced orwidowed?” The second question asked of every-one except those married and living with husband/wife was “May I just check, are you living withsomeone else as a couple?” The stability of thecohabitation was not assessed.
Mental disorders
The questionnaires used in this survey were basedon both the ICD10 and DSM-IV diagnosticresearch criteria, but this report uses the termsmental disorders as defined by the ICD-10: toimply a clinically recognisable set of symptomsor behaviour associated in most cases withconsiderable distress and substantial interferencewith personal functions.
Region
When the survey was carried out there were 14Regional Health Authorities in England. Thesewere used in the sample design for stratification.
Scotland and Wales were treated as two distinctareas. However, for analysis purposes, the postalsectors were allocated to Government OfficeRegions with Metropolitan counties (GOR2):
1. North East Met
2. North East Non Met
3. North West Met
4. North West Non Met
5. Merseyside
6. Yorks and Humberside Met
7. Yorks and Humberside Non Met
8. East Midlands
9. West Midlands Met
10. West Midlands Non Met
11. Eastern Outer Met
12. Eastern Other
13. London Inner
14. London Outer
15. South East Outer Met
16. South East Other
17. South West
18. Wales 1 – Glamorgan, Gwent
19. Wales 2 – Clwydd, Gwenneyd, Dyfed,Powys
20. Scotland 1 – Highlands, Grampian, Tayside
21. Scotland 2 – Fife, Central, Lothian
22. Scotland 3 – Glasgow Met
23. Scotland 3 – Strathclyde Exc Glasgow
24. Scotland 4 – Borders, Dumfries, Galloway
Glossary of terms
Crown copyright 2001

64 Children and adolescents who try to harm, hurt or kill themselves
Glossary of terms
Crown copyright 2001
These 24 codes were collapsed into sevencategories and in the tables the two areas ofScotland were grouped together.
1. Inner London
2. Outer London
3. Metropolitan England
4. Non-metropolitan England
5. Wales
6. Glasgow Met
7. Other Scotland
Social class
Based on the Registrar General’s StandardOccupational Classification, Volume 3 OPCSLondon: HMSO 1991, social class was ascribed onthe basis of occupation and industry:
Descriptive definition Social class
Professional IIntermediate occupations IISkilled occupations– non-manual III non-manualSkilled occupations– manual III manualPartly-skilled IVUnskilled occupations VArmed Forces
Social class was not determined where informant(and spouse) had never worked, or was afull-time student or whose occupation wasinadequately described.
Tenure
Tenure was assessed by asking two standardquestions: how the accommodation wasoccupied and who was the landlord.
How accommodation was occupied
Own outright
Buying it with the help of a mortgage or loan
Pay part rent and part mortgage (shared ownership)
Rent it
Live here rent free (including rent free in relative’sor friend’s property)
Squatting
Type of landlord
Local authority or Council or New Towndevelopment or Scottish Homes
A housing association or co-operative orcharitable trust
Employer (Organisation) of a household member
Another organisation
Relative or friend (before living there) of ahousehold member
Employer (individual) of a household member
Another individual private landlord
Three types of tenure categories were created:
Owners means bought without mortgage or loanor with a mortgage or loan which has been paidoff. Includes co-ownership and shared ownershipschemes.

Children and adolescents who try to harm, hurt or kill themselves 65
Glossary of terms
Crown copyright 2001
Social sector tenants means rented from localauthorities, New Town corporations or commis-sions or Scottish Homes, and housing associationswhich include co-operatives and property ownedby charitable trusts.
Private renters includes rent from organisations(property company, employer or other organisa-tion) and from individuals (relative, friend,employer or other individual.
Type of accommodation
Four types of accommodation were created:
Detached means a detached house or bungalow
Semi-detached includes a semi-detached wholehouse or bungalow
Terraced means a terraced or end of terracedwhole house or bungalow
Flat/maisonette includes a purpose built flat ormaisonette in block, converted flat or maisonettein house, a room in a house or block, a bedsit.
Working status
Working adults
The two categories of working adults includepersons who did any work for pay or profit in theweek ending the last Sunday prior to interview,even if it was for as little as one hour, includingSaturday jobs and casual work (e.g. babysitting,running a mail order club).
Self-employed persons were considered to beworking if they worked in their own business,professional practice, or farm for the purpose ofmaking a profit, or even if the enterprise wasfailing to make a profit or just being set up.
The unpaid ‘family worker’ (e.g., a wife doing herhusband’s accounts or helping with the farm orbusiness) was included as working if the workcontributed directly to a business, farm or familypractice owned or operated by a related memberof the same household. (Although the individualconcerned may have received no pay or profit,her contribution to the business profit countedas paid work). This only applied when thebusiness was owned or operated by a memberof the same household.
Anyone on a Government scheme which wasemployer based was also ‘working last week’
Informants definitions dictated whether they feltthey were working full time or part time.
Unemployed adults
This category included those who were waitingto take up a job that had already been obtained,those who were looking for work, and peoplewho intended to look for work but prevented bytemporary ill-health, sickness or injury.

66 Children and adolescents who try to harm, hurt or kill themselves
Glossary of terms
Crown copyright 2001
Economically inactive adults
This category comprised five main categoriesof people:
“Going to school or college” only applied topeople who were under 50 years of age. Thecategory included people following full timeeducational courses at school or at furthereducation establishments (colleges, universityetc). It included all school children (16 yearsand over).
During vacations, students were still coded as‘going to school or college’. If their return tocollege depends on passing a set of exams, youshould code on the assumption that they will bepassed. If however, they were having a breakfrom full time education, i.e. they were taking ayear out, they were not counted as being in fulltime education.
“Permanently unable to work” only applied tothose under state retirement age, i.e. to men aged16 to 64 and to women aged 16 to 59. Includewere people whose inability to work was due tohealth or emotional problems or disablement.
“Retired” only applied to those who retired fromtheir full-time occupation at approximately theretirement age for that occupation, and were notseeking further employment of any kind.
“Looking after the home or family” coveredanyone who was mainly involved in domesticduties, provided this person had not already beencoded in an earlier category.
“Doing something else” included anyone forwhom the earlier categories were inappropriate.

Children and adolescents who try to harm, hurt or kill themselves 67
Addresses
Howard Meltzer Office for National Statistics1 Drummond GateLondonSW1V 2QQ
Richard Harrington The University of ManchesterSchool of Psychiatry and Behavioural SciencesChild and Adolescent PsychiatryRoyal Manchester Children’s HospitalPendleburyManchesterM27 4HA
Robert Goodman Department of Child and Adolescent PsychiatryInstitute of PsychiatryDe Crespigny ParkDenmark HillLondonSE5 8AF
Rachel Jenkins WHO Collaborating Centre for Mental HealthInstitute of PsychiatryDe Crespigny ParkDenmark HillLondonSE5 8AF

68 Children and adolescents who try to harm, hurt or kill themselves


![[ 3 : ] hurt skirt](https://static.fdocuments.us/doc/165x107/56812eda550346895d9479e7/-3-hurt-skirt.jpg)