Childhood Obesity: A Riverside County Perspective Obesity...Average weight in1960 ¾ Man = 166.3 lbs...
40
Childhood Obesity: A Riverside County Perspective Danyte S. Mockus, PhD, MPH November 16, 2010 Riverside County Department of Public Health
Transcript of Childhood Obesity: A Riverside County Perspective Obesity...Average weight in1960 ¾ Man = 166.3 lbs...
Childhood Obesity: A Riverside County Perspective
Danyte S. Mockus, PhD, MPHNovember 16, 2010
Riverside County Department of Public Health

STATUS OF OUR NATION AND COUNTY
Obesity Statistics
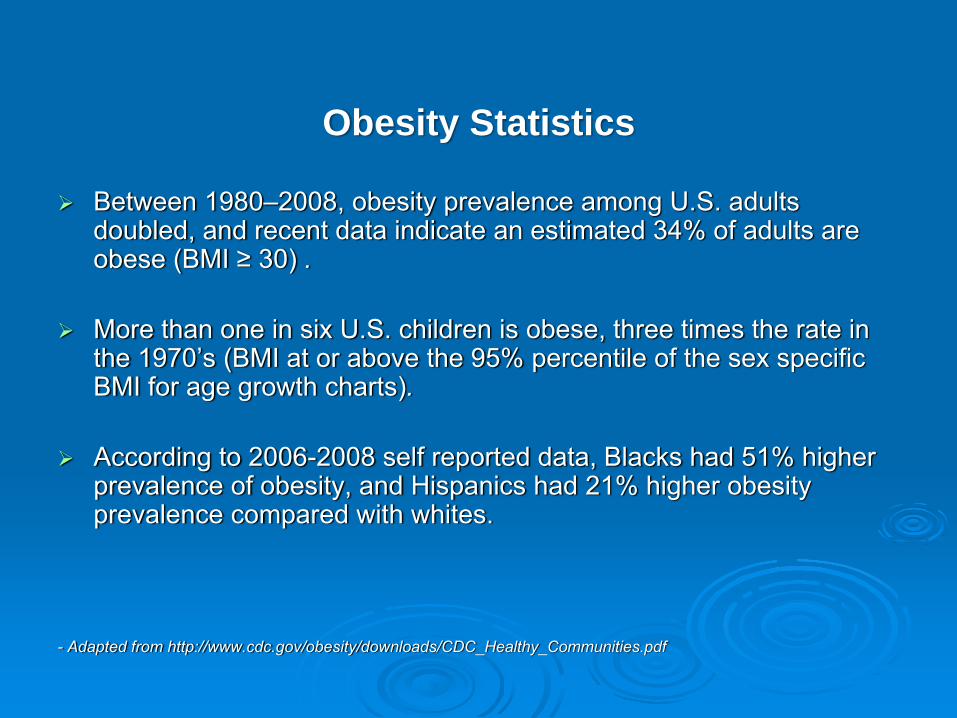
Between 1980–2008, obesity prevalence among U.S. adults doubled, and recent data indicate an estimated 34% of adults are obese (BMI ≥ 30) .
More than one in six U.S. children is obese, three times the rate in the 1970’s (BMI at or above the 95% percentile of the sex specific BMI for age growth charts).
According to 2006-2008 self reported data, Blacks had 51% higher prevalence of obesity, and Hispanics had 21% higher obesity prevalence compared with whites.
- Adapted from http://www.cdc.gov/obesity/downloads/CDC_Healthy_Communities.pdf
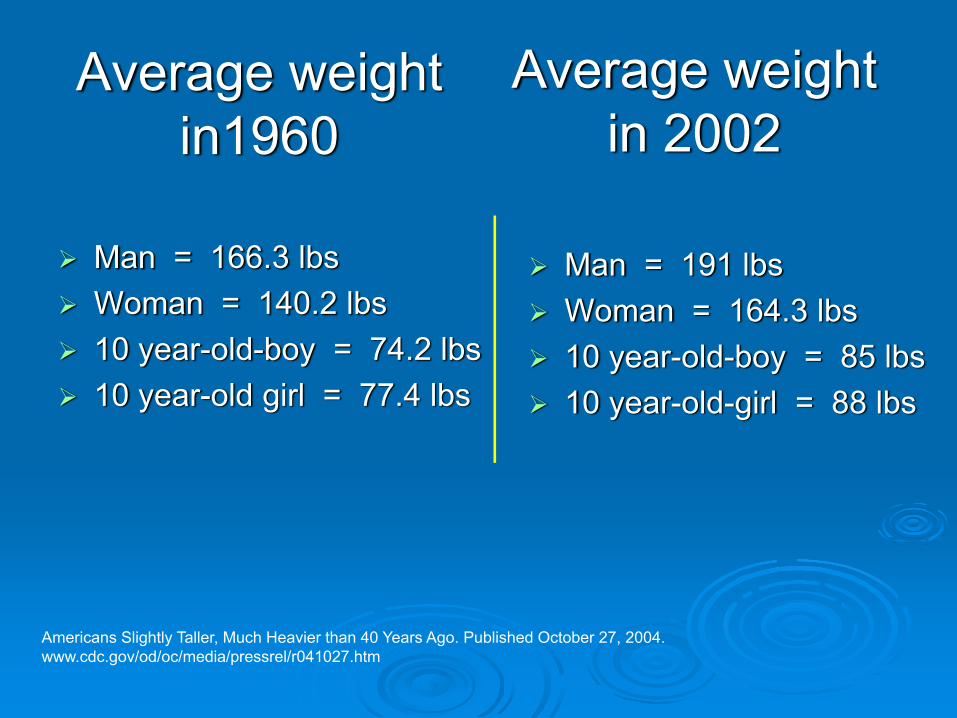
Average weight in1960
Man = 166.3 lbsWoman = 140.2 lbs10 year-old-boy = 74.2 lbs10 year-old girl = 77.4 lbs
Man = 191 lbsWoman = 164.3 lbs10 year-old-boy = 85 lbs10 year-old-girl = 88 lbs
Americans Slightly Taller, Much Heavier than 40 Years Ago. Published October 27, 2004. www.cdc.gov/od/oc/media/pressrel/r041027.htm
Average weight in 2002
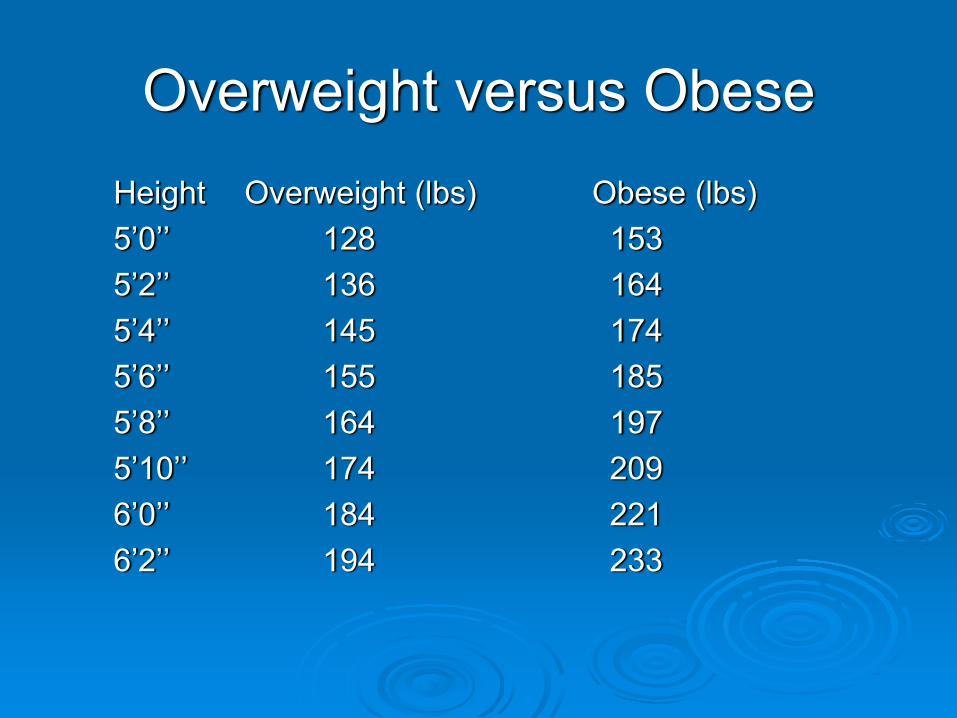
Overweight versus ObeseHeight Overweight (lbs) Obese (lbs)5’0’’ 128 1535’2’’ 136 1645’4’’ 145 1745’6’’ 155 1855’8’’ 164 1975’10’’ 174 2096’0’’ 184 2216’2’’ 194 233

Global Trends in Obesity
Overweight - Prevalence in men aged 15 and over (2002, overweight = Body Mass Index ≥ 25 kg per meter squared). CDC. http://apps.nccd.cdc.go/dcpcglobalatlas/DietNutrition.aspx#WorldMap (accessed 12/01/07)

Obesity Trends* Among U.S. AdultsBRFSS, 1990
(*BMI ≥30, or ~ 30 lbs. overweight for 5’ 4” person)
No Data <10% 10%–14%

Obesity Trends* Among U.S. AdultsBRFSS, 1995
(*BMI ≥30, or ~ 30 lbs. overweight for 5’ 4” person)
No Data <10% 10%–14% 15%–19%

Obesity Trends* Among U.S. AdultsBRFSS, 2000
(*BMI ≥30, or ~ 30 lbs. overweight for 5’ 4” person)
No Data <10% 10%–14% 15%–19% ≥20%

Obesity Trends* Among U.S. AdultsBRFSS 2005
(*BMI ≥30, or ~ 30 lbs. overweight for 5’ 4” person)
No Data <10% 10%–14% 15%–19% 20%–24% 25%–29% ≥30%

Obesity Trends* Among U.S. AdultsBRFSS 2009
(*BMI ≥30, or ~ 30 lbs. overweight for 5’ 4” person)
No Data <10% 10%–14% 15%–19% 20%–24% 25%–29% ≥30%

"The U.S. population may be inadvertently saving Social Security by becoming more obese."
Olshansky et al. A Potential Decline in Life Expectancy in the United States in the 21st Century. NEJM March 17, 2005; 352: 1138-45.
0%
2%
4%
6%
8%
10%
12%
14%
16%
18%
20%
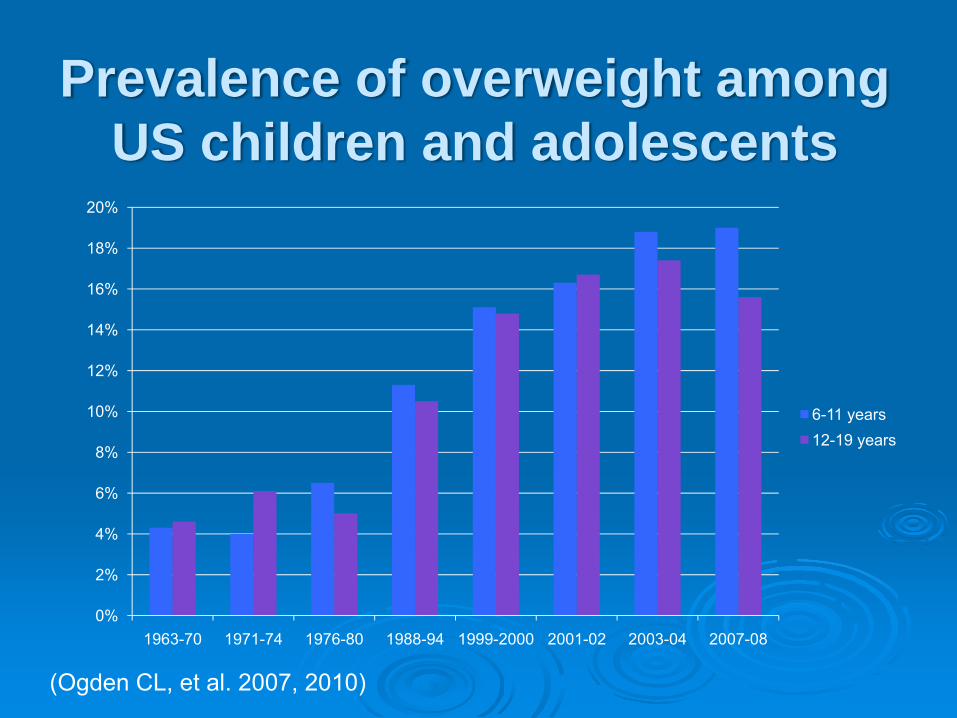
1963-70 1971-74 1976-80 1988-94 1999-2000 2001-02 2003-04 2007-08
6-11 years12-19 years
Prevalence of overweight among US children and adolescents
(Ogden CL, et al. 2007, 2010)
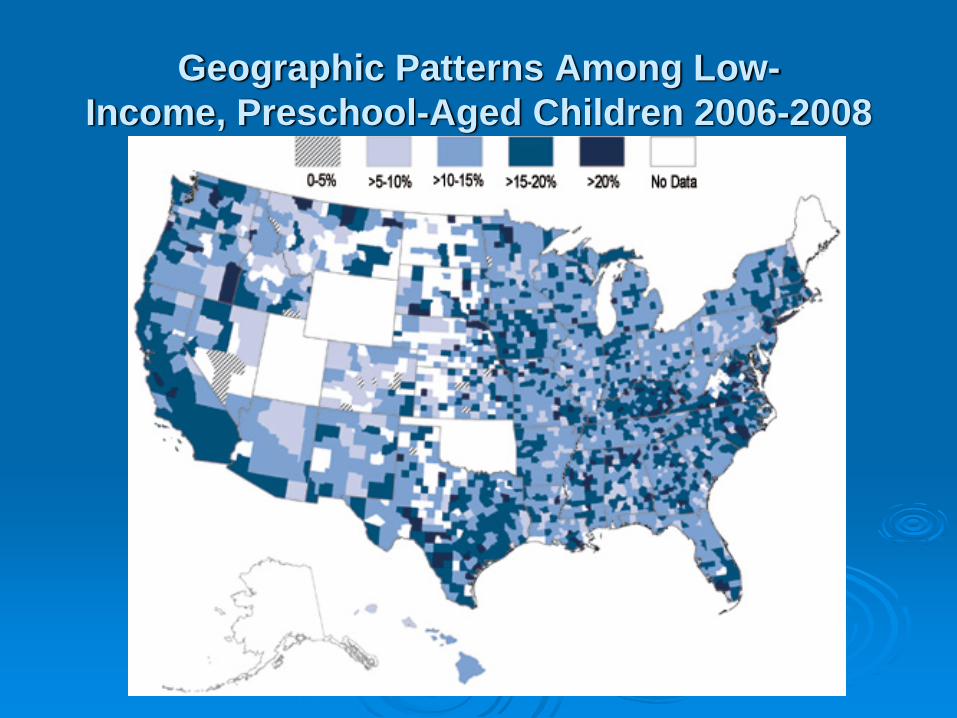
Geographic Patterns Among Low-Income, Preschool-Aged Children 2006-2008
“This may be the first generation of children who do not outlive their parents.”
-Deborah Taylor-TateCommissioner, FCC

CAUSES OF OBESITY
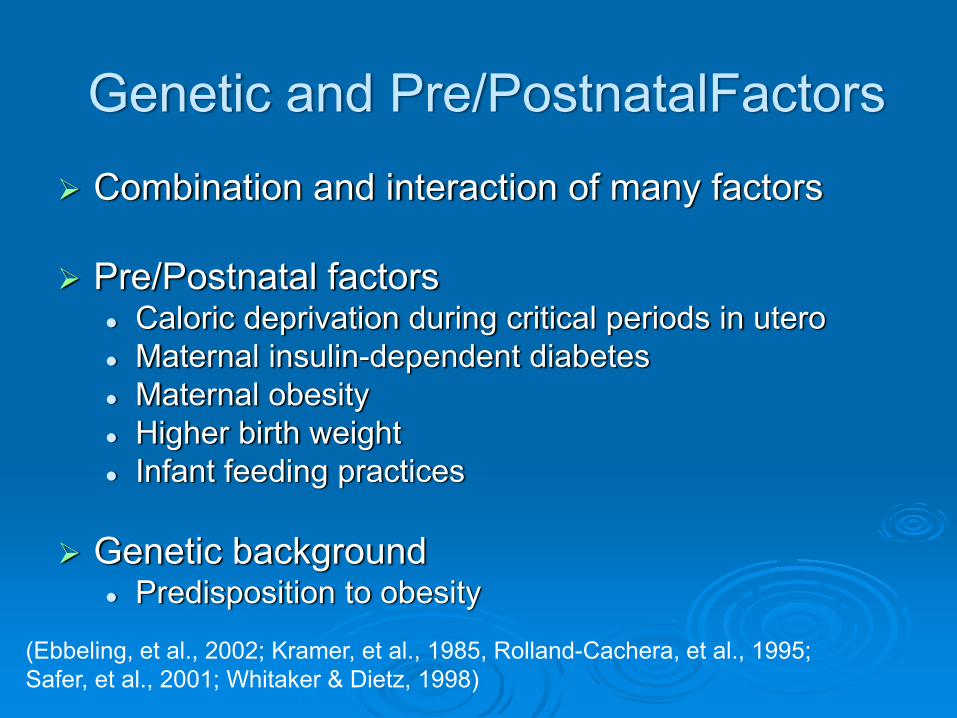
Genetic and Pre/PostnatalFactorsCombination and interaction of many factors
Pre/Postnatal factorsCaloric deprivation during critical periods in uteroMaternal insulin-dependent diabetesMaternal obesityHigher birth weightInfant feeding practices
Genetic backgroundPredisposition to obesity
(Ebbeling, et al., 2002; Kramer, et al., 1985, Rolland-Cachera, et al., 1995; Safer, et al., 2001; Whitaker & Dietz, 1998)

Behavioral and Environmental Contributing Factors
Increasing portion sizesIncreased saturated fat consumptionIncreased simple carbohydrate consumptionIncreased sugar-sweetened beverage consumption and energy-dense, nutrient poor food choicesDecreased physical activity Increased sedentary behavior
(AAP, 1997; Anderson, et al., 1998; Ebbeling, et al., 2002; Epstein & Goldfield, 1999; McGloin, et al., 2002)

Dietary Behaviors
Increased consumption of sugar sweetened beverages
Continued low consumption of fruitsand vegetables
- Adapted from http://www.cdc.gov/obesity/downloads/CDC_Healthy_Communities.pdf

Dietary Behaviors
Increased frequency of meals eaten away from home
- Adapted from http://www.cdc.gov/obesity/downloads/CDC_Healthy_Communities.pdf

The Food Environment
Increased number of fast food establishments in the U.S.
Lack of access to full service grocery stores selling affordable healthful foods
Less healthy food & beverage advertising aimed at children
- Adapted from http://www.cdc.gov/obesity/downloads/CDC_Healthy_Communities.pdf

Physical Activity
35.5% of adults do not engage in recommended levels of physical activity for health benefits (21) and 25.4% of adults report no leisure-time activity (23)
In 2009, 81.6% of high school students did not participate in 60 or more minutes of physical activity on any day of the previous 7 days (22).
Only 30.3% of high school students, grades 9-12, have daily P.E. (23).
- Adapted from http://www.cdc.gov/obesity/downloads/CDC_Healthy_Communities.pdf

Community Design & the Built EnvironmentStandardized Share of Mode for Trips to School:
National Personal Transportation Survey
0
10
20
30
40
50
60
1969 1977 1983 1990 1995 2001
Year
% o
f Trip
s
Car
Bus
Walk/bike
Public Transit
McDonald NC. Am J Prev Med 2007;32:509
- Adapted from http://www.cdc.gov/obesity/downloads/CDC_Healthy_Communities.pdf

Community Design & the Built EnvironmentEnvironmental factors beyond the control of individuals contribute to increased obesity rates by reducing the likelihood of healthy eating and active living behaviors.
Environmental factors that influence physical activity behavior (26, 27):
Lack of infrastructure supporting active modes of transportation, i.e. sidewalks & bike facilitiesAccess to safe places to play and be activeAccess to public transitMixed use & Transit Oriented Developments
- Adapted from http://www.cdc.gov/obesity/downloads/CDC_Healthy_Communities.pdf

CONSEQUENCES OF OBESITY

Obesity Increases the Risk for…High blood pressureHigh cholesterolHeart diseaseStrokeDiabetesCancer (colon, breast, ovarian, uterine, esophageal, kidney, blood, gallbladder, pancreas)
ArthritisHeartburnDisabilitySleep disordersAlzheimer’sDepressionInfertilityErectile DysfunctionUrinary IncontinenceBirth Defects

Top Ten Causes of Death in the United States
1. Heart Disease 616,0672. Cancer 562,8753. Stroke 135,9524. Lung Disease 127,9245. Accidents 123,7066. Alzheimer's disease 74,6327. Diabetes 71,3828. Influenza and Pneumonia 52,7179. Nephritis, nephrotic syndrome, nephrosis 46,44810. Septicemia 34,828
National Vital Statistics Report. Deaths: Final Data for 2007. CDC. http://www.cdc.gov/nchs/fastats/deaths.htm
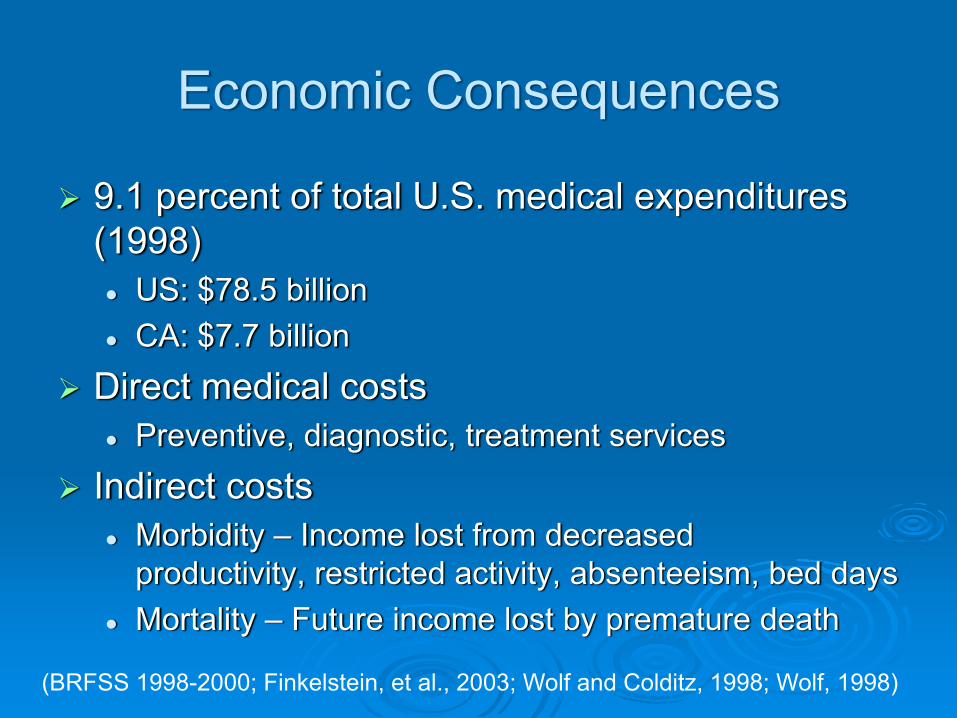
Economic Consequences
9.1 percent of total U.S. medical expenditures (1998)
US: $78.5 billionCA: $7.7 billion
Direct medical costsPreventive, diagnostic, treatment services
Indirect costs Morbidity – Income lost from decreased productivity, restricted activity, absenteeism, bed daysMortality – Future income lost by premature death
(BRFSS 1998-2000; Finkelstein, et al., 2003; Wolf and Colditz, 1998; Wolf, 1998)

PREVENTING OBESITY
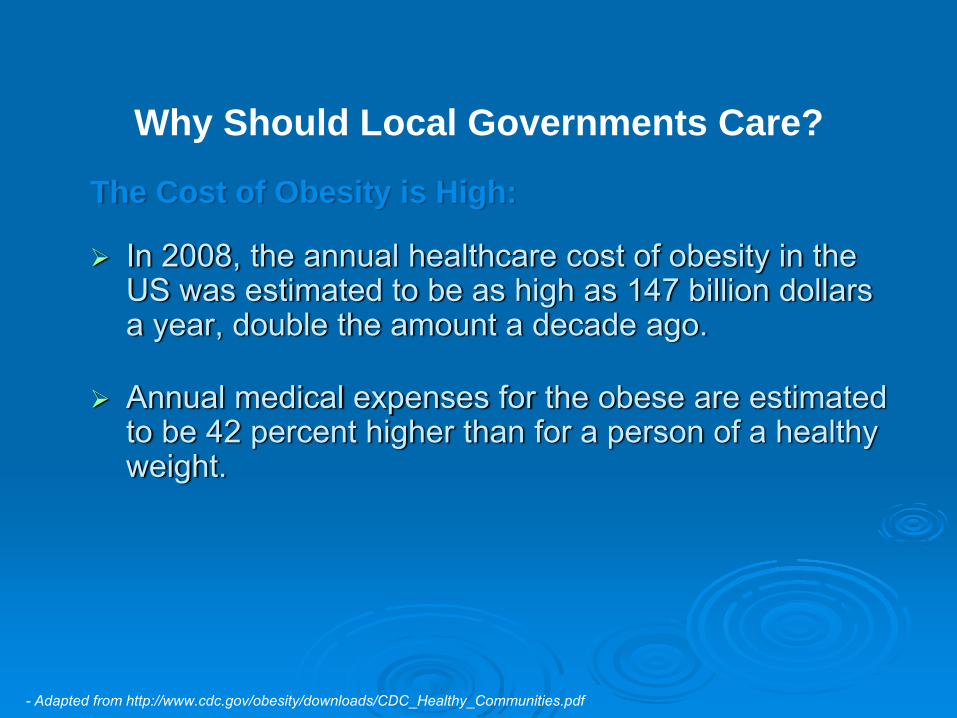
Why Should Local Governments Care?
The Cost of Obesity is High:
In 2008, the annual healthcare cost of obesity in the US was estimated to be as high as 147 billion dollars a year, double the amount a decade ago.
Annual medical expenses for the obese are estimated to be 42 percent higher than for a person of a healthy weight.
- Adapted from http://www.cdc.gov/obesity/downloads/CDC_Healthy_Communities.pdf
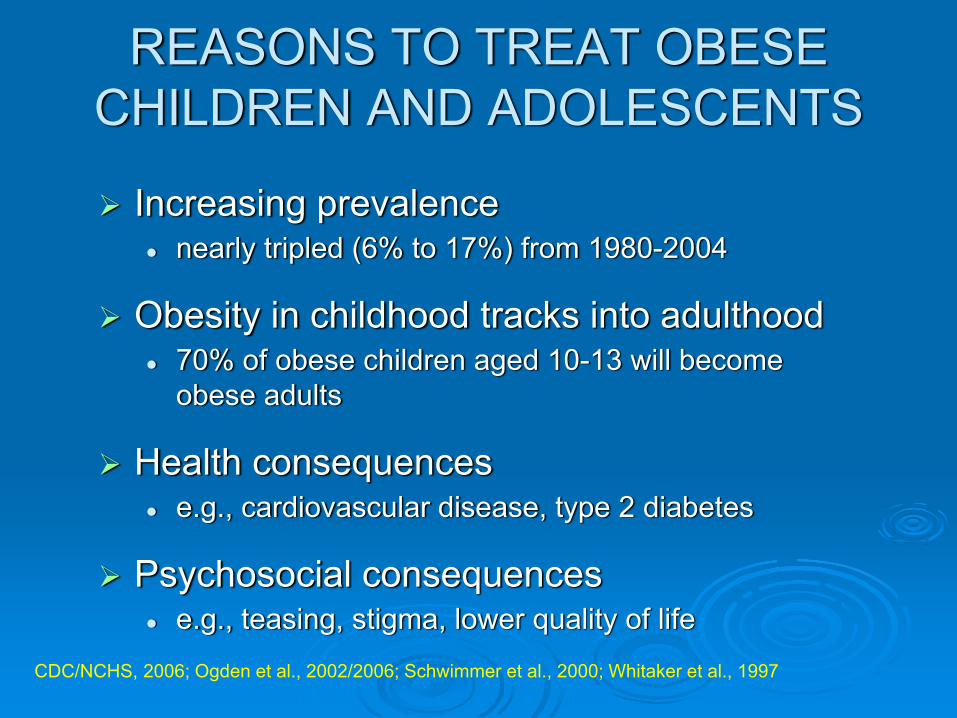
REASONS TO TREAT OBESE CHILDREN AND ADOLESCENTS
Increasing prevalencenearly tripled (6% to 17%) from 1980-2004
Obesity in childhood tracks into adulthood70% of obese children aged 10-13 will become obese adults
Health consequencese.g., cardiovascular disease, type 2 diabetes
Psychosocial consequencese.g., teasing, stigma, lower quality of life
CDC/NCHS, 2006; Ogden et al., 2002/2006; Schwimmer et al., 2000; Whitaker et al., 1997
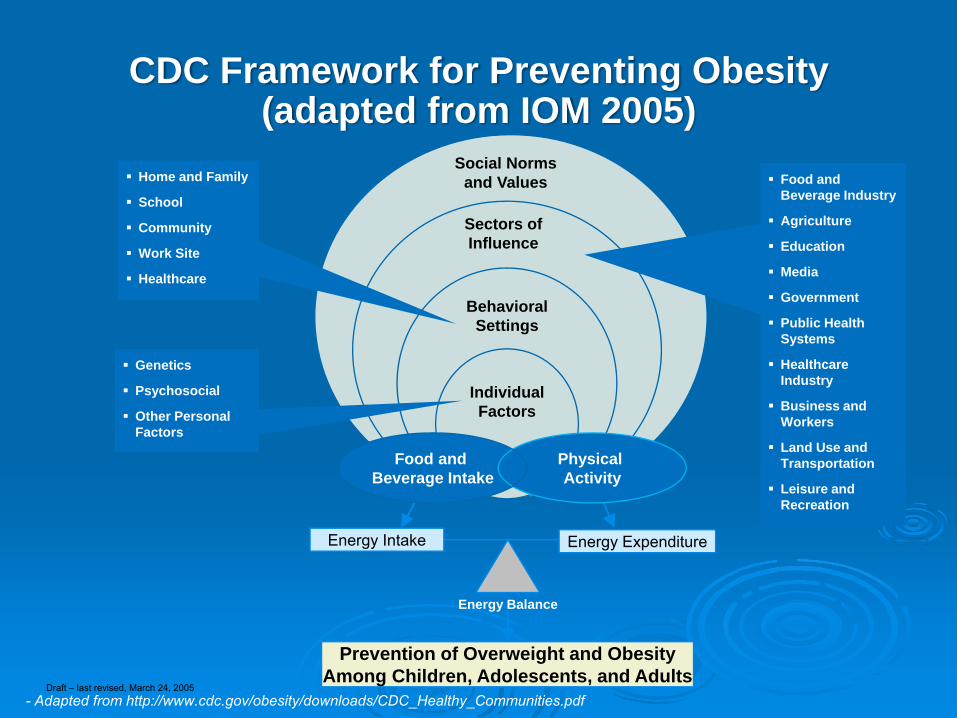
CDC Framework for Preventing Obesity(adapted from IOM 2005)
Energy Intake Energy Expenditure
Energy Balance
Prevention of Overweight and Obesity Among Children, Adolescents, and Adults
Individual Factors
Behavioral Settings
Social Norms and ValuesHome and Family
School
Community
Work Site
Healthcare
Genetics
Psychosocial
Other Personal Factors
Food and Beverage Industry
Agriculture
Education
Media
Government
Public Health Systems
Healthcare Industry
Business and Workers
Land Use and Transportation
Leisure and Recreation
Food and Beverage Intake
Physical Activity
Sectors of Influence
Draft – last revised, March 24, 2005- Adapted from http://www.cdc.gov/obesity/downloads/CDC_Healthy_Communities.pdf
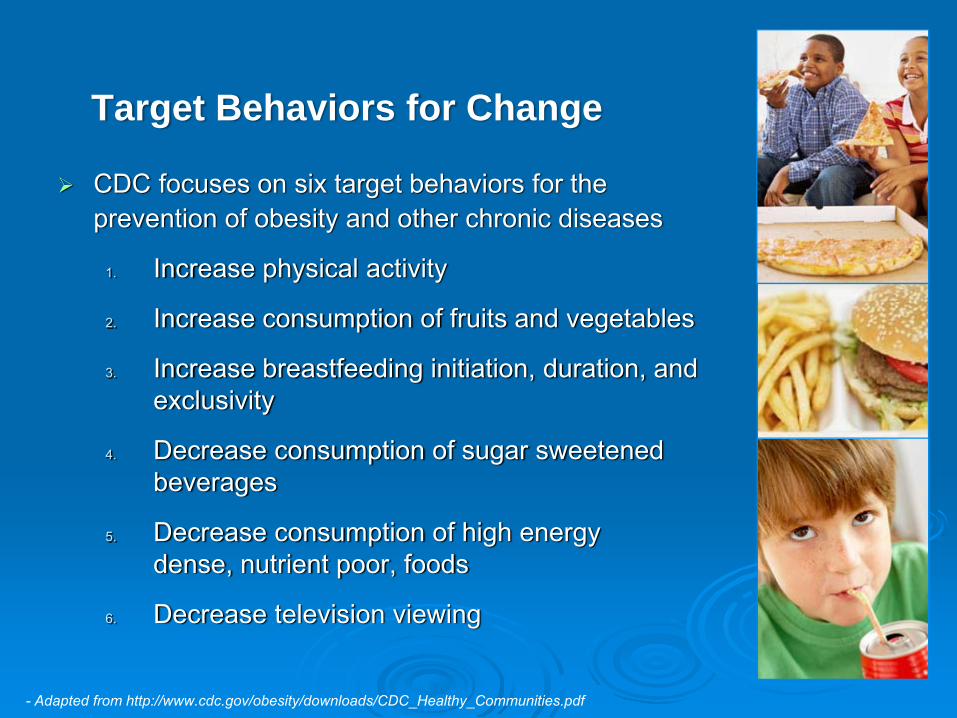
Target Behaviors for Change
CDC focuses on six target behaviors for the prevention of obesity and other chronic diseases
1. Increase physical activity
2. Increase consumption of fruits and vegetables
3. Increase breastfeeding initiation, duration, and exclusivity
4. Decrease consumption of sugar sweetened beverages
5. Decrease consumption of high energy dense, nutrient poor, foods
6. Decrease television viewing
- Adapted from http://www.cdc.gov/obesity/downloads/CDC_Healthy_Communities.pdf

CDC’s Recommended Strategies to Prevent Obesity
Strategies to Promote the Availability of Affordable Healthy Food & Beverages
1. Increase availability of healthier food and beverage choices in public service venues
2. Improve availability of affordable healthier food and beverage choices in public service venues
3. Improve geographic availability of supermarkets in underserved areas
4. Provide incentives to food retailers to locate in and/or offer healthier food and beverage choices in underserved areas
5. Improve availability of mechanisms for purchasing foods from farms6. Provide incentives for the production, distribution, and procurement
of foods from local farms
- Adapted from http://www.cdc.gov/obesity/downloads/CDC_Healthy_Communities.pdf

CDC’s Recommended Strategies to Prevent Obesity
Strategies to Support Healthy Food and Beverage Choices
7. Restrict availability of less healthy foods and beverages in public service venues
8. Institute smaller portion size options in public service venues
9. Limit advertisements of less healthy foods and beverages
10. Discourage consumption of sugar-sweetened beverages
- Adapted from http://www.cdc.gov/obesity/downloads/CDC_Healthy_Communities.pdf
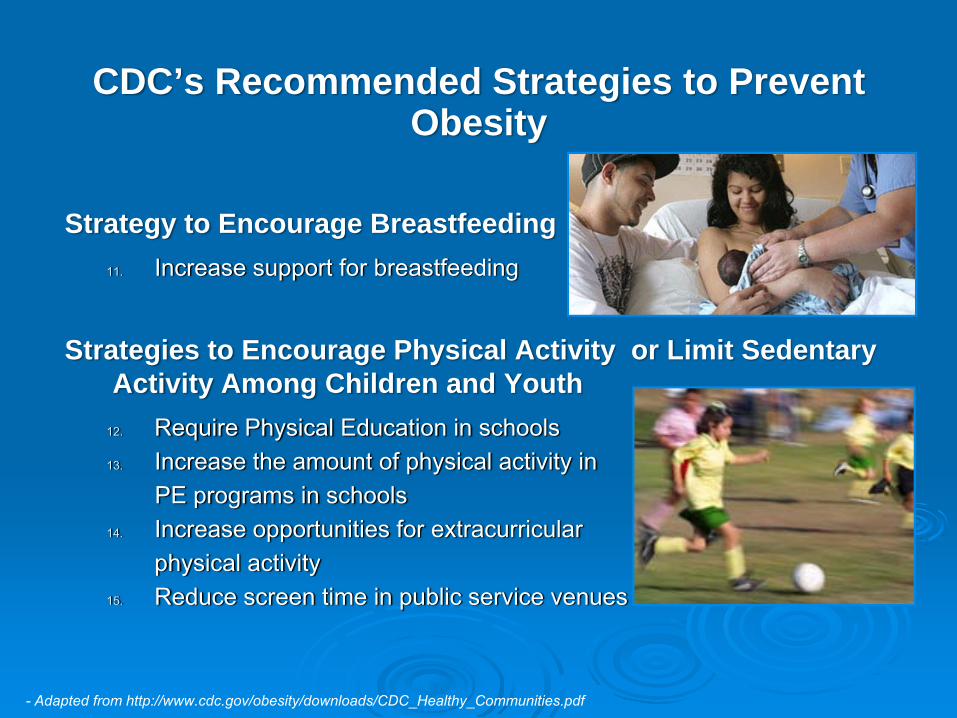
CDC’s Recommended Strategies to Prevent Obesity
Strategy to Encourage Breastfeeding11. Increase support for breastfeeding
Strategies to Encourage Physical Activity or Limit Sedentary Activity Among Children and Youth
12. Require Physical Education in schools13. Increase the amount of physical activity in
PE programs in schools14. Increase opportunities for extracurricular
physical activity15. Reduce screen time in public service venues
- Adapted from http://www.cdc.gov/obesity/downloads/CDC_Healthy_Communities.pdf

CDC’s Recommended Strategies to Prevent Obesity
Strategies to Create Safe Communities That Support Physical Activity
16. Improve access to outdoor recreational facilities17. Enhance infrastructure supporting bicycling18. Enhance infrastructure supporting walking19. Support locating schools in residential neighborhoods20. Improve access to transportation21. Zone for mixed-use development22. Enhance personal safety where people are or could be physically
active23. Enhance traffic safety in areas where persons are or could be
physically active
Strategy to Encourage Communities to Organize for Change24. Participate in community coalitions or partnerships to address obesity
- Adapted from http://www.cdc.gov/obesity/downloads/CDC_Healthy_Communities.pdf

For questions…
Danyte S. Mockus, PhD, MPHEpidemiologist,
Epidemiology and Program Evaluation BranchDepartment of Public Health
Riverside County Community Health AgencyOffice: 951.358.5557
Email: [email protected]