Child injuries in the home - @RACV · Child injuries in the home i Child deaths Of all child deaths...
60
Child injuries in the home June 2016 RACV Research Report 16/01
Transcript of Child injuries in the home - @RACV · Child injuries in the home i Child deaths Of all child deaths...
Child injuries in the home June 2016
RACV Research Report 16/01


Royal Automobile Club of Victoria (RACV) Ltd
Report No. Date ISBN Pages16/01 June 2016 978-0-9804913-9-5 50
TitleChild injuries in the home
Authors AcknowledgementsJanneke Berecki-Gisolf Elvira Lazar
Shannon Gray Melinda Spiteri
Angela Clapperton
PERFORMING ORGANISATIONVictorian Injury Surveillance Unit (VISU)
Monash Injury Research Institute
Clayton VIC 3800
AbstractChild injuries are likely to occur in the home and almost all of these incidents are unintentional. This report aims to identify the level and type of injury that occurs to children in the home. Various databases were used to calculate treated injuries in the form of hospital presentations or hospital admissions and deaths relating to incidents that occurred to children in the home environment. Cases were selected based on Victorian residency and children aged 0-14 years. The most common injury type was open wounds or fractures and incidents relating to falls, poisoning, burns and scalds were found to be among the most common cause of injuries. Incidents predominantly involved male children and the rates were highest among 1-2 year olds and decreased with increasing age. The highest proportion of child deaths in the home were for ages 0-4 years and were predominantly dues to fires, burns or scalds. Approximately one-third of admission costs related to the treatment of fractures followed by costs associated with burns and open wounds. The relatively high injury rates among very young children could be due to the high risk of injury to younger children or due to greater exposure from more time spent at home compared to Kindergarten or school aged children.
Key WordsChild injuries, home, Victoria, injury type, emergency department presentations, emergency department admissions, open wound, fracture, fall, poisoning, burn, scald
DisclaimerThis report is based upon work of the Victorian Injury Surveillance Unit (VISU). The research presented in this report has been funded by RACV and is released in the public interest. The views expressed and recommendations made are those of the authors and do not necessarily reflect RACV policy.
Although the report is believed to be correct at the time of publication, RACV, excludes, to the maximum extent permitted at law, all liability for loss (whether arising under contract, tort, statute or otherwise) arising from the contents of the Report or from its use. Where such liability cannot be excluded, it is reduced to the maximum extent permitted at law. Discretion and judgement should be applied when using or applying any of the information contained within the Report.
Child injuries in the home

Executive Summary
involving (home) playground equipment. Of hospital admissions related to home playground equipment injury, 68% involved a trampoline.
Open wounds and fractures together accounted for 55% of admissions and 38% of ED presentations. Admissions for bone fractures were most commonly elbow or forearm fractures (40%), shoulder or upper arm (24%) or wrist or hand fractures (11%). ED presentations for fractures mostly involved the wrist (21%), forearm (19%), elbow (15%), hand/finger (11%) or foot/toe (9%). Of hospital admissions, 9% were due to systemic poisoning/toxic effects and this was mostly due to poisoning by drugs, medicaments and biological substances.
Hospital days and direct costs for hospital admissions The age and gender pattern of hospital days and direct costs generally followed that of admission rates. The burden was greater among males than females, and the burden decreased with increasing age groups. Open wounds accounted for 30% of initial hospital admissions for child home injuries, yet open wounds constituted only 13% of hospital days for child home injuries. Burns accounted for only 4% of initial hospital admissions, yet burns admissions constituted 16% of hospital days and 10% of direct costs.of young drivers.
Remoteness, country of birth and socioeconomic statusChildren born in Europe, Africa, or Asia had lower rates of hospital treated injury than those born in Australia (Oceania or Antarctica). Hospital treated injury rates decreased with increasing SEIFA deciles (socio-economic index for area); that is, with increasing level of socioeconomic status as approximated based on residential postal code.
Child home injury rates were up to 3-fold higher in inner regional areas of Victoria compared to major Victorian cities. Falls were relatively more common in major cities, whereas transport injuries (in/around the home) were relatively more common in inner regional and outer regional areas. Child home injuries due to ‘transport’ were likely to be pedal cyclist injuries (n=209, 46%), the majority of which occurred in inner regional areas (n=127/209). Motorcycle driver injuries constituted a further 104 (23%) injuries and 55 of these occurred in inner regional areas.
This report aims to provide an overview of child injuries that occur in the home. The report provides an overview of child home injuries in Victoria resulting in Emergency Department (ED) presentation, hospital admission, or death.
Ten year trends from 2004/05 to 2013/14Over the ten year period, the annual incidence of hospital admissions for child home injury decreased from 1.43 to 1.15 admissions per 1000 persons. During this period the annual incidence of emergency department (ED) presentations for child home injury increased from 33.9 to 37.2 presentations per 1000 persons. A similar upward trend is seen in the overall hospital treated child home injury rate, which is the combination of ED presentations and admissions.
Patterns of injury from 2011/12 to 2013/14Child injuries are likely to occur in the home. Of all child injuries resulting in ED presentation, 60.2% of injuries occurred in the home for children aged 0 to 4, 38.3% for children aged 5 to 9 and 23.7% for 10 to 14 year olds. Of all child injuries that resulted in hospital admission, 33.8% occurred in the home for children aged 0-4, 15.8% for children aged 5-9 and 10.6% for 10-14 year olds.
Male children had more hospital treated home injuries than female children. Children aged 0-4 years had the highest frequency of child home injuries and children aged 10-14 years had the lowest. Admissions for child home injury peaked at the age of two years and ED presentations peaked at the age of one year. Hospital treated child home injuries occurred most frequently in December and January and least frequently in August. Child home injury occurred more frequently on Sundays than on other days of the week.
The vast majority of child home injuries (94% of ED presentations and 96% of admissions) were coded as unintentional. Falls were the most common cause of hospital treated child home injury, followed by hit/struck/crush injury and cutting/piercing. The fourth leading cause of ED presentations was ‘foreign body through natural orifice’ and the fourth leading cause for admissions was poisoning. Of falls resulting in hospital admission, falls on the same level (slipping, tripping and stumbling) were the most common, followed by falls
RACV Research Report 16/01

Child injuries in the home i
Child deathsOf all child deaths due to an external cause, for ages 0 to 4 years, 57.1% of deaths occurred in the home; for ages 5-9 years, 40.6% occurred in the home and for ages 10-14 years, 30.8% occurred in the home (2011/12 to 2013/14). In total, for the years 2006/7 to 2011/12, there were 94 child injury deaths that occurred in the home. Child home injury deaths were most common in the age group 0 to 4 years, followed by 10 to 14 years, and least common in the age group 5 to 9 years. More than half (54%) of child home injury deaths occurred in inner regional areas of Victoria. The most common causes of child home injury deaths were fires/burns/scalds, followed by drowning/near drowning, followed by choking/suffocation.
Unintentional poisoning literature synopsisMedications accounted for a significant portion of child poisoning resulting in hospital admission. Children aged 1 and 2 years were consistently the most frequently treated for unintentional medication poisoning. Paracetamol/acetaminophen was frequently reported as the most common class of medication that caused poisoning, followed by cough and cold preparations and antidepressants. Injury prevention strategies focus on increasing education regarding medication storage and the dangers of pharmaceutical substances, as well as supervision and behavioural changes.
Burn and scald injuries literature synopsisThe youngest age groups were most at risk for child burn injuries, in particular children under 4 years of age. Scalds commonly affected the upper limbs and trunk, mostly due to hot beverages and hot water being pulled down on themselves. Contact burns most commonly affected the hands and were mostly due to household appliances such as cookers, ovens, hair straighteners and irons. Burn prevention strategies involve increasing education to caregivers regarding supervision of children, awareness of how burns around the home may occur and potential hazards, and first-aid treatment to minimise the severity of the burn.
Play equipment injuries literature synopsis The studies summarised include general play equipment-related injuries and/or trampoline-related injuries. Play equipment-related injuries to children were common, in particular to children in the 5 to 9 year age group. Fractures were the most common type of injury; however dislocations, sprains, strains, contusions and lacerations were also common. The most common piece of play equipment that resulted in injury varied between studies, however climbing apparatuses, swings and slides as well as trampolines were most commonly associated with injury. Injury prevention strategies include installing shock-absorbing surfacing should a fall occur, maintaining equipment to ensure it is in its best condition, and carefully supervising children when they are playing on equipment.
RACV Research Report 16/01ii
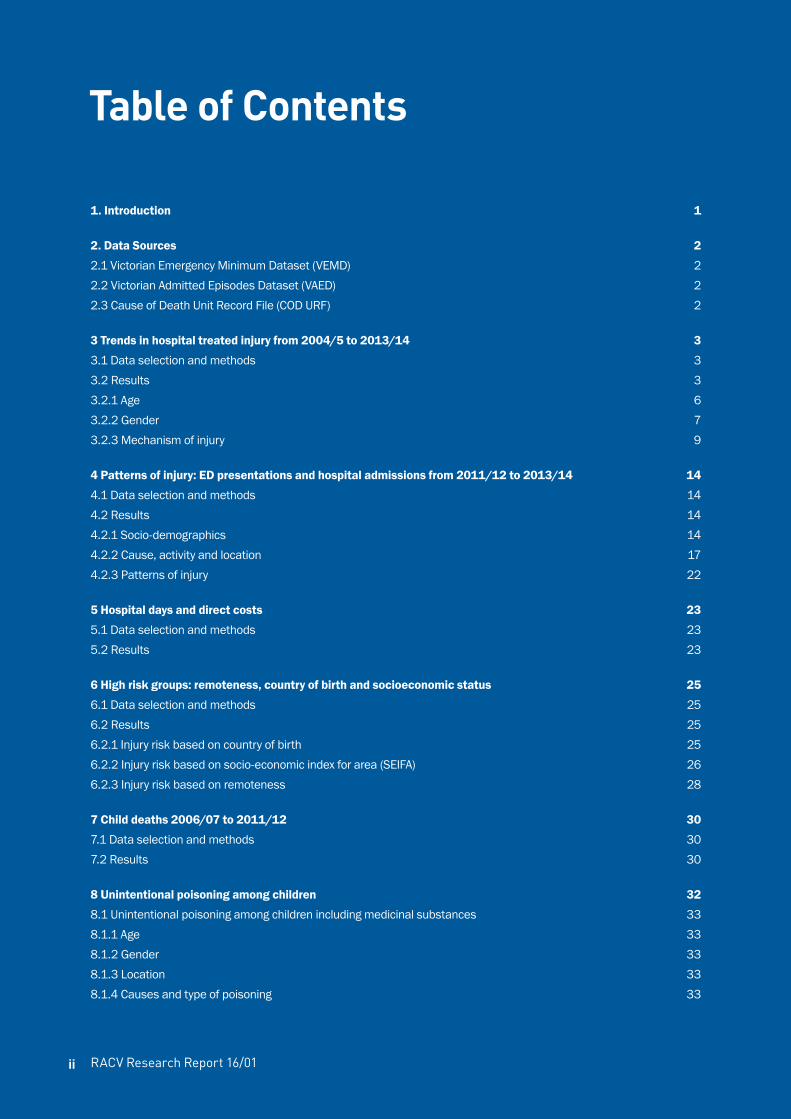
Table of Contents
1. Introduction 1
2. Data Sources 2
2.1 Victorian Emergency Minimum Dataset (VEMD) 22.2 Victorian Admitted Episodes Dataset (VAED) 22.3 Cause of Death Unit Record File (COD URF) 2
3 Trends in hospital treated injury from 2004/5 to 2013/14 3
3.1 Data selection and methods 33.2 Results 33.2.1 Age 63.2.2 Gender 73.2.3 Mechanism of injury 9
4 Patterns of injury: ED presentations and hospital admissions from 2011/12 to 2013/14 14
4.1 Data selection and methods 144.2 Results 144.2.1 Socio-demographics 144.2.2 Cause, activity and location 174.2.3 Patterns of injury 22
5 Hospital days and direct costs 23
5.1 Data selection and methods 235.2 Results 23
6 High risk groups: remoteness, country of birth and socioeconomic status 25
6.1 Data selection and methods 256.2 Results 256.2.1 Injury risk based on country of birth 256.2.2 Injury risk based on socio-economic index for area (SEIFA) 266.2.3 Injury risk based on remoteness 28
7 Child deaths 2006/07 to 2011/12 30
7.1 Data selection and methods 307.2 Results 30
8 Unintentional poisoning among children 32
8.1 Unintentional poisoning among children including medicinal substances 338.1.1 Age 338.1.2 Gender 338.1.3 Location 338.1.4 Causes and type of poisoning 33
Child injuries in the home
8.1.5 Severity 348.1.6 Risk factors 348.1.7 Injury prevention 348.1.8 Conclusion 358.2 Unintentional poisoning among children: non-medicinal substances 358.2.1 Age 358.2.2 Gender 358.2.3 Location 368.2.4 Conclusion 36
9 Child burn injuries 37
9.1 Results and discussion 379.1.1 Age 379.1.2 Gender 389.1.3 Location 389.1.4 Time of day 389.1.5 Body region(s) injured 389.1.6 Detailed causes of injury 389.1.7 Severity 399.1.8 Injury Prevention 399.2 Conclusion 39
10 Play equipment - related injury 40
10.1 Results and Discussion 4010.1.1 Age 4010.1.2 Gender 4110.1.3 Location 4110.1.4 Body region(s) injured 4110.1.5 Nature of injury 4110.1.6 Equipment and injury causes 4110.1.7 Severity 4210.1.8 Injury Prevention 4210.2 Conclusion 42
11 Discussion and conclusion 43
12 References 45
Appendix: Literature synopsis 48
Unintentional poisoning among children 48Child burn injuries 48Play equipment injuries 49


Child injuries in the home 1
This report provides a summary of child injuries that occurred in the home, in Victoria. The analysis is based on Emergency Department (ED) presentation records, hospital admission records, and death data. Injuries treated by a General Practitioner (GP) and injuries not requiring medical attention are outside the scope of this report.
Injury trend analysis is based on a 10-year period from 2004/05 to 2013/14, and reports of patterns of injury are based on the most recent three years available data from 2011/12 to 2013/14. A summary of child deaths due to injury in the home is based on data from 2006/07 to 2011/12 only. Analysis of potentially vulnerable groups based on country of birth, socio-economic status determined from residential postcode and rural/urban residence is based on 2011 only, because of Australian Bureau of Statistic census data availability. Three priority areas were identified for the focus of a brief literature review: child burns, child unintentional poisoning, and child injury related to home play equipment. These areas were chosen as they were among the top 5 most commonly occurring causes of injury and/or the top 5 contributors to the number of hospital days and direct costs. In addition, fires/burns/scalds were the most frequent cause of child death that occurred in the home. For each of these topics, a brief literature overview is provided, with a focus on injury epidemiology, injury cause, injury type, and recommendations for prevention.
The aim of this research is to provide an overview of the frequency, types and causes of child home injuries in Victoria. Study findings will be used to help define priority child home safety areas and to identify vulnerable groups. This information can be used to develop policy, guidelines and recommendations regarding child safety and injury prevention in the home.
Introduction1

RACV Research Report 16/012
Data from three Victorian Injury Surveillance Unit (VISU)-held datasets were analysed for this report. Two were hospital treated datasets (Victorian Admitted Episodes Dataset and the Victorian Emergency Minimum Dataset) and one was an injury deaths dataset (Australian Coordinating Registry Cause of Death Unit Record File). To calculate annual injury rates, residential population data was sourced from the Australian Bureau of Statistics (ABS).
2.1 Victorian Emergency Minimum Dataset (VEMD)The Victorian Injury Surveillance System (VISS) began in the Royal Children’s Hospital in 1989. It expanded to adult hospitals over time with a large boost in 1995 when the Department of Human Services absorbed the injury surveillance minimum dataset into the Victorian Emergency Minimum Dataset (VEMD) that collects demographic, administrative and clinical data from public hospitals. Reliable data are available from July 1999 onwards and from January 2004, VEMD data are collected by all Victorian public hospitals that provide a 24-hour ED service (currently 39 hospitals).
2.2 Victorian Admitted Episodes Dataset (VAED)Hospital admissions for injury and poisoning that contain an external cause code were extracted from the Victorian Admitted Episodes Dataset (VAED) by the Victorian Department of Health (DH) and supplied in de-identified unit record format to VISU annually. The file is cleaned, checked and merged with the VISU-held VAED dataset.
From July 1998, cases recorded on the VAED are coded to ICD-10-AM-the WHO International Statistical Classification of Diseases and Related Health Problems, Tenth Revision, Australian Modification. The VAED includes data from all Victorian public and private hospitals.
Up to 40 ICD-10-AM codes from any or all of the chapters of the ICD-10-AM manual can currently be assigned to each record. These codes are then used to derive the following injury surveillance variables that are added to the VISU-VAED dataset.
• Cause of injury: transport, fall, poisoning etc. [Coded to ICD-10-AM Chapter XX: External Causes of Morbidity and Mortality (V00-Y34)]
• Place of occurrence: i.e. location of injury: home, road, street or highway etc. [Coded to ICD-10-AM Chapter XX: External Causes of Morbidity and Mortality (Y92.0-Y92.9)]
• Activity when injured: sports, leisure, work etc. [Coded to ICD-10-AM Chapter XX: External Causes of Morbidity and Mortality (U50-U73)]
• Human intent: unintentional; intentional-assault, neglect, self-harm; undetermined intent. Intent information is derived from the external cause of injury code.
• Injury diagnosis: i.e. exact injury code: superficial injury of scalp, fracture of neck of femur etc. (Coded to ICD-10-AM Chapter 19 Injury, Poisoning and Consequences of External Cause S00-T98)
• Body region injured: head, thorax, shoulder, upper arm etc. Body region information is derived from the injury diagnosis variables.
2.3 Cause of Death Unit Record File (COD URF)VISU holds COD URF data supplied by the Australian Coordinating Registry (ACR) and the Victorian Department of Justice for the period 2006-2012. This deaths dataset is based on death unit record files coded by the ABS.
Data Sources2

Child injuries in the home 3
Trends in the annual incidence of hospital treated injury were determined for the period from 2004/5 to 2013/14. Injury trends were analysed by age group and sex. And finally, acknowledging the broad range of circumstances that can result in hospital treated injury, trends were determined by major cause of injury.
3.1 Data selection and methodsThe number of ED presentations for child home injury was determined from the VEMD. Child home injury presentations in the financial years 2004/05 to 2013/14 were selected as cases. Only Victorian residents were selected, and children were selected based on age 0 to 14 years. Injury ED presentations were identified as those with an injury diagnosis (ICD codes that capture injury, poisoning and certain other consequences of external causes: S00-T98) in the first diagnostic code. Home injuries were identified based on the coding for place of occurrence. Initial ED presentations were included whereas return visits were not.
The number of hospital admissions for child home injury was determined from the VAED. Cases were selected from the VAED as hospital admissions for child home injury, in financial years 2004/05 to 2013/14. Similar to the ED presentations data analysis, only Victorian residents were included. Children were selected based on age 0-14 years; injury admissions were identified as those with an injury diagnosis (ICD codes S00-T98) in the first diagnostic code; home injuries were selected based on the place of occurrence coding. Only incident admissions were included while readmissions and transfers were not. For the trend analysis presented in this section, same day separations, i.e. cases where admission and separation took place on the same day, were excluded.
Residential population was based on the ABS’ December Victorian population estimates per age and sex, for the years 2004 to 2014 (December being the mid-point of the financial year).
Injury rates were calculated as the number of initial admissions or ED presentations per year, divided by the resident population in that year. The rate was multiplied by 1000 to give the annual number of admissions per 1000 persons. For the annual rates, 95% confidence intervals (95%CI) were calculated as:
1000/(population )×(events±1.96×√events)
where events are ED presentations (VEMD) or admissions (VAED). For stratification by age or by gender, the admissions or presentations as well as the population data were broken down into the relevant age and gender groups. Trends are presented per age group, gender, and per cause of injury (based on the cause code).
Trends were statistically tested using negative binomial or Poisson models. The annual number of injuries were modelled as a function of the year, with the log of the population as offset. Differences in the rate of change were tested using interaction effects. All analyses were conducted using SAS 9.4 and for the modelling, the SAS PROC GENMOD procedure was used.
3.2 ResultsThe annual incidence of ED presentations for child home injury increased from 33.9 presentations per 1000 persons in 2004/05 to 37.2 in 2013/14 (Figure 1). Although displaying fluctuations, the overall increasing trend over the ten years was statistically significant (P=0.003).
Trends in hospital treated injury from 2004/5 to 2013/143

RACV Research Report 16/014
Figure 1 Incidence of child home injury ED presentations over time. ED presentations are shown as rates and 95% confidence intervals.
Source: VEMD
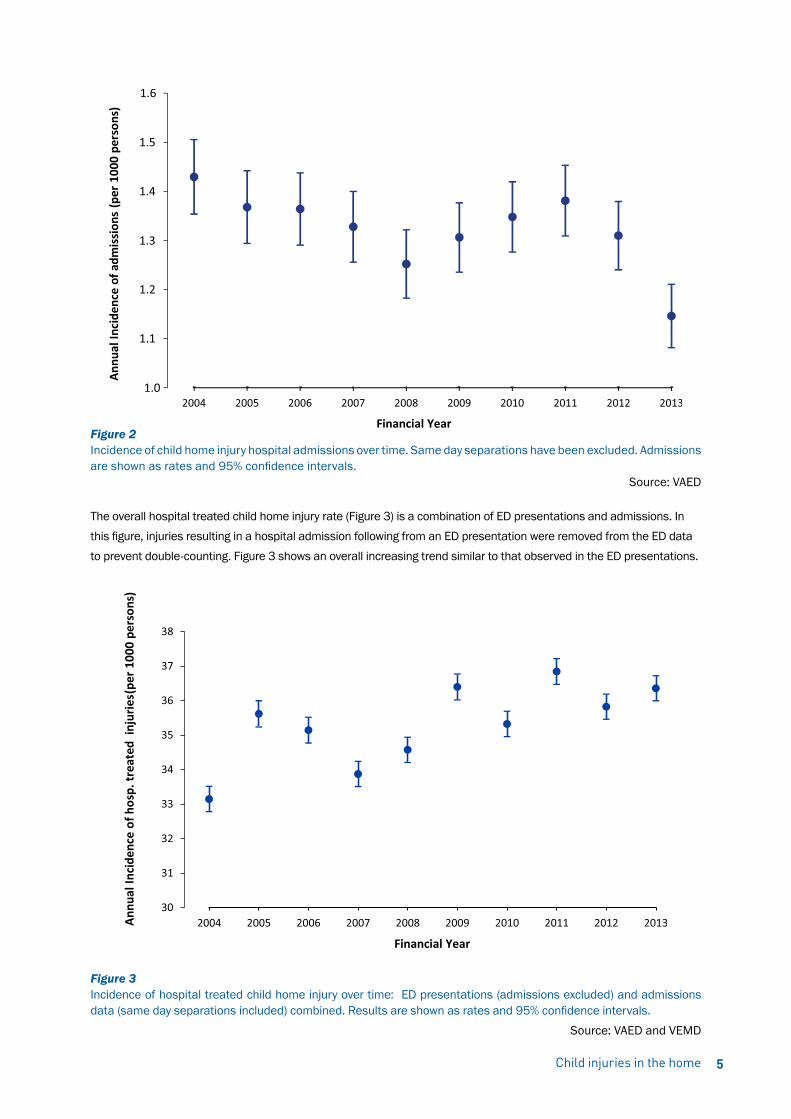
The annual incidence of hospital admissions for child home injury decreased from 1.43 admissions per 1000 persons in 2004/05 to 1.15 in 2013/14. Although displaying a temporary increase between 2008 and 2011, as shown in Figure 2, the overall 10-year decreasing trend was statistically significant (P<0.01). Same day separations have been excluded.
Note: In July 2012 the Victorian Hospital Admission Policy changed significantly meaning that patients who received their entire care within a designated ED or urgent care centre could no longer be eligible for admission regardless of the amount of time spent in the hospital. This has had the effect of reducing the number of admissions recorded on the VAED for the 2012/13 financial year. For this reason, for the trend analysis (section: “Trends in hospital treated injury ”), same-day separations, i.e. cases where admission and separation took place on the same day, have been excluded, to minimise the impact of the policy change on the reported trends.
Child injuries in the home 5
Figure 2 Incidence of child home injury hospital admissions over time. Same day separations have been excluded. Admissions are shown as rates and 95% confidence intervals.
Source: VAED
The overall hospital treated child home injury rate (Figure 3) is a combination of ED presentations and admissions. In this figure, injuries resulting in a hospital admission following from an ED presentation were removed from the ED data to prevent double-counting. Figure 3 shows an overall increasing trend similar to that observed in the ED presentations.
Figure 3 Incidence of hospital treated child home injury over time: ED presentations (admissions excluded) and admissions data (same day separations included) combined. Results are shown as rates and 95% confidence intervals. Source: VAED and VEMD

3.2.1 AgeAge group differences in trends in ED presentations are shown in Figure 4. Age groups differed in their rates of ED presentations for home injury. Children aged 0-4 years had the highest rates and those aged 10-14 had the lowest rates of child home injury ED presentations. The trend in injury incidence, i.e. the rate of change over time, was not statistically different between age groups.
Figure 4 Child home injury ED presentations over time, by age group. ED presentations are shown as rates and 95% confidence intervals
Source: VEMD
RACV Research Report 16/016
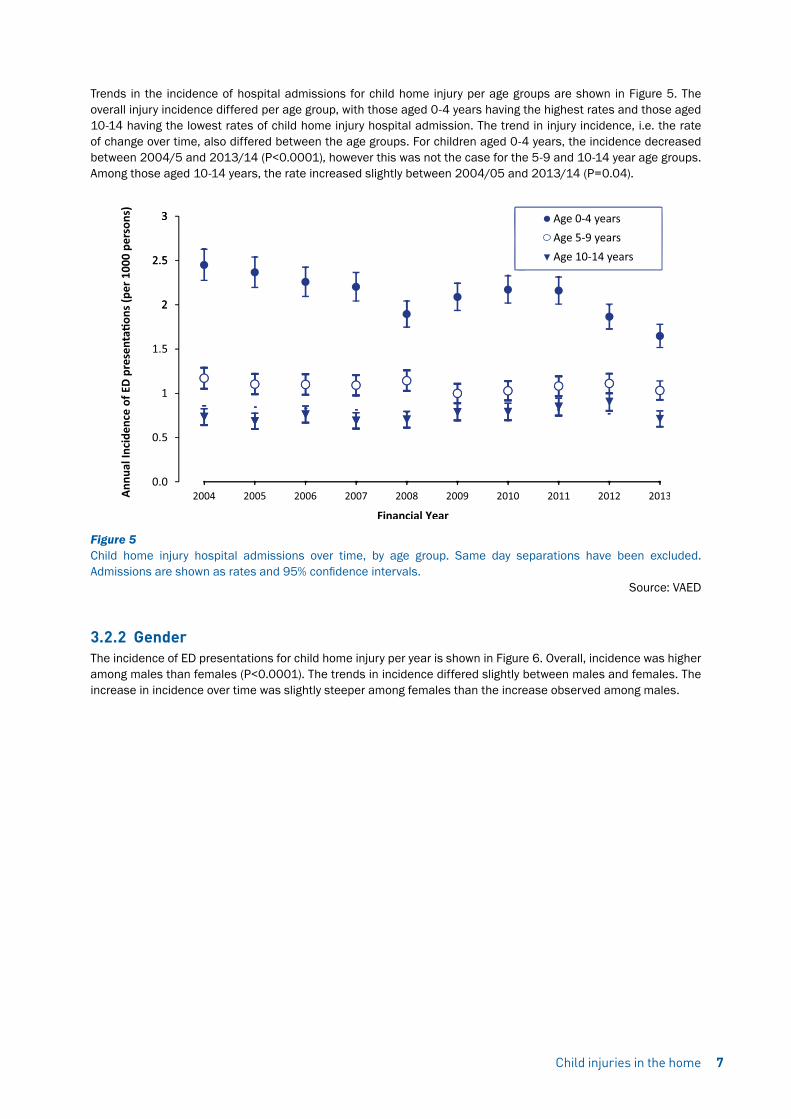
Trends in the incidence of hospital admissions for child home injury per age groups are shown in Figure 5. The overall injury incidence differed per age group, with those aged 0-4 years having the highest rates and those aged 10-14 having the lowest rates of child home injury hospital admission. The trend in injury incidence, i.e. the rate of change over time, also differed between the age groups. For children aged 0-4 years, the incidence decreased between 2004/5 and 2013/14 (P<0.0001), however this was not the case for the 5-9 and 10-14 year age groups. Among those aged 10-14 years, the rate increased slightly between 2004/05 and 2013/14 (P=0.04).
Figure 5 Child home injury hospital admissions over time, by age group. Same day separations have been excluded. Admissions are shown as rates and 95% confidence intervals.
Source: VAED
3.2.2 GenderThe incidence of ED presentations for child home injury per year is shown in Figure 6. Overall, incidence was higher among males than females (P<0.0001). The trends in incidence differed slightly between males and females. The increase in incidence over time was slightly steeper among females than the increase observed among males.
Child injuries in the home 7

Figure 6 Child home injury ED presentations over time by sex. ED presentations are shown as rates and 95% confidence intervals.
Source: VEMD
Trends in the incidence of child home injury hospital admissions per sex are shown in Figure 7. Although the overall incidence was higher among males than females (p<0.0001), trends injury incidence, i.e. the rate of change between 2004/05 and 2013/14, was not statistically significantly different for males and females.
Figure 7 Child home injury hospital admissions over time, by sex. Same day separations have been excluded. Admissions are shown as rates and 95% confidence intervals.
Source: VAED
RACV Research Report 16/018

3.2.3 Mechanism of injuryIncidence trends in emergency presentation for child home injuries are shown in Figure 8. The results are shown in four separate plots with injury causes grouped together based on (the scaling of) the overall incidence.
Injuries are grouped based on cause. The cause of injury categories, listed in order of the most common to the least common cause of injury over the 10-year period, were:
1. falls
2. hit/struck/crush injury
3. other specified unintentional injury
4. cutting/piercing injury
5. other or undetermined intent
6. foreign body through a natural orifice
7. fires/burns/scalds
8. unspecified unintentional injury
9. natural/environmental/animals
10. transport injuries; poisoning
11. intentional self-inflicted injury
12. medical injury
13. intentional inflicted by other
14. choking/suffocation
15. machinery
16. drowning/near drowning
17. and explosions/firearms
Child injuries in the home 9
RACV Research Report 16/0110

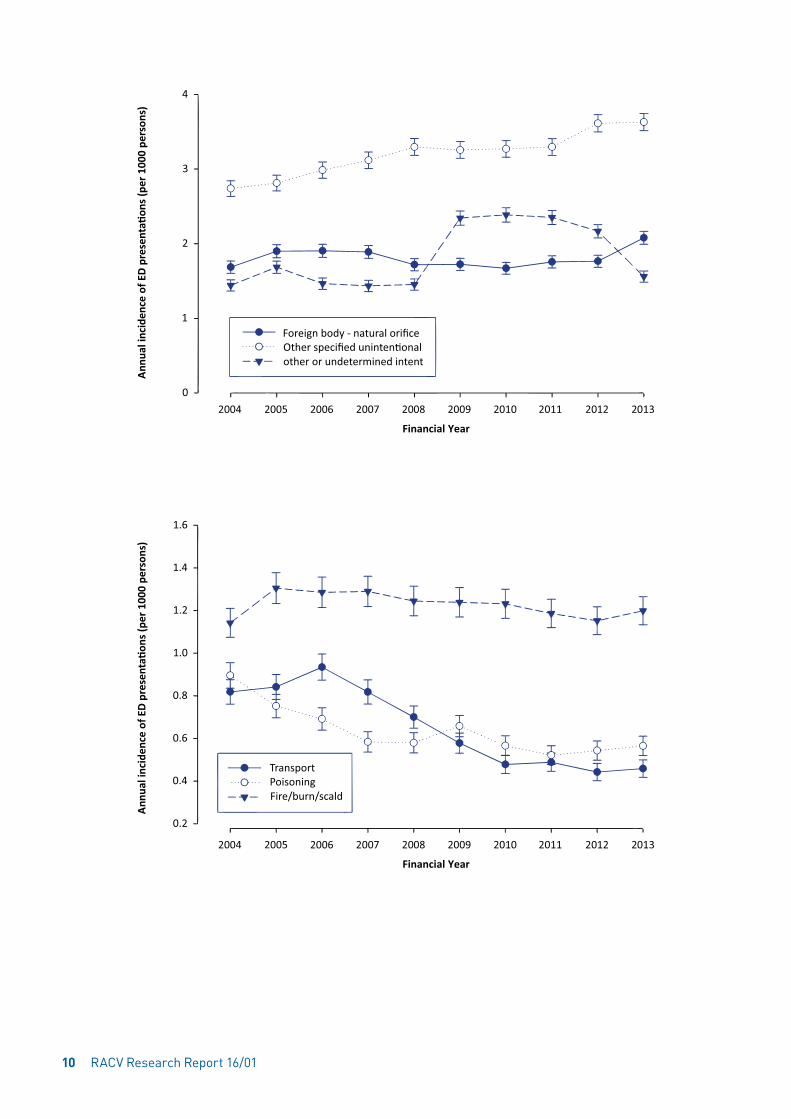
Figure 8 Child home injury ED presentations over time, by cause group (presented in four separate graphs). ED presentations are shown as rates and 95% confidence intervals.
Source: VEMD
There was a statistically significant decrease in the incidence of child home injury ED presentations for transport injury, poisoning, natural/environmental/animal, and injury cause by cutting/piercing. The incidence of ED presentations for child home injuries related to falls, other specified unintentional injury, unspecified unintentional injury and intentional self-inflicted injury increased statistically significantly between 2004/05 to 2013/14. The incidence of ED presentations for child home injury due to drowning/near drowning, fires/burns/scalds, choking/suffocation, hit/struck/crush, machinery, explosion/firearms, foreign body through natural orifice, intentional inflicted by other, other or undetermined intent, medical injury, did not change statistically significantly between 2004/05 and 2013/14.
Trends in the incidence of child home injuries resulting in hospital admissions, per cause of injury, are shown in Figure 9. The results are shown in four separate plots: injury causes are grouped together based on the general incidence. The cause of injury categories, listed in order of the most common to the least common cause of injury over the 10-year period, were:
1. falls
2. hit/struck/crush injury
3. poisoning
4. intentional self-inflicted injury
5. fires/burns/scalds
6. cutting/piercing injury
7. natural/environmental/animals
8. transport injuries
9. medical injury
10. foreign body through a natural orifice
11. unspecified unintentional injury
12. drowning/near drowning
13. other specified unintentional injury
Child injuries in the home 11
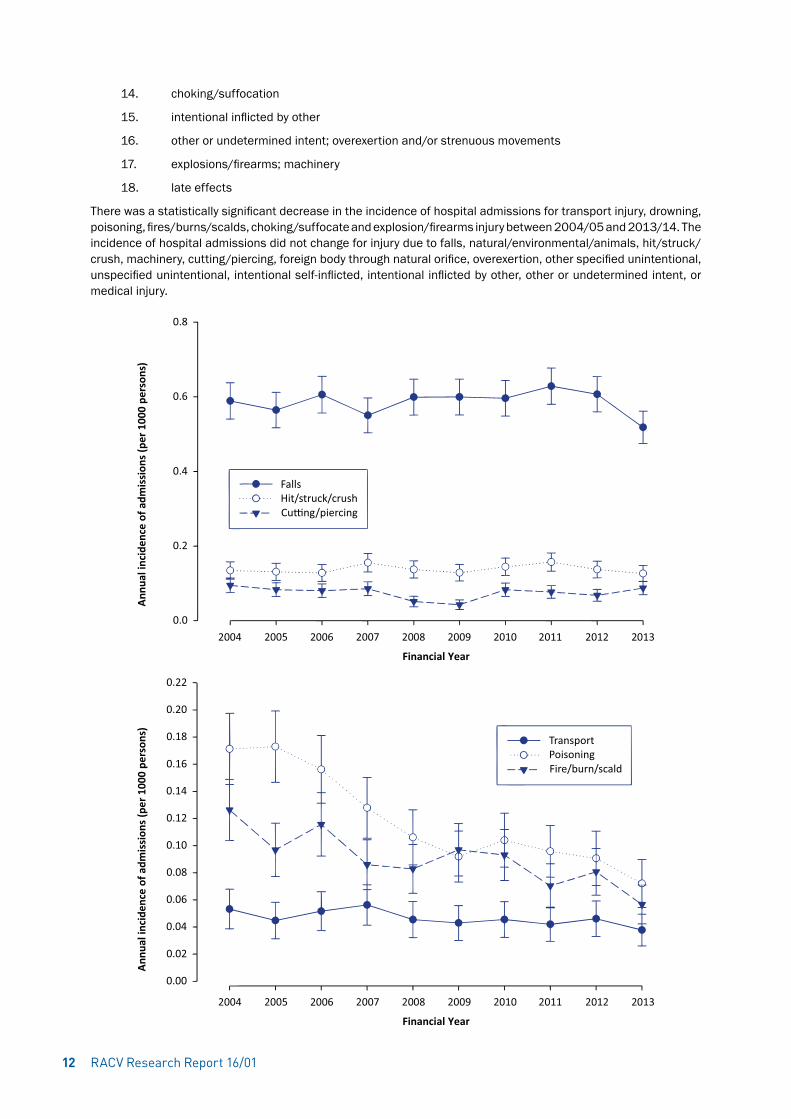
14. choking/suffocation
15. intentional inflicted by other
16. other or undetermined intent; overexertion and/or strenuous movements
17. explosions/firearms; machinery
18. late effects
There was a statistically significant decrease in the incidence of hospital admissions for transport injury, drowning, poisoning, fires/burns/scalds, choking/suffocate and explosion/firearms injury between 2004/05 and 2013/14. The incidence of hospital admissions did not change for injury due to falls, natural/environmental/animals, hit/struck/crush, machinery, cutting/piercing, foreign body through natural orifice, overexertion, other specified unintentional, unspecified unintentional, intentional self-inflicted, intentional inflicted by other, other or undetermined intent, or medical injury.
RACV Research Report 16/0112

Figure 9 Child home injury hospital admissions over time, by cause group (presented in four separate graphs). Same day separations have been excluded. Admissions are shown as rates and 95% confidence intervals.
Source: VAED
Child injuries in the home 13

RACV Research Report 16/0114
Child home injury in the most recent three years of available data is presented in detail in this chapter. Hospital treated child home injuries are presented by age and sex, and time of occurrence. Details are provided on the cause of injury, activity and location when injured and the injury type.
4.1 Data selection and methodsED presentations for child home injury were extracted from the VEMD for the financial years 2011/12, 2012/13 and 2013/14. Injury ED presentations were identified as those with an injury diagnosis (ICD codes S00-T98) in the first diagnostic code. Home injuries were identified based on the coding for place of occurrence. Initial ED presentations were included whereas return visits were not. Only Victorian residents were selected, and children were selected based on age 0 to 14 years.
Hospital admissions for child home injury were also extracted from the VAED for the financial years 2011/12, 2012/13 and 2013/14. Injury admissions were identified as those with an injury diagnosis (ICD codes that capture injury, poisoning and certain other consequences of external causes: S00-T98) in the first diagnostic code. Home injuries were selected based on the place of occurrence coding. Only incident admissions were included while readmissions and transfers were not. In this section, same day separations, i.e. cases where admittance and separation took place on the same day, were included as this section does not deal with trends. The admissions rates reported in this section are therefore higher than those reported in the previous section dealing with trends, from which same day separations were excluded.
The results are presented as frequencies and percentages. Results are shown by sex, age group, financial year (based on the presentation/admission date), month and day of the week. The results are also presented by cause of the injury (based on the first occurring external cause code), activity when injured, and a detailed location of the injury; the latter information is available in the hospital admissions data only. Trampoline injury was identified based on ‘activity’ code of U57.06 ‘Trampoline and mini-trampoline’ or any external cause code W09.6 ‘Fall involving trampoline’ (Ashby et al, 2015). And finally, the results are presented by injury type and affected body region. Chi-square tests were used to test differences in the number of hospital treated injury across groups (age group, sex, month of the year, etc.), assuming that the underlying population size was approximately equal across groups.
4.2 ResultsOf all injuries that resulted in ED presentation, 60.2% of injuries occurred in the home for ages 0-4 years, 38.3% for ages 5-9 years, and 23.7% for ages 10-14 years. Of all injuries that resulted in hospital admission during 2011/12 to 2013/14, 33.8% of injuries occurred in the home for ages 0-4 years, 15.8% for ages 5-9 years and 10.6% for ages 10-14 years.
4.2.1 Socio-demographicsThe overall numbers of hospital treated child home injuries in the last three years of available data were 115,294 ED presentations and 8008 hospital admissions. The distribution of these over time, age group and sex is presented in Table 1. Males had more hospital treated injuries than females (P<0.0001) and this was true for both ED presentations and admissions. The number of injuries differed per age group (P<0.0001) with the highest number of injuries among children aged 0-4 years and the lowest among children aged 10-14 years. More detail on the distribution of injuries across age is shown in Figure 10 and Figure 11. ED presentations for child home injury peaked at 1 year of age and child home injury related hospital admissions peaked among children aged 2 years.
Patterns of injury: ED presentations and hospital admissions from 2011/12 to 2013/14
4

Child injuries in the home 15
Table 1 Child home injury ED presentations and hospital admissions in 2011/12-2013/14 by age, gender and time of presentation/admission.
ED presentations†
Frequency (N %)
Hospital admissions†
Frequency (N %)
Gender
Male Female
64,361 (56%)64,361 (56%)
4525 (57%)3483 (43%)
Age group
0-4 years5-9 years10-14 years
61,687 (54%)30,774 (27%)22,833 (20%)
4625 (58%)1994 (25%)1389 (17%)
Injury year*
2011/122012/132013/14
37,651 (33%)38,216 (33%)39,427 (34%)
2927 (37%)2334 (29%)2702 (34%)
Injury month*
JAN-MARAPR-JUNJUL-SEPOCT-DEC
31,364 (27%)27,756 (24%)25,101 (22%)31,073 (27%)
2169 (27%)1987 (25%)1758 (22%)2094 (26%)
Injury day*
MondayTuesdayWednesdayThursdayFridaySaturdaySunday
16,214 (14%)14,845 (13%)14,649 (13%)14,288 (12%)14,669 (13%)19,428 (17%)21,201 (18%)
1367 (15%)1176 (13%)1048 (14%)1115 (13%)1080 (13%)1065 (14%)1157 (17%)
Total 115,294 (100%) 8008 (100%)
*Based on the date of presentation/admission. †Rounding may not add up to 100%.
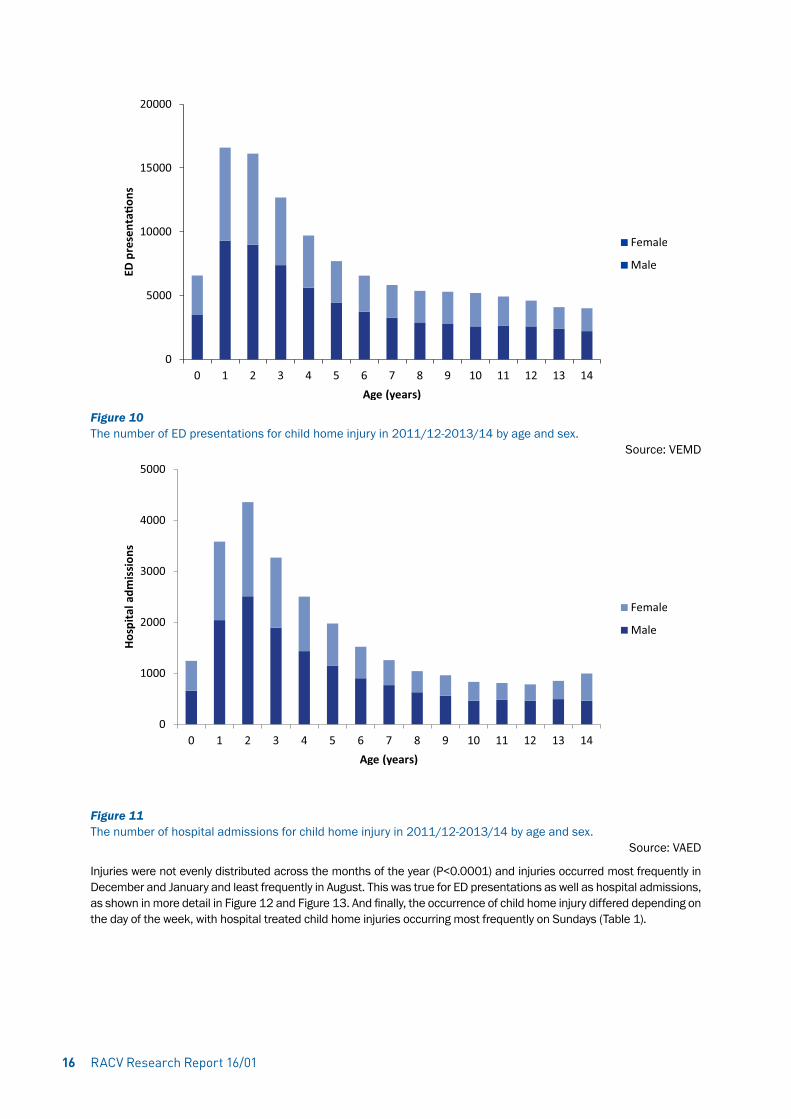
Figure 10 The number of ED presentations for child home injury in 2011/12-2013/14 by age and sex.
Source: VEMD
Figure 11 The number of hospital admissions for child home injury in 2011/12-2013/14 by age and sex.
Source: VAED
Injuries were not evenly distributed across the months of the year (P<0.0001) and injuries occurred most frequently in December and January and least frequently in August. This was true for ED presentations as well as hospital admissions, as shown in more detail in Figure 12 and Figure 13. And finally, the occurrence of child home injury differed depending on the day of the week, with hospital treated child home injuries occurring most frequently on Sundays (Table 1).
RACV Research Report 16/0116

Figure 12 The number of ED presentations for child home injury in 2011/12-2013/14 by calendar month.
Source: VEMD
Figure 13 The number of hospital admissions for child home injury in 2011/12-2013/14 by calendar month.
Source: VAED
4.2.2 Cause, activity and locationCauses of child home injury are presented in Table 2. Cause of injury is grouped as unintentional, intentional, or other, where the intent is undetermined. The vast majority of child home injuries (94% of ED presentations and 96% of admissions) were coded as unintentional. The most common causes of hospital treated child home injury was falls, followed by hit/struck/crush.
Child injuries in the home 17
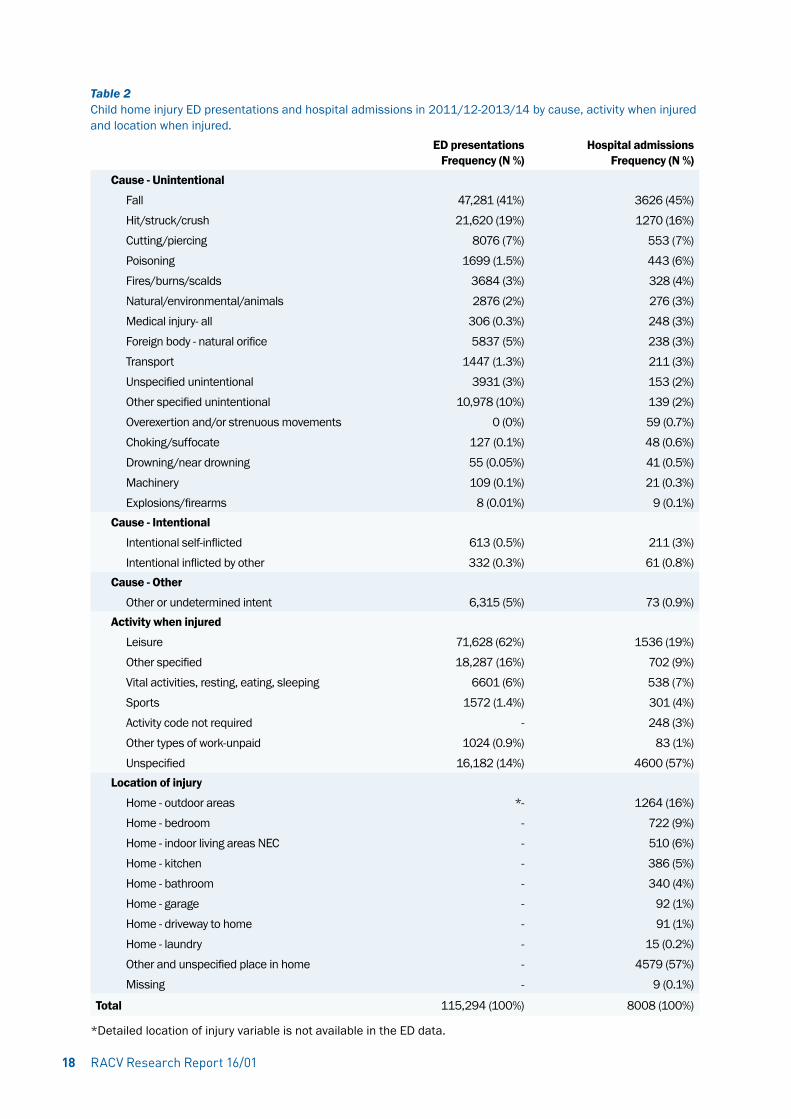
Table 2 Child home injury ED presentations and hospital admissions in 2011/12-2013/14 by cause, activity when injured and location when injured.
ED presentationsFrequency (N %)
Hospital admissionsFrequency (N %)
Cause - Unintentional
FallHit/struck/crushCutting/piercingPoisoningFires/burns/scaldsNatural/environmental/animalsMedical injury- allForeign body - natural orificeTransportUnspecified unintentionalOther specified unintentionalOverexertion and/or strenuous movementsChoking/suffocateDrowning/near drowningMachineryExplosions/firearms
47,281 (41%)21,620 (19%)
8076 (7%)1699 (1.5%)
3684 (3%)2876 (2%)
306 (0.3%)5837 (5%)
1447 (1.3%)3931 (3%)
10,978 (10%)0 (0%)
127 (0.1%)55 (0.05%)109 (0.1%)
8 (0.01%)
3626 (45%)1270 (16%)
553 (7%)443 (6%)328 (4%)276 (3%)248 (3%)238 (3%)211 (3%)153 (2%)139 (2%)59 (0.7%)48 (0.6%)41 (0.5%)21 (0.3%)
9 (0.1%)Cause - Intentional
Intentional self-inflictedIntentional inflicted by other
613 (0.5%)332 (0.3%)
211 (3%)61 (0.8%)
Cause - Other
Other or undetermined intent 6,315 (5%) 73 (0.9%)Activity when injured
LeisureOther specifiedVital activities, resting, eating, sleepingSportsActivity code not requiredOther types of work-unpaidUnspecified
71,628 (62%)18,287 (16%)
6601 (6%)1572 (1.4%)
-1024 (0.9%)
16,182 (14%)
1536 (19%)702 (9%)538 (7%)301 (4%)248 (3%)
83 (1%)4600 (57%)
Location of injury
Home - outdoor areasHome - bedroomHome - indoor living areas NECHome - kitchenHome - bathroomHome - garageHome - driveway to homeHome - laundryOther and unspecified place in homeMissing
*----------
1264 (16%)722 (9%)510 (6%)386 (5%)340 (4%)
92 (1%)91 (1%)
15 (0.2%)4579 (57%)
9 (0.1%)
Total 115,294 (100%) 8008 (100%)
*Detailed location of injury variable is not available in the ED data.
RACV Research Report 16/0118
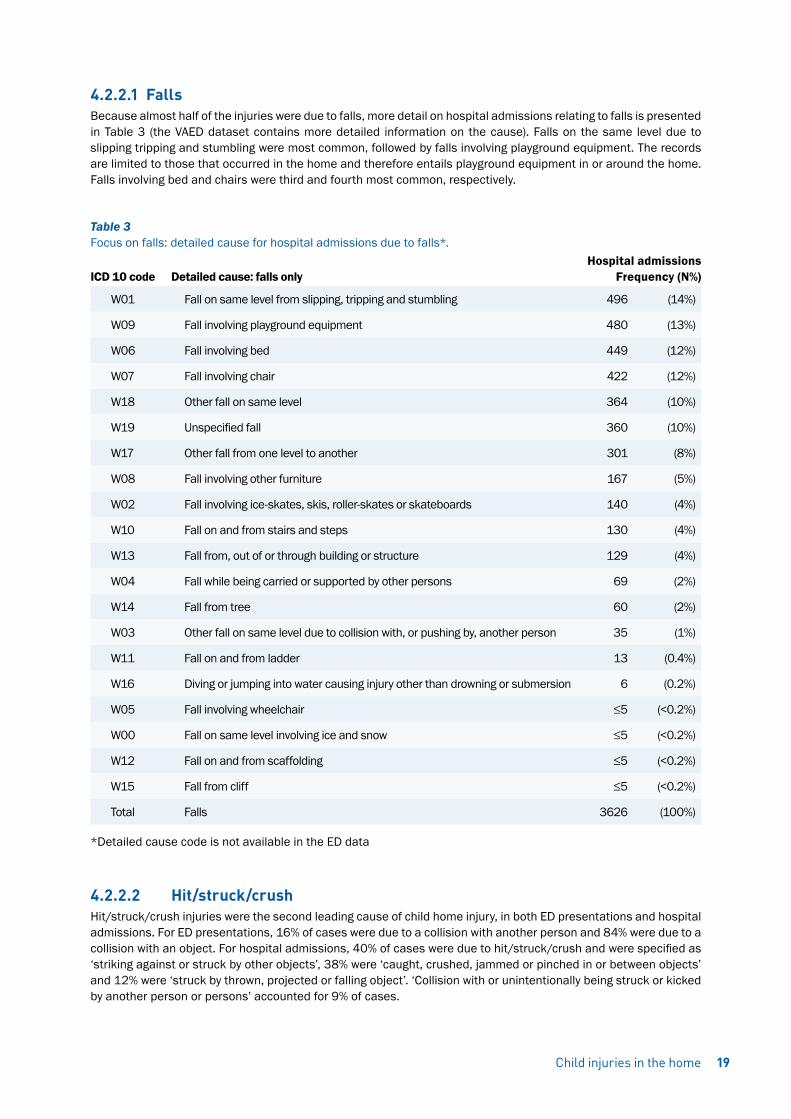
4.2.2.1 FallsBecause almost half of the injuries were due to falls, more detail on hospital admissions relating to falls is presented in Table 3 (the VAED dataset contains more detailed information on the cause). Falls on the same level due to slipping tripping and stumbling were most common, followed by falls involving playground equipment. The records are limited to those that occurred in the home and therefore entails playground equipment in or around the home. Falls involving bed and chairs were third and fourth most common, respectively.
Table 3 Focus on falls: detailed cause for hospital admissions due to falls*. Hospital admissionsICD 10 code Detailed cause: falls only Frequency (N%)
W01 Fall on same level from slipping, tripping and stumbling 496 (14%)
W09 Fall involving playground equipment 480 (13%)
W06 Fall involving bed 449 (12%)
W07 Fall involving chair 422 (12%)
W18 Other fall on same level 364 (10%)
W19 Unspecified fall 360 (10%)
W17 Other fall from one level to another 301 (8%)
W08 Fall involving other furniture 167 (5%)
W02 Fall involving ice-skates, skis, roller-skates or skateboards 140 (4%)
W10 Fall on and from stairs and steps 130 (4%)
W13 Fall from, out of or through building or structure 129 (4%)
W04 Fall while being carried or supported by other persons 69 (2%)
W14 Fall from tree 60 (2%)
W03 Other fall on same level due to collision with, or pushing by, another person 35 (1%)
W11 Fall on and from ladder 13 (0.4%)
W16 Diving or jumping into water causing injury other than drowning or submersion 6 (0.2%)
W05 Fall involving wheelchair ≤5 (<0.2%)
W00 Fall on same level involving ice and snow ≤5 (<0.2%)
W12 Fall on and from scaffolding ≤5 (<0.2%)
W15 Fall from cliff ≤5 (<0.2%)
Total Falls 3626 (100%)
*Detailed cause code is not available in the ED data
4.2.2.2 Hit/struck/crushHit/struck/crush injuries were the second leading cause of child home injury, in both ED presentations and hospital admissions. For ED presentations, 16% of cases were due to a collision with another person and 84% were due to a collision with an object. For hospital admissions, 40% of cases were due to hit/struck/crush and were specified as ‘striking against or struck by other objects’, 38% were ‘caught, crushed, jammed or pinched in or between objects’ and 12% were ‘struck by thrown, projected or falling object’. ‘Collision with or unintentionally being struck or kicked by another person or persons’ accounted for 9% of cases.
Child injuries in the home 19
4.2.2.3 Cutting/piercingCutting/piercing was the third leading cause of child home injury in both datasets. For ED presentations, 34% of cutting/piercing cases involved the hand or fingers followed by 17% to foot or toes, 11% to face or eyes and 9% to the head but not the face. In the hospital admissions data, 43% of cutting/piercing cases involved the hand or wrist, 26% involved the foot or ankle, 12% involved the head or face, 9% involved the elbow or forearm and 5% involved the knee or lower leg.
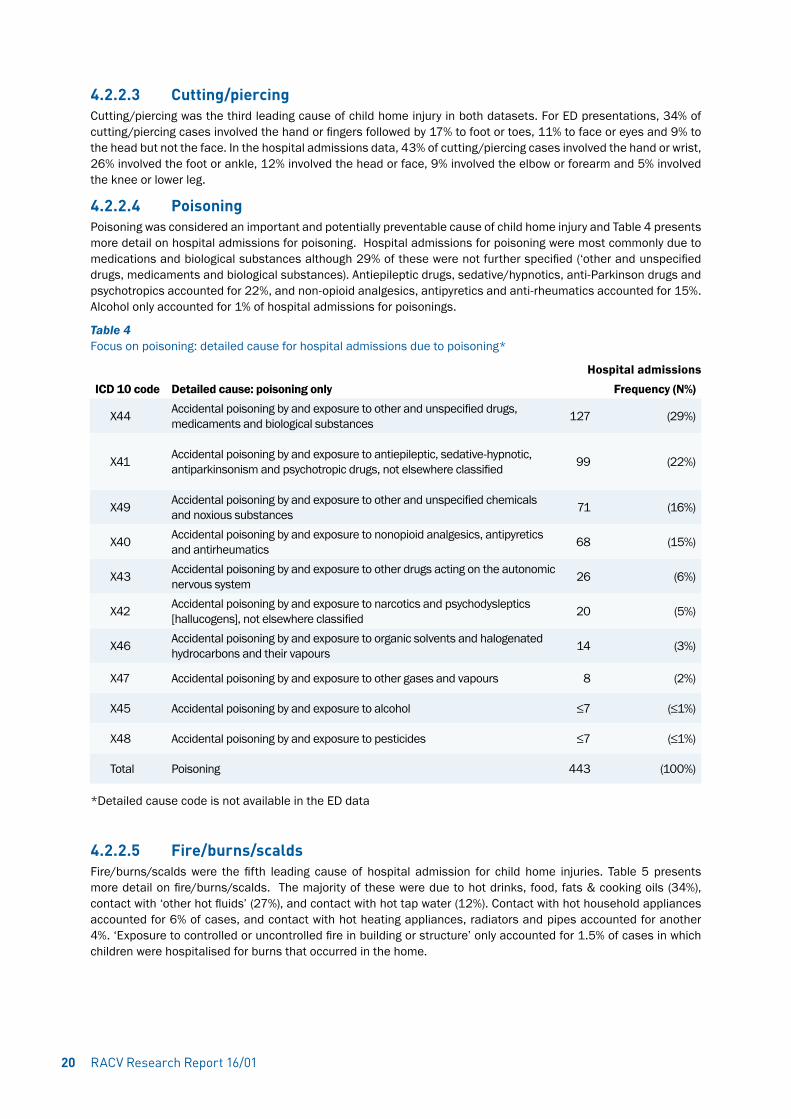
4.2.2.4 PoisoningPoisoning was considered an important and potentially preventable cause of child home injury and Table 4 presents more detail on hospital admissions for poisoning. Hospital admissions for poisoning were most commonly due to medications and biological substances although 29% of these were not further specified (‘other and unspecified drugs, medicaments and biological substances). Antiepileptic drugs, sedative/hypnotics, anti-Parkinson drugs and psychotropics accounted for 22%, and non-opioid analgesics, antipyretics and anti-rheumatics accounted for 15%. Alcohol only accounted for 1% of hospital admissions for poisonings.
Table 4 Focus on poisoning: detailed cause for hospital admissions due to poisoning*
Hospital admissionsICD 10 code Detailed cause: poisoning only Frequency (N%)
X44 Accidental poisoning by and exposure to other and unspecified drugs, medicaments and biological substances 127 (29%)
X41 Accidental poisoning by and exposure to antiepileptic, sedative-hypnotic, antiparkinsonism and psychotropic drugs, not elsewhere classified 99 (22%)
X49 Accidental poisoning by and exposure to other and unspecified chemicals and noxious substances 71 (16%)
X40 Accidental poisoning by and exposure to nonopioid analgesics, antipyretics and antirheumatics 68 (15%)
X43 Accidental poisoning by and exposure to other drugs acting on the autonomic nervous system 26 (6%)
X42 Accidental poisoning by and exposure to narcotics and psychodysleptics [hallucogens], not elsewhere classified 20 (5%)
X46 Accidental poisoning by and exposure to organic solvents and halogenated hydrocarbons and their vapours 14 (3%)
X47 Accidental poisoning by and exposure to other gases and vapours 8 (2%)
X45 Accidental poisoning by and exposure to alcohol ≤7 (≤1%)
X48 Accidental poisoning by and exposure to pesticides ≤7 (≤1%)
Total Poisoning 443 (100%)
*Detailed cause code is not available in the ED data
4.2.2.5 Fire/burns/scaldsFire/burns/scalds were the fifth leading cause of hospital admission for child home injuries. Table 5 presents more detail on fire/burns/scalds. The majority of these were due to hot drinks, food, fats & cooking oils (34%), contact with ‘other hot fluids’ (27%), and contact with hot tap water (12%). Contact with hot household appliances accounted for 6% of cases, and contact with hot heating appliances, radiators and pipes accounted for another 4%. ‘Exposure to controlled or uncontrolled fire in building or structure’ only accounted for 1.5% of cases in which children were hospitalised for burns that occurred in the home.
RACV Research Report 16/0120

Table 5 Detailed cause for hospital admissions due to fires/burns/scalds*
Hospital admissionsICD 10 code Detailed cause: fires/burns/scalds only Frequency (N%)
X10 Contact with hot drinks, food, fats and cooking oils 110 (34%)
X12 Contact with other hot fluids 87 (27%)
X11 Contact with hot tap-water 40 (12%)
X15 Contact with hot household appliances 20 (6%)
X16 Contact with hot heating appliances, radiators and pipes 12 (4%)
X08 Exposure to other specified smoke, fire and flames 10 (3%)
X09 Exposure to unspecified smoke, fire and flames 9 (3%)
X04 Exposure to ignition of highly flammable material 8 (2%)
X17 Contact with hot engines, machinery and tools 7 (2%)
X19 Contact with other and unspecified heat and hot substances 6 (2%)
X13 Contact with steam and hot vapours ≤5 (≤1.5%)
X00 Exposure to uncontrolled fire in building or structure ≤5 (≤1.5%)
X03 Exposure to controlled fire, not in building or structure ≤5 (≤1.5%)
X06 Exposure to ignition or melting of other clothing and apparel ≤5 (≤1.5%)
X02 Exposure to controlled fire in building or structure ≤5 (≤1.5%)
X14 Contact with hot air and gases ≤5 (≤1.5%)
Total Fires/burns/scalds 328 (100%)
*Detailed cause code is not available in the emergency department data
4.2.2.6 Foreign body through a natural orificeCause of injury in Table 2 has been ranked based on frequency in the admissions data. This ranking does not always match ranking of causes in the ED records. Five percent of ED child home injury presentations (and 3% of admissions) were coded as having a ‘foreign body – natural orifice’ cause. In the ED presentations, this was most commonly a foreign body in the digestive tract (36%), in the nose (31%), ear (19%), eye (8%), respiratory tract- excluding nose (4%) or genitourinary tract (2%). In the hospital admissions, ‘foreign body – natural orifice’ also most frequently involved the digestive tract (43%), followed by the respiratory tract including nose (27%), ear (18%), eye (4%) and genitourinary tract (4%).
4.2.2.7 Transport injuriesTransport injuries were relatively rare among child home injuries. Half of the transport injuries (n=105, 50%) were pedal cyclist injuries; 20% were pedestrian injuries, 16% were motor cycle injuries and 4% were car occupant injuries. This latter category is uncommon, as expected for injuries that occurred in (and around) the home.
4.2.2.8 Trampoline injuriesRecent publications have drawn attention to the relatively high number of trampoline injuries in Australia (Ashby, Eager, D’Elia, & Day, 2015; Ashby, Pointer, Eager, & Day, 2015). Trampoline related child home injuries that resulted in hospital admission were identified for the current report and cases were selected based on activity code of U57.06 ‘Trampoline and mini-trampoline’ and/or external cause code of W09.6 ‘Fall involving trampoline’. Of the hospital admissions for child home injury, 109 (4%), 125 (5%) and 124 (5%) were trampoline related, in 2011/12, 2012/13 and 2013/14, respectively. The vast majority (98%) of trampoline injuries were due to falls. Just over half (58%) of children with home trampoline injuries were males (P=0.002). It was also found that 34% of trampoline injuries were to children aged 0-4 years, 45% to children aged 5-9 years and 22% to children aged 10-14 years.
The activity when injured and the location of injury are of limited use because of the high proportion of admissions that are coded as ‘unspecified’ (activity) or ‘other and unspecified place in the home’ (location). The high proportion of child home injury admissions that are coded as having occurred in outdoor areas, however, provide an indication that this may be an important focus for child home injury prevention.
Child injuries in the home 21

RACV Research Report 16/0122
4.2.3 Patterns of injuryThe types of injuries sustained by children in the home are outlined in Table 6. Injury type is ranked from most common to least common, based on hospital admissions. Of the ED presentations, 38% were due to open wounds or fractures; these injuries accounted for more than half of the hospital admissions (55%). Among ED presentations, wounds most commonly involved the face (36%) or head (30%), followed by hand/finger (13%) and foot/toe (7%). Among admissions, open wounds were most likely to be wounds to the head (62%), wrist or hand (19%) or ankle or foot (8%). Among ED presentations, fractures were most commonly to the wrist (21%), forearm (19%), elbow (15%) hand/finger (11%) or foot/toe (9%). Admissions due to fractures were mostly elbow or forearm fractures (40%), shoulder or upper arm fractures (24%) or wrist or hand fractures (11%).
Systemic poisoning/toxic effects, which accounted for 9% of hospital admissions, were mostly due to poisoning by drugs, medicaments and biological substances (80%). The remainder of cases were due to toxic effects of nonmedicinal substances (20%). Among the hospital admissions, the most common cause of systemic poisoning/toxic effects was ‘Accidental poisoning by and exposure to other and unspecified drugs, medicaments and biological substances’ (18%), followed by ‘Intentional self-poisoning by and exposure to nonopioid analgesics, antipyretics and antirheumatics’ (15%) and ‘Accidental poisoning by and exposure to antiepileptic, sedative-hypnotic, antiparkinsonism and psychotropic drugs, not elsewhere classified’ (14%).
Table 6 Child home injury ED presentations and hospital admissions in 2011/12-2013/14 by injury type and body region.
ED presentations (N %) Hospital admissions (N %)
Injury type*
Open wound 28,209 (24%) 2,369 (30%)
Fracture 16,492 (14%) 1,986 (25%)
Systemic-poisoning/toxic effects 2787 (2%) 694 (9%)
Other & unspecified injury 15,583 (14%) 687 (9%)
Other effects of ext cause/complications/late effects 297 (0.3%) 383 (5%)
Burns 3805 (3%) 357 (4%)
Intracranial injury 3155 (3%) 311 (4%)
Superficial injury 14,998 (13%) 300 (4%)
Foreign body 7613 (7%) 278 (3%)
Dislocation, sprain & strain 16,909 (15%) 145 (2%)
Traumatic amputation 168 (0.2%) 144 (2%)
Injury to muscle & tendon 2251 (2%) 143 (2%)
Injury to nerves & spinal cord 40 (0.03%) 89 (1%)
Injury to blood vessels 136 (0.1%) 41 (0.5%)
Eye injury- excl foreign body 1263 (1.1%) 36 (0.5%)
Crushing injury 1365 (1.2%) 26 (0.3%)
Injury to internal organs 222 (0.2%) ≤5
Complications of surgical & med care NEC 0 (0%) ≤5
Body region*
Head/face/neck 42,363 (37%) 2989 (37%)
Upper extremity 36,435 (32%) 2543 (32%)
Body region not relevant 3754 (3%) 1079 (13%)
Lower extremity 17,851 (15%) 895 (11%)
Trunk 7160 (6%) 482 (6%)
Unspecified body region 6284 (5%) 14 (0.2%)
Multiple body regions 1444 (1.3%) 6 (0.1%)
Total 115,293 (100%) 8008 (100%)
*Detailed cause code is not available in the emergency department data

This section covers the burden of child home injury in terms of hospital cost and days in hospital based on hospital admissions records only. Injury types that occur most frequently do not necessarily constitute the greatest burden in terms of hospital days and cost. Estimation of the burden of child home injury gives insight into the relative severity of the injury, which is of importance for identifying the focus of child home injury prevention.
5.1 Data selection and methodsThe summed length of stay and direct cost of injury was calculated based on the VAED data only: ED presentations are not included in this estimation. Child home injuries were selected as hospital admissions for child home injury, in financial years 2011/12 and 2012/13 (cost data for 2013/14 was not available). Only Victorian residents were included and children aged 0-14 years were selected. Injury admissions were identified as those with an injury diagnosis (ICD codes S00-T98) in the first diagnostic code and home injuries were selected based on the place of occurrence coding. All admissions were included and readmissions and transfers were not excluded as these contribute to the summed cost and length of stay. Cost estimates for each admission were based on the average NHCDC DRG (Diagnosis Related Group) cost. These cost estimates, and the length of stay of each admission, were summed per sex, age group, and injury type, for the years 2011/12 and 2012/13, and presented as total and percentage for each category.
5.2 ResultsIn two years (2011/12 and 2012/13), child home injury accounted for 5,491 hospital days and almost $8 million in direct hospital costs. These numbers are based on hospital admissions data. The accumulated hospital days and estimated cost of child home injury by sex, age group and injury type for the years 2011/12 and 2012/13 are shown in Table 7. The age and gender pattern of hospital days and direct costs are generally similar to that of hospital admission incidence, as presented in Table 1; the burden is greater among males than females, and the burden is greatest in the 0-4 year age group and smallest in the 10-14 year age group.
The relative contribution of injury types to the overall burden, however, differs from the relative contribution of injury types to the overall injury incidence as presented in Table 6: 30% of incident hospital admissions for child home injuries are for open wounds, yet open wounds constitute only 13% of hospital days for child home injuries. The total cost of hospital admissions for wounds, however, was considerable at 26% of the total. Fractures on the other hand contribute more substantially to hospital days (32%) and direct cost (37%), than to the number of incident admissions (25%), which can be expected based on the relative severity and potential for complications of bone fractures. Two other injury types are noteworthy because of discrepancy between the frequency of occurrence and the relative contribution to the injury burden: 4% of incident hospital admissions were for burns, whereas burns admissions constituted 17% of hospital days and 10% of direct costs. Similarly, intracranial injury was relatively rare (4% of incident admissions) but the relative contribution to hospital days was considerable (6%).
Child injuries in the home 23
Hospital days and direct costs5
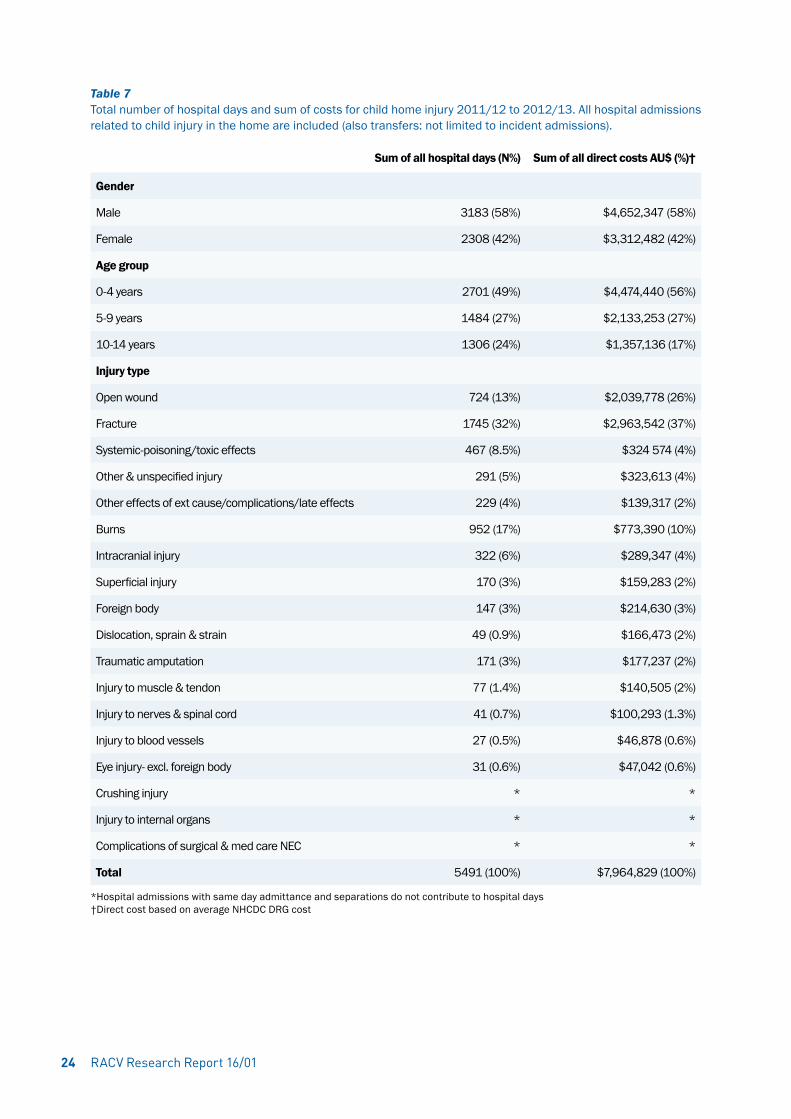
Table 7 Total number of hospital days and sum of costs for child home injury 2011/12 to 2012/13. All hospital admissions related to child injury in the home are included (also transfers: not limited to incident admissions).
Sum of all hospital days (N%) Sum of all direct costs AU$ (%)†
Gender
Male 3183 (58%) $4,652,347 (58%)
Female 2308 (42%) $3,312,482 (42%)
Age group
0-4 years 2701 (49%) $4,474,440 (56%)
5-9 years 1484 (27%) $2,133,253 (27%)
10-14 years 1306 (24%) $1,357,136 (17%)
Injury type
Open wound 724 (13%) $2,039,778 (26%)
Fracture 1745 (32%) $2,963,542 (37%)
Systemic-poisoning/toxic effects 467 (8.5%) $324 574 (4%)
Other & unspecified injury 291 (5%) $323,613 (4%)
Other effects of ext cause/complications/late effects 229 (4%) $139,317 (2%)
Burns 952 (17%) $773,390 (10%)
Intracranial injury 322 (6%) $289,347 (4%)
Superficial injury 170 (3%) $159,283 (2%)
Foreign body 147 (3%) $214,630 (3%)
Dislocation, sprain & strain 49 (0.9%) $166,473 (2%)
Traumatic amputation 171 (3%) $177,237 (2%)
Injury to muscle & tendon 77 (1.4%) $140,505 (2%)
Injury to nerves & spinal cord 41 (0.7%) $100,293 (1.3%)
Injury to blood vessels 27 (0.5%) $46,878 (0.6%)
Eye injury- excl. foreign body 31 (0.6%) $47,042 (0.6%)
Crushing injury * *
Injury to internal organs * *
Complications of surgical & med care NEC * *
Total 5491 (100%) $7,964,829 (100%)
*Hospital admissions with same day admittance and separations do not contribute to hospital days†Direct cost based on average NHCDC DRG cost
RACV Research Report 16/0124
Child injuries in the home 25
In this chapter the rates of child home injury in the population are presented, grouped by country of birth, socio-economic status, and remoteness. The purpose is to provide estimates of child home injury rates among potentially vulnerable groups. Calculation of rates requires a breakdown of the hospital data by group (country of birth, etc.), as well as breakdown of the population data into the same groups. Because of limitations in the population data availability, this analysis is carried out for the year 2011 only (calendar year).
6.1 Data selection and methodsChild home injury among vulnerable groups was explored according to new migrant status, rural/urban residence and socioeconomic status. Country of birth was used to identify new migrants for children aged 0-14 years as country of birth other than Australia was considered to reflect recent migration.
Socio-Economic Indexes for Areas (SEIFAs) were used as proxy for socioeconomic status. SEIFA is a ranking of socio-economic advantage and disadvantage based on residential area (Australian Bureau of Statistics, 2011). SEIFAs were determined based on residential postal code.
Remoteness was also established based on Victorian residential postal code, and grouped as ‘Major Cities of Australia’, ‘Inner Regional Australia’, ‘Outer Regional Australia’, or ‘Remote Australia’. As this report includes Victorian data only, these groups will be presented as ‘Major Cities’, ‘Inner Regional’, ‘Outer Regional’ and ‘Remote’. Because Victoria does not have substantial remote areas, and considering that these areas are likely to lack hospitals, the hospital treated injury rates for remote areas have to be interpreted with caution.
Injury rates among potentially vulnerable groups were calculated by combining VEMD and VAED injury data with residential population data for the 2011 calendar year. The residential population data was based on population estimates released by the Australian Bureau of Statistics. Residential population data was grouped by age, sex, and SEIFA decile; remoteness; or country of birth. The number of ED presentations for child home injury in 2011 were determined from the VEMD and return visits were excluded. The number of hospital admissions for child home injury in 2011 were determined from the VAED and readmissions and transfers were excluded. Same day separations (where admission and separation took place on the same day) are included as this analysis does not concern time trends.
Injury rates were calculated as the number of incident admissions or ED presentations in 2011 divided by the resident population in 2011. The rate was multiplied by 1000 to give the annual number of admissions per 1000 persons. To better understand the population data variability, 95% confidence intervals (95%CI) were calculated as:
1000/(population )×(events±1.96×√events)
where events are ED presentations (VEMD) or admissions (VAED). For stratification by age, gender, SEIFA decile, country of birth, and remoteness area, the admissions or presentations as well as the population data were broken down into the groups. Statistical tests for differences in rates were carried out using chi-square tests. SEIFA trends were statistically tested using negative binomial or Poisson models. The annual number of injuries were modelled as a function of ranked SEIFA deciles, with the log of the population as offset. All analyses were conducted using SAS 9.4 and the SAS PROC GENMOD procedure was used for the modelling
6.2 ResultsAn overview of the hospital admissions and ED presentations for child home injury per age group, sex, country of birth, SEIFA and remoteness is given in Table 8. As discussed in previous chapters, injury rates are higher among males than females and rates are highest among the 0-4 year age group and lowest among the 10-14 year age group.
6.2.1 Injury risk based on country of birthChildren born in Oceania or Antarctica (which includes Australia and New Zealand) had the highest rates of admissions and ED presentations. Children born in Europe, Africa, or Asia had lower rates of hospital treated injury
High risk groups: remoteness, country of birth and socioeconomic status6
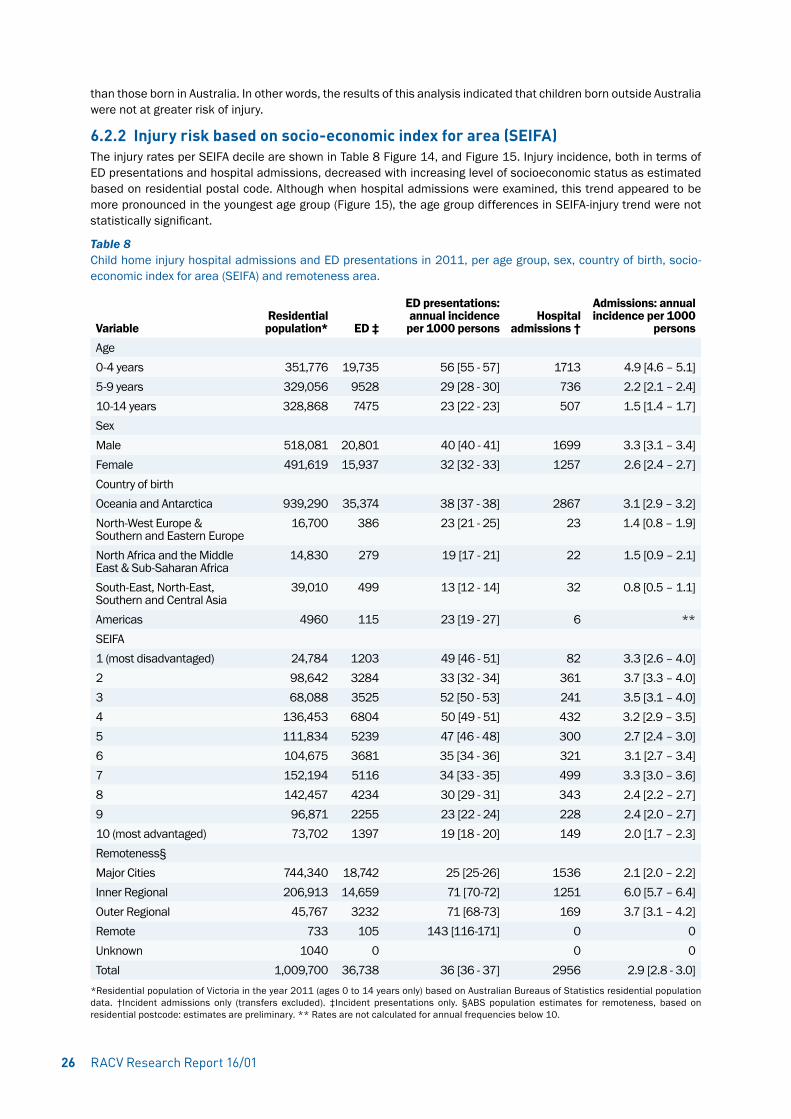
than those born in Australia. In other words, the results of this analysis indicated that children born outside Australia were not at greater risk of injury.
6.2.2 Injury risk based on socio-economic index for area (SEIFA)The injury rates per SEIFA decile are shown in Table 8 Figure 14, and Figure 15. Injury incidence, both in terms of ED presentations and hospital admissions, decreased with increasing level of socioeconomic status as estimated based on residential postal code. Although when hospital admissions were examined, this trend appeared to be more pronounced in the youngest age group (Figure 15), the age group differences in SEIFA-injury trend were not statistically significant.
Table 8 Child home injury hospital admissions and ED presentations in 2011, per age group, sex, country of birth, socio-economic index for area (SEIFA) and remoteness area.
VariableResidential population* ED ‡
ED presentations: annual incidence per 1000 persons
Hospital admissions †
Admissions: annual incidence per 1000
personsAge0-4 years 351,776 19,735 56 [55 - 57] 1713 4.9 [4.6 – 5.1]5-9 years 329,056 9528 29 [28 - 30] 736 2.2 [2.1 – 2.4]10-14 years 328,868 7475 23 [22 - 23] 507 1.5 [1.4 – 1.7]SexMale 518,081 20,801 40 [40 - 41] 1699 3.3 [3.1 – 3.4]Female 491,619 15,937 32 [32 - 33] 1257 2.6 [2.4 – 2.7]Country of birthOceania and Antarctica 939,290 35,374 38 [37 - 38] 2867 3.1 [2.9 – 3.2]North-West Europe & Southern and Eastern Europe
16,700 386 23 [21 - 25] 23 1.4 [0.8 – 1.9]
North Africa and the Middle East & Sub-Saharan Africa
14,830 279 19 [17 - 21] 22 1.5 [0.9 – 2.1]
South-East, North-East, Southern and Central Asia
39,010 499 13 [12 - 14] 32 0.8 [0.5 – 1.1]
Americas 4960 115 23 [19 - 27] 6 **SEIFA1 (most disadvantaged) 24,784 1203 49 [46 - 51] 82 3.3 [2.6 – 4.0]2 98,642 3284 33 [32 - 34] 361 3.7 [3.3 – 4.0]3 68,088 3525 52 [50 - 53] 241 3.5 [3.1 – 4.0]4 136,453 6804 50 [49 - 51] 432 3.2 [2.9 – 3.5]5 111,834 5239 47 [46 - 48] 300 2.7 [2.4 – 3.0]6 104,675 3681 35 [34 - 36] 321 3.1 [2.7 – 3.4]7 152,194 5116 34 [33 - 35] 499 3.3 [3.0 – 3.6]8 142,457 4234 30 [29 - 31] 343 2.4 [2.2 – 2.7]9 96,871 2255 23 [22 - 24] 228 2.4 [2.0 – 2.7]10 (most advantaged) 73,702 1397 19 [18 - 20] 149 2.0 [1.7 – 2.3]Remoteness§Major Cities 744,340 18,742 25 [25-26] 1536 2.1 [2.0 – 2.2]Inner Regional 206,913 14,659 71 [70-72] 1251 6.0 [5.7 – 6.4]Outer Regional 45,767 3232 71 [68-73] 169 3.7 [3.1 – 4.2]Remote 733 105 143 [116-171] 0 0Unknown 1040 0 0 0Total 1,009,700 36,738 36 [36 - 37] 2956 2.9 [2.8 - 3.0]
*Residential population of Victoria in the year 2011 (ages 0 to 14 years only) based on Australian Bureaus of Statistics residential population data. †Incident admissions only (transfers excluded). ‡Incident presentations only. §ABS population estimates for remoteness, based on residential postcode: estimates are preliminary. ** Rates are not calculated for annual frequencies below 10.
RACV Research Report 16/0126
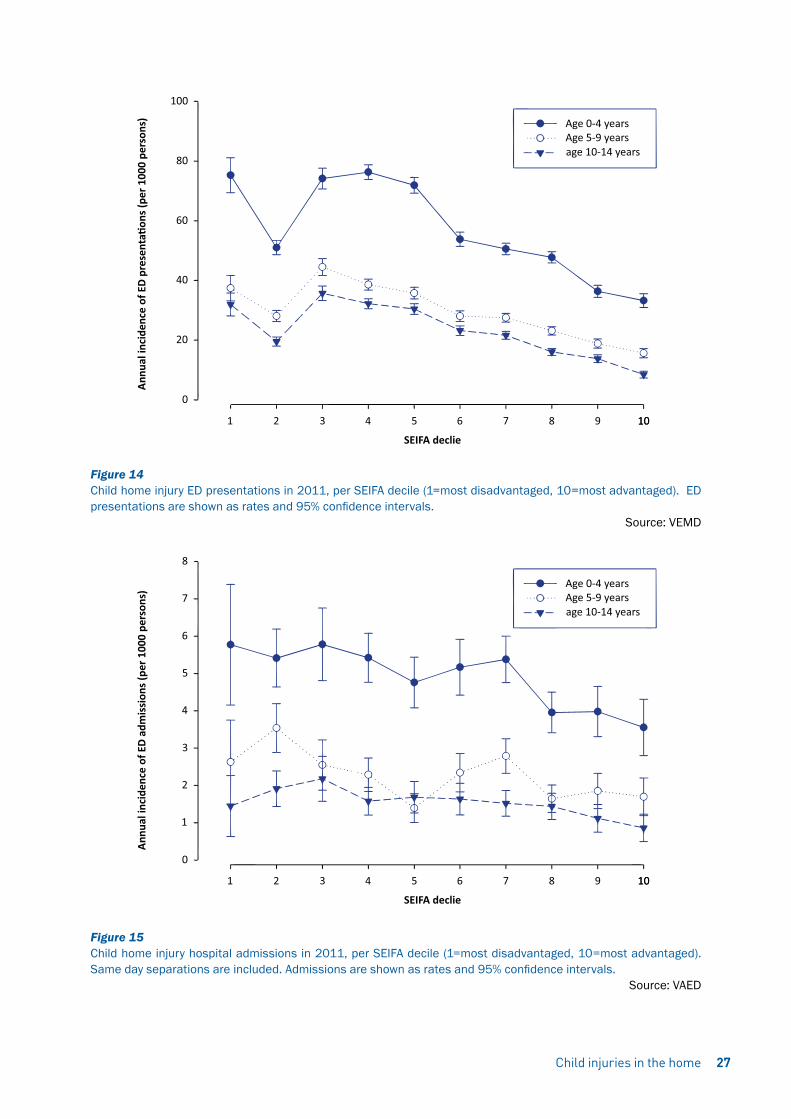
Figure 14 Child home injury ED presentations in 2011, per SEIFA decile (1=most disadvantaged, 10=most advantaged). ED presentations are shown as rates and 95% confidence intervals.
Source: VEMD
Figure 15 Child home injury hospital admissions in 2011, per SEIFA decile (1=most disadvantaged, 10=most advantaged). Same day separations are included. Admissions are shown as rates and 95% confidence intervals.
Source: VAED
Child injuries in the home 27

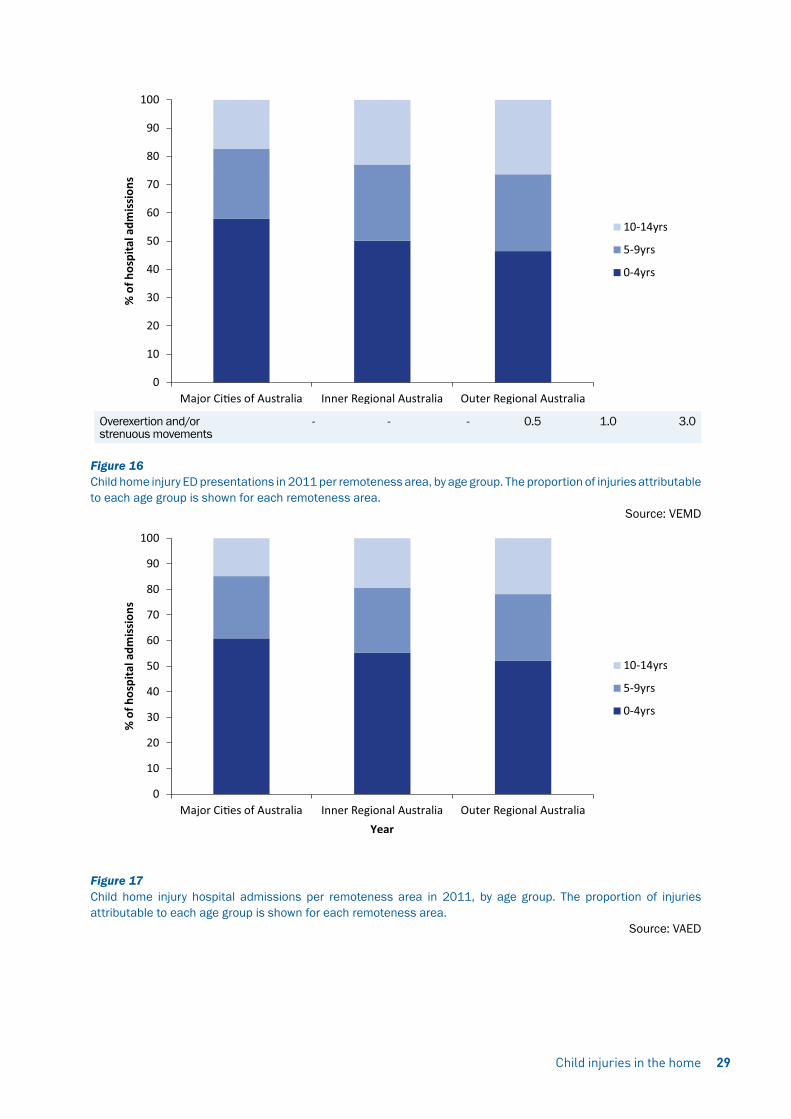
6.2.3 Injury risk based on remotenessHospital treated injury rates per remoteness area are shown in Table 8, Figure 16, and Figure 17. There was a striking difference between the injury rates in major cities compared with inner regional areas. Inner regional areas had 2.8 to 3-fold higher child home injury rates. The 0-4 year age group was relatively overrepresented in child home injuries in major cities and the 10-14 year age group was slightly overrepresented in child home injuries in inner regional and outer regional areas. The cause of injury in major cities compared to inner regional areas and outer regional areas is shown in Table 9.
Although the overall distribution of causes differs statistically significantly between the three areas, striking differences were mainly differences in the relative contribution of falls, which were relatively more common in major cities, and transport injuries (in/around the home), which were relatively more common in inner regional and outer regional areas.
The number of ED presentations for transport injuries (that occurred in or around the home) were sufficient for further breakdown. Detailed analysis of transport injuries shows that these were likely to be pedal cyclist injuries (n=209, 46%), the majority of which occurred in inner regional areas (n=127/209) even though only 21% of the child population of Victoria lived in inner regional areas in 2011. Of the transport injuries, 104 (23%) were motorcycle driver injuries, and 55/104 of these occurred in inner regional areas. The next largest category of transport injuries (n=65, 14%) were horse related and 44 of these 65 horse related injuries occurred in inner regional areas. In other words, children in inner regional areas are likely to get injured in home-based transport activities such as pedal cycling, motorcycle riding and horse riding. These injuries are much less common among home injuries in major cities.
Table 9 Child home injury ED presentations and hospital admissions per remoteness area in 2011, by cause. Same day separations in the hospital admissions data are included.
ED Presentations Hospital Admissions
Major Cities Inner Regional
Outer Regional Major Cities Inner
RegionalOuter
RegionalCause % % % % % %
Fall 40.1 38.5 35.4 45.6 43.3 34.9
Hit/struck/crush 19.7 19.7 18.8 16.6 13.8 14.8
Other or undetermined intent
9.2 4.5 3.1 1.2 1.0 0.6
Other specified unintentional
9.0 9.0 10.7 2.5 2.8 3.6
Cutting/piercing 6.8 7.9 10.5 7.8 6.8 5.3
Foreign body – natural orifice
4.4 5.3 5.4 2.8 3.6 1.8
Fires/burns/scalds 3.3 3.3 4.6 4.4 6.1 6.5
Unspecified unintentional 3.0 3.4 2.4 1.6 1.9 3.0
Natural/environmental/animals
2.0 3.5 3.0 3.3 4.3 5.3
Poisoning 1.3 1.7 1.6 5.1 5.1 5.3
Transport 0.5 1.8 3.2 2.5 3.4 4.7
Intentional self-inflicted 0.3 0.4 0.4 1.1 2.0 5.9
Intentional inflicted by other 0.2 0.7 0.4 0.9 1.0 0.6
Medical injury- all 0.1 0.1 0.1 3.3 2.1 4.1
Choking/suffocate 0.1 0.2 0.1 0.3 1.0 0.0
Machinery 0.1 0.1 0.3 0.3 0.4 0.0
Drowning/near 0.1 0.0 0.0 0.2 0.3 0.6
Explosions/firearms 0.0 0.0 0.0 0.0 0.1 0.0
RACV Research Report 16/0128
Overexertion and/or strenuous movements
- - - 0.5 1.0 3.0
Figure 16 Child home injury ED presentations in 2011 per remoteness area, by age group. The proportion of injuries attributable to each age group is shown for each remoteness area.
Source: VEMD
Figure 17 Child home injury hospital admissions per remoteness area in 2011, by age group. The proportion of injuries attributable to each age group is shown for each remoteness area.
Source: VAED
Child injuries in the home 29

RACV Research Report 16/0130
This section provides a brief overview of child deaths that occurred in the home due to external causes for the years 2006/07 to 2011/12. The ABS has recently made changes to the way death data is analysed and released. The data for 2012 currently contains ‘preliminary’ data, the data for 2011 is ‘revised’, and data from the years before that are ‘final’. Next year, the preliminary data will be revised and updated with coronial information, and released as ‘revised’, and so forth. The data is currently not suited for trend analysis: death trends in the most recent years are potentially affected by data status (preliminary/revised/complete). Because child deaths are relatively rare, and small cell counts must be avoided, the available six years of data are grouped together and then presented by cause, location, age and sex.
7.1 Data selection and methodsChild deaths were relatively uncommon. To avoid presentation of small cell counts, child deaths were determined from the latest six years, not three years, of the available cause of death data. Child deaths were included if they were registered in Victoria between 2006/07 and 2011/12, if the death occurred in the home, and if the age at the time of death was 0-14 years. Only deaths due to an external cause were included and these were identified based on the underlying cause of death (UCOD) ICD10 codes that capture external causes of morbidity and mortality: V01-V99; W00-W99; X00-X99; or Y00-Y99.
The results are presented as frequencies and percentages. The results are presented by age, gender, year, geographical location (remoteness, based on ARIA), and cause.
Deaths per age and gender are not presented as rates because rates calculated from less than ten events per year are considered unreliable.
7.2 ResultsOf all child deaths due to an external cause, 57.1% of deaths occurred in the home for ages 0-4 years, 40.6% for ages 5-9 years, and 30.8% for ages 10-14 years. These results are based on the years 2011/12 to 2013/14.
An overview of child home injury deaths is given in Table 10. There were 94 child injury deaths that occurred in the home in 2006/7 to 2011/12 which is an annual average of 15.7 deaths. Although males appeared slightly overrepresented in the child home injury deaths (57%), this was not statistically significant. Child home injury deaths were most common in the age group 0-4 years, followed by 10-14 years, and least common in the age group 5-9 years. Slightly more than half of all child home injury deaths occurred in inner regional areas. Of the Victorian population aged 0-14, 21% live in inner regional areas and 75% live in major cities so it was found that children living in inner regional areas are strongly overrepresented in child home injury deaths. This is also reflected in the most common cause of child home injury deaths which was fires/burns/scalds, followed by drowning/near drowning, followed by choking/suffocation. Intentional child home injury deaths, either self-inflicted (11%) or inflicted by other (6%), are relatively uncommon.
Child deaths 2006/07 to 2011/127

Child injuries in the home 31
Table 10 Child deaths in the home, due to external cause, in 2006/7 – 2011/12
Deaths Frequency N (%) Gender
Male 54 (57%)
Female 40 (43%)
Age group
0-4 years 52 (55%)
5-9 years 18 (19%)
10-14 years 24 (26%)
Year
2006/07 17 (18%)
2007/08 10 (11%)
2008/09 19 (20%)
2009/10 23 (24%)
2010/11 12 (13%)
2011/12 13 (14%)
Geographic information
Major cities 36 (38%)
Inner regional 51 (54%)
Outer regional 7 (7%)
Cause - unintentional
Fires/burns/scalds 22 (23%)
Drowning/near drowning 18 (19%)
Choking/suffocate 12 (13%)
Transport 6 (6%)
Natural/environmental/animals <5 (<5%)
Hit/struck/crush <5 (<5%)
Poisoning <5 (<5%)
Machinery <5 (<5%)
Cause - intentional
Intentional self-inflicted 10 (11%)
Intentional inflicted by other 6 (6%)
Cause - other
Other or undetermined intent 11 (12%)

Unintentional poisoning is known to affect a large number of children annually and is a problem that is potentially preventable (Chien, Marriott, Ashby, & Ozanne-Smith, 2003). Childhood poisoning can come in the form of household products, plants, paints or solvents, pesticides, or prescribed or over-the-counter medications to name a few (Chien et al., 2003; Vilke et al., 2011). Of pharmacological agents, these can be anything from pain killers to cough and cold preparations to cardiac medication (Safe Kids Worldwide, 2015).
Children can access medication by sifting through purses and bags or dressers and cabinets, as well as finding pill boxes and any medication that has fallen to the ground or an accessible area (Safe Kids Worldwide, 2015). Children can also find domestic products by looking through cupboards, they can consume plant products by spending time outside and can find insecticides and pesticides in most garden sheds. This combined with a lack of supervision can result in ingestion and subsequent poisoning. In order to develop effective prevention strategies, information on who is most at risk and how, is vital.
This literature review aims to provide an overview of the epidemiology of unintentional medication poisoning and unintentional non-medicinal poisoning among children. This review will also report on risk factors and possible prevention strategies (see Appendix for search methods).
To facilitate comparison of the literature to the findings of the current study, an overview of hospital admissions due to poisoning that occurred in the home, per age group and gender is was provided in Figure 18. The data selection ethods comply with those outlined “ Patterns of injury: ED presentations and hospital admissions” in Section 4.
Figure 18 Hospital admissions due to poisoning in the home in 2011/12-2013/14 by age and sex.
Source: VAED
Unintentional poisoning among children 8
RACV Research Report 16/0132
Child injuries in the home 33
8.1 Unintentional poisoning among children including medicinal substances8.1.1 AgeIn an Australian study, two year olds were involved in 44.4% of over-the-counter medication-related ED presentations (Chien et al., 2003). Children aged 1 and 2 years had an annual rate of 444.4 and 534.6 per 100,000 age-specific population (respectively) ED presentations for unintentional medication exposures in the US, and accounted for 72% of all cases for those less than 4 years old (Freeman et al., 2006). Another US study reported that 2 year olds had the highest population rate of 54.7 per 10,000 individuals for ED visits for medication overdose, followed by 1-year-olds with a rate of 43.2 per 10,000 individuals (Schillie et al., 2009).
A Spanish study found that 59.2% of poisonings to those younger than 6 years were due to medication products, much higher than for 7-13 years (34.2%) and children older than 14 years (41.2%) (Mintegi et al., 2006).
A study from the US found that poisoning due to medications were responsible for 65.5% of all poisonings for 2 year olds and 68% for 3 year olds (Vilke et al., 2011). Another reported pharmacological agents made up 41.2% of poisoning agents to those younger than 18 years and 42.4% of those aged 7 months to 4 years (Sumer et al., 2011).
Hospitalisation for medicinal poisoning peaked at age 27-29 months in both sexes and children aged 24-41 months, 45-47 months and 54-56 months had higher odds for medicinal poisoning than non-medicinal poisoning (Schmertmann, Williamson, & Black, 2012).
8.1.2 GenderMedicinal poisoning hospitalisations for males in New South Wales exceeded that of females for all ages 0-4 years, with the exception of 3-11 month olds (Schmertmann et al., 2012). Pharmaceutical ingestions resulting in ED presentation involved males in an average of 51.4% of cases for children younger than 5 years in Victoria (Chien et al., 2003) and 53.1% for children younger than 4 years in the United States (Freeman et al., 2006). This pattern was similar in a US study of all children younger than 18 years where males accounted for 53.6% of ED presentations (Schillie et al., 2009). Of all children younger than 18 years, males accounted for 44.8% of ED presentations for pharmaceutical poisoning in Taiwan (Lin et al., 2011). Whilst the findings from the Taiwanese study appear to contradict the results from previous studies, the majority of the sample (48.3 %) were adolescents (Lin et al., 2011) whereas in the US study only 10% of the sample were older than 11 years. This may help explain why there were a higher number of females admitted to ED in the Taiwanese study. These findings highlight the importance of considering age when examining gender differences in pharmaceutical poisonings.
8.1.3 LocationPharmaceutical poisoning most commonly occurs in the home (Freeman et al., 2006; Lin et al., 2011). The kitchen was the most common place of all poisoning (20%), followed by the dining room (12.1%) and bathroom (8.8%) (Lamireau et al., 2002).
8.1.4 Causes and type of poisoning8.1.4.1 Medication-specific studiesOf calls to the poisons information line for children less than 5 years, 28.7% were for over-the-counter medications and 13.7% were for prescription medication (Chien et al., 2003). Paracetamol and cough/cold preparations were responsible for 14.8% and 13.3% of calls to the poisons information line for over-the-counter medication, followed by 9.9% for silica gel (used in pharmaceutical containers as a desiccant). Over the counter medicinal poisoning incidents were also highly represented at ED presentations and accounted for 73.9% of cases. Paracetamol and cough/cold preparations were responsible for 38% and 26.3% of these presentations. In this study, prescription medication accounted for a lower rate (26.1%) of ED presentations. In a US study, over-the counter medications also accounted for a significant portion of ED presentations (33.9%) (Schillie et al., 2009). In this same study, the most common class of medications resulting in ED presentation were acetaminophen (paracetamol), opioids (analgesics), and cough/cold preparations.
Other studies have shown that prescription and over the counter medications were responsible for a similar proportion of ED presentations (Centers for Disease Control and Prevention, 2006). Central nervous system agents (including antidepressants and some analgesics) were the most common class of accidently ingested medication. The Taiwanese study found that neurological system agents were the most common type of medication for accidental pharmaceutical poisonings (61.7%) (Lin et al., 2011).
Whilst there are variations in the percentages of ED presentations that result from over the counter and prescription medications, it is clear that medicinal poisoning accounts for a significant portion of all incidences of childhood

RACV Research Report 16/0134
poisoning. There is some evidence to support that medicinal poisoning most commonly results from the consumption of over the counter medication, with paracetamol and cough/cold remedies accounting for a significant portion of these.
Single medications were involved in 93.4% of ED presentations for poisonings to children younger than 4 year olds in the US (Freeman et al., 2006). Of specified sources of medication, pills left out or the bottle left open was the most common, followed by it being given to the child in error, child opened purse and child opened the pill box. Of specified intended users, the grandparents were the most common, followed by the parent (Centers for Disease Control and Prevention, 2006).
8.1.4.2 General poisoning studies Findings from general poisoning studies also indicated that medications account for a significant portion of hospital admissions. A US study found that for children under five years more than half of all poisonings were due to either prescription or over the counter medication (55.6%) (Vilke et al., 2011). An Australian study also highlighted the large portion of hospitalisations that result from unintentionally consuming medicinal substances and accounted for 83% of hospitalisations in children aged 0-4 (Schmertmann et al., 2012).
Different countries have reported conflicting findings regarding the most common drugs that result in accidental childhood poisonings. A Turkish study reported that the drug groups which caused the most frequent poisonings were antidepressants (36.5%), drugs containing iron (7.3%) and anti-psychotic drugs (6.3%) (Sumer et al., 2011). By contrast, a French study concluded that the poisoning substance was of pharmaceutical origin in 52.5% of cases, with neurological and specifically analgesic drugs the most common (Lamireau et al., 2002). A Spanish study found that paracetamol was the most frequent drug, accounting for 15.3% of all childhood poisonings; and of children younger than 5 years, 19.5% of cases had paracetamol accidental intoxication (Mintegi et al., 2006). This aligns with previous research in medication specific studies which documented that paracetamol consumption was frequently the cause of poisoning (Chien et al., 2003; Schillie et al., 2009)
It is possible that the variation in findings can be explained by the many countries which have been included in this literature review. It is likely that differences in health care facilities, reporting procedures, and the availability of certain medications may help to partially explain some of these findings. What does seem clear is that medication related poisonings result in a large number of hospitalisations, and that over the counter medication is commonly the cause.
8.1.5 SeverityAn average of 19.9% of over the counter ingestions that presented to the ED were subsequently admitted to hospital for further treatment (Chien et al., 2003). Similar admission rates were reported in other US studies where 9.7% (Centers for Disease Control and Prevention, 2006) and 15.6% (Schillie et al., 2009) of ED presentations resulted in hospitalisations. A Taiwanese study did report a much higher level of admission with 79.4% of accidental pharmaceutical poisonings resulting in hospital admissions however, this result needs to be interpreted with caution (Lin et al., 2011). This study included only 87 participants, an exceptionally small sample when compared to the other studies which had much larger samples sizes using data from thousands of participants.
8.1.6 Risk factorsIn an Australian case-control study, it found that first-born children were more frequently poisoned (Schmertmann, Williamson, Black, & Wilson, 2013). This study reported that accessible poison storage locations, less close supervision and more maternal psychological stress may contribute to unintentional poisoning in children (Schmertmann et al., 2013).
Another study demonstrated the odds of poisoning by medicinal substances compared with non-medicinal substances change as children age, and the stage of child development is associated with the type of substance accessed and ingested (Schmertmann et al., 2012). Children aged 15-17 months were more likely to be hospitalised due to non-medicinal poisoning whereas children aged 21 -30 months were more likely to be poisoned from pharmaceutical substances (Schmertmann et al., 2012). This needs to be considered when developing strategies to better educate parents about the risks of poisoning and when children are most vulnerable.
Socioeconomic status is another important risk factor in childhood poisoning. An Australian study found that overall across socioeconomic status brackets the frequency of medicinal and non-medicinal poisoning was similar with a slight skew towards the most disadvantaged populations (Schmertmann et al., 2012). The fewest medicinal and non-medicinal poisonings occurred in families that were classified as being the least disadvantaged.
8.1.7 Injury preventionThe person caring for a child needs to take responsibility for the physical safety of that child and protect the child

Child injuries in the home 35
from possible harms (Sumer et al., 2011). It is therefore necessary to develop education on prevention of poisoning as poisoning exposure in children remains a frequent problem (Lamireau et al., 2002).
Providing clear warnings to parents on labels of dangerous pharmaceutical substances would be beneficial to prevent future unintentional childhood poisonings (Lamireau et al., 2002). There should be close interaction with the child, appropriate supervision and poisons storage practices provided, particularly for ages 1-3 years (Schmertmann et al., 2013). Storage of medications that are out of reach of small children, ensuring medication containers are closed tightly after use and discarding leftover or expired medication are suggested injury prevention strategies (Freeman et al., 2006; Safe Kids Worldwide, 2015). Behavioural modifications such as not calling medication “candy” (or similar) and avoiding taking medication in the presence of children (as they tend to imitate adults) have also been suggested (Freeman et al., 2006).
Caregivers should be provided with education regarding the link between stages of child development and poisoning risk in order to better anticipate the child’s abilities and adjust poison storage and supervision practices (Schmertmann et al., 2012).
8.1.8 ConclusionUnintentional medication poisonings most commonly occurred in the home. Children aged 1 and 2 years were consistently the most frequently treated for unintentional medication poisoning, as were males, however the discrepancy between genders was marginal. Paracetamol/acetaminophen was frequently reported as the most common class of medication that caused poisoning, followed by cough and cold preparations and antidepressants. Poisoning cases varied in their severity (based on the proportion subsequently admitted to hospital for further treatment) from approximately 10% to 80%, however this could have varied based on the country the study originated from and their procedures and health care organisation (including access to GPs).
Injury prevention strategies tend to focus on increasing education regarding medication storage and the dangers of pharmaceutical substances, as well as supervision and behavioural changes.
8.2 Unintentional poisoning among children: non-medicinal substancesIn studies that examined all paediatric poisonings, the most common types of non-pharmacological agents were domestic products (such as bleach and white spirits). In French, Spanish and Turkish studies, approximately 30% of all emergency poisonings were due to these domestic products (Lamireau et al., 2002; Mintegi et al., 2006; Sumer et al., 2011). Similarly in the US study, of calls made to paramedics relating to paediatric poisonings, 16% were due to poisoning from household cleaners (Vilke et al., 2011). Insecticides and pesticides, plants and fungi were the next most common agents and both accounted for approximately 7% of unintentional poisonings (Mintegi et al., 2006; Sumer et al., 2011). Carbon monoxide and alcohol were both listed as other sources of poisoning, resulting in 6% or less of poisonings in children (Lamireau et al., 2002; Mintegi et al., 2006; Sumer et al., 2011).
8.2.1 AgeIn a Turkish study, the majority of poisonings occurred in children aged 7 months to 4 years of age (Sumer et al., 2011), and similarly in a French study 80% of the children were less than 4 years of age (Lamireau et al., 2002). Likewise, findings from a Spanish study showed that 67% of poisonings involved children under the age of 4 (Mintegi et al., 2006). Schmertmann et al (2012) found that children aged 17-20 months were more likely to experience non-medicinal poisoning.
The type of products consumed also tended to vary with age. In a Spanish study, household products (such as bleach and other cleaning products) mostly involved children younger than the age of 6 (33.4%) (Mintegi et al., 2006) whereas alcohol poisoning most commonly occurred in children aged 7 to13 and older than 14 years (Mintegi et al., 2006). In a sample of children aged 0 to 4, children younger than 1 year of age were most likely to be poisoned by cosmetics (11.1%), and pesticides (6.2%). One year old children had the highest frequency of poisoning by cleaning agents (21.6%) followed by cosmetics (8.7%). Four year old children had the highest frequencies of poisoning from plants (11.3%) and paints and solvents (8.1%) when compared to children aged 0 to 3 (Vilke et al., 2011).
8.2.2 GenderAmongst children aged 0 to 18 years, 63% of non-medicinal poisonings involved males and 37% involved females (Sumer et al., 2011). A Spanish study found that there were an equal number of females that were patients however 52.8% of males were younger than 10 years of age, and 61.3% of females were older than 10. This was also found in a French study where males accounted for 57% of children under 4 that were poisoned, however there were a higher number of females in the 12-15 year category (65%) (Lamireau et al., 2002).
RACV Research Report 16/0136
8.2.3 Location Of the studies that mentioned the location of poisonings, the home was most commonly the place of poisoning, more specifically, the kitchen was listed as the main location (Lamireau et al., 2002; Vilke et al., 2011).
8.2.4 Conclusion Poisoning from non-medicinal products tends to occurs less frequently than pharmaceutical poisoning, however, it still accounts for a significant portion of ED presentations in children. Across the studies, domestic products were the highest frequency of non-medicinal substances which resulted in poisoning. The majority of poisonings tended to occur in children aged less than four years. Additionally, it was shown that younger children were more likely to consume domestic cleaning products and cosmetics, whereas older children were more likely to ingest plant substances, paints and solvents and alcohol. Males were shown to account for a larger percentage of the poisonings that occurred in younger children; however, the gender difference was marginal.
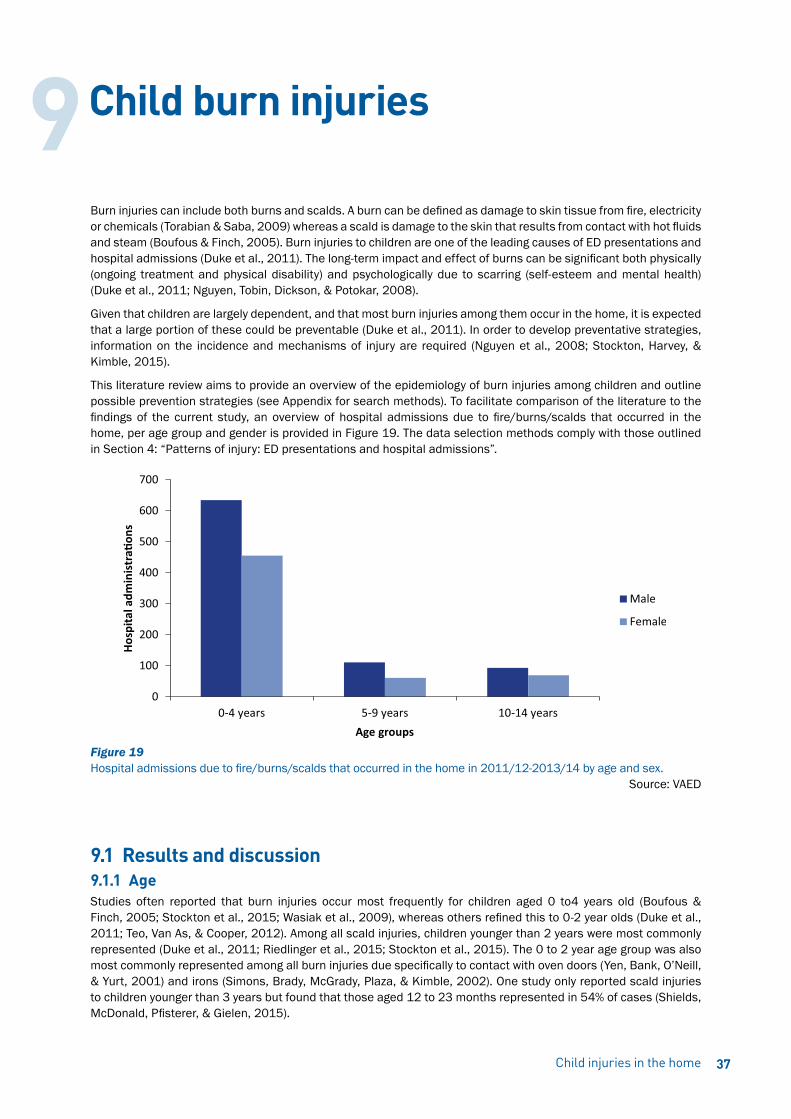
Child injuries in the home 37
Burn injuries can include both burns and scalds. A burn can be defined as damage to skin tissue from fire, electricity or chemicals (Torabian & Saba, 2009) whereas a scald is damage to the skin that results from contact with hot fluids and steam (Boufous & Finch, 2005). Burn injuries to children are one of the leading causes of ED presentations and hospital admissions (Duke et al., 2011). The long-term impact and effect of burns can be significant both physically (ongoing treatment and physical disability) and psychologically due to scarring (self-esteem and mental health) (Duke et al., 2011; Nguyen, Tobin, Dickson, & Potokar, 2008).
Given that children are largely dependent, and that most burn injuries among them occur in the home, it is expected that a large portion of these could be preventable (Duke et al., 2011). In order to develop preventative strategies, information on the incidence and mechanisms of injury are required (Nguyen et al., 2008; Stockton, Harvey, & Kimble, 2015).
This literature review aims to provide an overview of the epidemiology of burn injuries among children and outline possible prevention strategies (see Appendix for search methods). To facilitate comparison of the literature to the findings of the current study, an overview of hospital admissions due to fire/burns/scalds that occurred in the home, per age group and gender is provided in Figure 19. The data selection methods comply with those outlined in Section 4: “Patterns of injury: ED presentations and hospital admissions”.
Figure 19 Hospital admissions due to fire/burns/scalds that occurred in the home in 2011/12-2013/14 by age and sex.
Source: VAED
9.1 Results and discussion9.1.1 AgeStudies often reported that burn injuries occur most frequently for children aged 0 to4 years old (Boufous & Finch, 2005; Stockton et al., 2015; Wasiak et al., 2009), whereas others refined this to 0-2 year olds (Duke et al., 2011; Teo, Van As, & Cooper, 2012). Among all scald injuries, children younger than 2 years were most commonly represented (Duke et al., 2011; Riedlinger et al., 2015; Stockton et al., 2015). The 0 to 2 year age group was also most commonly represented among all burn injuries due specifically to contact with oven doors (Yen, Bank, O’Neill, & Yurt, 2001) and irons (Simons, Brady, McGrady, Plaza, & Kimble, 2002). One study only reported scald injuries to children younger than 3 years but found that those aged 12 to 23 months represented in 54% of cases (Shields, McDonald, Pfisterer, & Gielen, 2015).
Child burn injuries9
RACV Research Report 16/0138
9.1.2 GenderStudies reporting gender differences all found that males were overrepresented. In nine studies, males were treated more frequently than females (Cox, Martinez, Glick, Numanoglu, & Rode, 2015; Duke et al., 2011; Natterer, de Buys Roessingh, Reinberg, & Hohlfeld, 2009; Nguyen et al., 2008; Riedlinger et al., 2015; Shields et al., 2015; Stockton et al., 2015; Teo et al., 2012; Tse et al., 2006; Verey, Lyttle, Lawson, Greenwood, & Young, 2014). Males presented significantly more than females in four studies, from a ratio of 3:2 (male:female) (Kemp, Jones, Lawson, & Maguire, 2014) to 2:1 (Cerovac & Roberts, 2000; Serour, Gorenstein, & Boaz, 2008; Spinks, Wasiak, Cleland, Beben, & Macpherson, 2008).
9.1.3 LocationOf those that reported the location, the home was always the most common location of burns or scalds (Kemp et al., 2014; Natterer et al., 2009; Shields et al., 2015; Stockton et al., 2015; Teo et al., 2012). The most common location within the home for burns or scalds was the kitchen (Nguyen et al., 2008; Riedlinger et al., 2015; Stockton et al., 2015), whereas burns from irons mostly occurred in the living/dining area (Simons et al., 2002).
9.1.4 Time of dayThe peak time for burn injury to occur among children was in the evening around dinner time (Serour et al., 2008; Stockton et al., 2015; Teo et al., 2012).
9.1.5 Body region(s) injuredThe hand was the most commonly injured body region due to all burns sustained by children (Duke et al., 2011; Stockton et al., 2015; Teo et al., 2012), and more specifically was the most commonly injured body part due to contact burns (Kemp et al., 2014) and oven-related burns (Yen et al., 2001) (specifically the palmar surface). Contact burns generally involved the upper limbs (60%), lower limbs (14%) and less frequently the trunk (3%) (Nguyen et al., 2008).
The upper limbs were the most commonly reported injured body region in three studies (Duke et al., 2011; Natterer et al., 2009; Nguyen et al., 2008), however among bath-related burns the lower limbs were most injured (Cerovac & Roberts, 2000). There were two studies that found the trunk to be the most commonly injured body region, one that reported on all child burns (Tse et al., 2006) and the other that reported only on scalds (Boufous & Finch, 2005). More specifically, scald injuries occurred to the upper trunk more so (34%), then the lower limb (29%) and trunk (24%) (Nguyen et al., 2008).
Burns to multiple body regions were common (Cerovac & Roberts, 2000) and mostly involved the head and neck (Teo et al., 2012). Children with burns to multiple body regions were also more likely to be admitted for further treatment (Cerovac & Roberts, 2000; Stockton et al., 2015).
The variation in the most commonly injured body regions could be due to studies collecting data from different sources that would represent different severities of injury (e.g. all hospital treated injuries including ED presentations compared with admitted burn cases in a specialist burn unit). It is possible that certain body regions, if burned, would result in hospital admission ahead of others. It was consistently reported, however, that the upper limbs and the trunk were commonly injured overall and due to scalds. Contact burns commonly affected the hands, and bath burns affected mostly the lower limbs.
9.1.6 Detailed causes of injuryThe cause of burn injury very much depended on the age of the child (Natterer et al., 2009). Scalds and contact burns were the most common to affect children across all studies. Scalds were the most common type of burn injury in most studies (Cox et al., 2015; Kemp et al., 2014; Spinks et al., 2008; Stockton et al., 2015; Teo et al., 2012; Tse et al., 2006; Verey et al., 2014), with the exception of one study finding that contact burns were marginally more common than scalds (Natterer et al., 2009).
Hot liquid was the main cause of scalds among children (Teo et al., 2012). Two studies found that, of scalds, hot beverages were responsible for the most scalds (Riedlinger et al., 2015; Stockton et al., 2015; Tse et al., 2006), followed by food and hot water. Another two studies, however, found that hot water caused the most scalds (Nguyen et al., 2008; Serour et al., 2008), followed by hot beverages. The most common mechanism by which a scald occurred was by pulling/pushing/kicking hot liquid on oneself (Kemp et al., 2014; Nguyen et al., 2008; Shields et al., 2015). The activity at the time of the scald was reported in one study, with the injured child near the person cooking for almost half of all scalds (Riedlinger et al., 2015; Shields et al., 2015).
Contact burns were common and four studies found that cookers were the leading cause of child contact burns (Kemp et al., 2014; Serour et al., 2008; Stockton et al., 2015; Teo et al., 2012), however another found the hot water
Child injuries in the home 39
pipe to cause the majority of contact burns (Nguyen et al., 2008). Contact burns from hair straighteners, irons and the oven were also common (Kemp et al., 2014; Nguyen et al., 2008; Serour et al., 2008; Stockton et al., 2015; Teo et al., 2012).
Of oven burns, half of these occurred due to contact with the outside of the oven door and the other half the inside (Yen et al., 2001). Iron-related burns were mostly caused by pulling the cord (resulting in the iron falling onto the individual), followed by touching it directly (Simons et al., 2002). Interestingly, more than half of the burns occurred when the iron was switched off (Simons et al., 2002), suggesting caution should be exhibited until the iron is completely cool. Bath-related scalds occurred mostly when the child either climbed or slipped into the bathtub, or opened the tap (Cerovac & Roberts, 2000).
9.1.7 SeverityIn four studies, the vast majority of patients had total body surface area (TBSA) burns of less than 10% (Natterer et al., 2009; Nguyen et al., 2008; Stockton et al., 2015; Verey et al., 2014). Approximately one in ten patients sustained burns to more than 10% TBSA in two studies (Duke et al., 2011; Tse et al., 2006), another reported 15% had more than 10% of the TBSA burned (Riedlinger et al., 2015) and 43% of patients in another (Cox et al., 2015). Again, this could be due to the different sources of information (e.g. ED presentation versus hospital admission to specialised burn unit).
9.1.8 Injury PreventionMany studies stress the importance of education to caregivers on burn hazards around the home, as well as first-aid information in order to minimise the severity of burn injuries to children (Forjuoh, 2006; Serour et al., 2008; Turner, Spinks, McClure, & Nixon, 2004). Increased supervision could help reduce all burns (Forjuoh, 2006), in particular contact burns associated with irons and ovens (Simons et al., 2002; Yen et al., 2001). Restricting access to rooms where burns are likely (such as the kitchen or where ironing is done) could reduce the frequency of burn injuries (Simons et al., 2002; Yen et al., 2001). Using safeguards, for example on cookers, could help prevent burn injuries from occurring (Turner et al., 2004).
A study used ED narratives (detailed information on how scald injuries occurred) to provide specific advice to prevent burns from occurring (Shields et al., 2015), and are summarised below:
• Place hot items in the centre of the table/bench
• Avoid using tablecloths to prevent the possibility of a child pulling hot items onto self
• Keep children away from hot or hazardous surfaces
• Keep all pot handles faced away from the front of the stove
• Create ‘child-free’ zones
• Supervise child at all times when around hot environments (e.g. bathing)
• Unplug all appliances when finished using them
• Do not drink hot beverages when holding a child
Bath-related burns could be avoided by switching taps to mixers, reducing the maximum water temperature feeding the house, and education on how best to measure water temperature (Cerovac & Roberts, 2000; Tse et al., 2006).
Iron-specific injury prevention strategies were using a cover to place over the hot surface of an iron when not in use, design irons with a retractable or coiled cord to prevent children pulling them down on themselves and not to let an iron cool down on the floor (Simons et al., 2002).
9.2 ConclusionBurn injuries to children most commonly occurred in the home, in particular the kitchen. The youngest age groups were most at risk, in particular those younger than 4 years of age. The body region affected differed depending on the cause and type of injury (e.g. scald or contact burn). Among scalds, the upper limbs and trunk were most commonly injured, and mostly due to hot beverages and hot water being pulled down on themselves. Contact burns most commonly affected the hands (on the palmar surface) and were commonly due to household appliances such as cookers, ovens, hair straighteners and irons.
Burn prevention strategies involve increasing education to caregivers regarding supervision of the child, awareness of how burns around the home may occur and potential hazards, and first-aid treatment to minimise the severity of the burn.

RACV Research Report 16/0140
Playing is important for children to increase their physical activity, and is also beneficial to their mental and physical development (Norton, Nixon, & Sibert, 2004). Unfortunately, play equipment-related injury is a leading source of injuries to children (Consumer Product Safety Commission, 2001). Injuries can be life-changing should a serious fracture or head injury occur and therefore it is important to prevent these so that children do not have to endure lifelong consequences from playing on equipment.
This literature review aims to provide an overview of the epidemiology of play equipment-related injuries among children, as well as an outline of possible injury prevention strategies (see Appendix for search methods).
To facilitate a comparison of the literature to the findings of the current study, an overview of Victorian hospital admissions due to falls from playground equipment in the home, per age group and gender, is provided in Figure 20. The general data selection methods comply with those outlined in the section “ Patterns of injury: ED presentations and hospital admissions”. Of the falls from home playground equipment presented in Figure 20, 68% involved a trampoline, 8% a swing, 7% a slide, 6% playground climbing apparatus, 3% a tree house, 3% other specified playground equipment, 3% unspecified playground equipment, 1% a flying fox, and 1% a seesaw.
Figure 20
Hospital admissions due to falls from playground equipment in the home, in Victoria from 2011/12 to 2013/14 by age and sex.
Source: VAED
10.1 Results and discussion10.1.1 AgeThe most commonly injured age group was 5-9 years in five play equipment-related injury studies (Consumer Product Safety Commission, 2001; Laforest, Robitaille, Dorval, Lesage, & Pless, 2000; Laforest, Robitaille, Lesage, & Dorval, 2001; Petridou, Sibert, Dedoukou, Skalkidis, & Trichopoulos, 2002; Phelan, Khoury, Kalkwarf, & Lanphear, 2001), and in two trampoline-related injury studies (Ashby, Eager, D’Elia, & Day, 2015; Ashby, Pointer, Eager, & Day, 2015). The mean injured age reported varied from 6.5 years (Loder, 2008) to 7 years (Macarthur, Hu, Wesson, & Parkin, 2000; Mahadev, Soon, & Lam, 2004) to 8.1 years (Ashby, Pointer, et al., 2015).
Age bracket reporting was not standardised and other studies found that children aged 6-10 years (Nysted & Drogset, 2006) or 5-12 years (Vollman, Witsaman, Comstock, & Smith, 2009) were most commonly injured.
Play equipment-related injury10

Child injuries in the home 41
10.1.2 GenderIn most studies, the gender of the injured child was slightly skewed towards males (from 51% to 59.6%) (Ashby, Eager, et al., 2015; Ashby, Pointer, et al., 2015; Laforest et al., 2000; Laforest et al., 2001; Loder, 2008; Macarthur et al., 2000; McCain, Monroe, & King, 2007; Nysted & Drogset, 2006; Petridou et al., 2002; Vollman et al., 2009). One study reported that the frequency of injury among males and females was equal (Phelan et al., 2001) and another that the male to female ratio was 2:1 (Mahadev et al., 2004). Only one study reported that females were overrepresented (55%) (Consumer Product Safety Commission, 2001). Overall, the majority of the findings from the literature indicate that slightly more male children are injured from play equipment related accidents.
10.1.3 LocationOf those studies that did not focus solely on home play equipment-related injuries, four studies found that approximately a quarter of injuries occurred at home (range 23% to 25.6%) (Laforest et al., 2000; Loder, 2008; McCain et al., 2007; Phelan et al., 2001) whereas another reported that only 6% occurred at home (Macarthur et al., 2000). None of the trampoline studies reported the location.
10.1.4 Body region(s) injuredThe extremities were the most commonly injury body regions (Phelan et al., 2001). The upper extremity was most commonly injured body region in most studies. The upper extremity was most commonly injured, followed by the head/neck/face and the lower extremity (Consumer Product Safety Commission, 2001; Keays & Skinner, 2012; Loder, 2008; Macarthur et al., 2000; Mahadev et al., 2004; Vollman et al., 2009). One play equipment-related study found that lower extremities were injured more frequently than both the upper extremity and the head/neck/face (Petridou et al., 2002). It is important to note that in this study, the majority of home based play equipment accidents were a result of slides, there was only one case of a climbing apparatus injury and no incidents of swings which may help to explain why the majority of injuries occurred to lower extremities.
Of home jungle gym, slide and swing injuries, the arms were injured in more than half of all cases, followed by the head and leg according to one study (Keays & Skinner, 2012). The lower extremity was injured most frequently in one study (Nysted & Drogset, 2006), whereas the upper extremity was most frequent in the other (Karen Ashby, Sophie Pointer, et al., 2015).
10.1.5 Nature of injuryFractures were the most common type of injury in most studies (Ashby, Eager, et al., 2015; Consumer Product Safety Commission, 2001; Loder, 2008; Macarthur et al., 2000; Mahadev et al., 2004; Nysted & Drogset, 2006; Phelan et al., 2001). Dislocations, sprains and strains, contusions or abrasions, and lacerations were also common injury types. One study found dislocations, sprains and strains to be the most common type of injury, followed by fractures (Petridou et al., 2002).
10.1.6 Equipment and injury causes10.1.6.1 General play equipmentThe type of play equipment reported to be associated with the most frequent injury cases varied between studies. Two studies found that injuries related to monkey bars or climbing apparatuses were most common, followed by injuries resulting from swings and slides (Loder, 2008; Vollman et al., 2009). This was similar to two other studies that reported multi-purpose equipment to be associated with the most injuries, followed by climbing apparatuses, swings and slides (Laforest et al., 2000; Laforest et al., 2001). The swing was most common in two other studies, followed by the slide and climbing apparatus (Consumer Product Safety Commission, 2001; Keays & Skinner, 2012). Slides were the most common piece of play equipment associated with injury in one study (Petridou et al., 2002) and another found injuries associated with climbing apparatuses to be most common followed by the seesaw, slides and swings (Mahadev et al., 2004). Although these studies vary in terms of the most common type of equipment which results in injuries, it is clear that climbing equipment, slides and swings are all frequently associated with injuries.
Of studies that reported mechanisms, falls were most common (Keays & Skinner, 2012; Petridou et al., 2002; Phelan et al., 2001; Vollman et al., 2009). Falls against equipment or impact/collision injuries were also common (Keays & Skinner, 2012; Vollman et al., 2009), as were injuries due to overexertion (Petridou et al., 2002).
One study surveyed the caretakers of injured children regarding the age of the play equipment that was associated with the injury and it was found that some play equipment was as old as 20 years (Consumer Product Safety Commission, 2001). This is an important consideration when interpreting the findings from this literature as it likely influences the type and severity of the injuries obtained.

RACV Research Report 16/0142
10.1.6.2 TrampolineOne study found that the vast majority of hospital-admitted injuries associated with trampolines were due to falls (98.1%) (Ashby, Pointer, et al., 2015). Of those that reported on ED presentations, awkward landings and falls on the trampoline, as well as falls of the trampoline were reported as two common reasons for the injury. Nysted and Drogset (2006) found that more than half of the injuries were due to awkward landings (53%) and falls off the trampoline were also common (22%). The other study found that 44.9% of injuries were due to falling off the trampoline, and 19.4% due to a fall on the trampoline (Ashby, Eager, et al., 2015).
10.1.7 SeverityAmong general play injuries, the proportion of ED presentations that were subsequently admitted to hospital was between 3-5.6% (Consumer Product Safety Commission, 2001; Loder, 2008; Petridou et al., 2002; Vollman et al., 2009) and up to 9% (McCain et al., 2007). Around thirteen percent of trampoline-related injuries that presented to EDs required subsequent admission to hospital for further treatment (Ashby, Eager, et al., 2015; Nysted & Drogset, 2006). These findings highlight the seriousness of play equipment related injuries whereby a significant percentage of children need to be admitted to hospital, treatment in ED is not sufficient for the injuries they have obtained.
10.1.8 Injury PreventionA child’s physical and mental development is greatly enhanced by play, however this must be balanced with the child having minimal risk for disabling injury (Norton et al., 2004). According to Norton et al. (2004), “head injury or serious fractures with lifelong consequences should not be considered part of growing up”.
Key elements of injury prevention among play equipment-associated injuries include supervision of the child, and impact/shock-absorbing surfacing (Norton et al., 2004; Olsen, Hudson, & Thompson, 2008). Equipment and surfacing should be regularly checked and maintained (Consumer Product Safety Commission, 2001; Olsen et al., 2008). The design of the play equipment should be age appropriate and children should be encouraged to play on equipment that best suits their size and ability (Olsen et al., 2008). Potential fall heights should also be of consideration and not unnecessarily high (Norton et al., 2004).
The US Consumer Product Safety Commission has provided the following recommendations to prevent injuries associated with play equipment in the home (Consumer Product Safety Commission, 2001):
• Install and maintain shock absorbing surfaces (e.g. wood chips, mulch, shredded rubber, sand, pea gravel or rubber mats)
• Do not attach ropes (or similar) to equipment
• Check for protruding hardware (e.g. bolts) and sharp points, and remove or minimise the risk where possible
• Check for spaces that could trap children and minimise this risk
• Ensure equipment has guardrails
• Remove tripping hazards (e.g. tree stumps, rocks)
• Carefully supervise children when they are playing
Ensuring that the environment in which the child is playing is well set up and maintained, and providing them with careful supervision should minimise the incidence and severity of injuries associated with play equipment.
10.2 ConclusionThe studies summarised in this brief literature review reported that play equipment-related injuries to children were common, in particular to children in the 5-9 years age group. Injuries to males were more common however there was not a large discrepancy between genders. Around a quarter of the reported play-equipment injuries occurred in the home. Most studies of play equipment-related injuries reported that the upper limbs were most frequently injured, in particular when playing on a climbing apparatus, slide or swing. Fractures were the most common type of injury however dislocations, sprains, strains, contusions and lacerations were also common.
The most common piece of play equipment that resulted in injury varied between studies, however climbing apparatuses, swings and slides were all commonly associated with injury. Falls from play equipment was the most common cause of injury, and it was found play equipment was as old as 20 years in some instances. Among trampoline-related injuries, falls from or on top of the trampoline were the most common causes of injury.
In order to prevent injuries associated with play equipment, it is suggested to install shock-absorbing surfacing should a fall occur, maintain equipment to ensure it is in its best condition and carefully supervise children when they are playing.

Child injuries in the home 43
The aim of this report was to provide an overview of child injuries that occur in the home. The analysis was based on ED presentations and hospital admissions records, and was therefore limited to hospital treated injury. Death data was also analysed and presented in a chapter on child death due to external cause, limited to deaths that occurred in the home.
From 2004/05 to 2013/14, the overall rate of child home injury ED presentations increased, whereas the rate of child home injury hospital admissions decreased. These trends, however, have to be interpreted with caution, as there was a significant change in hospital admission policy during this time period. Prior to July 2012, patients who were treated in the ED for four hours or longer, were eligible for admission, even if their hospital stay was limited to the ED only. After July 2012 this changed and patients were no longer admitted if their stay was in the ED only. The ED presentations trends presented in this report include presentations resulting in hospital admission and these trends are unlikely to be affected by the policy change. This was not the case for the admissions: a decrease in hospital admissions as an artefact of policy change, regardless of underlying trends in injury epidemiology, was expected.
To limit the impact of the policy change on the results presented in this report, cases where admission and separation took place on the same day were excluded. By excluding these short admissions throughout the 10 year period, the impact of the policy change was reduced, as this policy change mostly affects short admissions. The impact was not entirely eliminated, and furthermore, the results of the trend analysis are limited to more severe injuries because brief admissions are excluded. In conclusion, the findings in this report show an increase in ED presentations for child home injury, and a reduction the rate of child home injury hospital admissions for 2004/05 to 2013/14 in Victoria. The hospital admissions trends, however, should be interpreted with caution: these results require further confirmation using linked datasets, which is currently outside the scope of the Victorian Injury Surveillance Unit resources.
Hospital treated injuries that occurred in the home were more common among male than female children. The rates were highest among 1 to 2 year olds and decreased with increasing age. Male children and young children not only had the highest rates of child home injury but they also had more hospital bed-days and greater direct cost of hospital stay for injury that occurred in the home.
The relatively high home injury rates among very young children could be due to the high injury risk in this age group, or greater exposure due to more time spent in the home compared with Kindergarten and school-aged children. This could be further investigated by comparing overall injury rates in the various age groups and establishing home injuries as a proportion of all injuries. The number of injuries (ED-treated as well as hospital admissions) were highest in January and December. This could reflect more time spent outdoors (in the backyard) in the warmer months or children being at home because of school holidays. Other primary school holiday periods (April, July and September) did not appear as periods with relatively high numbers of child home injuries. The effect of seasonality could be further explored by comparing injury types in the various months as a relatively high number of falls from play equipment in January and December would suggest more outdoor play. Similarly, the relatively high number of child home injuries that occurred on Sundays could be the result of greater exposure (for Kindergarten and school aged children). Children are also likely to engage in organised sporting activities on the weekend, which could result in sporting injuries, but these are not captured in this report which is limited to injuries that occurred in the home.
Child home injuries that a resulted in hospital admission were often (45%) caused by a fall, and the most commonly occurring falls were on the same level, i.e. slipping or tripping; followed by fall from playground equipment; and falls involving a bed. These injuries could be reduced by ensuring that (backyard) play equipment is safe, installing shock absorbing surfaces, avoiding bunk beds for young children, and careful supervision.
Poisoning caused 6% of the hospital admissions for child home injury. This was investigated in more detail because of the potential severity as well as the implications for prevention. Poisoning was most commonly (77%) due to medications and biological substances. Poisoning in children in the home is potentially preventable by means of safe storage of medications, safe practices such as not taking medication in the presence of children; not leaving medication within reach, even temporarily; and close supervision of children.
Discussion and conclusion11

RACV Research Report 16/01
Fire, burns and scalds were not a common cause of injury (4% of admissions and 3% of ED presentations), but burns had a relatively high contribution to the overall hospital days (17%) for child home injury, reflecting high severity. Furthermore, fires/burns/scalds were the most frequent cause of child death that occurred in the home. This was the reason for analysing this cause of injury in more detail. Distinction can be made between burns, which are caused by dry heat, and scalds, which are caused by liquid or steam. The most frequent cause of hospital admissions for fires/burns/scalds was contact with hot drinks, hot food and other hot fluid (i.e., scalds). This is not, however, likely to explain the high number of child deaths in the home due to fires/burns/scalds in the 2006/7 to 2011/12 period. These are likely to be affected by the Black Saturday bushfires in Victoria in 2009. Bushfires could also explain the overrepresentation of children living in inner regional areas in the child home injury deaths in this time period, in Victoria.
The recommendations to prevent common scalds and burns to children in the home include keeping hot items out of reach of children, keeping children out of the kitchen during cooking and careful supervision during bath-time. Preventing child injury and child death due to exposure to fire and smoke however are related to general fire prevention practices, bushfire management in Victoria, and fire safety policies which are outside the scope of this report.
The most common injury types were open wounds and fractures. The injury types presented in this report reflect the data source: hospitals. The decision to present to the ED in favour of alternatives (no medical help, GP visit) could be affected by sociodemographic factors. To capture all child home injuries would require collecting information on all injuries including those for which medical attention was not sought, for example through household surveys and analysis of GP service use records through Medicare, for example.
In this report, potential high risk groups for child home injury were evaluated. Children born in Europe, Africa or Asia had lower hospital treated home injury rates than children born in Oceania (which includes Australia or New Zealand), and were therefore not be considered high risk groups. Those living in relatively disadvantages areas had higher home injury rates compared with children living in relatively advantaged areas, and can therefore be considered a high risk group. This could be confirmed with further studies including other health service data sources (such as GP visits), for injuries that do not require hospital admission. And finally, children living outside the major cities of Victoria had higher home injury rates than those living in major cities. The relatively high child home injury rates in inner and outer regional areas could be related to several urban/regional differences, such as access to GP services (which may be greater in major cities, associated with lower uptake of hospital services) and time spent playing outdoors around the home. Children in major cities may spend more time in parks and playgrounds away from home, whereas children in regional areas may spend more time playing outdoors around the home.
The overview of injury trends, causes, patterns, burden and risk factors presented in this report is the first step towards addressing the problem of child injury in the home. This report can be used as the basis for developing injury prevention policy, recommendations and interventions, which can be evaluated with further research.
44

Child injuries in the home 45
Ashby, K., Eager, D., D’Elia, A., & Day, L. (2015). Influence of voluntary standards and design modifications on trampoline injury in Victoria, Australia. Inj Prev, 21(5), 314-319. doi: 10.1136/injuryprev-2015-041598
Ashby, K., Pointer, S., Eager, D., & Day, L. (2015). Australian trampoline injury patterns and trends. Australian and New Zealand Journal of Public Health, n/a-n/a. doi: 10.1111/1753-6405.12404
Australian Bureau of Statistics. (2011). Socio-Economic Indexes for Areas (SEIFA), Australia, 2011. 2033.0.55.001 - Census of Population and Housing. Retrieved 10 November 2014, from http://www.abs.gov.au/ausstats/[email protected]/Lookup/2033.0.55.001main+features100042011
Boufous, S., & Finch, C. (2005). Epidemiology of scalds in vulnerable groups in New South Wales, Australia, 1998/1999 to 2002/2003. J Burn Care Rehabil, 26(4), 320-326.
Centers for Disease Control and Prevention. (2006). Nonfatal, unintentional medication exposures among young children--United States, 2001-2003. MMWR Morb Mortal Wkly Rep, 55(1), 1-5.
Cerovac, S., & Roberts, A. H. (2000). Burns sustained by hot bath and shower water. Burns, 26(3), 251-259.
Chien, C., Marriott, J. L., Ashby, K., & Ozanne-Smith, J. (2003). Unintentional ingestion of over the counter medications in children less than 5 years old. Journal of Paediatrics and Child Health, 39(4), 264-269. doi: 10.1046/j.1440-1754.2003.00148.x
Consumer Product Safety Commission. (2001). Home playground equipment-related deaths and injuries. Retrieved October 5, 2015, from http://cpsc.gov/PageFiles/108601/playgrnd.pdf
Consumer Product Safety Commission. (2001). Special study: Injuries and deaths associated with children’s playground equipment. Retrieved October 5, 2015, from http://cpsc.gov/PageFiles/108601/playgrnd.pdf
Cox, S., Martinez, R., Glick, A., Numanoglu, A., & Rode, H. (2015). A review of community management of paediatric burns. Burns. doi:10.1016/j.burns.2015.05.024
Duke, J., Wood, F., Semmens, J., Edgar, D. W., Spilsbury, K., Hendrie, D., & Rea, S. (2011). A study of burn hospitalizations for children younger than 5 years of age: 1983-2008. Pediatrics, 127(4), e971-977. doi: 10.1542/peds.2010-3136
Forjuoh, S. N. (2006). Burns in low- and middle-income countries: a review of available literature on descriptive epidemiology, risk factors, treatment, and prevention. Burns, 32(5), 529-537. doi: 10.1016/j.burns.2006.04.002
Freeman, J., Liossis, P., Schonfeld, C., Sheehan, M., Siskind, V., & Watson, B. (2006). The self-reported impact of legal and non-legal sanctions on a group of recidivist drink drivers. 1. Retrieved Criminal Law & Adjudication [4230], 9, from http://ovidsp.ovid.com/ovidweb.cgi?T=JS&PAGE=reference&D=psyc5&NEWS=N&AN=2006-01481-005
Howard, A. W., MacArthur, C., Willan, A., Rothman, L., Moses-McKeag, A., & MacPherson, A. K. (2005). The effect of safer play equipment on playground injury rates among school children. Cmaj, 172(11), 1443-1446. doi: 10.1503/cmaj.1041096
Keays, G., & Skinner, R. (2012). Playground equipment injuries at home versus those in public settings: differences in severity. Injury Prevention. doi:10.1136/injuryprev-2011-040240
Kemp, A. M., Jones, S., Lawson, Z., & Maguire, S. A. (2014). Patterns of burns and scalds in children. Archives of Disease in Childhood. doi: 10.1136/archdischild-2013-304991
Laforest, S., Robitaille, Y., Dorval, D., Lesage, D., & Pless, B. (2000). Severity of fall injuries on sand or grass in playgrounds. Journal of Epidemiology and Community Health, 54(6), 475-477. doi: 10.1136/jech.54.6.475
Laforest, S., Robitaille, Y., Lesage, D., & Dorval, D. (2001). Surface characteristics, equipment height, and the occurrence and severity of playground injuries. Injury Prevention, 7(1), 35-40. doi: 10.1136/ip.7.1.35
Lamireau, T., Llanas, B., Kennedy, A., Fayon, M., Penouil, F., Favarell-Garrigues, J. C., & Demarquez, J. L. (2002). Epidemiology of poisoning in children: a 7-year survey in a paediatric emergency care unit. Eur J Emerg Med, 9(1), 9-14.
References12
RACV Research Report 16/0146
Lin, Y. R., Liu, T. H., Liu, T. A., Chang, Y. J., Chou, C. C., & Wu, H. P. (2011). Pharmaceutical poisoning exposure and outcome analysis in children admitted to the pediatric emergency department. Pediatr Neonatol, 52(1), 11-17. doi: 10.1016/j.pedneo.2010.12.003
Loder, R. T. (2008). The demographics of playground equipment injuries in children. J Pediatr Surg, 43(4), 691-699. doi: 10.1016/j.jpedsurg.2007.12.061
Macarthur, C., Hu, X., Wesson, D. E., & Parkin, P. C. (2000). Risk factors for severe injuries associated with falls from playground equipment. Accid Anal Prev, 32(3), 377-382.
Mahadev, A., Soon, M. Y. H., & Lam, K. S. (2004). Monkey bars are for monkeys: A study on playground equipment related extremity fractures in singapore. Singapore Medical Journal, 45(1), 9-13.
McCain, J. E., Monroe, K. W., & King, W. D. (2007). Are injuries that occur on home playrounds more serious than those that occur on public playgrounds? Journal of Investigative Medicine, 55(1), S296.
Mintegi, S., Fernandez, A., Alustiza, J., Canduela, V., Mongil, I., Caubet, I., . . . Vazquez, P. (2006). Emergency visits for childhood poisoning: a 2-year prospective multicenter survey in Spain. Pediatr Emerg Care, 22(5), 334-338. doi: 10.1097/01.pec.0000215651.50008.1b
Natterer, J., de Buys Roessingh, A., Reinberg, O., & Hohlfeld, J. (2009). Targeting burn prevention in the paediatric population : a prospective study of children’s burns in the Lausanne area. Swiss Med Wkly, 139(37-38), 535-539. doi: smw-12605
Nguyen, D. Q. A., Tobin, S., Dickson, W. A., & Potokar, T. S. (2008). Infants under 1 year of age have a significant risk of burn injury. Burns, 34(6), 863-867. doi: http://dx.doi.org/10.1016/j.burns.2007.11.011
Norton, C., Nixon, J., & Sibert, J. R. (2004). Playground injuries to children. Archives of Disease in Childhood, 89(2), 103-108. doi: 10.1136/adc.2002.013045
Nysted, M., & Drogset, J. O. (2006). Trampoline injuries. Br J Sports Med, 40(12), 984-987. doi: 10.1136/bjsm.2006.029009
Olsen, H. M., Hudson, S. D., & Thompson, D. (2008). Developing a playground injury prevention plan. J Sch Nurs, 24(3), 131-137. doi: 10.1622/1059-8405(2008)024[0131:dapipp]2.0.co;2
Petridou, E., Sibert, J., Dedoukou, X., Skalkidis, I., & Trichopoulos, D. (2002). Injuries in public and private playgrounds: the relative contribution of structural, equipment and human factors. Acta Pædiatr, 91, 691-697.
Phelan, K. J., Khoury, J., Kalkwarf, H. J., & Lanphear, B. P. (2001). Trends and patterns of playground injuries in United States children and adolescents. Ambul Pediatr, 1(4), 227-233.
Riedlinger, D. I., Jennings, P. A., Edgar, D. W., Harvey, J. G., Cleland, M. H. J., Wood, F. M., & Cameron, P. A. (2015). Scald burns in children aged 14 and younger in Australia and New Zealand—An analysis based on the Burn Registry of Australia and New Zealand (BRANZ). Burns, 41(3), 462-468. doi: http://dx.doi.org/10.1016/j.burns.2014.07.027
Safe Kids Worldwide. (2015). Medicine safety for children: an in-depth look at calls to poison centers. Retrieved 29 September, 2015, from http://www.safekids.org/sites/default/files/research_reports/medicine_safety_study_2015_v7-lr.pdf
Schillie, S. F., Shehab, N., Thomas, K. E., & Budnitz, D. S. (2009). Medication overdoses leading to emergency department visits among children. Am J Prev Med, 37(3), 181-187. doi: 10.1016/j.amepre.2009.05.018
Schmertmann, M., Williamson, A., & Black, D. (2014). Unintentional poisoning in young children: does developmental stage predict the type of substance accessed and ingested? Child: Care, Health and Development, 40(1), 50-59. doi: 10.1111/j.1365-2214.2012.01424.x
Schmertmann, M., Williamson, A., Black, D., & Wilson, L. (2013). Risk factors for unintentional poisoning in children aged 1-3 years in NSW Australia: a case-control study. BMC Pediatr, 13, 88. doi: 10.1186/1471-2431-13-88
Serour, F., Gorenstein, A., & Boaz, M. (2008). Characteristics of thermal burns in children admitted to an Israeli pediatric surgical ward. Isr Med Assoc J, 10(4), 282-286.
Shields, W. C., McDonald, E. M., Pfisterer, K., & Gielen, A. C. (2015). Scald burns in children under 3 years: an analysis of NEISS narratives to inform a scald burn prevention program. Injury Prevention, 21(5), 296-300. doi: 10.1136/injuryprev-2015-041559
Simons, M., Brady, D., McGrady, M., Plaza, A., & Kimble, R. (2002). Hot iron burns in children. Burns, 28(6), 587-590.
Spinks, A., Wasiak, J., Cleland, H., Beben, N., & Macpherson, A. K. (2008). Ten-year epidemiological study of pediatric
Child injuries in the home 47
burns in Canada. J Burn Care Res, 29(3), 482-488. doi: 10.1097/BCR.0b013e3181776ed9
Stockton, K. A., Harvey, J., & Kimble, R. M. (2015). A prospective observational study investigating all children presenting to a specialty paediatric burns centre. Burns, 41(3), 476-483. doi: http://dx.doi.org/10.1016/j.burns.2014.09.018
Sumer, V., Guler, E., Karanfil, R., Dalkiran, T., Gursoy, H., Garipardic, M., & Davutoglu, M. (2011). Retrospective evaluation of poisoning cases who presented to the pediatric emergency unit. Turk Arch Ped, 46, 226-232.
Teo, A. I., Van As, A. B., & Cooper, J. (2012). A comparison of the epidemiology of paediatric burns in Scotland and South Africa. Burns, 38(6), 802-806. doi: 10.1016/j.burns.2012.04.010
Torabian, S., & Saba, M. S. (2009). Epidemiology of paediatric burn injuries in Hamadan, Iran. Burns, 35(8), 1147-1151. doi: 10.1016/j.burns.2009.06.194
Tse, T., Poon, C. H., Tse, K. H., Tsui, T. K., Ayyappan, T., & Burd, A. (2006). Paediatric burn prevention: an epidemiological approach. Burns, 32(2), 229-234. doi: 10.1016/j.burns.2005.08.025
Turner, C., Spinks, A., McClure, R., & Nixon, J. (2004). Community-based interventions for the prevention of burns and scalds in children. Cochrane Database Syst Rev(3), Cd004335. doi: 10.1002/14651858.CD004335.pub2
Verey, F., Lyttle, M. D., Lawson, Z., Greenwood, R., & Young, A. (2014). When do children get burnt? Burns, 40(7), 1322-1328. doi: 10.1016/j.burns.2014.01.010
Vilke, G. M., Douglas, D. J., Shipp, H., Stepanski, B., Smith, A., Ray, L. U., & Castillo, E. M. (2011). Pediatric poisonings in children younger than five years responded to by paramedics. J Emerg Med, 41(3), 265-269. doi: 10.1016/j.jemermed.2010.10.018
Vollman, D., Witsaman, R., Comstock, R. D., & Smith, G. A. (2009). Epidemiology of playground equipment-related injuries to children in the United States, 1996–2005. Clinical Pediatrics, 48(1), 66-71.
Wasiak, J., Spinks, A., Ashby, K., Clapperton, A., Cleland, H., & Gabbe, B. (2009). The epidemiology of burn injuries in an Australian setting, 2000-2006. Burns, 35(8), 1124-1132. doi: 10.1016/j.burns.2009.04.016
Yen, K. L., Bank, D. E., O’Neill, A. M., & Yurt, R. W. (2001). Household oven doors: a burn hazard in children. Arch Pediatr Adolesc Med, 155(1), 84-86.

RACV Research Report 16/0148
Literature SynopsisChild burns, child unintentional poisoning, and child injury related to home play equipment were selected as priority areas and the focus of the literature reviews. These were among the top 5 most commonly occurring causes of injury. In addition, fires/burns/scalds were the most frequent cause of child death that occurred in the home.
Unintentional poisoning among children Peer-reviewed, descriptive epidemiological research articles on accidental poisonings due to medications of children were searched for using the PubMed and ScienceDirect databases. Articles were also manually sourced from reference lists of retrieved literature. Search terms included the following keywords:
• accidental + overdose + child/p(a)ediatric
• accidental + poisoning + child/p(a)ediatric
• unintentional + overdose + child/p(a)ediatric
• unintentional + poisoning + child/p(a)ediatric
• unintentional + ingestion + child/p(a)ediatric
• unintentional + ingestion + medication + child/p(a)ediatric
• unintentional + overdose + medication + child/p(a)ediatric
• pharmaceutical + overdose + child/p(a)ediatric
Articles were excluded if they were published earlier than the year 2000, as were literature reviews. This literature synopsis does not include Hazards and Ebulletins by the Victorian Injury Surveillance Unit, as it was considered that the VAED and VEMD datasets are already addressed in the data analysis sections of this report, and adding these publications would duplicate rather than expand on the findings.
Six articles were identified that provided epidemiological or incidence data on unintentional poisonings among children. Three of the studies used data obtained from EDs (Lamireau et al., 2002; Mintegi et al., 2006; Sumer et al., 2011). One study analysed medical records (Schmertmann et al., 2012), one study used prehospital records (Vilke et al., 2011) another study used a combination of ED cases and community controls (Schmertmann et al., 2013).
Ten articles were identified that provided epidemiological or incidence data on unintentional medication poisonings among children. Half of the studies used data obtained from EDs (Freeman et al., 2006; Lamireau et al., 2002; Lin et al., 2011; Mintegi et al., 2006; Schillie et al., 2009), and one used a combination of ED data and poisons line information (Chien et al., 2003). Three studies analysed medical records (Schmertmann et al., 2012; Sumer et al., 2011; Vilke et al., 2011) and another used a combination of ED cases and community controls (Schmertmann et al., 2013).
Child burn injuriesPeer-reviewed, descriptive epidemiological research articles on burn injuries to children were searched for using the PubMed and ScienceDirect databases. Articles were also manually sourced from reference lists of retrieved literature. Search terms included the following keywords:
• child + burn
• child + scald
• burn + epidemiology
• p(a)ediatric + burn
• p(a)ediatric + scald
Articles were excluded if they were published earlier than the year 2000, and if they reported on the epidemiology of
Appendix: Literature search methods

Child injuries in the home 49
injuries sustained in developing or non-Western countries (as these would likely have different patterns and causes of injury to those that occur in Australia).
This literature synopsis does not include Hazards and Ebulletins by the Victorian Injury Surveillance Unit, as it was considered that the VAED and VEMD datasets are already addressed in the data analysis sections of this report, and adding these publications would duplicate rather than expand on the findings.
Eighteen articles were identified that provided epidemiological data on burns sustained by children. These used a variety of methods to collect their data, as summarised below:
• ED database of presentations (Shields et al., 2015; Teo et al., 2012; Wasiak et al., 2009)
• Patient medical records from hospitals containing specialist burns treatment facilities (Cerovac & Roberts, 2000; Serour et al., 2008)
• Questionnaires following up burns treatment at hospital (Kemp et al., 2014; Natterer et al., 2009; Simons et al., 2002; Stockton et al., 2015)
• Death registries (Duke et al., 2011; Wasiak et al., 2009)
• Hospital admission records database (Boufous & Finch, 2005; Cox et al., 2015; Duke et al., 2011; Nguyen et al., 2008; Spinks et al., 2008; Tse et al., 2006; Verey et al., 2014; Wasiak et al., 2009; Yen et al., 2001)
• Trauma registration database (Teo et al., 2012)
• Burns database (Riedlinger et al., 2015)
Five studies were identified from Australia (Boufous & Finch, 2005; Duke et al., 2011; Simons et al., 2002; Stockton et al., 2015; Wasiak et al., 2009) and three from the United Kingdom (Cerovac & Roberts, 2000; Nguyen et al., 2008; Verey et al., 2014). One study compared burn injuries in two countries: Scotland and South Africa (Teo et al., 2012), and two others used data from multiple countries to report the epidemiology of burns among children (United Kingdom and Ireland, Australia and New Zealand) (Kemp et al., 2014; Riedlinger et al., 2015). Studies also stemmed from South Africa (Cox et al., 2015), Israel (Serour et al., 2008), Hong Kong (Tse et al., 2006), US (Shields et al., 2015; Yen et al., 2001), Switzerland (Natterer et al., 2009) and Canada (Spinks et al., 2008).
Play equipment injuriesPeer-reviewed, descriptive epidemiological research articles and government reports on play equipment-related injuries to children were searched for using the PubMed and ScienceDirect databases. Articles were also manually sourced from reference lists of retrieved literature. Search terms included the following keywords:
• play + equipment + home
• play + equipment + injury
• trampoline + injury
• monkey bars + injury
• swing + injury
Articles were only included if published from the year 2000, and were excluded if they reported on the epidemiology of injuries sustained in developing or non-Western countries (as these would likely have different patterns and causes of injury to those that occur in Australia).
This literature synopsis does not include Hazards and Ebulletins by the Victorian Injury Surveillance Unit, as it was considered that the VAED and VEMD datasets are already addressed in the data analysis sections of this report, and adding these publications would duplicate rather than expand on the findings.
The majority of literature reported on ED presentations (Karen Ashby, David Eager, et al., 2015; Keays & Skinner, 2012; Sophie Laforest et al., 2000; S Laforest et al., 2001; Loder, 2008; Macarthur et al., 2000; Nysted & Drogset, 2006; Petridou et al., 2002; Phelan et al., 2001; Vollman et al., 2009) (69%). Two used hospital admission data (Karen Ashby, Sophie Pointer, et al., 2015; Mahadev et al., 2004) and another used incident reports (Howard et al., 2005). Two studies combined ED presentation data with a questionnaire (Consumer Product Safety Commission, 2001; McCain et al., 2007).
Seven of the studies were from the US (Consumer Product Safety Commission, 2001; Keays & Skinner, 2012; S Laforest et al., 2001; Loder, 2008; McCain et al., 2007; Phelan et al., 2001; Vollman et al., 2009), three were from Canada (Howard et al., 2005; Sophie Laforest et al., 2000; Macarthur et al., 2000), two from Australia (Karen
RACV Research Report 16/0150
Ashby, David Eager, et al., 2015; Karen Ashby, Sophie Pointer, et al., 2015), and one each from Norway, Singapore and Greece (Mahadev et al., 2004; Nysted & Drogset, 2006; Petridou et al., 2002).
The studies were a combination of general play equipment-related injuries (Consumer Product Safety Commission, 2001; Keays & Skinner, 2012; Sophie Laforest et al., 2000; S Laforest et al., 2001; Loder, 2008; Macarthur et al., 2000; Mahadev et al., 2004; McCain et al., 2007; Petridou et al., 2002; Phelan et al., 2001; Vollman et al., 2009) and trampoline-related injuries (Karen Ashby, David Eager, et al., 2015; Karen Ashby, Sophie Pointer, et al., 2015; Nysted & Drogset, 2006). All injuries could have occurred in the home, or were reported within studies that presented all play equipment injuries from all locations. Three studies included samples that presented injuries from all locations (Keays & Skinner, 2012; Loder, 2008; Macarthur et al., 2000).


Royal Automobile Club of Victoria (RACV) LtdABN 44 004 060 833 550 Princes Highway Noble Park North Victoria 3174 Australia RACV MemberLine 13 RACV (13 7228)
racv.com.au