Chief Executive Thomas Erséus Deputy Chief Executive Johan Risberg 19 August 2010.
28
Chief Executive Thomas Erséus Deputy Chief Executive Johan Risberg 19 August 2010
-
date post
19-Dec-2015 -
Category
Documents
-
view
223 -
download
2
Transcript of Chief Executive Thomas Erséus Deputy Chief Executive Johan Risberg 19 August 2010.

Chief Executive Thomas ErséusDeputy Chief Executive Johan Risberg19 August 2010

Kungsleden in brief
■ Owns and manages properties generating high and stable long-term returns– Returns more important than property type and location– A property’s yield cannot be judged without considering risk levels
■ 559 properties reported at SEK 21.9 bn. as of 30 June 2010 (21.9)– Commercial properties 43% (46)– Public properties 43% (39)– Modular buildings 7% (7)– Retirement homes Germany 7% (8)
■ Just over 25,800 shareholders. 47% of shares held by private individuals and approximately a quarter by foreign shareholders– Ten largest shareholders control 17.5% of capital and votes

Profit for calculating dividends
2010 2009
SEK m Jan-Jun Jan-Jun
Gross profit 752 954
Sales and administration costs -137 -152
Net financial position -364 -475
Sub-total 252 327
Realised items
Trading net at divestment 14 -128
Realised value changes, properties -13 1,177
Realised value changes, financial instruments -4 -158
Sub-total -3 891
Taxes payable -30 -360
Profit for calculating dividends 219 858

Clarified dividend policy
■ The Board’s ambition is to maintain stable dividends with a high pay-out ratio. The policy implies that dividends shall amount to 50 per cent of profit for calculating dividends.
■ When judging the amount of dividends, consideration will be given to the company’s investment need, capital structure and financial position otherwise

Second quarter in brief
■ Profit in line with expectations
■ Acquisition of 10 properties for a value of approximately SEK 800 m and a property yield of 7.4%
■ Divestments of 9 properties for about SEK 300 m at a property yield of 5.7%
■ Slight increase in vacancies, but rental revenues remained stable
■ Five-year bond loan issued of around SEK 400 m

Current market conditions
■ Kungsleden’s lettings market– Lettings remain stable – Slight increase in vacancies from low levels
■ Financial market– Greater willingness to invest from banks– Increased inflow of capital to the property sector– More interest in alternative funding sources
■ Transaction market– Recovery, with surprisingly high volumes– Greater competition over properties– Prospects for a price increase on properties

Property portfolio
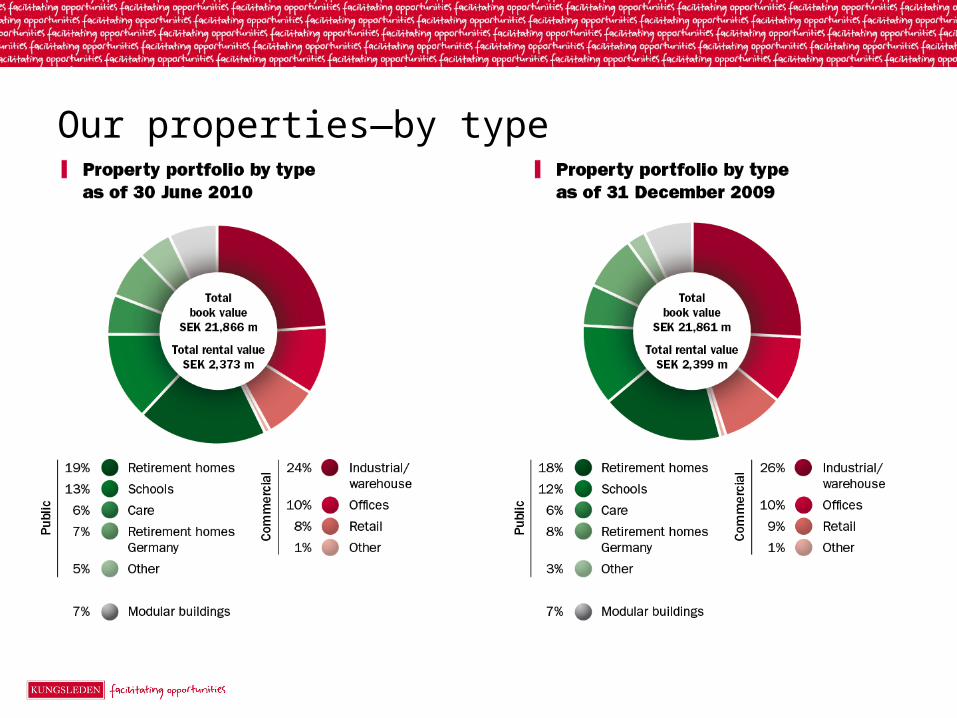
Our properties—by type

Kungsleden’s Q2 – 2010 in figures

Income Statement
SEK m. 2010
Jan-Jun2009
Jan-Jun
Rental revenues 1,062 1,301
Sales revenues, modular buildings 80 138
Net sales 1,142 1,439
Gross profit 752 954
Trading net 14 -128
Sales and administration costs -137 -152
Net financial position -364 -475
Unrealised value changes -98 -34
Profit before tax 168 164
Tax -30 72
Profit after tax for the period 137 237

Income Statement
SEK m 2010
Jan-Jun2009
Jan-Jun
Rental revenues 1,062 1,301
Sales revenues, modular buildings 80 138
Net sales 1,142 1,439
Gross profit 752 954
Trading net 14 -128
Sales and administration costs -137 -152
Net financial position -364 -475
Unrealised value changes -98 -34
Profit before tax 168 164
Tax -30 72
Profit after tax for the period 137 237
• Decrease due to part-sale of Public Properties and negative rental index for 2010
• Rental revenues decreased by 1% in like-for-like terms
• Decrease due to part-sale of Public Properties and negative rental index for 2010
• Rental revenues decreased by 1% in like-for-like terms

Income Statement
SEK m 2010
Jan-Jun2009
Jan-Jun
Rental revenues 1,062 1,301
Sales revenues, modular buildings 80 138
Net sales 1,142 1,439
Gross profit 752 954
Trading net 14 -128
Sales and administration costs -137 -152
Net financial position -364 -475
Unrealised value changes -98 -34
Profit before tax 168 164
Tax -30 72
Profit after tax for the period 137 237
• Reduced demand due to the recession
• Reduced demand due to the recession

Income Statement
SEK m 2010
Jan-Jun2009
Jan-Jun
Rental revenues 1,062 1,301
Sales revenues, modular buildings 80 138
Net sales 1,142 1,439
Gross profit 752 954
Trading net 14 -128
Sales and administration costs -137 -152
Net financial position -364 -475
Unrealised value changes -98 -34
Profit before tax 168 164
Tax -30 72
Profit after tax for the period 137 237
• Decreased by 21%
• Excluding the effect of the Hemsö transaction, operating net decreased by 4%
• Decreased by 21%
• Excluding the effect of the Hemsö transaction, operating net decreased by 4%

Income Statement
SEK m. 2010
Jan-Jun2009
Jan-Jun
Rental revenues 1,062 1,301
Sales revenues, modular buildings 80 138
Net sales 1,142 1,439
Gross profit 752 954
Trading net 14 -128
Sales and administration costs -137 -152
Net financial position -364 -475
Unrealised value changes -98 -34
Profit before tax 168 164
Tax -30 72
Profit after tax for the period 137 237
• The sales price exceeds the book value
• The sales price exceeds the book value

Income Statement
SEK m 2010
Jan-Jun2009
Jan-Jun
Rental revenues 1,062 1,301
Sales revenues, modular buildings 80 138
Net sales 1,142 1,439
Gross profit 752 954
Trading net 14 -128
Sales and administration costs -137 -152
Net financial position -364 -475
Unrealised value changes -98 -34
Profit before tax 168 164
Tax -30 72
Profit after tax for the period 137 237
• Lower administration costs mainly due to the part-sale to AP3
• Lower administration costs mainly due to the part-sale to AP3

Income Statement
SEK m 2010
Jan-Jun2009
Jan-Jun
Rental revenues 1,062 1,301
Sales revenues, modular buildings 80 138
Net sales 1,142 1,439
Gross profit 752 954
Trading net 14 -128
Sales and administration costs -137 -152
Net financial position -364 -475
Unrealised value changes -98 -34
Profit before tax 168 164
Tax -30 72
Profit after tax for the period 137 237
• Positive change primarily explained by lower loan volume in 2010
• Positive change primarily explained by lower loan volume in 2010

Income Statement
SEK m 2010
Jan-Jun2009
Jan-Jun
Rental revenues 1,062 1,301
Sales revenues, modular buildings 80 138
Net sales 1,142 1,439
Gross profit 752 954
Trading net 14 -128
Sales and administration costs -137 -152
Net financial position -364 -475
Unrealised value changes -98 -34
Profit before tax 168 164
Tax -30 72
Profit after tax for the period 137 237
• Positive value change on properties of SEK 96 m., corresponding to 0.4% of book value
• Negative value change on financial instruments resulting from falling long yields
• Positive value change on properties of SEK 96 m., corresponding to 0.4% of book value
• Negative value change on financial instruments resulting from falling long yields

Income Statement
SEK m 2010
Jan-Jun2009
Jan-Jun
Rental revenues 1,062 1,301
Sales revenues, modular buildings 80 138
Net sales 1,142 1,439
Gross profit 752 954
Trading net 14 -128
Sales and administration costs -137 -152
Net financial position -364 -475
Unrealised value changes -98 -34
Profit before tax 168 164
Tax -30 72
Profit after tax for the period 137 237
• Includes positive effect of property divestments
• Includes positive effect of property divestments

Income Statement
SEK m 2010
Jan-Jun2009
Jan-Jun
Rental revenues 1,062 1,301
Sales revenues, modular buildings 80 138
Net sales 1,142 1,439
Gross profit 752 954
Trading net 14 -128
Sales and administration costs -137 -152
Net financial position -364 -475
Unrealised value changes -98 -34
Profit before tax 168 164
Tax -30 72
Profit after tax for the period 137 237
• Lower figure mainly due to negative unrealised value changes on financial instruments
• Lower figure mainly due to negative unrealised value changes on financial instruments

Balance Sheet
SEK m 2010 2009
Assets 30 Jun 31 Dec
Goodwill 201 193
Properties 21,866 21,860
Receivables, etc. 1,619 1,466
Cash and cash equivalents 631 689
Total assets 24,318 24,208
Equity and liabilities
Equity 6,657 7,079
Interest-bearing liabilities 14,153 14,437
Non-interest-bearing liabilities 3,509 2,692
Total equity and liabilities 24,318 24,208

Interest fixingsAs of 30 Jun 2010
Interest maturity Loan, SEK m
Interest derivatives,
SEK m Proportion, %Ave. interest,
%
2010 14,139 7,350 47.8 5.9
2011 – – –
2012 400 2.8 4.4
2013 2,000 14.1 4.2
2014 1,500 10.6 4.2
2015 1,800 12.7 4.3
2016 400 2.8 4.4
2017 300 2.1 4.5
2018 1,000 7.1 4.5
Total 14,139 14,750 100.0 5.0
Market value of loans and derivatives 1,339
Total 15,478

Maturity structureAs of 30 Jun 2010
Average conversion term,
yearsYearCredits,SEK m Proportion, %
2010 893 5.0
2011 1,857 10.4
2012 11,919 66.6
2013 2,169 12.1
2015 399 2.2
2018 656 3.7
Total credits 17,893 100 2.3
Un-utilised credit facilities -3,754
Total utilised credit facilities 14,139 2.4
Equity ratio30 Jun 10
27%31 Dec 09
29%30 Jun 09
29%
Mortgage ratio 64 66 65

Underlying profits, 2000 - Q2, 2010

10 largest shareholders (% of votes & capital)
■ Florén, Olle and companies 2.3■ Nordea fonder 2.1■ Norwegian Government 2.0■ SHB fonder 2.0■ SEB fonder 1.8■ Danske Invest fonder (Sweden) 1.8■ Länsförsäkringar fonder 1.6■ Avanza Pension Funds 1.4■ Second Swedish Nat’l Pension fund 1.3■ Swedbank Robur fonder 1.2
17.5
Source: SIS Ägarservice

Ongoing outlook for 2010
■ Focus on cash flow, enhancing the portfolio and long agreements■ Increased activity on the transaction market should favour
Kungsleden■ Reiterating the estimate of profit for calculating dividends of SEK
600 m■ Ensure financial flexibility to act■ Extend the base of funding sources■ Prepare Hemsö for standalone status

The share to mid-August 2010

Total yield to mid-August 2010

Any questions?