CHICAGO RETAIL MARKET OVERVIEW - shumakergroup.com
18
CHICAGO RETAIL MARKET OVERVIEW Presenters: Keely Polczynski, CB Richard Ellis Eteri Zaslavsky, Next Realty, LLC May 28, 2014 Prepared for Chicago Chapter of Appraisal Institute
Transcript of CHICAGO RETAIL MARKET OVERVIEW - shumakergroup.com

CHICAGO RETAIL MARKET OVERVIEW
Presenters:
Keely Polczynski, CB Richard Ellis
Eteri Zaslavsky, Next Realty, LLC
May 28, 2014
Prepared for Chicago Chapter of Appraisal Institute

2
• Brief Introductions
• Chicago Urban Retail Investment Sales Activity
• Retail Submarkets and Demographic Trends
• Investment Sales Activity by Submarket
� Michigan Avenue & Gold Coast
� Armitage & Halstead
� Southport
� Bucktown
� Fulton Market
• Chicago Grocery Industry Trends
• Chicago Grocery Investment Sales Activity
• Dominick’s Update
• Investor’s Perspective and Closing Remarks
Table of Contents

3
Chicago Urban Retail Investment Sales Activity
Period# of
Transactions
Total Value
(Million)
Average
Price PSF
Average Cap
Rate
1Q2013 29 $170 $472 6.28%
2Q2013 42 $143 $725 5.98%
3Q2013 46 $110 $338 6.75%
4Q2013 47 $822 $519 5.69%
1Q2014 29 $211 $449 5.45%
Investment Activity is Robust

4
Retail Submarkets

5
Income and Population Trends

6
Employment Trends

7
Housing Trends

8
FDIC Growth

9
Investment Sales Activity: Michigan Avenue

10
Investment Sales Activity: Gold Coast
11
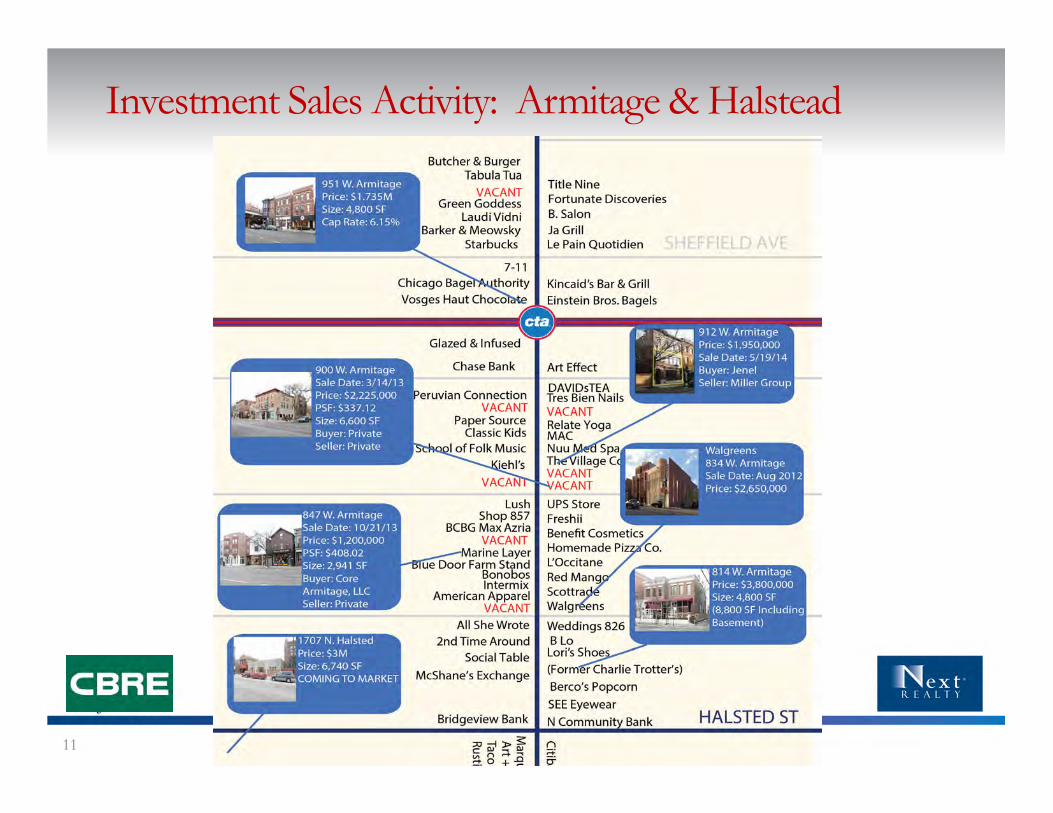
Investment Sales Activity: Armitage & Halstead

12
Investment Sales Activity: Southport

13
Investment Sales Activity: Bucktown

14
Investment Sales Activity: Fulton Market

15
Chicago Grocery Industry Trends
• Urban Markets are Stronger and Low Density Markets are Struggling
• Upscale/Specialty/Organic Grocers are Expanding in Urban and In-Fill
Markets
� Whole Foods, Trader Joe’s, Mariano’s, The Fresh Market, Plum Market, Heinen’s, Fresh Thyme,
Spouts, Earth Fare
• Fewer National Chains in Traditional Grocery Category (Jewel-Osco)
• Other Retailers Filling Former Grocery Stores
� Home Furnishings: Art Van, HomeGoods, American Sale, Ashley Furniture
� Fashion Retailers: Ross, TJ Maxx, DSW, Nordstrom Rack

16
Chicago Grocery Investment Sales Activity
Grocer # of Transactions
Aldi 14
Users (Pete’s, Tony’s, etc.) 10
Mariano’s 8
Jewel 5
Trader Joes 2
Dominick’s 2
Wal-Mart, Target, Whole Foods, Meijer’s,
Kroger, Food for Less, Cub Foods,1 (Each)
48 Transactions Completed Over the Last 6 Quarters
Period# of
Transactions
Total Value
(Million)
Average
Price PSF
Average
Cap RateNotable Transactions
4Q2012 5 $66 $205 7.68% Mariano’s, West Loop, 6.4% cap rate, $521 psf
1Q2013 6 $64 $265 6.42%
2Q2013 7 $115 $152 7.81%
3Q2013 9 $85 $100 8.86%
4Q2013 9 $92 $159 6.13% Trader Joe’s, Evanston, 5.0% cap rate, $846 psf
1Q2014 12 $178 $210 7.42% Mariano’s, South Loop, 5.8% cap rate, $618 psf

17
Dominick’s Update
• 72 Stores Closed 4Q2013
• 4 Stores Previously on the Market
• 76 Total
� 42 Committed by Other Grocers
� 34 Remain on the Market
Mariano’s 11
Jewel 9
Whole Foods 7
Joe Caputo & Sons 4
Tony’s 2
Cermak Fresh Market 2
Heinen’s 2
Pete’s 1
Garden Fresh 1
Butera/Piggly Wiggly 1
Shop & Save 1
Angelo Caputo 1
Total 42

18
Investor’s Perspective and Closing Remarks
• General Outlook is Positive
• Investment Environment is Active
• Plenty of Capital to Deploy
• Search for Yield
• Strong Capital Markets
• Aggressive Valuations
• What does the Future Hold?