Chicago - Fed
33
Consensus Forecast for 2015 & 2016 William A. Strauss Senior Economist and Economic Advisor Federal Reserve Bank of Chicago
Transcript of Chicago - Fed
Consensus Forecast for 2015 & 2016 William A. Strauss
Senior Economist and Economic Advisor Federal Reserve Bank of Chicago
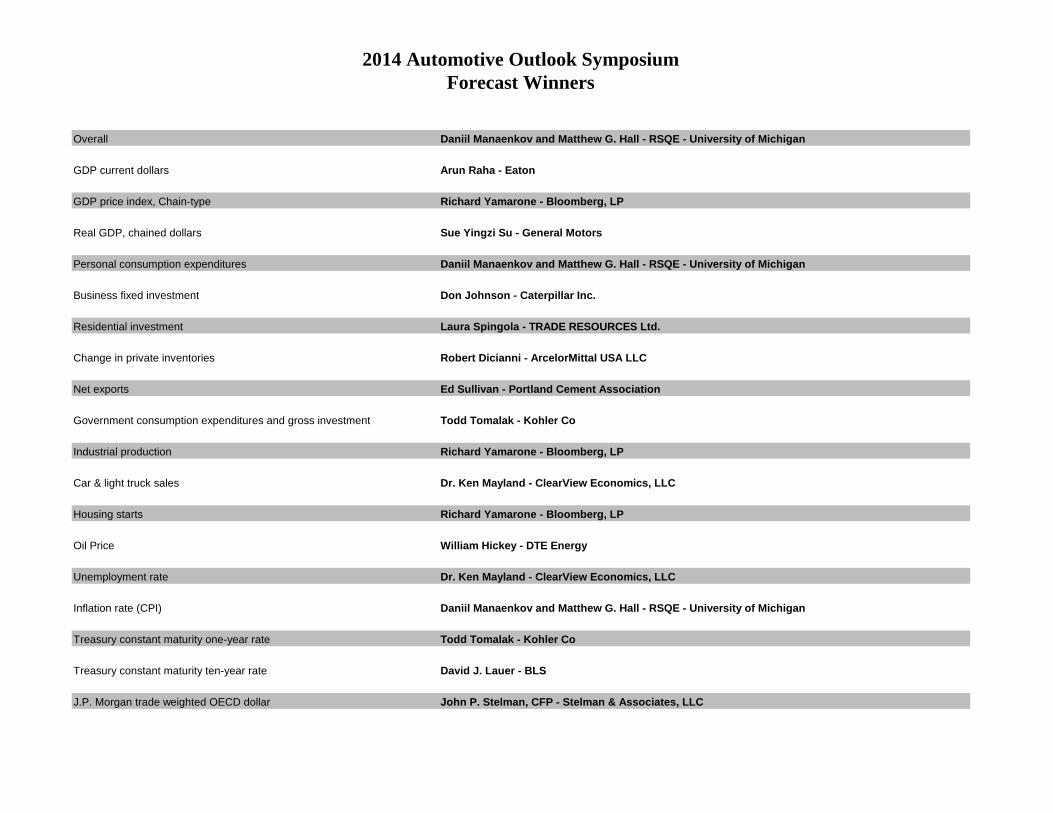
Overall Daniil Manaenkov and Matthew G. Hall - RSQE - University of Michigan
GDP current dollars Arun Raha - Eaton
GDP price index, Chain-type Richard Yamarone - Bloomberg, LP
Real GDP, chained dollars Sue Yingzi Su - General Motors
Personal consumption expenditures Daniil Manaenkov and Matthew G. Hall - RSQE - University of Michigan
Business fixed investment Don Johnson - Caterpillar Inc.
Residential investment Laura Spingola - TRADE RESOURCES Ltd.
Change in private inventories Robert Dicianni - ArcelorMittal USA LLC
Net exports Ed Sullivan - Portland Cement Association
Government consumption expenditures and gross investment Todd Tomalak - Kohler Co
Industrial production Richard Yamarone - Bloomberg, LP
Car & light truck sales Dr. Ken Mayland - ClearView Economics, LLC
Housing starts Richard Yamarone - Bloomberg, LP
Oil Price William Hickey - DTE Energy
Unemployment rate Dr. Ken Mayland - ClearView Economics, LLC
Inflation rate (CPI) Daniil Manaenkov and Matthew G. Hall - RSQE - University of Michigan
Treasury constant maturity one-year rate Todd Tomalak - Kohler Co
Treasury constant maturity ten-year rate David J. Lauer - BLS
J.P. Morgan trade weighted OECD dollar John P. Stelman, CFP - Stelman & Associates, LLC
2014 Automotive Outlook SymposiumForecast Winners

Table 1 - Median forecast of GDP and related items
2014 2015 2016 Q115 Q215 Q315 Q415 Q116 Q216 Q316 Q416
GDP, current dollars* 3.7% 3.4% 4.5% 0.1% 3.9% 4.6% 4.5% 4.4% 4.6% 4.5% 4.4%
GDP price index, chain-type* 1.2% 1.2% 1.9% -0.1% 1.7% 1.6% 1.5% 1.8% 1.9% 2.0% 1.8%
Real GDP, chained dollars* 2.4% 2.1% 2.7% 0.2% 2.1% 2.9% 2.8% 2.6% 2.7% 2.7% 2.7%
Personal consumption expenditures* 2.9% 2.6% 2.7% 1.9% 3.0% 3.1% 3.1% 2.8% 2.7% 2.8% 2.7%
Business fixed investment* 6.2% 2.5% 4.1% -3.4% 3.0% 5.0% 5.5% 4.7% 4.3% 4.0% 3.9%
Residential investment* 2.5% 6.1% 8.5% 1.3% 7.4% 8.5% 8.7% 10.0% 9.0% 8.2% 8.0%
Change in private inventories (billions of constant dollars)** $80.0 $71.7 $53.3 $110.3 $82.2 $70.1 $71.7 $60.4 $58.0 $51.8 $53.3
Net exports of goods and services (billions of constant dollars)** -$471.4 -$546.4 -$569.7 -$522.1 -$520.1 -$529.6 -$546.4 -$549.1 -$546.5 -$550.5 -$569.7
Government consumption expenditures and gross investment* 0.8% 0.8% 1.3% -0.8% 1.4% 1.3% 1.0% 1.0% 1.4% 1.4% 1.2%
Industrial production* 4.5% 1.5% 2.9% -0.5% 0.9% 2.7% 2.8% 2.8% 3.0% 3.0% 2.9%
Car & light truck sales (millions - calendar year including imports)*** 16.4 16.8 17.1 16.6 16.8 16.9 17.0 17.0 17.0 17.0 17.0
Housing starts (millions)*** 1.00 1.09 1.23 0.97 1.08 1.13 1.18 1.20 1.24 1.23 1.22
Oil price (dollars per barrel of West Texas Intermediate)** $73.16 $62.32 $68.55 $48.64 $57.11 $60.02 $62.32 $63.96 $66.43 $67.53 $68.55
Unemployment rate** 5.7% 5.2% 5.0% 5.6% 5.4% 5.2% 5.2% 5.1% 5.0% 5.0% 5.0%
Inflation rate (consumer price index)* 1.2% 0.7% 2.2% -3.1% 2.1% 2.0% 2.1% 2.1% 2.2% 2.2% 2.2%
Treasury constant maturity 1-year rate** 0.15% 0.65% 1.60% 0.22% 0.24% 0.36% 0.65% 0.91% 1.18% 1.48% 1.60%
Treasury constant maturity 10-year rate** 2.28% 2.46% 3.10% 1.97% 2.10% 2.25% 2.46% 2.70% 2.86% 3.05% 3.10%
J.P. Morgan trade weighted OECD dollar* 7.4% 7.0% 0.0% 28.6% 1.2% 0.6% 1.1% 0.0% 0.5% 0.0% 0.0%
*Annual: Q4 over Q4 Quarterly: Quarter to Quarter change, annual rate**Annuals are Q4 value***Annuals are yearly average
1 Federal Reserve Bank of Chicago - Twenty-Second Annual Automotive Outlook Symposium May 29, 2015

Table 2 - Mean forecast of GDP and related items
2014 2015 2016 Q115 Q215 Q315 Q415 Q116 Q216 Q316 Q416
GDP, current dollars* 3.7% 3.2% 4.3% 0.1% 3.8% 4.7% 4.4% 4.3% 4.3% 4.5% 4.3%
GDP price index, chain-type* 1.2% 1.1% 1.7% -0.1% 1.5% 1.7% 1.4% 1.5% 1.8% 1.8% 1.6%
Real GDP, chained dollars* 2.4% 2.1% 2.6% 0.2% 2.2% 3.0% 2.9% 2.7% 2.6% 2.7% 2.6%
Personal consumption expenditures* 2.9% 2.7% 2.7% 1.9% 2.7% 3.0% 3.1% 2.7% 2.5% 2.8% 2.6%
Business fixed investment* 6.2% 2.3% 4.3% -3.4% 2.1% 6.2% 5.0% 5.0% 4.6% 4.0% 3.7%
Residential investment* 2.5% 6.9% 8.2% 1.3% 7.7% 8.4% 11.4% 8.7% 8.6% 7.8% 8.4%
Change in private inventories (billions of constant dollars)** $80.0 $68.2 $54.3 $110.3 $79.0 $69.9 $68.2 $62.6 $59.6 $53.2 $54.3
Net exports of goods and services (billions of constant dollars)** -$471.4 -$539.7 -$565.9 -$522.1 -$517.6 -$528.0 -$539.7 -$546.4 -$550.9 -$560.1 -$565.9
Government consumption expenditures and gross investment* 0.8% 0.9% 1.2% -0.8% 2.4% 1.8% 0.4% 0.9% 1.1% 1.9% 0.8%
Industrial production* 4.5% 1.6% 2.6% -0.5% 0.7% 3.2% 3.0% 2.6% 2.4% 2.7% 2.6%
Car & light truck sales (millions - calendar year including imports)*** 16.4 16.8 17.0 16.6 16.8 16.9 17.0 16.9 17.0 17.0 17.0
Housing starts (millions)*** 1.00 1.08 1.21 0.97 1.06 1.11 1.15 1.17 1.22 1.23 1.24
Oil price (dollars per barrel of West Texas Intermediate)** $73.16 $63.63 $69.61 $48.64 $56.46 $59.60 $63.63 $65.74 $67.34 $68.28 $69.61
Unemployment rate** 5.7% 5.2% 5.0% 5.6% 5.4% 5.3% 5.2% 5.1% 5.1% 5.0% 5.0%
Inflation rate (consumer price index)* 1.2% 0.6% 2.2% -3.1% 1.7% 2.1% 2.0% 2.0% 2.3% 2.2% 2.2%
Treasury constant maturity 1-year rate** 0.15% 0.66% 1.68% 0.22% 0.24% 0.41% 0.66% 0.93% 1.19% 1.45% 1.68%
Treasury constant maturity 10-year rate** 2.28% 2.49% 3.14% 1.97% 2.09% 2.27% 2.49% 2.69% 2.86% 3.02% 3.14%
J.P. Morgan trade weighted OECD dollar* 7.4% 7.8% 0.3% 28.6% 1.7% 1.3% 1.8% 0.2% 0.4% 0.5% 0.3%
*Annual: Q4 over Q4 Quarterly: Quarter to Quarter change, annual rate**Annuals are Q4 value***Annuals are yearly average
2 Federal Reserve Bank of Chicago - Twenty-Second Annual Automotive Outlook Symposium May 29, 2015

Figure 1 - Forecast of GDP and related items
3 Federal Reserve Bank of Chicago - Twenty-Second Annual Automotive Outlook Symposium May 29, 2015
-10
-8
-6
-4
-2
0
2
4
6
8
'95 '96 '97 '98 '99 '00 '01 '02 '03 '04 '05 '06 '07 '08 '09 '10 '11 '12 '13 '14 '15 '16
Real GDP, chained dollars
percent change, annual rate
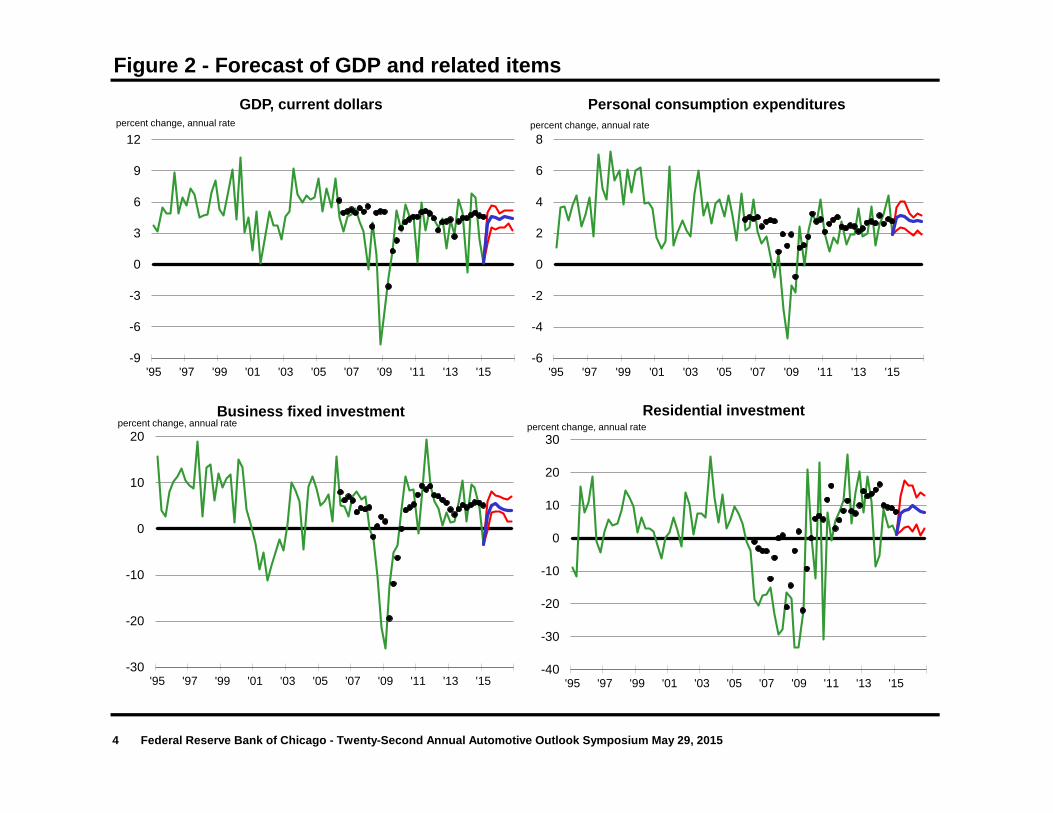
Figure 2 - Forecast of GDP and related items
4 Federal Reserve Bank of Chicago - Twenty-Second Annual Automotive Outlook Symposium May 29, 2015
-6
-4
-2
0
2
4
6
8
'95 '97 '99 '01 '03 '05 '07 '09 '11 '13 '15
Personal consumption expenditures percent change, annual rate
-30
-20
-10
0
10
20
'95 '97 '99 '01 '03 '05 '07 '09 '11 '13 '15
Business fixed investment percent change, annual rate
-9
-6
-3
0
3
6
9
12
'95 '97 '99 '01 '03 '05 '07 '09 '11 '13 '15
GDP, current dollars percent change, annual rate
-40
-30
-20
-10
0
10
20
30
'95 '97 '99 '01 '03 '05 '07 '09 '11 '13 '15
Residential investment percent change, annual rate
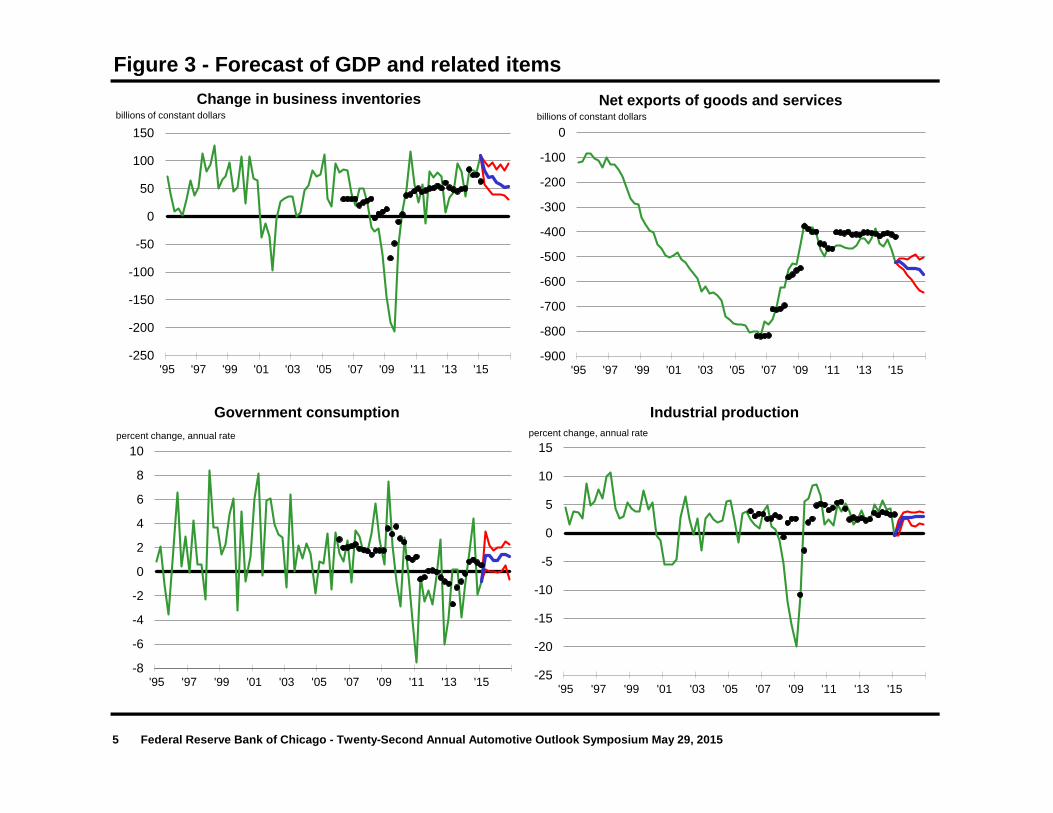
Figure 3 - Forecast of GDP and related items
5 Federal Reserve Bank of Chicago - Twenty-Second Annual Automotive Outlook Symposium May 29, 2015
-250
-200
-150
-100
-50
0
50
100
150
'95 '97 '99 '01 '03 '05 '07 '09 '11 '13 '15
Change in business inventories billions of constant dollars
-900
-800
-700
-600
-500
-400
-300
-200
-100
0
'95 '97 '99 '01 '03 '05 '07 '09 '11 '13 '15
Net exports of goods and services billions of constant dollars
-8
-6
-4
-2
0
2
4
6
8
10
'95 '97 '99 '01 '03 '05 '07 '09 '11 '13 '15
Government consumption percent change, annual rate
-25
-20
-15
-10
-5
0
5
10
15
'95 '97 '99 '01 '03 '05 '07 '09 '11 '13 '15
Industrial production percent change, annual rate
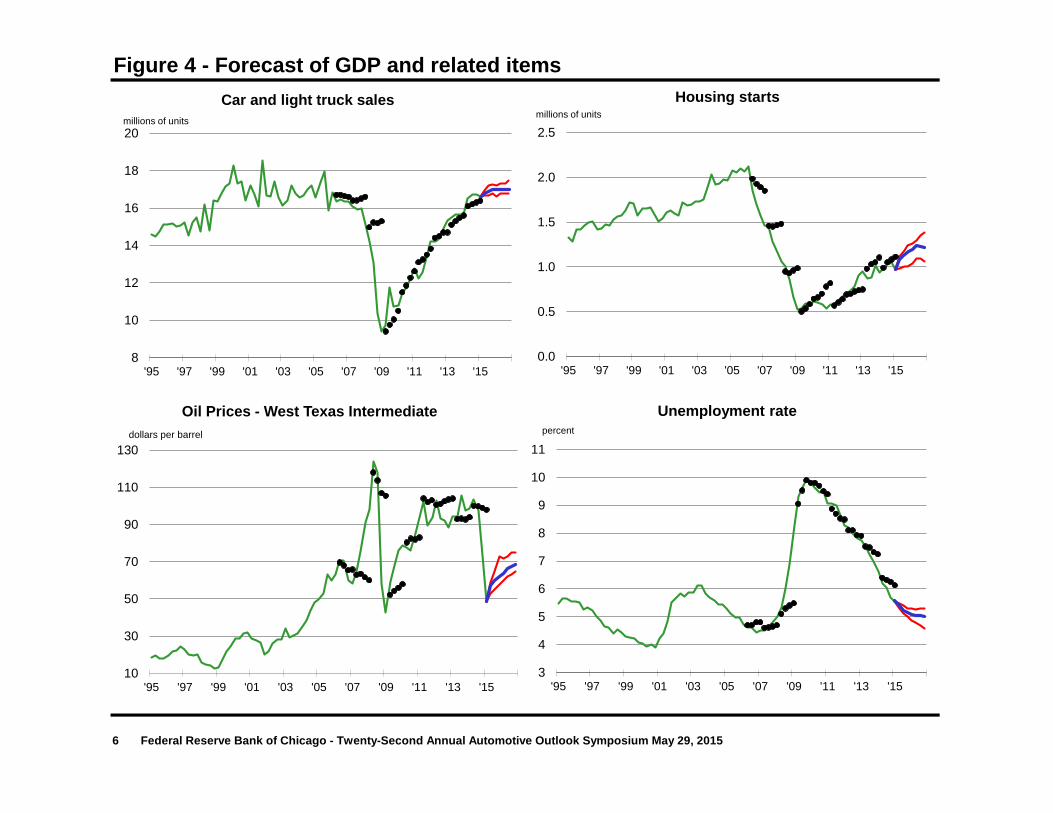
Figure 4 - Forecast of GDP and related items
6 Federal Reserve Bank of Chicago - Twenty-Second Annual Automotive Outlook Symposium May 29, 2015
8
10
12
14
16
18
20
'95 '97 '99 '01 '03 '05 '07 '09 '11 '13 '15
Car and light truck sales millions of units
0.0
0.5
1.0
1.5
2.0
2.5
'95 '97 '99 '01 '03 '05 '07 '09 '11 '13 '15
Housing starts millions of units
3
4
5
6
7
8
9
10
11
'95 '97 '99 '01 '03 '05 '07 '09 '11 '13 '15
Unemployment rate percent
10
30
50
70
90
110
130
'95 '97 '99 '01 '03 '05 '07 '09 '11 '13 '15
Oil Prices - West Texas Intermediate dollars per barrel

Figure 5 - Forecast of GDP and related items
7 Federal Reserve Bank of Chicago - Twenty-Second Annual Automotive Outlook Symposium May 29, 2015
-10
-8
-6
-4
-2
0
2
4
6
8
'95 '97 '99 '01 '03 '05 '07 '09 '11 '13 '15
Inflation rate (CPI) percent change, annual rate
1
2
3
4
5
6
7
8
'95 '97 '99 '01 '03 '05 '07 '09 '11 '13 '15
Treasury ten-year rate percent
0
1
2
3
4
5
6
7
'95 '97 '99 '01 '03 '05 '07 '09 '11 '13 '15
Treasury one-year rate percent
-1
0
1
2
3
4
5
'95 '97 '99 '01 '03 '05 '07 '09 '11 '13 '15
GDP price index, chain-type percent change, annual rate

Figure 6 - Forecast of GDP and related items
8 Federal Reserve Bank of Chicago - Twenty-Second Annual Automotive Outlook Symposium May 29, 2015
-20
-10
0
10
20
30
40
50
'95 '97 '99 '01 '03 '05 '07 '09 '11 '13 '15
J.P. Morgan trade weighted dollar percent change, annual rate

Table 3 - GDP, current dollars
Q4 over Q4
Individual 2014 2015 2016 Q115 Q215 Q315 Q415 Q116 Q216 Q316 Q416
3.7% 0.1%
3 3.4% 5.2% 4.7% 4.6% 4.1% 5.1% 5.3% 5.2% 5.3%
2 2.9% 5.0% 2.0% 4.7% 4.8% 4.9% 4.9% 5.1% 5.2%
4 3.6% 5.0% 3.9% 5.6% 4.9% 4.3% 5.2% 5.3% 5.2%
6 3.6% 5.0% 3.7% 4.9% 5.6% 4.9% 5.0% 5.1% 5.0%
5 3.6% 5.0% 4.4% 5.1% 4.7% 4.6% 5.2% 5.4% 4.8%
12 3.5% 4.9% 4.8% 4.5% 4.5% 5.0% 5.0% 4.9% 4.9%
10 2.8% 4.9% 3.8% 4.0% 3.4% 4.6% 4.9% 5.0% 5.2%
13 3.6% 4.6% 3.9% 5.4% 4.8% 4.8% 4.6% 4.6% 4.4%
14 3.6% 4.5% 4.1% 5.6% 4.8% 4.7% 4.4% 4.5% 4.5%
8 3.4% 4.5% 4.3% 4.4% 4.8% 3.8% 4.6% 4.8% 4.8%
7 3.5% 4.5% 5.0% 4.9% 4.0% 4.6% 4.6% 4.1% 4.5%
18 3.9% 4.4% 5.6% 5.2% 4.9% 4.6% 4.6% 4.5% 4.2%
1 2.8% 4.4% 2.8% 3.7% 4.5% 4.4% 4.3% 4.5% 4.3%
9 2.4% 4.2% 2.3% 3.4% 3.8% 3.9% 4.1% 4.3% 4.4%
17 2.8% 4.0% 3.0% 4.1% 3.9% 3.9% 4.0% 4.0% 4.0%
11 3.0% 3.8% 4.3% 3.9% 3.8% 3.6% 3.7% 3.9% 4.0%
15 2.6% 3.7% 3.4% 3.6% 3.5% 3.5% 3.5% 4.0% 3.9%
21 4.4% 3.7% 5.0% 6.9% 5.6% 4.3% 3.8% 3.3% 3.3%
20 2.2% 3.3% 2.1% 4.1% 2.7% 4.1% 1.8% 4.1% 3.4%
19 4.5% 3.3% 4.3% 7.9% 5.8% 4.0% 3.6% 3.0% 2.5%
16 1.9% 3.0% 2.0% 2.7% 2.9% 1.9% 3.3% 4.0% 2.8%
MEDIAN 3.4% 4.5% 3.9% 4.6% 4.5% 4.4% 4.6% 4.5% 4.4%
MEAN 3.2% 4.3% 3.8% 4.7% 4.4% 4.3% 4.3% 4.5% 4.3%
STD DEV 0.6% 0.6% 1.0% 1.2% 0.8% 0.7% 0.8% 0.6% 0.8%
HIGH 4.5% 5.2% 5.6% 7.9% 5.8% 5.1% 5.3% 5.4% 5.3%
LOW 1.9% 3.0% 2.0% 2.7% 2.7% 1.9% 1.8% 3.0% 2.5%
9 Federal Reserve Bank of Chicago - Twenty-Second Annual Automotive Outlook Symposium May 29, 2015

Table 4 - GDP price index, chain-type
Q4 over Q4
Individual 2014 2015 2016 Q115 Q215 Q315 Q415 Q116 Q216 Q316 Q416
1.2% -0.1%
10 1.2% 2.2% 2.0% 1.4% 1.3% 2.2% 2.2% 2.2% 2.2%
12 1.2% 2.2% 1.7% 1.6% 1.7% 2.1% 2.2% 2.2% 2.2%
3 1.4% 2.1% 2.3% 1.7% 1.5% 2.0% 2.3% 2.1% 2.0%
6 1.4% 2.1% 1.9% 2.0% 2.0% 2.0% 2.0% 2.2% 2.1%
5 1.4% 2.0% 1.9% 1.8% 1.9% 2.0% 2.0% 2.1% 2.1%
18 1.7% 2.0% 2.4% 2.2% 2.2% 1.8% 2.2% 2.2% 1.8%
21 1.4% 2.0% 1.9% 2.1% 1.6% 1.8% 1.9% 2.1% 2.1%
4 1.4% 1.9% 1.8% 2.0% 1.7% 1.8% 1.9% 2.0% 2.1%
14 1.4% 1.9% 1.8% 2.0% 1.7% 1.8% 1.9% 2.0% 2.0%
13 1.4% 1.9% 1.8% 2.0% 1.7% 1.7% 1.9% 2.0% 2.0%
2 0.9% 1.9% 0.3% 1.6% 1.6% 1.8% 1.8% 2.0% 2.0%
11 1.1% 1.7% 1.6% 1.5% 1.5% 1.5% 1.8% 1.8% 1.8%
8 1.0% 1.6% 1.6% 1.1% 1.5% 1.8% 1.5% 1.6% 1.6%
7 1.2% 1.5% 1.5% 1.9% 1.5% 1.6% 1.7% 1.5% 1.4%
17 1.1% 1.5% 1.4% 1.4% 1.5% 1.5% 1.5% 1.5% 1.5%
9 0.6% 1.4% 0.2% 1.0% 1.2% 1.3% 1.3% 1.4% 1.6%
20 0.5% 1.3% 0.6% 1.1% 0.4% 1.1% 0.8% 1.6% 1.8%
1 0.5% 1.2% 0.2% 0.8% 1.2% 1.1% 1.2% 1.0% 1.4%
15 1.1% 1.1% 2.9% 1.4% 0.1% -0.1% 2.9% 1.4% 0.1%
19 1.7% 1.0% 1.6% 3.3% 1.8% 1.5% 1.1% 1.1% 0.4%
16 0.5% 0.5% 0.6% 1.4% 0.2% -0.1% 0.8% 1.4% 0.2%
MEDIAN 1.2% 1.9% 1.7% 1.6% 1.5% 1.8% 1.9% 2.0% 1.8%
MEAN 1.1% 1.7% 1.5% 1.7% 1.4% 1.5% 1.8% 1.8% 1.6%
STD DEV 0.3% 0.4% 0.7% 0.5% 0.5% 0.6% 0.5% 0.4% 0.6%
HIGH 1.7% 2.2% 2.9% 3.3% 2.2% 2.2% 2.9% 2.2% 2.2%
LOW 0.5% 0.5% 0.2% 0.8% 0.1% -0.1% 0.8% 1.0% 0.1%
10 Federal Reserve Bank of Chicago - Twenty-Second Annual Automotive Outlook Symposium May 29, 2015

Table 5 - Real GDP, chained dollars
Q4 over Q4
Individual 2014 2015 2016 Q115 Q215 Q315 Q415 Q116 Q216 Q316 Q416
2.4% 0.2%
1 2.2% 3.1% 2.4% 2.8% 3.2% 3.2% 3.0% 3.4% 2.8%
2 2.0% 3.1% 1.5% 3.1% 3.2% 3.1% 3.1% 3.1% 3.1%
3 2.0% 3.0% 2.1% 2.9% 2.6% 3.0% 2.9% 3.1% 3.2%
4 2.2% 3.0% 2.0% 3.5% 3.2% 2.4% 3.3% 3.3% 3.1%
5 2.1% 2.9% 2.3% 3.3% 2.7% 2.6% 3.1% 3.2% 2.7%
6 2.1% 2.9% 1.6% 2.9% 3.6% 2.9% 2.9% 2.9% 2.9%
7 2.2% 2.9% 3.3% 2.9% 2.5% 3.0% 2.9% 2.6% 3.1%
8 2.3% 2.8% 2.6% 3.2% 3.3% 2.0% 2.9% 3.1% 3.1%
9 1.8% 2.7% 1.8% 2.4% 2.6% 2.6% 2.7% 2.8% 2.8%
10 1.6% 2.7% 1.6% 2.4% 2.0% 2.6% 2.5% 2.9% 3.0%
11 1.8% 2.7% 2.4% 2.3% 2.3% 2.3% 2.8% 2.9% 2.9%
12 2.2% 2.7% 2.9% 2.8% 2.8% 2.9% 2.7% 2.7% 2.6%
13 2.2% 2.7% 2.0% 3.3% 3.1% 3.0% 2.7% 2.6% 2.3%
14 2.2% 2.6% 2.1% 3.5% 3.1% 2.9% 2.5% 2.5% 2.4%
15 2.1% 2.5% 2.6% 2.8% 2.8% 2.5% 2.7% 2.4% 2.5%
16 1.4% 2.4% 1.3% 1.3% 2.7% 2.0% 2.5% 2.6% 2.6%
17 1.6% 2.4% 1.4% 2.6% 2.3% 2.3% 2.5% 2.4% 2.4%
18 2.2% 2.4% 3.0% 3.0% 2.6% 2.7% 2.3% 2.2% 2.3%
19 2.8% 2.3% 2.5% 4.4% 3.9% 2.6% 2.4% 1.9% 2.1%
20 1.7% 2.0% 1.2% 2.9% 2.3% 2.9% 1.0% 2.4% 1.5%
21 3.0% 1.7% 3.0% 4.8% 4.0% 2.4% 1.8% 1.2% 1.2%
MEDIAN 2.1% 2.7% 2.1% 2.9% 2.8% 2.6% 2.7% 2.7% 2.7%
MEAN 2.1% 2.6% 2.2% 3.0% 2.9% 2.7% 2.6% 2.7% 2.6%
STD DEV 0.4% 0.4% 0.6% 0.7% 0.5% 0.3% 0.5% 0.5% 0.5%
HIGH 3.0% 3.1% 3.3% 4.8% 4.0% 3.2% 3.3% 3.4% 3.2%
LOW 1.4% 1.7% 1.2% 1.3% 2.0% 2.0% 1.0% 1.2% 1.2%
11 Federal Reserve Bank of Chicago - Twenty-Second Annual Automotive Outlook Symposium May 29, 2015
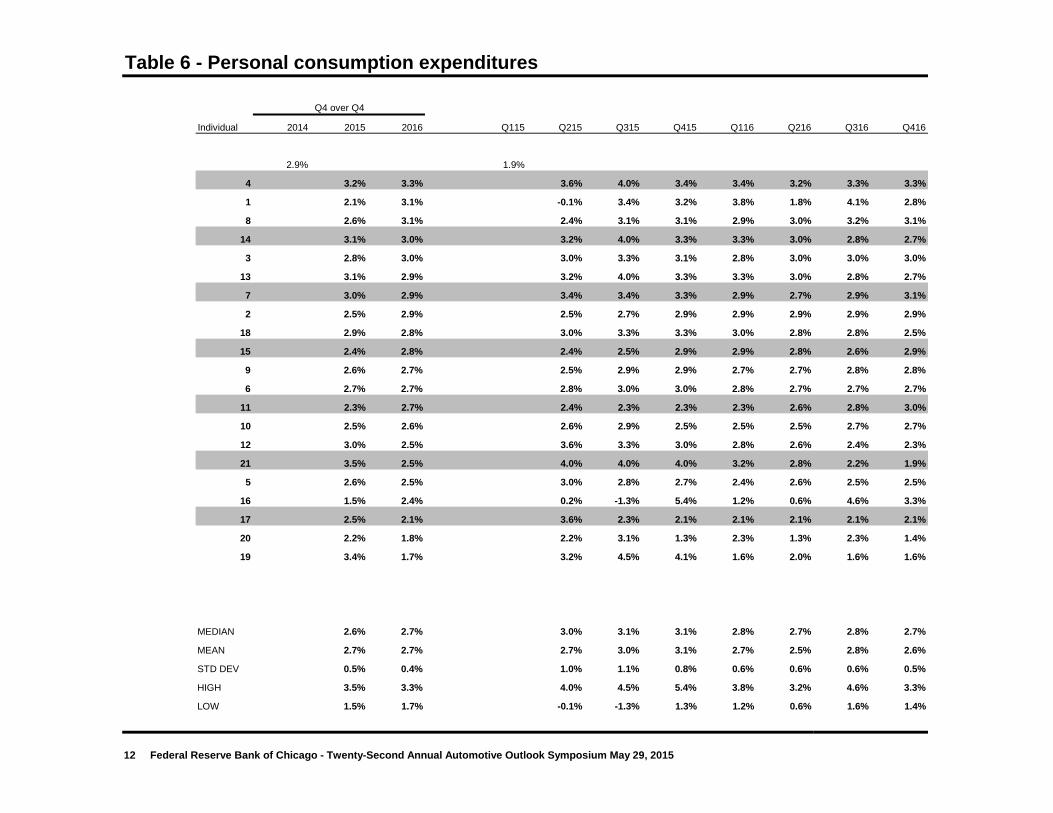
Table 6 - Personal consumption expenditures
Q4 over Q4
Individual 2014 2015 2016 Q115 Q215 Q315 Q415 Q116 Q216 Q316 Q416
2.9% 1.9%
4 3.2% 3.3% 3.6% 4.0% 3.4% 3.4% 3.2% 3.3% 3.3%
1 2.1% 3.1% -0.1% 3.4% 3.2% 3.8% 1.8% 4.1% 2.8%
8 2.6% 3.1% 2.4% 3.1% 3.1% 2.9% 3.0% 3.2% 3.1%
14 3.1% 3.0% 3.2% 4.0% 3.3% 3.3% 3.0% 2.8% 2.7%
3 2.8% 3.0% 3.0% 3.3% 3.1% 2.8% 3.0% 3.0% 3.0%
13 3.1% 2.9% 3.2% 4.0% 3.3% 3.3% 3.0% 2.8% 2.7%
7 3.0% 2.9% 3.4% 3.4% 3.3% 2.9% 2.7% 2.9% 3.1%
2 2.5% 2.9% 2.5% 2.7% 2.9% 2.9% 2.9% 2.9% 2.9%
18 2.9% 2.8% 3.0% 3.3% 3.3% 3.0% 2.8% 2.8% 2.5%
15 2.4% 2.8% 2.4% 2.5% 2.9% 2.9% 2.8% 2.6% 2.9%
9 2.6% 2.7% 2.5% 2.9% 2.9% 2.7% 2.7% 2.8% 2.8%
6 2.7% 2.7% 2.8% 3.0% 3.0% 2.8% 2.7% 2.7% 2.7%
11 2.3% 2.7% 2.4% 2.3% 2.3% 2.3% 2.6% 2.8% 3.0%
10 2.5% 2.6% 2.6% 2.9% 2.5% 2.5% 2.5% 2.7% 2.7%
12 3.0% 2.5% 3.6% 3.3% 3.0% 2.8% 2.6% 2.4% 2.3%
21 3.5% 2.5% 4.0% 4.0% 4.0% 3.2% 2.8% 2.2% 1.9%
5 2.6% 2.5% 3.0% 2.8% 2.7% 2.4% 2.6% 2.5% 2.5%
16 1.5% 2.4% 0.2% -1.3% 5.4% 1.2% 0.6% 4.6% 3.3%
17 2.5% 2.1% 3.6% 2.3% 2.1% 2.1% 2.1% 2.1% 2.1%
20 2.2% 1.8% 2.2% 3.1% 1.3% 2.3% 1.3% 2.3% 1.4%
19 3.4% 1.7% 3.2% 4.5% 4.1% 1.6% 2.0% 1.6% 1.6%
MEDIAN 2.6% 2.7% 3.0% 3.1% 3.1% 2.8% 2.7% 2.8% 2.7%
MEAN 2.7% 2.7% 2.7% 3.0% 3.1% 2.7% 2.5% 2.8% 2.6%
STD DEV 0.5% 0.4% 1.0% 1.1% 0.8% 0.6% 0.6% 0.6% 0.5%
HIGH 3.5% 3.3% 4.0% 4.5% 5.4% 3.8% 3.2% 4.6% 3.3%
LOW 1.5% 1.7% -0.1% -1.3% 1.3% 1.2% 0.6% 1.6% 1.4%
12 Federal Reserve Bank of Chicago - Twenty-Second Annual Automotive Outlook Symposium May 29, 2015

Table 7 - Business fixed investment
Q4 over Q4
Individual 2014 2015 2016 Q115 Q215 Q315 Q415 Q116 Q216 Q316 Q416
6.2% -3.4%
2 3.2% 7.0% 0.5% 8.0% 8.0% 7.0% 7.0% 7.0% 7.0%
3 2.6% 6.8% 2.7% 4.9% 6.5% 7.6% 6.5% 5.6% 7.2%
1 4.0% 6.4% 7.2% 6.3% 6.3% 5.7% 7.3% 7.1% 5.5%
7 2.6% 6.2% 2.4% 5.8% 5.8% 6.0% 6.4% 5.8% 6.9%
6 3.7% 6.1% 3.3% 8.0% 7.3% 5.7% 6.2% 6.4% 6.2%
10 1.8% 6.1% 1.6% 3.6% 5.6% 6.7% 5.7% 5.0% 6.9%
5 3.0% 5.2% 4.6% 5.7% 5.5% 5.8% 4.7% 5.1% 5.3%
17 3.8% 5.0% 9.1% 5.0% 5.0% 5.0% 5.0% 5.0% 5.0%
8 3.1% 4.5% 4.3% 6.2% 5.6% 4.7% 4.3% 4.4% 4.8%
4 1.2% 4.5% -0.7% 3.7% 5.5% 3.6% 4.9% 5.0% 4.6%
9 2.4% 4.1% 3.8% 4.7% 4.6% 4.3% 4.2% 4.0% 3.9%
12 1.9% 3.9% 2.3% 4.5% 4.5% 3.9% 3.9% 3.9% 3.9%
18 2.5% 3.8% 3.0% 5.5% 5.0% 4.4% 4.0% 3.6% 3.4%
15 2.5% 3.8% 4.7% 4.9% 4.2% 4.2% 4.0% 3.6% 3.5%
11 1.9% 3.8% 3.6% 3.7% 3.7% 3.7% 3.6% 3.8% 3.9%
13 1.1% 3.6% -0.5% 3.6% 4.9% 4.6% 4.0% 3.3% 2.7%
14 1.3% 3.4% -0.2% 4.0% 4.9% 4.4% 3.7% 3.0% 2.7%
20 3.5% 3.4% 5.9% 3.3% 8.5% 4.7% 3.3% 2.9% 2.9%
19 1.4% 2.2% 0.4% 6.1% 2.8% 4.1% 1.6% 1.6% 1.6%
21 4.1% 0.4% 3.0% 11.6% 5.5% 1.2% 1.9% 0.1% -1.6%
16 -2.3% -0.1% -17.2% 20.2% -5.3% 7.1% 5.6% -2.9% -9.3%
MEDIAN 2.5% 4.1% 3.0% 5.0% 5.5% 4.7% 4.3% 4.0% 3.9%
MEAN 2.3% 4.3% 2.1% 6.2% 5.0% 5.0% 4.6% 4.0% 3.7%
STD DEV 1.4% 1.8% 4.9% 3.7% 2.6% 1.4% 1.5% 2.3% 3.6%
HIGH 4.1% 7.0% 9.1% 20.2% 8.5% 7.6% 7.3% 7.1% 7.2%
LOW -2.3% -0.1% -17.2% 3.3% -5.3% 1.2% 1.6% -2.9% -9.3%
13 Federal Reserve Bank of Chicago - Twenty-Second Annual Automotive Outlook Symposium May 29, 2015

Table 8 - Residential investment
Q4 over Q4
Individual 2014 2015 2016 Q115 Q215 Q315 Q415 Q116 Q216 Q316 Q416
2.5% 1.3%
13 5.7% 15.7% 2.0% 7.8% 12.1% 19.5% 15.6% 15.9% 12.0%
4 7.3% 14.9% 4.3% 11.9% 12.3% 16.0% 12.3% 16.4% 15.0%
14 7.0% 13.0% 6.3% 11.8% 8.7% 13.8% 11.9% 13.9% 12.3%
3 10.0% 12.8% 11.8% 16.3% 11.0% 15.0% 11.8% 11.4% 12.9%
8 10.5% 12.5% 7.9% 17.5% 15.9% 13.3% 12.4% 12.5% 11.7%
10 8.5% 11.4% 10.6% 13.9% 8.5% 12.6% 10.1% 10.7% 12.4%
21 6.3% 10.6% 2.1% 9.0% 13.2% 15.8% 9.5% 10.3% 6.9%
15 8.4% 10.2% 1.7% 13.2% 18.3% 14.2% 7.5% 9.9% 9.4%
12 5.9% 9.0% 7.5% 7.5% 7.5% 9.0% 9.0% 9.0% 9.0%
6 6.1% 9.0% 6.0% 8.5% 9.0% 9.0% 9.0% 9.0% 9.0%
5 11.1% 8.5% 9.0% 20.0% 15.0% 10.0% 8.0% 8.0% 8.0%
7 10.5% 7.5% 18.9% 19.1% 4.1% 18.6% 4.2% 3.2% 4.7%
2 5.3% 7.0% 5.0% 8.0% 7.0% 7.0% 7.0% 7.0% 7.0%
11 5.6% 6.9% 6.6% 7.4% 7.3% 7.4% 7.1% 6.2% 6.9%
9 3.8% 6.1% 3.4% 4.9% 5.7% 6.1% 6.2% 6.1% 5.9%
1 11.1% 4.4% 12.7% 15.0% 15.9% 12.1% 10.4% 3.4% -7.4%
20 4.0% 3.9% 10.3% 3.1% 1.5% 1.3% 1.8% 8.2% 4.6%
17 2.8% 3.5% 6.0% 2.0% 2.0% 2.0% 2.0% 5.0% 5.0%
18 5.5% 3.2% 7.4% 7.2% 6.2% 4.6% 4.5% 0.7% 3.0%
19 4.4% 1.4% 8.2% 4.5% 3.6% 3.2% 4.5% 0.0% -2.0%
16 4.3% 1.4% 13.1% -33.1% 54.6% -28.7% 16.6% -2.2% 30.0%
MEDIAN 6.1% 8.5% 7.4% 8.5% 8.7% 10.0% 9.0% 8.2% 8.0%
MEAN 6.9% 8.2% 7.7% 8.4% 11.4% 8.7% 8.6% 7.8% 8.4%
STD DEV 2.5% 4.2% 4.1% 10.6% 10.7% 9.8% 3.9% 4.9% 7.0%
HIGH 11.1% 15.7% 18.9% 20.0% 54.6% 19.5% 16.6% 16.4% 30.0%
LOW 2.8% 1.4% 1.7% -33.1% 1.5% -28.7% 1.8% -2.2% -7.4%
14 Federal Reserve Bank of Chicago - Twenty-Second Annual Automotive Outlook Symposium May 29, 2015
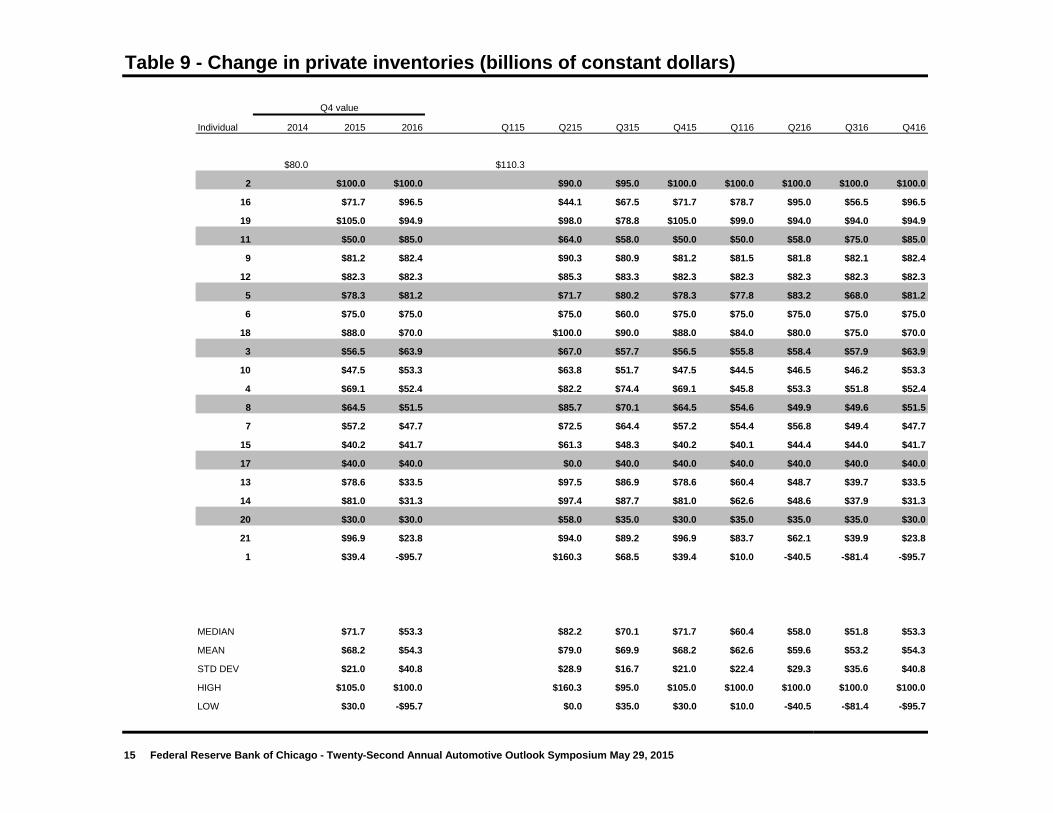
Table 9 - Change in private inventories (billions of constant dollars)
Q4 value
Individual 2014 2015 2016 Q115 Q215 Q315 Q415 Q116 Q216 Q316 Q416
$80.0 $110.3
2 $100.0 $100.0 $90.0 $95.0 $100.0 $100.0 $100.0 $100.0 $100.0
16 $71.7 $96.5 $44.1 $67.5 $71.7 $78.7 $95.0 $56.5 $96.5
19 $105.0 $94.9 $98.0 $78.8 $105.0 $99.0 $94.0 $94.0 $94.9
11 $50.0 $85.0 $64.0 $58.0 $50.0 $50.0 $58.0 $75.0 $85.0
9 $81.2 $82.4 $90.3 $80.9 $81.2 $81.5 $81.8 $82.1 $82.4
12 $82.3 $82.3 $85.3 $83.3 $82.3 $82.3 $82.3 $82.3 $82.3
5 $78.3 $81.2 $71.7 $80.2 $78.3 $77.8 $83.2 $68.0 $81.2
6 $75.0 $75.0 $75.0 $60.0 $75.0 $75.0 $75.0 $75.0 $75.0
18 $88.0 $70.0 $100.0 $90.0 $88.0 $84.0 $80.0 $75.0 $70.0
3 $56.5 $63.9 $67.0 $57.7 $56.5 $55.8 $58.4 $57.9 $63.9
10 $47.5 $53.3 $63.8 $51.7 $47.5 $44.5 $46.5 $46.2 $53.3
4 $69.1 $52.4 $82.2 $74.4 $69.1 $45.8 $53.3 $51.8 $52.4
8 $64.5 $51.5 $85.7 $70.1 $64.5 $54.6 $49.9 $49.6 $51.5
7 $57.2 $47.7 $72.5 $64.4 $57.2 $54.4 $56.8 $49.4 $47.7
15 $40.2 $41.7 $61.3 $48.3 $40.2 $40.1 $44.4 $44.0 $41.7
17 $40.0 $40.0 $0.0 $40.0 $40.0 $40.0 $40.0 $40.0 $40.0
13 $78.6 $33.5 $97.5 $86.9 $78.6 $60.4 $48.7 $39.7 $33.5
14 $81.0 $31.3 $97.4 $87.7 $81.0 $62.6 $48.6 $37.9 $31.3
20 $30.0 $30.0 $58.0 $35.0 $30.0 $35.0 $35.0 $35.0 $30.0
21 $96.9 $23.8 $94.0 $89.2 $96.9 $83.7 $62.1 $39.9 $23.8
1 $39.4 -$95.7 $160.3 $68.5 $39.4 $10.0 -$40.5 -$81.4 -$95.7
MEDIAN $71.7 $53.3 $82.2 $70.1 $71.7 $60.4 $58.0 $51.8 $53.3
MEAN $68.2 $54.3 $79.0 $69.9 $68.2 $62.6 $59.6 $53.2 $54.3
STD DEV $21.0 $40.8 $28.9 $16.7 $21.0 $22.4 $29.3 $35.6 $40.8
HIGH $105.0 $100.0 $160.3 $95.0 $105.0 $100.0 $100.0 $100.0 $100.0
LOW $30.0 -$95.7 $0.0 $35.0 $30.0 $10.0 -$40.5 -$81.4 -$95.7
15 Federal Reserve Bank of Chicago - Twenty-Second Annual Automotive Outlook Symposium May 29, 2015

Table 10 - Net exports of goods and services (billions of constant dollars)
Q4 value
Individual 2014 2015 2016 Q115 Q215 Q315 Q415 Q116 Q216 Q316 Q416
-$471.4 -$522.1
16 -$488.8 -$446.7 -$483.0 -$489.2 -$488.8 -$483.5 -$441.2 -$485.3 -$446.7
19 -$525.0 -$450.0 -$530.0 -$510.0 -$525.0 -$500.0 -$480.0 -$470.0 -$450.0
1 -$558.3 -$501.3 -$542.9 -$567.4 -$558.3 -$558.2 -$520.3 -$514.8 -$501.3
11 -$450.0 -$525.0 -$420.0 -$440.0 -$450.0 -$480.0 -$490.0 -$510.0 -$525.0
12 -$533.7 -$531.1 -$510.9 -$525.1 -$533.7 -$534.4 -$535.1 -$533.1 -$531.1
21 -$513.4 -$534.7 -$518.7 -$505.5 -$513.4 -$520.0 -$528.8 -$538.8 -$534.7
14 -$512.1 -$537.2 -$519.2 -$513.5 -$512.1 -$511.2 -$516.9 -$525.0 -$537.2
13 -$509.2 -$539.0 -$518.6 -$511.2 -$509.2 -$509.3 -$516.7 -$526.1 -$539.0
20 -$520.4 -$544.0 -$538.9 -$519.6 -$520.4 -$511.5 -$539.2 -$540.1 -$544.0
17 -$546.4 -$554.6 -$510.9 -$543.7 -$546.4 -$549.1 -$546.5 -$550.5 -$554.6
8 -$521.1 -$569.7 -$505.0 -$511.0 -$521.1 -$521.2 -$532.5 -$549.4 -$569.7
5 -$558.4 -$571.8 -$529.3 -$549.5 -$558.4 -$572.6 -$574.5 -$562.3 -$571.8
4 -$525.0 -$575.4 -$520.1 -$518.4 -$525.0 -$539.5 -$547.7 -$557.7 -$575.4
9 -$559.5 -$579.3 -$528.5 -$542.7 -$559.5 -$570.1 -$575.8 -$577.6 -$579.3
15 -$549.2 -$586.0 -$515.7 -$529.6 -$549.2 -$553.2 -$558.8 -$570.9 -$586.0
10 -$571.0 -$614.7 -$519.2 -$544.2 -$571.0 -$583.7 -$597.1 -$603.2 -$614.7
2 -$566.5 -$622.4 -$529.9 -$548.1 -$566.5 -$580.1 -$593.9 -$608.0 -$622.4
6 -$556.2 -$633.2 -$525.5 -$540.2 -$556.2 -$572.2 -$590.2 -$611.0 -$633.2
18 -$575.0 -$645.0 -$530.0 -$545.0 -$575.0 -$590.0 -$615.0 -$635.0 -$645.0
3 -$584.6 -$650.5 -$520.9 -$551.5 -$584.6 -$604.3 -$623.7 -$635.2 -$650.5
7 -$610.1 -$672.3 -$552.0 -$582.9 -$610.1 -$630.2 -$645.3 -$658.4 -$672.3
MEDIAN -$546.4 -$569.7 -$520.1 -$529.6 -$546.4 -$549.1 -$546.5 -$550.5 -$569.7
MEAN -$539.7 -$565.9 -$517.6 -$528.0 -$539.7 -$546.4 -$550.9 -$560.1 -$565.9
STD DEV $34.9 $59.1 $25.9 $29.4 $34.9 $39.5 $49.0 $49.1 $59.1
HIGH -$450.0 -$446.7 -$420.0 -$440.0 -$450.0 -$480.0 -$441.2 -$470.0 -$446.7
LOW -$610.1 -$672.3 -$552.0 -$582.9 -$610.1 -$630.2 -$645.3 -$658.4 -$672.3
16 Federal Reserve Bank of Chicago - Twenty-Second Annual Automotive Outlook Symposium May 29, 2015
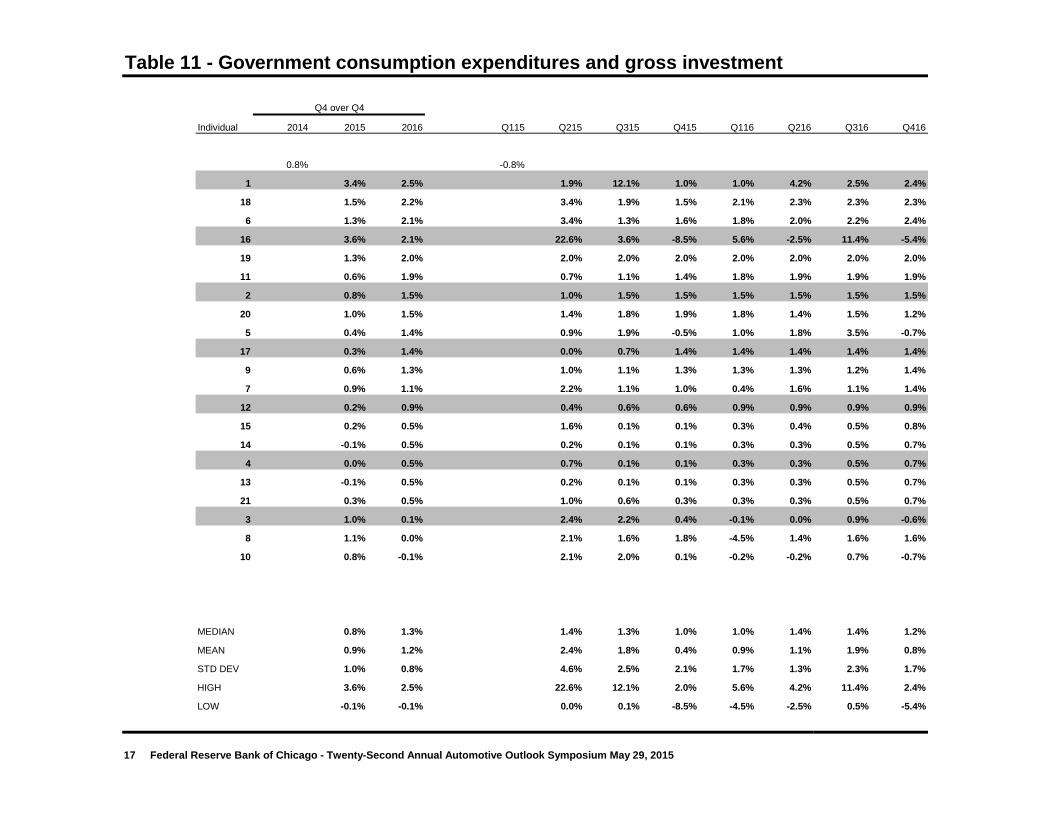
Table 11 - Government consumption expenditures and gross investment
Q4 over Q4
Individual 2014 2015 2016 Q115 Q215 Q315 Q415 Q116 Q216 Q316 Q416
0.8% -0.8%
1 3.4% 2.5% 1.9% 12.1% 1.0% 1.0% 4.2% 2.5% 2.4%
18 1.5% 2.2% 3.4% 1.9% 1.5% 2.1% 2.3% 2.3% 2.3%
6 1.3% 2.1% 3.4% 1.3% 1.6% 1.8% 2.0% 2.2% 2.4%
16 3.6% 2.1% 22.6% 3.6% -8.5% 5.6% -2.5% 11.4% -5.4%
19 1.3% 2.0% 2.0% 2.0% 2.0% 2.0% 2.0% 2.0% 2.0%
11 0.6% 1.9% 0.7% 1.1% 1.4% 1.8% 1.9% 1.9% 1.9%
2 0.8% 1.5% 1.0% 1.5% 1.5% 1.5% 1.5% 1.5% 1.5%
20 1.0% 1.5% 1.4% 1.8% 1.9% 1.8% 1.4% 1.5% 1.2%
5 0.4% 1.4% 0.9% 1.9% -0.5% 1.0% 1.8% 3.5% -0.7%
17 0.3% 1.4% 0.0% 0.7% 1.4% 1.4% 1.4% 1.4% 1.4%
9 0.6% 1.3% 1.0% 1.1% 1.3% 1.3% 1.3% 1.2% 1.4%
7 0.9% 1.1% 2.2% 1.1% 1.0% 0.4% 1.6% 1.1% 1.4%
12 0.2% 0.9% 0.4% 0.6% 0.6% 0.9% 0.9% 0.9% 0.9%
15 0.2% 0.5% 1.6% 0.1% 0.1% 0.3% 0.4% 0.5% 0.8%
14 -0.1% 0.5% 0.2% 0.1% 0.1% 0.3% 0.3% 0.5% 0.7%
4 0.0% 0.5% 0.7% 0.1% 0.1% 0.3% 0.3% 0.5% 0.7%
13 -0.1% 0.5% 0.2% 0.1% 0.1% 0.3% 0.3% 0.5% 0.7%
21 0.3% 0.5% 1.0% 0.6% 0.3% 0.3% 0.3% 0.5% 0.7%
3 1.0% 0.1% 2.4% 2.2% 0.4% -0.1% 0.0% 0.9% -0.6%
8 1.1% 0.0% 2.1% 1.6% 1.8% -4.5% 1.4% 1.6% 1.6%
10 0.8% -0.1% 2.1% 2.0% 0.1% -0.2% -0.2% 0.7% -0.7%
MEDIAN 0.8% 1.3% 1.4% 1.3% 1.0% 1.0% 1.4% 1.4% 1.2%
MEAN 0.9% 1.2% 2.4% 1.8% 0.4% 0.9% 1.1% 1.9% 0.8%
STD DEV 1.0% 0.8% 4.6% 2.5% 2.1% 1.7% 1.3% 2.3% 1.7%
HIGH 3.6% 2.5% 22.6% 12.1% 2.0% 5.6% 4.2% 11.4% 2.4%
LOW -0.1% -0.1% 0.0% 0.1% -8.5% -4.5% -2.5% 0.5% -5.4%
17 Federal Reserve Bank of Chicago - Twenty-Second Annual Automotive Outlook Symposium May 29, 2015
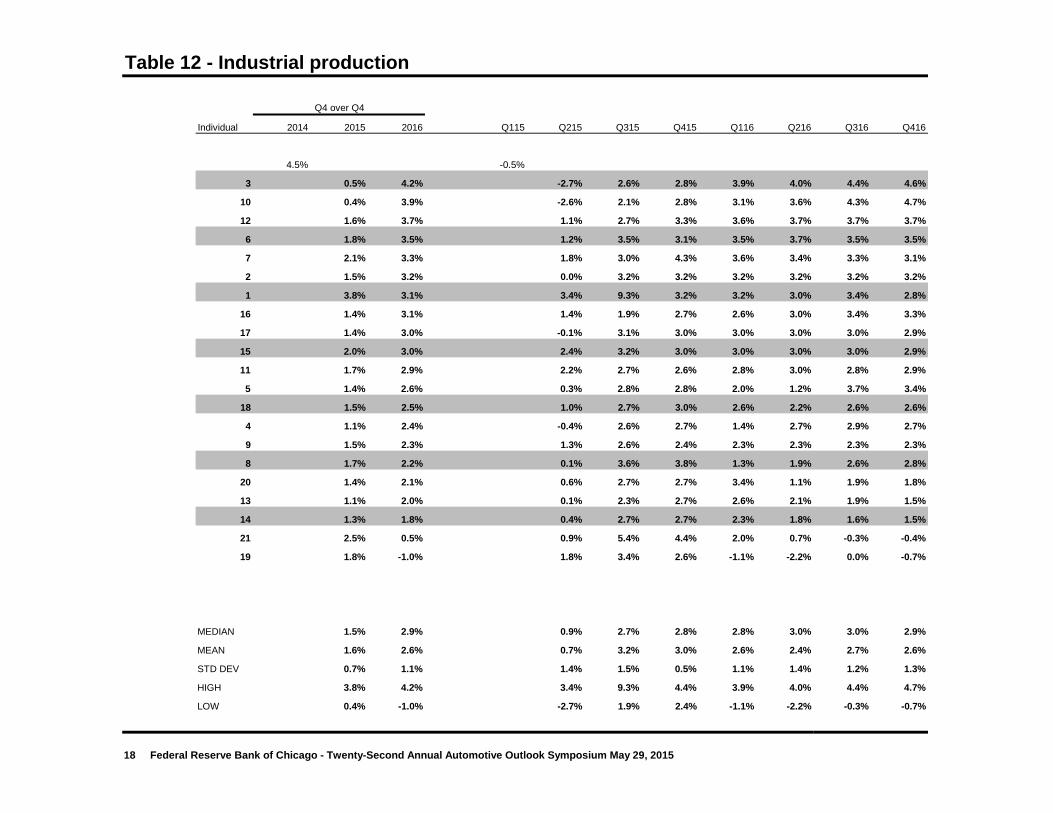
Table 12 - Industrial production
Q4 over Q4
Individual 2014 2015 2016 Q115 Q215 Q315 Q415 Q116 Q216 Q316 Q416
4.5% -0.5%
3 0.5% 4.2% -2.7% 2.6% 2.8% 3.9% 4.0% 4.4% 4.6%
10 0.4% 3.9% -2.6% 2.1% 2.8% 3.1% 3.6% 4.3% 4.7%
12 1.6% 3.7% 1.1% 2.7% 3.3% 3.6% 3.7% 3.7% 3.7%
6 1.8% 3.5% 1.2% 3.5% 3.1% 3.5% 3.7% 3.5% 3.5%
7 2.1% 3.3% 1.8% 3.0% 4.3% 3.6% 3.4% 3.3% 3.1%
2 1.5% 3.2% 0.0% 3.2% 3.2% 3.2% 3.2% 3.2% 3.2%
1 3.8% 3.1% 3.4% 9.3% 3.2% 3.2% 3.0% 3.4% 2.8%
16 1.4% 3.1% 1.4% 1.9% 2.7% 2.6% 3.0% 3.4% 3.3%
17 1.4% 3.0% -0.1% 3.1% 3.0% 3.0% 3.0% 3.0% 2.9%
15 2.0% 3.0% 2.4% 3.2% 3.0% 3.0% 3.0% 3.0% 2.9%
11 1.7% 2.9% 2.2% 2.7% 2.6% 2.8% 3.0% 2.8% 2.9%
5 1.4% 2.6% 0.3% 2.8% 2.8% 2.0% 1.2% 3.7% 3.4%
18 1.5% 2.5% 1.0% 2.7% 3.0% 2.6% 2.2% 2.6% 2.6%
4 1.1% 2.4% -0.4% 2.6% 2.7% 1.4% 2.7% 2.9% 2.7%
9 1.5% 2.3% 1.3% 2.6% 2.4% 2.3% 2.3% 2.3% 2.3%
8 1.7% 2.2% 0.1% 3.6% 3.8% 1.3% 1.9% 2.6% 2.8%
20 1.4% 2.1% 0.6% 2.7% 2.7% 3.4% 1.1% 1.9% 1.8%
13 1.1% 2.0% 0.1% 2.3% 2.7% 2.6% 2.1% 1.9% 1.5%
14 1.3% 1.8% 0.4% 2.7% 2.7% 2.3% 1.8% 1.6% 1.5%
21 2.5% 0.5% 0.9% 5.4% 4.4% 2.0% 0.7% -0.3% -0.4%
19 1.8% -1.0% 1.8% 3.4% 2.6% -1.1% -2.2% 0.0% -0.7%
MEDIAN 1.5% 2.9% 0.9% 2.7% 2.8% 2.8% 3.0% 3.0% 2.9%
MEAN 1.6% 2.6% 0.7% 3.2% 3.0% 2.6% 2.4% 2.7% 2.6%
STD DEV 0.7% 1.1% 1.4% 1.5% 0.5% 1.1% 1.4% 1.2% 1.3%
HIGH 3.8% 4.2% 3.4% 9.3% 4.4% 3.9% 4.0% 4.4% 4.7%
LOW 0.4% -1.0% -2.7% 1.9% 2.4% -1.1% -2.2% -0.3% -0.7%
18 Federal Reserve Bank of Chicago - Twenty-Second Annual Automotive Outlook Symposium May 29, 2015
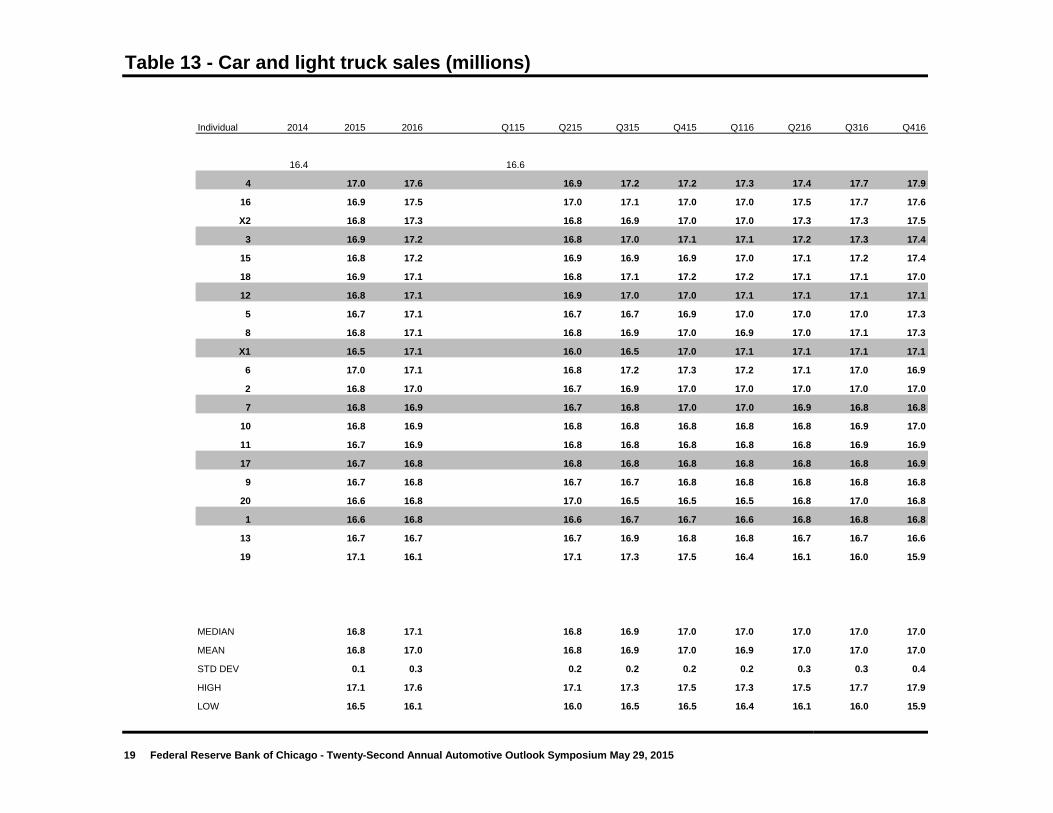
Table 13 - Car and light truck sales (millions)
Individual 2014 2015 2016 Q115 Q215 Q315 Q415 Q116 Q216 Q316 Q416
16.4 16.6
4 17.0 17.6 16.9 17.2 17.2 17.3 17.4 17.7 17.9
16 16.9 17.5 17.0 17.1 17.0 17.0 17.5 17.7 17.6
X2 16.8 17.3 16.8 16.9 17.0 17.0 17.3 17.3 17.5
3 16.9 17.2 16.8 17.0 17.1 17.1 17.2 17.3 17.4
15 16.8 17.2 16.9 16.9 16.9 17.0 17.1 17.2 17.4
18 16.9 17.1 16.8 17.1 17.2 17.2 17.1 17.1 17.0
12 16.8 17.1 16.9 17.0 17.0 17.1 17.1 17.1 17.1
5 16.7 17.1 16.7 16.7 16.9 17.0 17.0 17.0 17.3
8 16.8 17.1 16.8 16.9 17.0 16.9 17.0 17.1 17.3
X1 16.5 17.1 16.0 16.5 17.0 17.1 17.1 17.1 17.1
6 17.0 17.1 16.8 17.2 17.3 17.2 17.1 17.0 16.9
2 16.8 17.0 16.7 16.9 17.0 17.0 17.0 17.0 17.0
7 16.8 16.9 16.7 16.8 17.0 17.0 16.9 16.8 16.8
10 16.8 16.9 16.8 16.8 16.8 16.8 16.8 16.9 17.0
11 16.7 16.9 16.8 16.8 16.8 16.8 16.8 16.9 16.9
17 16.7 16.8 16.8 16.8 16.8 16.8 16.8 16.8 16.9
9 16.7 16.8 16.7 16.7 16.8 16.8 16.8 16.8 16.8
20 16.6 16.8 17.0 16.5 16.5 16.5 16.8 17.0 16.8
1 16.6 16.8 16.6 16.7 16.7 16.6 16.8 16.8 16.8
13 16.7 16.7 16.7 16.9 16.8 16.8 16.7 16.7 16.6
19 17.1 16.1 17.1 17.3 17.5 16.4 16.1 16.0 15.9
MEDIAN 16.8 17.1 16.8 16.9 17.0 17.0 17.0 17.0 17.0
MEAN 16.8 17.0 16.8 16.9 17.0 16.9 17.0 17.0 17.0
STD DEV 0.1 0.3 0.2 0.2 0.2 0.2 0.3 0.3 0.4
HIGH 17.1 17.6 17.1 17.3 17.5 17.3 17.5 17.7 17.9
LOW 16.5 16.1 16.0 16.5 16.5 16.4 16.1 16.0 15.9
19 Federal Reserve Bank of Chicago - Twenty-Second Annual Automotive Outlook Symposium May 29, 2015

Table 14 - Housing starts (millions)
Individual 2014 2015 2016 Q115 Q215 Q315 Q415 Q116 Q216 Q316 Q416
1.00 0.97
13 1.08 1.33 1.06 1.11 1.17 1.24 1.31 1.37 1.41
4 1.09 1.33 1.08 1.13 1.19 1.23 1.29 1.37 1.44
8 1.12 1.32 1.11 1.18 1.23 1.26 1.30 1.35 1.39
18 1.12 1.32 1.08 1.18 1.25 1.32 1.33 1.32 1.30
14 1.10 1.31 1.11 1.14 1.17 1.23 1.28 1.33 1.39
3 1.08 1.30 1.04 1.13 1.18 1.23 1.27 1.31 1.39
12 1.10 1.30 1.08 1.13 1.20 1.30 1.30 1.30 1.30
15 1.13 1.29 1.08 1.20 1.25 1.16 1.30 1.33 1.37
21 1.08 1.25 1.06 1.12 1.18 1.21 1.24 1.28 1.29
11 1.11 1.24 1.10 1.15 1.20 1.20 1.26 1.30 1.20
6 1.14 1.23 1.13 1.21 1.24 1.20 1.23 1.23 1.24
7 1.11 1.19 1.14 1.15 1.18 1.20 1.18 1.19 1.20
10 1.09 1.19 1.10 1.13 1.16 1.12 1.19 1.23 1.22
2 1.05 1.19 1.05 1.08 1.11 1.15 1.18 1.20 1.22
19 1.09 1.18 1.04 1.15 1.19 1.20 1.25 1.15 1.11
16 1.09 1.17 1.11 1.12 1.14 1.15 1.16 1.18 1.19
1 1.02 1.13 1.00 1.03 1.06 1.09 1.12 1.15 1.18
5 1.06 1.09 1.09 1.09 1.09 1.09 1.09 1.09 1.09
20 0.97 1.09 0.95 0.98 0.99 1.04 1.22 1.10 1.00
9 0.99 1.05 0.98 1.01 1.01 1.03 1.04 1.06 1.07
17 0.98 1.01 0.98 0.99 0.99 1.00 1.00 1.01 1.02
MEDIAN 1.09 1.23 1.08 1.13 1.18 1.20 1.24 1.23 1.22
MEAN 1.08 1.21 1.06 1.11 1.15 1.17 1.22 1.23 1.24
STD DEV 0.05 0.10 0.05 0.06 0.08 0.09 0.09 0.10 0.13
HIGH 1.14 1.33 1.14 1.21 1.25 1.32 1.33 1.37 1.44
LOW 0.97 1.01 0.95 0.98 0.99 1.00 1.00 1.01 1.00
20 Federal Reserve Bank of Chicago - Twenty-Second Annual Automotive Outlook Symposium May 29, 2015
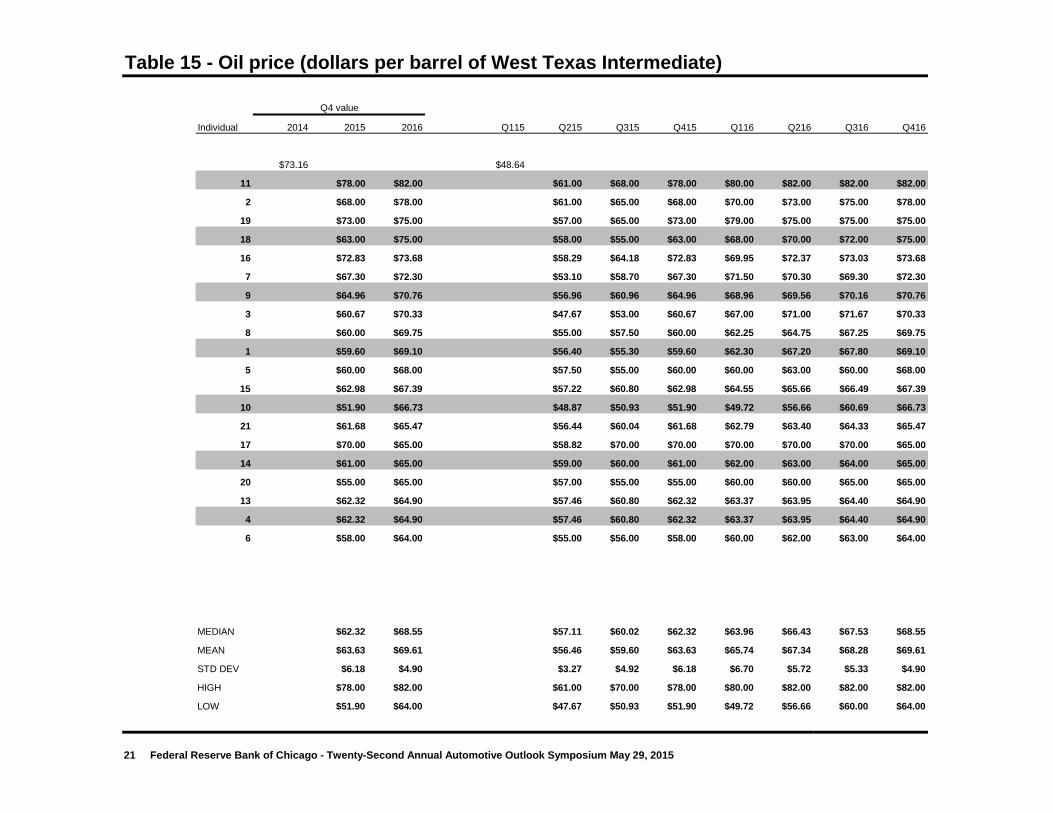
Table 15 - Oil price (dollars per barrel of West Texas Intermediate)
Q4 value
Individual 2014 2015 2016 Q115 Q215 Q315 Q415 Q116 Q216 Q316 Q416
$73.16 $48.64
11 $78.00 $82.00 $61.00 $68.00 $78.00 $80.00 $82.00 $82.00 $82.00
2 $68.00 $78.00 $61.00 $65.00 $68.00 $70.00 $73.00 $75.00 $78.00
19 $73.00 $75.00 $57.00 $65.00 $73.00 $79.00 $75.00 $75.00 $75.00
18 $63.00 $75.00 $58.00 $55.00 $63.00 $68.00 $70.00 $72.00 $75.00
16 $72.83 $73.68 $58.29 $64.18 $72.83 $69.95 $72.37 $73.03 $73.68
7 $67.30 $72.30 $53.10 $58.70 $67.30 $71.50 $70.30 $69.30 $72.30
9 $64.96 $70.76 $56.96 $60.96 $64.96 $68.96 $69.56 $70.16 $70.76
3 $60.67 $70.33 $47.67 $53.00 $60.67 $67.00 $71.00 $71.67 $70.33
8 $60.00 $69.75 $55.00 $57.50 $60.00 $62.25 $64.75 $67.25 $69.75
1 $59.60 $69.10 $56.40 $55.30 $59.60 $62.30 $67.20 $67.80 $69.10
5 $60.00 $68.00 $57.50 $55.00 $60.00 $60.00 $63.00 $60.00 $68.00
15 $62.98 $67.39 $57.22 $60.80 $62.98 $64.55 $65.66 $66.49 $67.39
10 $51.90 $66.73 $48.87 $50.93 $51.90 $49.72 $56.66 $60.69 $66.73
21 $61.68 $65.47 $56.44 $60.04 $61.68 $62.79 $63.40 $64.33 $65.47
17 $70.00 $65.00 $58.82 $70.00 $70.00 $70.00 $70.00 $70.00 $65.00
14 $61.00 $65.00 $59.00 $60.00 $61.00 $62.00 $63.00 $64.00 $65.00
20 $55.00 $65.00 $57.00 $55.00 $55.00 $60.00 $60.00 $65.00 $65.00
13 $62.32 $64.90 $57.46 $60.80 $62.32 $63.37 $63.95 $64.40 $64.90
4 $62.32 $64.90 $57.46 $60.80 $62.32 $63.37 $63.95 $64.40 $64.90
6 $58.00 $64.00 $55.00 $56.00 $58.00 $60.00 $62.00 $63.00 $64.00
MEDIAN $62.32 $68.55 $57.11 $60.02 $62.32 $63.96 $66.43 $67.53 $68.55
MEAN $63.63 $69.61 $56.46 $59.60 $63.63 $65.74 $67.34 $68.28 $69.61
STD DEV $6.18 $4.90 $3.27 $4.92 $6.18 $6.70 $5.72 $5.33 $4.90
HIGH $78.00 $82.00 $61.00 $70.00 $78.00 $80.00 $82.00 $82.00 $82.00
LOW $51.90 $64.00 $47.67 $50.93 $51.90 $49.72 $56.66 $60.00 $64.00
21 Federal Reserve Bank of Chicago - Twenty-Second Annual Automotive Outlook Symposium May 29, 2015

Table 16 - Unemployment rate
Q4 value
Individual 2014 2015 2016 Q115 Q215 Q315 Q415 Q116 Q216 Q316 Q416
5.7% 5.6%
16 5.6% 5.5% 5.6% 5.7% 5.6% 5.6% 5.6% 5.5% 5.5%
12 5.3% 5.3% 5.5% 5.4% 5.3% 5.3% 5.3% 5.3% 5.3%
19 5.0% 5.3% 5.4% 5.2% 5.0% 4.9% 5.0% 5.3% 5.3%
8 5.1% 5.2% 5.4% 5.2% 5.1% 5.2% 5.3% 5.3% 5.2%
17 5.1% 5.2% 5.3% 5.1% 5.1% 5.1% 5.1% 5.1% 5.2%
1 5.3% 5.2% 5.4% 5.4% 5.3% 5.3% 5.2% 5.2% 5.2%
21 4.9% 5.2% 5.4% 5.1% 4.9% 4.9% 4.9% 5.0% 5.2%
7 5.4% 5.1% 5.5% 5.4% 5.4% 5.3% 5.2% 5.2% 5.1%
15 5.2% 5.1% 5.4% 5.3% 5.2% 5.2% 5.2% 5.1% 5.1%
11 5.3% 5.1% 5.4% 5.3% 5.3% 5.3% 5.2% 5.1% 5.1%
5 5.2% 5.0% 5.3% 5.2% 5.2% 5.1% 5.0% 5.0% 5.0%
10 5.3% 5.0% 5.4% 5.3% 5.3% 5.2% 5.1% 5.1% 5.0%
3 5.3% 5.0% 5.4% 5.3% 5.3% 5.2% 5.1% 5.0% 5.0%
9 5.2% 4.9% 5.4% 5.3% 5.2% 5.1% 5.0% 5.0% 4.9%
13 5.0% 4.9% 5.3% 5.1% 5.0% 5.0% 4.9% 4.9% 4.9%
14 5.0% 4.9% 5.3% 5.1% 5.0% 4.9% 4.9% 4.9% 4.9%
6 5.2% 4.8% 5.4% 5.3% 5.2% 5.1% 5.0% 4.9% 4.8%
4 5.0% 4.8% 5.3% 5.1% 5.0% 5.0% 4.9% 4.8% 4.8%
2 5.0% 4.6% 5.3% 5.1% 5.0% 4.9% 4.8% 4.7% 4.6%
20 5.0% 4.5% 5.4% 5.2% 5.0% 4.8% 4.7% 4.7% 4.5%
18 5.0% 4.5% 5.4% 5.2% 5.0% 4.8% 4.8% 4.5% 4.5%
MEDIAN 5.2% 5.0% 5.4% 5.2% 5.2% 5.1% 5.0% 5.0% 5.0%
MEAN 5.2% 5.0% 5.4% 5.3% 5.2% 5.1% 5.1% 5.0% 5.0%
STD DEV 0.2% 0.3% 0.1% 0.1% 0.2% 0.2% 0.2% 0.2% 0.3%
HIGH 5.6% 5.5% 5.6% 5.7% 5.6% 5.6% 5.6% 5.5% 5.5%
LOW 4.9% 4.5% 5.3% 5.1% 4.9% 4.8% 4.7% 4.5% 4.5%
22 Federal Reserve Bank of Chicago - Twenty-Second Annual Automotive Outlook Symposium May 29, 2015

Table 17 - Inflation rate (consumer price index)
Q4 over Q4
Individual 2014 2015 2016 Q115 Q215 Q315 Q415 Q116 Q216 Q316 Q416
1.2% -3.1%
2 0.4% 2.6% 0.0% 2.4% 2.4% 2.4% 2.4% 2.8% 2.8%
10 0.1% 2.6% 0.9% 1.4% 1.1% 1.6% 2.9% 2.9% 2.9%
3 0.1% 2.5% 1.0% 1.5% 1.2% 1.6% 2.9% 2.8% 2.8%
7 0.3% 2.5% -0.5% 1.8% 2.9% 1.6% 2.8% 2.8% 2.9%
11 0.8% 2.4% 2.0% 2.1% 2.1% 2.3% 2.4% 2.4% 2.4%
12 0.7% 2.3% 2.2% 1.9% 2.0% 2.2% 2.3% 2.3% 2.3%
6 1.0% 2.3% 2.8% 2.2% 2.2% 2.1% 2.2% 2.3% 2.4%
17 0.5% 2.2% 2.0% 1.6% 1.6% 2.1% 2.3% 2.3% 2.3%
21 1.3% 2.2% 2.3% 3.9% 2.1% 2.2% 2.3% 2.2% 2.2%
15 1.0% 2.2% 2.1% 2.7% 2.3% 2.2% 2.3% 2.2% 2.2%
1 -0.3% 2.2% -0.1% 0.0% 1.8% 2.2% 2.1% 2.1% 2.3%
8 0.4% 2.2% 3.9% 1.2% -0.2% 3.0% 4.2% 1.3% 0.1%
18 1.0% 2.1% 2.3% 2.5% 2.3% 2.0% 2.0% 2.3% 2.3%
4 1.1% 2.1% 2.1% 3.4% 2.2% 2.2% 2.2% 2.1% 2.1%
13 1.1% 2.1% 2.1% 3.4% 2.3% 2.1% 2.1% 2.1% 2.1%
14 1.1% 2.1% 2.1% 3.2% 2.3% 2.1% 2.1% 2.1% 2.0%
16 0.8% 2.0% 2.1% 2.1% 2.0% 2.0% 2.0% 2.0% 2.0%
5 0.5% 2.0% 1.9% 1.4% 1.7% 1.8% 1.9% 2.0% 2.1%
9 0.3% 1.8% 0.6% 2.0% 1.8% 2.0% 1.7% 1.7% 1.9%
19 0.7% 1.7% 2.2% 1.8% 1.9% 1.9% 2.0% 1.5% 1.5%
20 0.7% 1.6% 0.9% 1.9% 3.3% 1.3% 1.4% 1.7% 2.0%
MEDIAN 0.7% 2.2% 2.1% 2.0% 2.1% 2.1% 2.2% 2.2% 2.2%
MEAN 0.6% 2.2% 1.7% 2.1% 2.0% 2.0% 2.3% 2.2% 2.2%
STD DEV 0.4% 0.3% 1.0% 0.9% 0.7% 0.3% 0.6% 0.4% 0.6%
HIGH 1.3% 2.6% 3.9% 3.9% 3.3% 3.0% 4.2% 2.9% 2.9%
LOW -0.3% 1.6% -0.5% 0.0% -0.2% 1.3% 1.4% 1.3% 0.1%
23 Federal Reserve Bank of Chicago - Twenty-Second Annual Automotive Outlook Symposium May 29, 2015
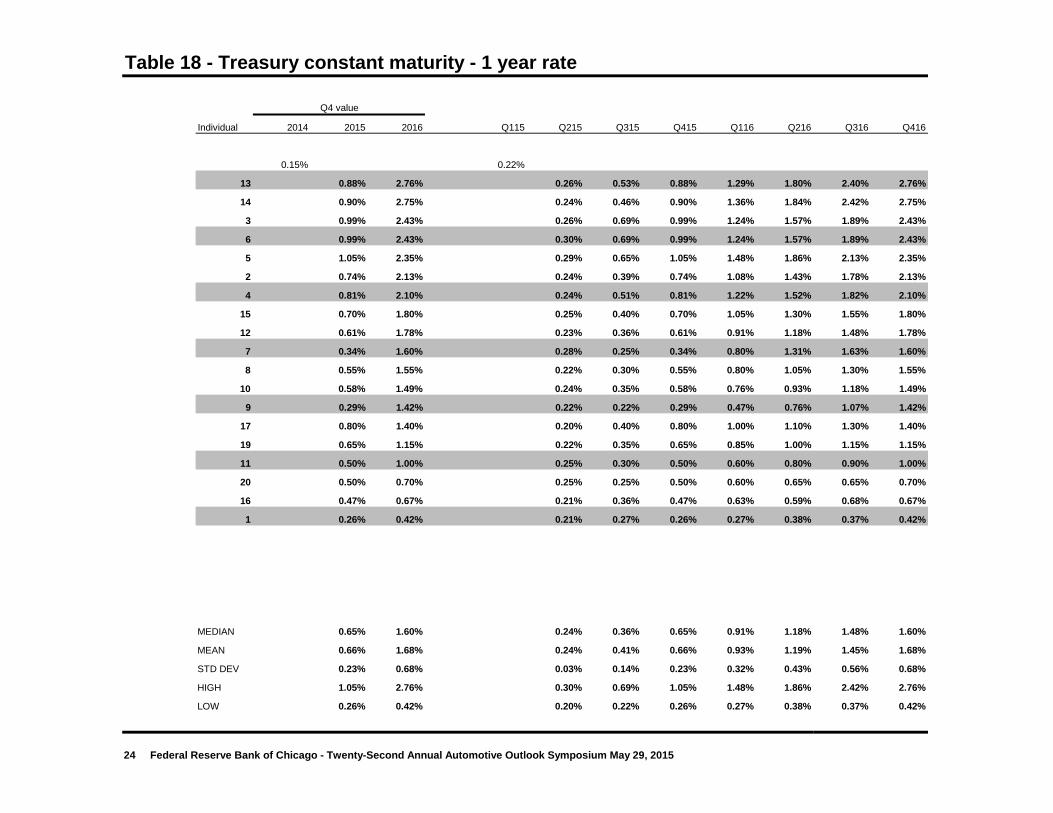
Table 18 - Treasury constant maturity - 1 year rate
Q4 value
Individual 2014 2015 2016 Q115 Q215 Q315 Q415 Q116 Q216 Q316 Q416
0.15% 0.22%
13 0.88% 2.76% 0.26% 0.53% 0.88% 1.29% 1.80% 2.40% 2.76%
14 0.90% 2.75% 0.24% 0.46% 0.90% 1.36% 1.84% 2.42% 2.75%
3 0.99% 2.43% 0.26% 0.69% 0.99% 1.24% 1.57% 1.89% 2.43%
6 0.99% 2.43% 0.30% 0.69% 0.99% 1.24% 1.57% 1.89% 2.43%
5 1.05% 2.35% 0.29% 0.65% 1.05% 1.48% 1.86% 2.13% 2.35%
2 0.74% 2.13% 0.24% 0.39% 0.74% 1.08% 1.43% 1.78% 2.13%
4 0.81% 2.10% 0.24% 0.51% 0.81% 1.22% 1.52% 1.82% 2.10%
15 0.70% 1.80% 0.25% 0.40% 0.70% 1.05% 1.30% 1.55% 1.80%
12 0.61% 1.78% 0.23% 0.36% 0.61% 0.91% 1.18% 1.48% 1.78%
7 0.34% 1.60% 0.28% 0.25% 0.34% 0.80% 1.31% 1.63% 1.60%
8 0.55% 1.55% 0.22% 0.30% 0.55% 0.80% 1.05% 1.30% 1.55%
10 0.58% 1.49% 0.24% 0.35% 0.58% 0.76% 0.93% 1.18% 1.49%
9 0.29% 1.42% 0.22% 0.22% 0.29% 0.47% 0.76% 1.07% 1.42%
17 0.80% 1.40% 0.20% 0.40% 0.80% 1.00% 1.10% 1.30% 1.40%
19 0.65% 1.15% 0.22% 0.35% 0.65% 0.85% 1.00% 1.15% 1.15%
11 0.50% 1.00% 0.25% 0.30% 0.50% 0.60% 0.80% 0.90% 1.00%
20 0.50% 0.70% 0.25% 0.25% 0.50% 0.60% 0.65% 0.65% 0.70%
16 0.47% 0.67% 0.21% 0.36% 0.47% 0.63% 0.59% 0.68% 0.67%
1 0.26% 0.42% 0.21% 0.27% 0.26% 0.27% 0.38% 0.37% 0.42%
MEDIAN 0.65% 1.60% 0.24% 0.36% 0.65% 0.91% 1.18% 1.48% 1.60%
MEAN 0.66% 1.68% 0.24% 0.41% 0.66% 0.93% 1.19% 1.45% 1.68%
STD DEV 0.23% 0.68% 0.03% 0.14% 0.23% 0.32% 0.43% 0.56% 0.68%
HIGH 1.05% 2.76% 0.30% 0.69% 1.05% 1.48% 1.86% 2.42% 2.76%
LOW 0.26% 0.42% 0.20% 0.22% 0.26% 0.27% 0.38% 0.37% 0.42%
24 Federal Reserve Bank of Chicago - Twenty-Second Annual Automotive Outlook Symposium May 29, 2015

Table 19 - Treasury constant maturity - 10 year rate
Q4 value
Individual 2014 2015 2016 Q115 Q215 Q315 Q415 Q116 Q216 Q316 Q416
2.28% 1.97%
17 3.00% 3.90% 2.10% 2.50% 3.00% 3.10% 3.20% 3.60% 3.90%
12 2.50% 3.75% 2.05% 2.25% 2.50% 2.80% 3.20% 3.50% 3.75%
13 2.61% 3.66% 2.14% 2.37% 2.61% 2.88% 3.18% 3.49% 3.66%
14 2.62% 3.65% 2.14% 2.38% 2.62% 2.90% 3.19% 3.49% 3.65%
4 2.55% 3.50% 2.10% 2.34% 2.55% 2.80% 3.04% 3.30% 3.50%
2 2.55% 3.41% 2.14% 2.34% 2.55% 2.76% 2.98% 3.19% 3.41%
15 2.46% 3.40% 2.20% 2.30% 2.46% 2.75% 3.08% 3.20% 3.40%
21 2.50% 3.20% 2.00% 2.25% 2.50% 2.70% 2.85% 3.05% 3.20%
11 2.70% 3.20% 2.15% 2.40% 2.70% 3.20% 3.20% 3.20% 3.20%
3 2.41% 3.15% 2.04% 2.25% 2.41% 2.64% 2.86% 3.01% 3.15%
19 2.80% 3.10% 2.02% 2.35% 2.80% 3.00% 3.10% 3.10% 3.10%
7 2.22% 3.04% 2.07% 2.17% 2.22% 2.61% 3.03% 3.19% 3.04%
10 2.31% 3.00% 1.99% 2.18% 2.31% 2.50% 2.72% 2.86% 3.00%
6 2.41% 2.89% 2.19% 2.35% 2.41% 2.46% 2.53% 2.77% 2.89%
8 2.33% 2.81% 2.05% 2.23% 2.33% 2.36% 2.52% 2.71% 2.81%
9 2.23% 2.80% 2.11% 2.16% 2.23% 2.33% 2.47% 2.63% 2.80%
1 2.71% 2.80% 1.95% 2.00% 2.71% 2.75% 2.76% 2.62% 2.80%
20 2.38% 2.78% 2.10% 2.15% 2.38% 2.62% 2.66% 2.75% 2.78%
18 2.30% 2.75% 2.10% 2.20% 2.30% 2.45% 2.55% 2.65% 2.75%
5 2.27% 2.70% 1.98% 2.17% 2.27% 2.40% 2.43% 2.57% 2.70%
16 2.39% 2.49% 2.22% 2.30% 2.39% 2.45% 2.46% 2.50% 2.49%
MEDIAN 2.46% 3.10% 2.10% 2.25% 2.46% 2.70% 2.86% 3.05% 3.10%
MEAN 2.49% 3.14% 2.09% 2.27% 2.49% 2.69% 2.86% 3.02% 3.14%
STD DEV 0.20% 0.38% 0.07% 0.11% 0.20% 0.24% 0.28% 0.34% 0.38%
HIGH 3.00% 3.90% 2.22% 2.50% 3.00% 3.20% 3.20% 3.60% 3.90%
LOW 2.22% 2.49% 1.95% 2.00% 2.22% 2.33% 2.43% 2.50% 2.49%
25 Federal Reserve Bank of Chicago - Twenty-Second Annual Automotive Outlook Symposium May 29, 2015
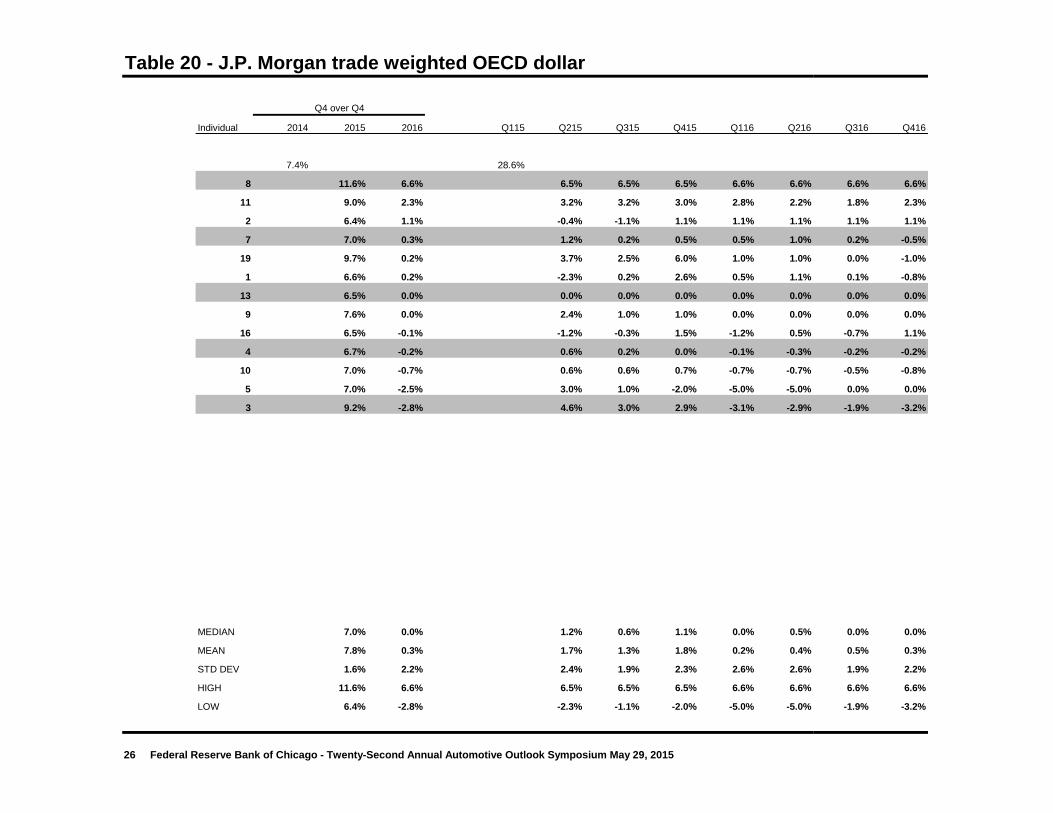
Table 20 - J.P. Morgan trade weighted OECD dollar
Q4 over Q4
Individual 2014 2015 2016 Q115 Q215 Q315 Q415 Q116 Q216 Q316 Q416
7.4% 28.6%
8 11.6% 6.6% 6.5% 6.5% 6.5% 6.6% 6.6% 6.6% 6.6%
11 9.0% 2.3% 3.2% 3.2% 3.0% 2.8% 2.2% 1.8% 2.3%
2 6.4% 1.1% -0.4% -1.1% 1.1% 1.1% 1.1% 1.1% 1.1%
7 7.0% 0.3% 1.2% 0.2% 0.5% 0.5% 1.0% 0.2% -0.5%
19 9.7% 0.2% 3.7% 2.5% 6.0% 1.0% 1.0% 0.0% -1.0%
1 6.6% 0.2% -2.3% 0.2% 2.6% 0.5% 1.1% 0.1% -0.8%
13 6.5% 0.0% 0.0% 0.0% 0.0% 0.0% 0.0% 0.0% 0.0%
9 7.6% 0.0% 2.4% 1.0% 1.0% 0.0% 0.0% 0.0% 0.0%
16 6.5% -0.1% -1.2% -0.3% 1.5% -1.2% 0.5% -0.7% 1.1%
4 6.7% -0.2% 0.6% 0.2% 0.0% -0.1% -0.3% -0.2% -0.2%
10 7.0% -0.7% 0.6% 0.6% 0.7% -0.7% -0.7% -0.5% -0.8%
5 7.0% -2.5% 3.0% 1.0% -2.0% -5.0% -5.0% 0.0% 0.0%
3 9.2% -2.8% 4.6% 3.0% 2.9% -3.1% -2.9% -1.9% -3.2%
MEDIAN 7.0% 0.0% 1.2% 0.6% 1.1% 0.0% 0.5% 0.0% 0.0%
MEAN 7.8% 0.3% 1.7% 1.3% 1.8% 0.2% 0.4% 0.5% 0.3%
STD DEV 1.6% 2.2% 2.4% 1.9% 2.3% 2.6% 2.6% 1.9% 2.2%
HIGH 11.6% 6.6% 6.5% 6.5% 6.5% 6.6% 6.6% 6.6% 6.6%
LOW 6.4% -2.8% -2.3% -1.1% -2.0% -5.0% -5.0% -1.9% -3.2%
26 Federal Reserve Bank of Chicago - Twenty-Second Annual Automotive Outlook Symposium May 29, 2015
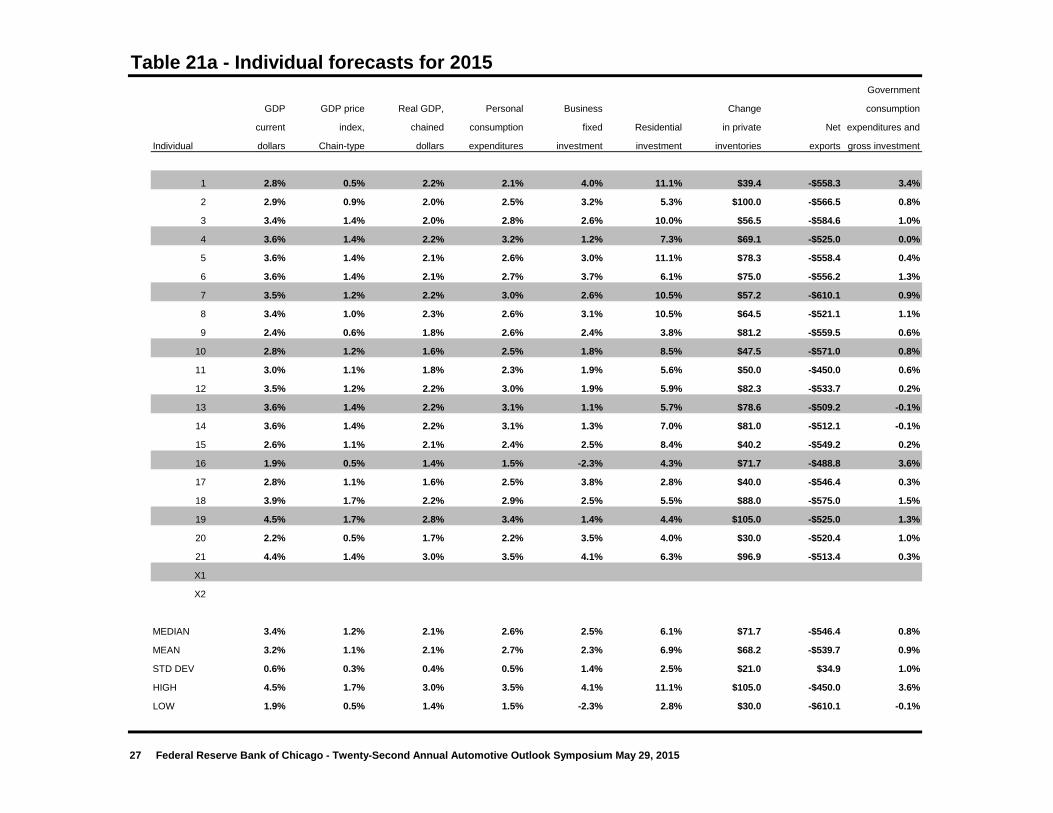
Table 21a - Individual forecasts for 2015Government
GDP GDP price Real GDP, Personal Business Change consumption
current index, chained consumption fixed Residential in private Net expenditures and
Individual dollars Chain-type dollars expenditures investment investment inventories exports gross investment
1 2.8% 0.5% 2.2% 2.1% 4.0% 11.1% $39.4 -$558.3 3.4%
2 2.9% 0.9% 2.0% 2.5% 3.2% 5.3% $100.0 -$566.5 0.8%
3 3.4% 1.4% 2.0% 2.8% 2.6% 10.0% $56.5 -$584.6 1.0%
4 3.6% 1.4% 2.2% 3.2% 1.2% 7.3% $69.1 -$525.0 0.0%
5 3.6% 1.4% 2.1% 2.6% 3.0% 11.1% $78.3 -$558.4 0.4%
6 3.6% 1.4% 2.1% 2.7% 3.7% 6.1% $75.0 -$556.2 1.3%
7 3.5% 1.2% 2.2% 3.0% 2.6% 10.5% $57.2 -$610.1 0.9%
8 3.4% 1.0% 2.3% 2.6% 3.1% 10.5% $64.5 -$521.1 1.1%
9 2.4% 0.6% 1.8% 2.6% 2.4% 3.8% $81.2 -$559.5 0.6%
10 2.8% 1.2% 1.6% 2.5% 1.8% 8.5% $47.5 -$571.0 0.8%
11 3.0% 1.1% 1.8% 2.3% 1.9% 5.6% $50.0 -$450.0 0.6%
12 3.5% 1.2% 2.2% 3.0% 1.9% 5.9% $82.3 -$533.7 0.2%
13 3.6% 1.4% 2.2% 3.1% 1.1% 5.7% $78.6 -$509.2 -0.1%
14 3.6% 1.4% 2.2% 3.1% 1.3% 7.0% $81.0 -$512.1 -0.1%
15 2.6% 1.1% 2.1% 2.4% 2.5% 8.4% $40.2 -$549.2 0.2%
16 1.9% 0.5% 1.4% 1.5% -2.3% 4.3% $71.7 -$488.8 3.6%
17 2.8% 1.1% 1.6% 2.5% 3.8% 2.8% $40.0 -$546.4 0.3%
18 3.9% 1.7% 2.2% 2.9% 2.5% 5.5% $88.0 -$575.0 1.5%
19 4.5% 1.7% 2.8% 3.4% 1.4% 4.4% $105.0 -$525.0 1.3%
20 2.2% 0.5% 1.7% 2.2% 3.5% 4.0% $30.0 -$520.4 1.0%
21 4.4% 1.4% 3.0% 3.5% 4.1% 6.3% $96.9 -$513.4 0.3%
X1
X2
MEDIAN 3.4% 1.2% 2.1% 2.6% 2.5% 6.1% $71.7 -$546.4 0.8%
MEAN 3.2% 1.1% 2.1% 2.7% 2.3% 6.9% $68.2 -$539.7 0.9%
STD DEV 0.6% 0.3% 0.4% 0.5% 1.4% 2.5% $21.0 $34.9 1.0%
HIGH 4.5% 1.7% 3.0% 3.5% 4.1% 11.1% $105.0 -$450.0 3.6%
LOW 1.9% 0.5% 1.4% 1.5% -2.3% 2.8% $30.0 -$610.1 -0.1%
27 Federal Reserve Bank of Chicago - Twenty-Second Annual Automotive Outlook Symposium May 29, 2015

Table 21b - Individual forecasts for 2015Treasury Treasury
constant constant J.P. Morgan
Industrial Car & light Housing Oil Unemployment Inflation rate maturity maturity trade weighted
Individual production truck sales starts Price rate (CPI) one-year rate ten-year rate OECD dollar
1 3.8% 16.6 1.02 $59.60 5.3% -0.3% 0.26% 2.71% 6.6%
2 1.5% 16.8 1.05 $68.00 5.0% 0.4% 0.74% 2.55% 6.4%
3 0.5% 16.9 1.08 $60.67 5.3% 0.1% 0.99% 2.41% 9.2%
4 1.1% 17.0 1.09 $62.32 5.0% 1.1% 0.81% 2.55% 6.7%
5 1.4% 16.7 1.06 $60.00 5.2% 0.5% 1.05% 2.27% 7.0%
6 1.8% 17.0 1.14 $58.00 5.2% 1.0% 0.99% 2.41%
7 2.1% 16.8 1.11 $67.30 5.4% 0.3% 0.34% 2.22% 7.0%
8 1.7% 16.8 1.12 $60.00 5.1% 0.4% 0.55% 2.33% 11.6%
9 1.5% 16.7 0.99 $64.96 5.2% 0.3% 0.29% 2.23% 7.6%
10 0.4% 16.8 1.09 $51.90 5.3% 0.1% 0.58% 2.31% 7.0%
11 1.7% 16.7 1.11 $78.00 5.3% 0.8% 0.50% 2.70% 9.0%
12 1.6% 16.8 1.10 5.3% 0.7% 0.61% 2.50%
13 1.1% 16.7 1.08 $62.32 5.0% 1.1% 0.88% 2.61% 6.5%
14 1.3% 16.6 1.10 $61.00 5.0% 1.1% 0.90% 2.62%
15 2.0% 16.8 1.13 $62.98 5.2% 1.0% 0.70% 2.46%
16 1.4% 16.9 1.09 $72.83 5.6% 0.8% 0.47% 2.39% 6.5%
17 1.4% 16.7 0.98 $70.00 5.1% 0.5% 0.80% 3.00%
18 1.5% 16.9 1.12 $63.00 5.0% 1.0% 2.30%
19 1.8% 17.1 1.09 $73.00 5.0% 0.7% 0.65% 2.80% 9.7%
20 1.4% 16.6 0.97 $55.00 5.0% 0.7% 0.50% 2.38%
21 2.5% 16.6 1.08 $61.68 4.9% 1.3% 2.50%
X1 16.5
X2 16.8
MEDIAN 1.5% 16.8 1.09 $62.32 5.2% 0.7% 0.65% 2.46% 7.0%
MEAN 1.6% 16.8 1.08 $63.63 5.2% 0.6% 0.66% 2.49% 7.8%
STD DEV 0.7% 0.1 0.05 $6.18 0.2% 0.4% 0.23% 0.20% 1.6%
HIGH 3.8% 17.1 1.14 $78.00 5.6% 1.3% 1.05% 3.00% 11.6%
LOW 0.4% 16.5 0.97 $51.90 4.9% -0.3% 0.26% 2.22% 6.4%
28 Federal Reserve Bank of Chicago - Twenty-Second Annual Automotive Outlook Symposium May 29, 2015

Table 22a - Individual forecasts for 2016Government
GDP GDP price Real GDP, Personal Business Change consumption
current index, chained consumption fixed Residential in private Net expenditures and
Individual dollars Chain-type dollars expenditures investment investment inventories exports gross investment
1 4.4% 1.2% 3.1% 3.1% 6.4% 4.4% -$95.7 -$501.3 2.5%
2 5.0% 1.9% 3.1% 2.9% 7.0% 7.0% $100.0 -$622.4 1.5%
3 5.2% 2.1% 3.0% 3.0% 6.8% 12.8% $63.9 -$650.5 0.1%
4 5.0% 1.9% 3.0% 3.3% 4.5% 14.9% $52.4 -$575.4 0.5%
5 5.0% 2.0% 2.9% 2.5% 5.2% 8.5% $81.2 -$571.8 1.4%
6 5.0% 2.1% 2.9% 2.7% 6.1% 9.0% $75.0 -$633.2 2.1%
7 4.5% 1.5% 2.9% 2.9% 6.2% 7.5% $47.7 -$672.3 1.1%
8 4.5% 1.6% 2.8% 3.1% 4.5% 12.5% $51.5 -$569.7 0.0%
9 4.2% 1.4% 2.7% 2.7% 4.1% 6.1% $82.4 -$579.3 1.3%
10 4.9% 2.2% 2.7% 2.6% 6.1% 11.4% $53.3 -$614.7 -0.1%
11 3.8% 1.7% 2.7% 2.7% 3.8% 6.9% $85.0 -$525.0 1.9%
12 4.9% 2.2% 2.7% 2.5% 3.9% 9.0% $82.3 -$531.1 0.9%
13 4.6% 1.9% 2.7% 2.9% 3.6% 15.7% $33.5 -$539.0 0.5%
14 4.5% 1.9% 2.6% 3.0% 3.4% 13.0% $31.3 -$537.2 0.5%
15 3.7% 1.1% 2.5% 2.8% 3.8% 10.2% $41.7 -$586.0 0.5%
16 3.0% 0.5% 2.4% 2.4% -0.1% 1.4% $96.5 -$446.7 2.1%
17 4.0% 1.5% 2.4% 2.1% 5.0% 3.5% $40.0 -$554.6 1.4%
18 4.4% 2.0% 2.4% 2.8% 3.8% 3.2% $70.0 -$645.0 2.2%
19 3.3% 1.0% 2.3% 1.7% 2.2% 1.4% $94.9 -$450.0 2.0%
20 3.3% 1.3% 2.0% 1.8% 3.4% 3.9% $30.0 -$544.0 1.5%
21 3.7% 2.0% 1.7% 2.5% 0.4% 10.6% $23.8 -$534.7 0.5%
X1
X2
MEDIAN 4.5% 1.9% 2.7% 2.7% 4.1% 8.5% $53.3 -$569.7 1.3%
MEAN 4.3% 1.7% 2.6% 2.7% 4.3% 8.2% $54.3 -$565.9 1.2%
STD DEV 0.6% 0.4% 0.4% 0.4% 1.8% 4.2% $40.8 $59.1 0.8%
HIGH 5.2% 2.2% 3.1% 3.3% 7.0% 15.7% $100.0 -$446.7 2.5%
LOW 3.0% 0.5% 1.7% 1.7% -0.1% 1.4% -$95.7 -$672.3 -0.1%
29 Federal Reserve Bank of Chicago - Twenty-Second Annual Automotive Outlook Symposium May 29, 2015

Table 22b - Individual forecasts for 2016Treasury Treasury
constant constant J.P. Morgan
Industrial Car & light Housing Oil Unemployment Inflation rate maturity maturity trade weighted
Individual production truck sales starts Price rate (CPI) one-year rate ten-year rate OECD dollar
1 3.1% 16.8 1.13 $69.10 5.2% 2.2% 0.42% 2.80% 0.2%
2 3.2% 17.0 1.19 $78.00 4.6% 2.6% 2.13% 3.41% 1.1%
3 4.2% 17.2 1.30 $70.33 5.0% 2.5% 2.43% 3.15% -2.8%
4 2.4% 17.6 1.33 $64.90 4.8% 2.1% 2.10% 3.50% -0.2%
5 2.6% 17.1 1.09 $68.00 5.0% 2.0% 2.35% 2.70% -2.5%
6 3.5% 17.1 1.23 $64.00 4.8% 2.3% 2.43% 2.89%
7 3.3% 16.9 1.19 $72.30 5.1% 2.5% 1.60% 3.04% 0.3%
8 2.2% 17.1 1.32 $69.75 5.2% 2.2% 1.55% 2.81% 6.6%
9 2.3% 16.8 1.05 $70.76 4.9% 1.8% 1.42% 2.80% 0.0%
10 3.9% 16.9 1.19 $66.73 5.0% 2.6% 1.49% 3.00% -0.7%
11 2.9% 16.9 1.24 $82.00 5.1% 2.4% 1.00% 3.20% 2.3%
12 3.7% 17.1 1.30 5.3% 2.3% 1.78% 3.75%
13 2.0% 16.7 1.33 $64.90 4.9% 2.1% 2.76% 3.66% 0.0%
14 1.8% 1.31 $65.00 4.9% 2.1% 2.75% 3.65%
15 3.0% 17.2 1.29 $67.39 5.1% 2.2% 1.80% 3.40%
16 3.1% 17.5 1.17 $73.68 5.5% 2.0% 0.67% 2.49% -0.1%
17 3.0% 16.8 1.01 $65.00 5.2% 2.2% 1.40% 3.90%
18 2.5% 17.1 1.32 $75.00 4.5% 2.1% 2.75%
19 -1.0% 16.1 1.18 $75.00 5.3% 1.7% 1.15% 3.10% 0.2%
20 2.1% 16.8 1.09 $65.00 4.5% 1.6% 0.70% 2.78%
21 0.5% 1.25 $65.47 5.2% 2.2% 3.20%
X1 17.1
X2 17.3
MEDIAN 2.9% 17.1 1.23 $68.55 5.0% 2.2% 1.60% 3.10% 0.0%
MEAN 2.6% 17.0 1.21 $69.61 5.0% 2.2% 1.68% 3.14% 0.3%
STD DEV 1.1% 0.3 0.10 $4.90 0.3% 0.3% 0.68% 0.38% 2.2%
HIGH 4.2% 17.6 1.33 $82.00 5.5% 2.6% 2.76% 3.90% 6.6%
LOW -1.0% 16.1 1.01 $64.00 4.5% 1.6% 0.42% 2.49% -2.8%
30 Federal Reserve Bank of Chicago - Twenty-Second Annual Automotive Outlook Symposium May 29, 2015

Contributors
Rajeev Dhawan Georgia State UniversityEvert Van Der Heide Calvin CollegeWilliam Hickey DTE EnergySam Kahan ACT ResearchAdolfo Laurenti Mesirow FinancialDr. Ken Mayland ClearView Economics, LLCGlenn Mercer Glenn MercerJeff Myers State FarmThomas J. Portz Sterling Capital Management, Inc.William Shearin Center Punch EconomicsJohn Silvia Wells FargoRomina Soria Wisconsin Department of RevenueJim Stansell Michigan House Fiscal AgencyHaig Stoddard WardsAutoYingzi Su General MotorsThomas K Swift American Chemistry CouncilCarl Tannenbaum Northern TrustTodd Tomalak John Burns Real Estate ConsultingArun Raha And Maira Trimble EatonChris Varvares Macroeconomic AdvisersBill Witte Witte Econometrics/FTRRichard Yamarone Bloomberg, LPYong Yang Ford Motor Company