Chi-Squared Hypothesis Testing Using One-Way and Two-Way Frequency Tables of Categorical Variables.
22
Chi-Squared Hypothesis Testing Using One-Way and Two- Way Frequency Tables of Categorical Variables
-
Upload
melvyn-quinn -
Category
Documents
-
view
231 -
download
1
Transcript of Chi-Squared Hypothesis Testing Using One-Way and Two-Way Frequency Tables of Categorical Variables.

Chi-Squared Hypothesis Testing
Using One-Way and Two-Way Frequency Tables of
Categorical Variables
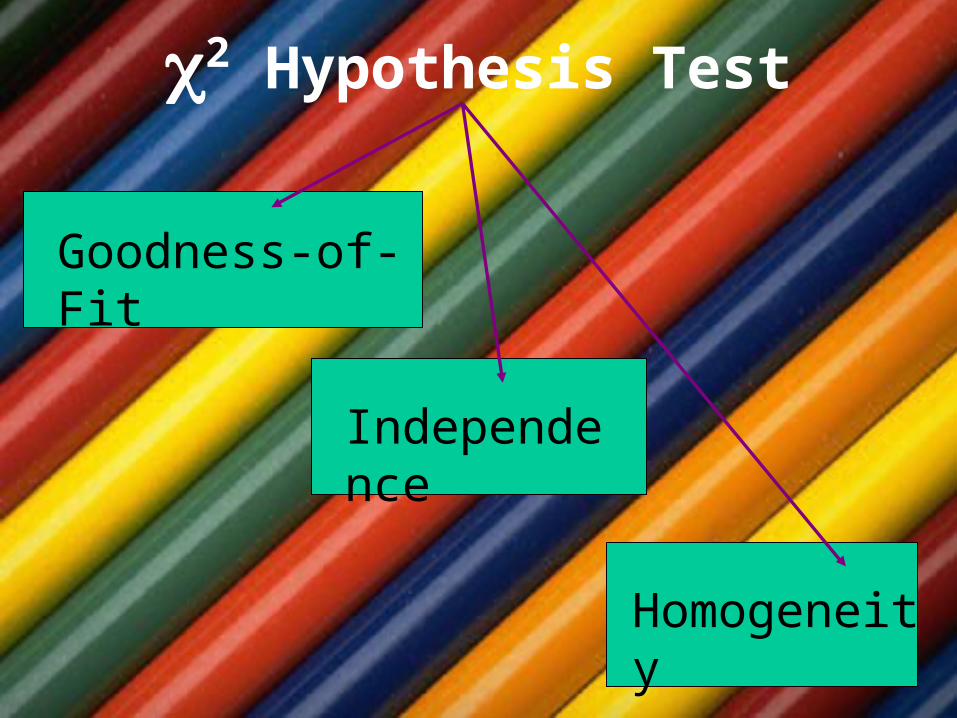
2 Hypothesis Test
Goodness-of-Fit
Independence
Homogeneity

Analyzing an Exam Question
How does a teacher determine if students were “clueless” on an exam question vs. students were unprepared for that particular exam question?

Goodness-of-Fit TestIf you need to test whether populations are
distributed evenly (or “preset” proportions), then use Goodness-of-Fit test.
1. This requires a one-way frequency (count) table.
2. Random sample is required for counts.
3. Expected cell counts greater than 5.
What’s an expected cell count?

Expected Cell Count?
Suppose 300 students answered a multiple choice question with the following distribution. Did the students randomly select answers (I.e. are the answers equally distributed)?
The expected cell count for A is 300(1/5) = 60. As the same is true for B thru E. If we assume the answers are equally distributed (null hypothesis), then we “share” the 300 responses equally.
A B C D E
68 53 78 42 59

Observed vs. Expected
The observed values are the actual sampled counts (occurrences).
The expected values are the hypothesized outcomes based on the null hypothesis.
In this example, we are assuming the each answer was equally selected by students.
A B C D E
Observed 68 53 78 42 59
Expected 60 60 60 60 60

2 Statistic
The computer (or calculator) will calculate the chi-squared statistic for you, and determine the degrees of freedom and p-value.
Expected
ExpectedObserved 22
What is degrees of freedom?

Chi-Squared Statistic and p-value
2 = 6.5, df = 4, P(2 > 6.5) = .16479

2 Statistic
Ho: A = B = C = D = E
Ha: at least one is different
2 = 12.7, df = 4, P(2 > 12.7) = .0128
A B C D E
Observed 68 53 78 42 59
Expected 60 60 60 60 60
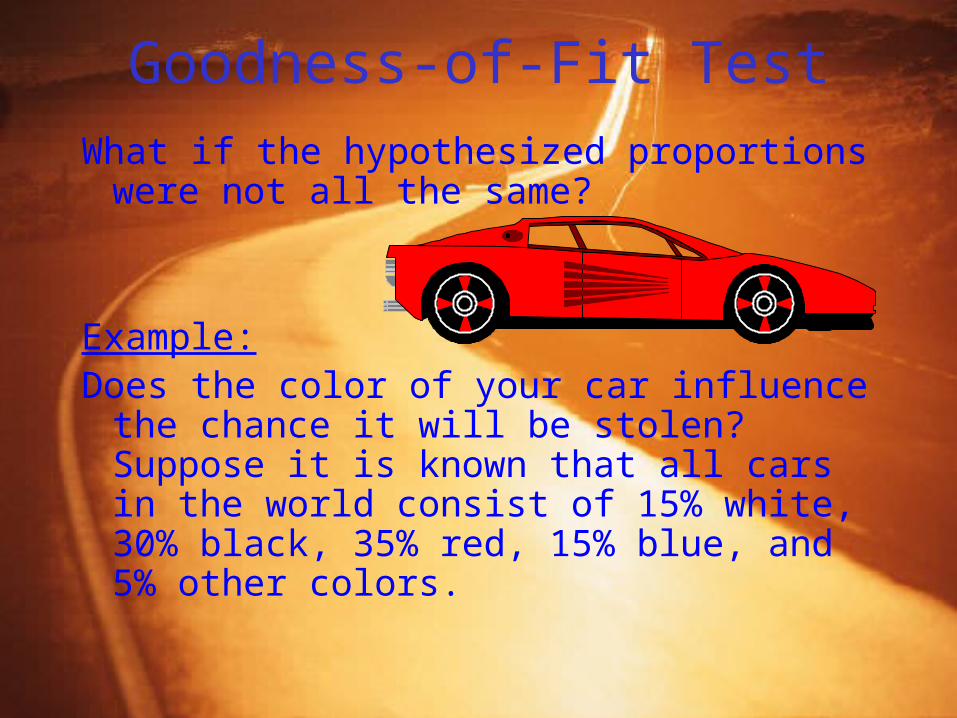
Goodness-of-Fit Test
What if the hypothesized proportions were not all the same?
Example:Does the color of your car influence the
chance it will be stolen? Suppose it is known that all cars in the world consist of 15% white, 30% black, 35% red, 15% blue, and 5% other colors.
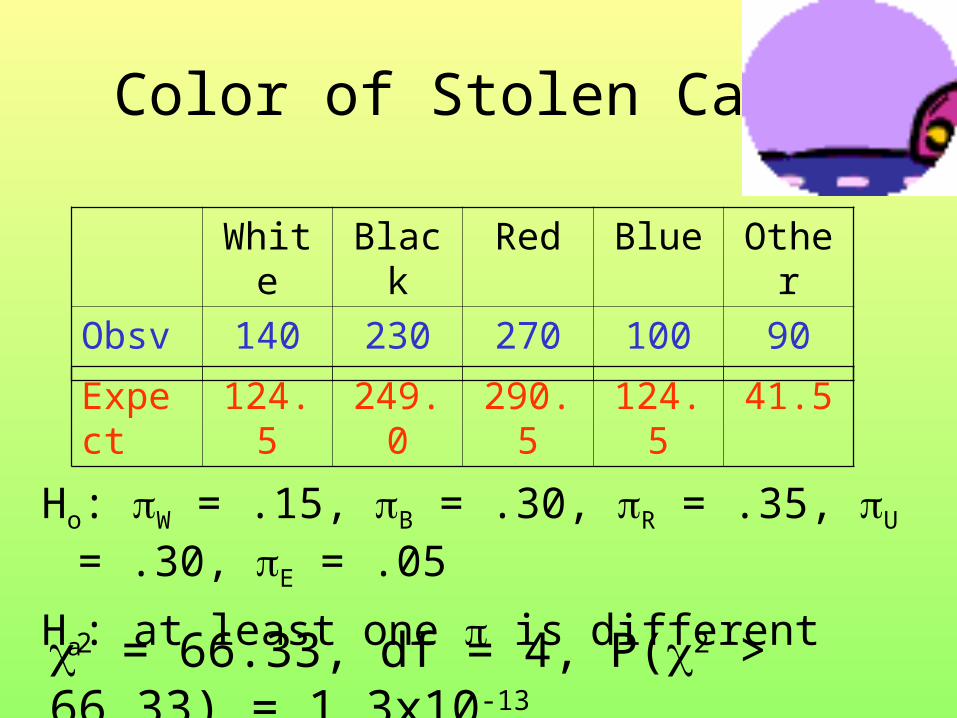
Color of Stolen Car
Ho: W = .15, B = .30, R = .35, U = .30, E = .05
Ha: at least one is different
White Black Red Blue Other
Obsv 140 230 270 100 90
Expect 124.5 249.0 290.5 124.5 41.5
2 = 66.33, df = 4, P(2 > 66.33) = 1.3x10⁻¹³

Two-Way Tables
Homogeneity—tests for equal category proportions for all populations (because separate random samples were used to collect information).
Independence—tests for an independence (no association) between 2 categorical variables.
Don’t worry; same test!
College Students’ Drinking Levels
The data on drinking behavior for independently chosen random samples of male and female students was collected.
Does there appear to be a gender difference with respect to drinking behavior?
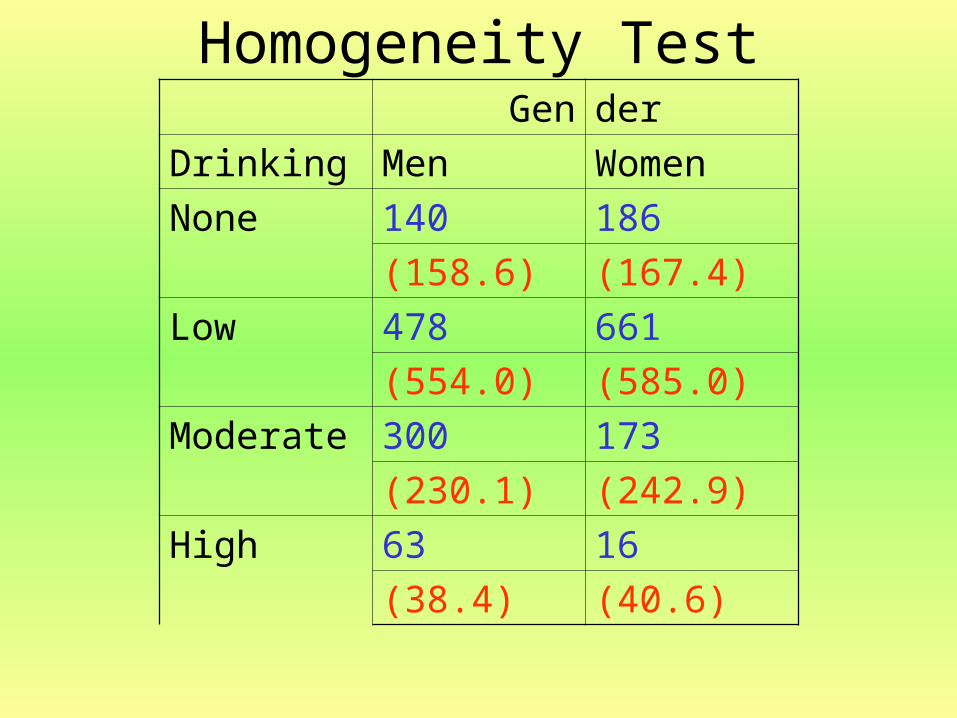
Homogeneity TestGen der
Drinking Men Women
None 140 186
(158.6) (167.4)
Low 478 661
(554.0) (585.0)
Moderate 300 173
(230.1) (242.9)
High 63 16
(38.4) (40.6)
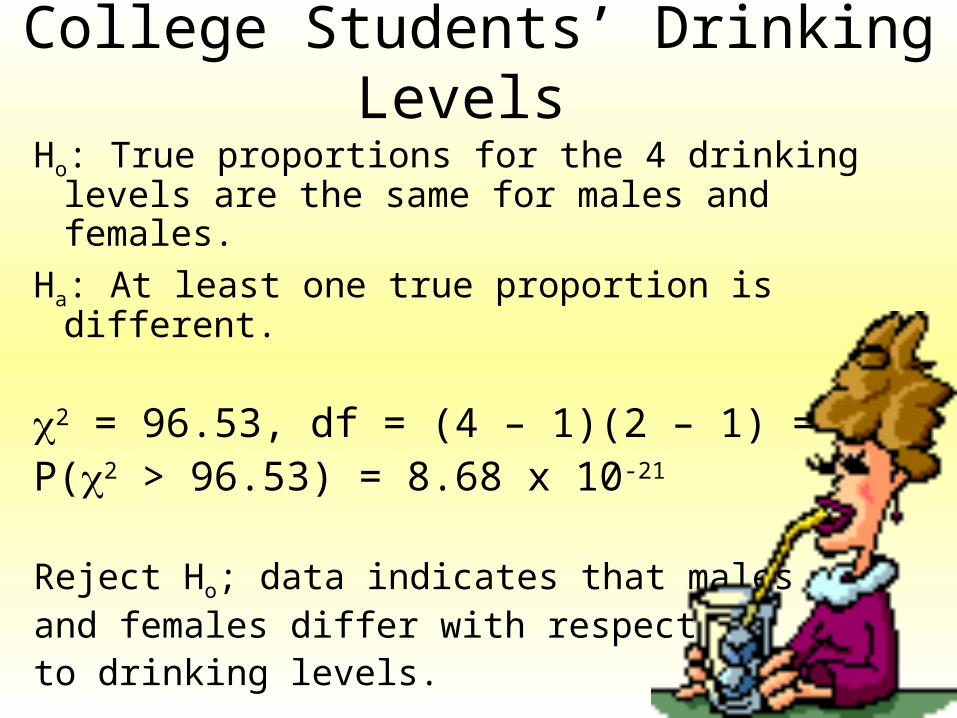
College Students’ Drinking Levels
Ho: True proportions for the 4 drinking levels are the same for males and females.
Ha: At least one true proportion is different.
2 = 96.53, df = (4 – 1)(2 – 1) = 3P(2 > 96.53) = 8.68 x 10⁻²¹
Reject Ho; data indicates that malesand females differ with respectto drinking levels.

Sexual Risk-Taking Factors Among Adolescents
Each person in a random sample of sexually active teens was classified according to gender and contraceptive use.
Is there a relationship between gender and contraceptive use by sexually active teens?

Independent (No Association) Test
Gen der
Contraceptive Use
Female Male
Rarely/Never 210 350
(224) (336)
Sometimes/
Most Times
190 320
(204) (306)
Always 400 530
(372) (558)

Sexual Risk-Taking Factors Among Adolescents
Ho: Gender and contraceptive use have no association (independent).
Ha: Gender and contraceptive use have an association (dependent).
2 = 6.572, df = (3 – 1)(2 – 1) = 2P(2 > 6.572) = .035
Reject Ho and conclude there is an association between gender and contraceptive use.

Expected (Cell) Countfor Two-Way Tables
GrandTotal
lColumnTotaRowTotaluntExpectedCo

Conditions (Requirements) for 2 Test with 2-Way Tables
1) Random Sample
2) At least 80% of Expected Cell Counts are greater than 5.
3) All Expected Cell Counts and Observed values are greater than or equal to 1.

Titanic
Moviemakers of Titanic imply that lower-class passengers were treated unfairly.
Was that accurate?

Likelihood of Survival on Titanic?
Ho: C = 109/1318, W = 402/1318, M = 807/1318
Ha: at least one is different
2 = 225.16, df = 2, P(2 > 225.16) = 0.000
Reject Ho and conclude at least one proportion is different.
Children Women Men
Observed 57 296 146
Expected 41.269 152.199 305.533