Chi-Square Test. Most of the previous techniques presented so far have been for NUMERICAL data. So,...
15
Chi-Square Test
-
Upload
isabel-surgent -
Category
Documents
-
view
213 -
download
0
Transcript of Chi-Square Test. Most of the previous techniques presented so far have been for NUMERICAL data. So,...

Chi-Square Test

Most of the previous techniques presented so far have been for NUMERICAL data.
So, what do we do if the data is CATEGORICAL?
Ex: Information gathered on gender, political party, college major, etc.

Categorical Variables
Based on observations
Univariate – single categorical variableExample: Sample 100 people & ask if they
agree or disagree with a question.
Bivariate – uses two categorical variablesExample: Sample 100 people & ask if they
are male/female and what political party they support.

One-Way Frequency Table - Univariate
Democrat Democrat Democrat Independent
Republican Democrat Republican Independent
Republican Republican Republican Republican
Democrat Republican Independent
Freq. 4 6 2
Data
Horizontal One-Way Table
Freq.
Democrat 4
Republican 6
Independent 2
Vertical One-Way Table

Goodness of Fit Test
Used to measure the extent to which the observed counts differ from the expected counts.
K = # categories of a categorical variable df = k – 1 Test Statistic:
2
2
2 Observed Expected
Expected
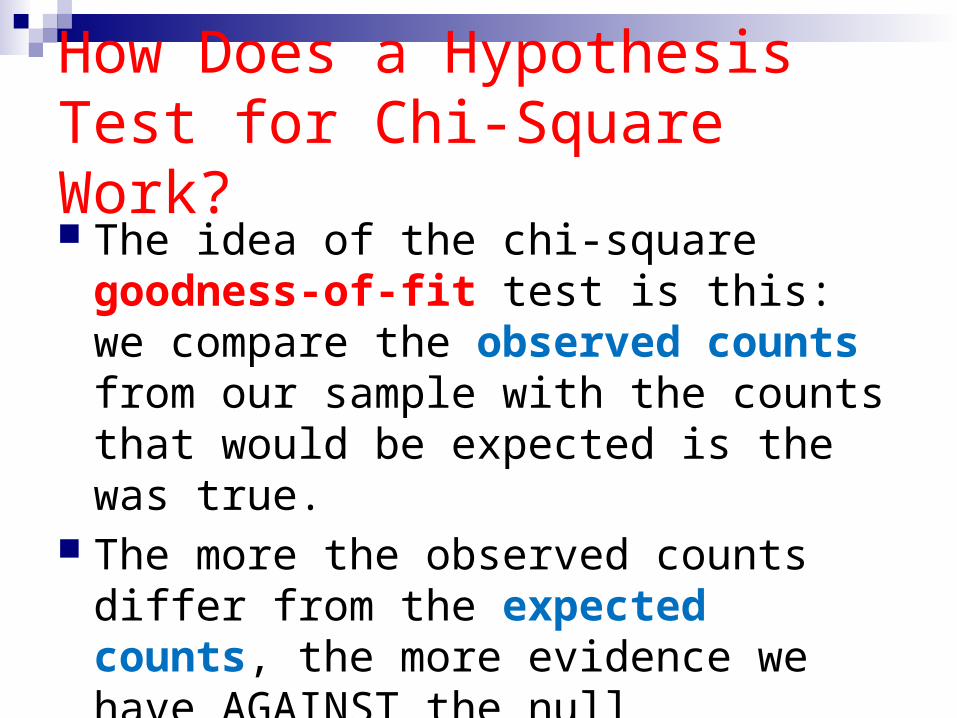
How Does a Hypothesis Test for Chi-Square Work? The idea of the chi-square goodness-of-
fit test is this: we compare the observed counts from our sample with the counts that would be expected is the was true.
The more the observed counts differ from the expected counts, the more evidence we have AGAINST the null hypothesis.

Assumptions
1. Observed Values are based on random
Samples
2. Sample size is large – each cell count is
at least 5. (All cells

Hypotheses
Ho: State each proportion’s hypothesized value.
HA: At least 1 of the proportions differ from the hypothesized value.

It uses the Chi-Square Chart
Positively Skewed Uses d.f. On calculator!
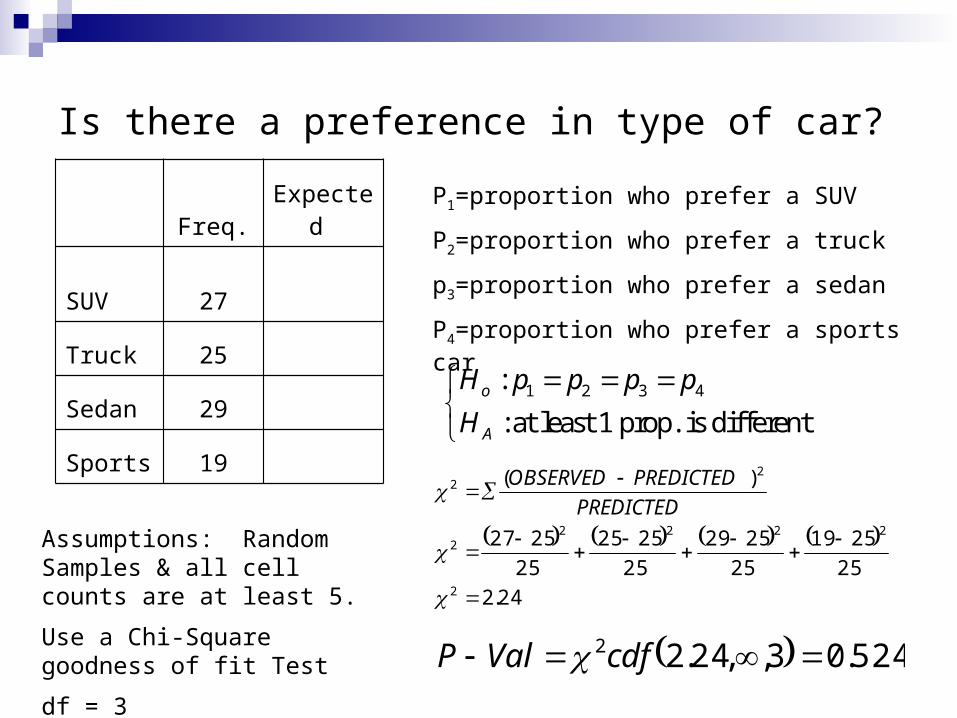
Is there a preference in type of car?
Freq. Expected
SUV 27
Truck 25
Sedan 29
Sports 19
P1=proportion who prefer a SUV
P2=proportion who prefer a truck
p3=proportion who prefer a sedan
P4=proportion who prefer a sports car
1 2 3 4:
: at least 1 prop. is differento
A
H p p p p
H
Assumptions: Random Samples & all cell counts are at least 5.
Use a Chi-Square goodness of fit Test
df = 3
24.2
25
2519
25
2529
25
2525
25
2527
)(
2
22222
22
PREDICTED
PREDICTEDOBSERVED
524.03,,24.22 cdfValP
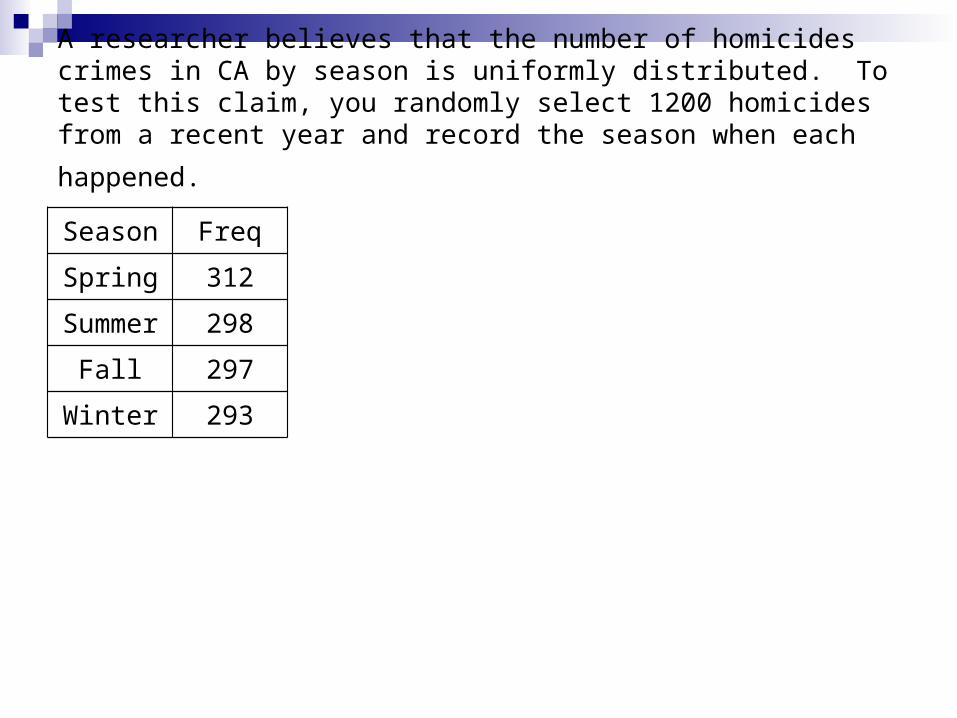
A researcher believes that the number of homicides crimes in CA by season is uniformly distributed. To test this claim, you randomly select 1200 homicides from a recent year and record the season when each
happened.
Season Freq
Spring 312
Summer 298
Fall 297
Winter 293

Results from a previous survey asking people who go to movies at least once a month are shown in the table below. To determine whether this distribution is still the same, you randomly select 1000 people who go to movies at least once a month and record the age of each. Are the
distributions the same?
Age Survey Freq
2 - 17 26.70% 240
18 - 24 19.80% 214
25 - 39 19.70% 183
40 - 49 14% 156
50+ 19.80% 207

What’s your favorite flavor of ice-cream?

Observed
A 40% 45
B 30% 52
C 20% 39
D 5% 8
F 5% 6

Homework
Worksheet