Chemotherapy in the treatment of different histological ...
21
RESEARCH Open Access Chemotherapy in the treatment of different histological types of appendiceal cancers: a SEER based study Gang Wang, Qiken Li and Weiping Chen * Abstract Background: Due to its rarity and high heterogeneity, neither established guidelines nor prospective data are currently available for using chemotherapy in the treatment of appendiceal cancer. This study was to determine the use of chemotherapy and its potential associations with survival in patients with different histological types of the cancer. Methods: Patients with histologically different appendiceal cancers diagnosed during 1998–2016 were selected from the Surveillance, Epidemiology, and End Results (SEER) database. The role and effect of chemotherapy were examined in the treatment of the disease. The Kaplan-Meier method was applied to construct survival curves and significance was examined by Log-rank test. Cox proportional hazard models were used to analyze the impact of chemotherapy and other variables on survival in these patients. Results: A total of 8733 appendiceal cancer patients were identified from the database. Chemotherapy was administrated at highly variable rates in different histological types of appendiceal cancer. As high as 64.0% signet ring cell carcinoma (SRCC), 46.4% of mucinous adenocarcinomas (MAC), 40.6% of non-mucinous adenocarcinoma (NMAC) and 43.9% of mixed neuroendocrine non-neuroendocrine neoplasms (MiNENs) were treated with chemotherapy, whereas only 14.7% of goblet cell carcinoma (GCC), 5% neuroendocrine tumors (NETs) and 1.6% carcinomas (NEC) received chemotherapy. In all patients combined, chemotherapy significantly improved overall survival during the entire study period and cancer-specific survival was improved during in cases from 2012–2016. Further multivariate analysis showed that both cancer-specific and overall survival was significantly improved with chemotherapy in patients with MAC, NMAC and SRCC, but not for patients with GCC, MiNENs, NETs and NECs. Number (> 12) of lymph node sampled was associated with survival of patients with most histological types of cancer under study. Other prognostic factors related to individual histological types were identified. Conclusions: Chemotherapy is administrated at highly variable rates in different histological types of appendiceal cancer. Efficacy of chemotherapy in the treatment of these cancers has been improved in recent years and is significantly associated with better survival for patients with NMAC, MAC, and SRCC. Adequate lymph node sampling may result in a survival benefit for most of these patients. Keywords: Appendiceal cancer, Chemotherapy, Histology, Survival, Adenocarcinoma, Neuroendocrine © The Author(s). 2021 Open Access This article is licensed under a Creative Commons Attribution 4.0 International License, which permits use, sharing, adaptation, distribution and reproduction in any medium or format, as long as you give appropriate credit to the original author(s) and the source, provide a link to the Creative Commons licence, and indicate if changes were made. The images or other third party material in this article are included in the article's Creative Commons licence, unless indicated otherwise in a credit line to the material. If material is not included in the article's Creative Commons licence and your intended use is not permitted by statutory regulation or exceeds the permitted use, you will need to obtain permission directly from the copyright holder. To view a copy of this licence, visit http://creativecommons.org/licenses/by/4.0/. The Creative Commons Public Domain Dedication waiver (http://creativecommons.org/publicdomain/zero/1.0/) applies to the data made available in this article, unless otherwise stated in a credit line to the data. * Correspondence: [email protected] Department of Colorectal Surgery, Cancer Hospital of the University of Chinese Academy of Sciences, Zhejiang Cancer Hospital, Hangzhou 310022, China Wang et al. BMC Cancer (2021) 21:778 https://doi.org/10.1186/s12885-021-08502-3
Transcript of Chemotherapy in the treatment of different histological ...

RESEARCH Open Access
Chemotherapy in the treatment of differenthistological types of appendiceal cancers: aSEER based studyGang Wang, Qiken Li and Weiping Chen*
Abstract
Background: Due to its rarity and high heterogeneity, neither established guidelines nor prospective data arecurrently available for using chemotherapy in the treatment of appendiceal cancer. This study was to determine theuse of chemotherapy and its potential associations with survival in patients with different histological types of thecancer.
Methods: Patients with histologically different appendiceal cancers diagnosed during 1998–2016 were selectedfrom the Surveillance, Epidemiology, and End Results (SEER) database. The role and effect of chemotherapy wereexamined in the treatment of the disease. The Kaplan-Meier method was applied to construct survival curves andsignificance was examined by Log-rank test. Cox proportional hazard models were used to analyze the impact ofchemotherapy and other variables on survival in these patients.
Results: A total of 8733 appendiceal cancer patients were identified from the database. Chemotherapy was administratedat highly variable rates in different histological types of appendiceal cancer. As high as 64.0% signet ring cell carcinoma(SRCC), 46.4% of mucinous adenocarcinomas (MAC), 40.6% of non-mucinous adenocarcinoma (NMAC) and 43.9% of mixedneuroendocrine non-neuroendocrine neoplasms (MiNENs) were treated with chemotherapy, whereas only 14.7% of gobletcell carcinoma (GCC), 5% neuroendocrine tumors (NETs) and 1.6% carcinomas (NEC) received chemotherapy. In all patientscombined, chemotherapy significantly improved overall survival during the entire study period and cancer-specific survivalwas improved during in cases from 2012–2016. Further multivariate analysis showed that both cancer-specific and overallsurvival was significantly improved with chemotherapy in patients with MAC, NMAC and SRCC, but not for patients withGCC, MiNENs, NETs and NECs. Number (> 12) of lymph node sampled was associated with survival of patients with mosthistological types of cancer under study. Other prognostic factors related to individual histological types were identified.
Conclusions: Chemotherapy is administrated at highly variable rates in different histological types of appendiceal cancer.Efficacy of chemotherapy in the treatment of these cancers has been improved in recent years and is significantly associatedwith better survival for patients with NMAC, MAC, and SRCC. Adequate lymph node sampling may result in a survival benefitfor most of these patients.
Keywords: Appendiceal cancer, Chemotherapy, Histology, Survival, Adenocarcinoma, Neuroendocrine
© The Author(s). 2021 Open Access This article is licensed under a Creative Commons Attribution 4.0 International License,which permits use, sharing, adaptation, distribution and reproduction in any medium or format, as long as you giveappropriate credit to the original author(s) and the source, provide a link to the Creative Commons licence, and indicate ifchanges were made. The images or other third party material in this article are included in the article's Creative Commonslicence, unless indicated otherwise in a credit line to the material. If material is not included in the article's Creative Commonslicence and your intended use is not permitted by statutory regulation or exceeds the permitted use, you will need to obtainpermission directly from the copyright holder. To view a copy of this licence, visit http://creativecommons.org/licenses/by/4.0/.The Creative Commons Public Domain Dedication waiver (http://creativecommons.org/publicdomain/zero/1.0/) applies to thedata made available in this article, unless otherwise stated in a credit line to the data.
* Correspondence: [email protected] of Colorectal Surgery, Cancer Hospital of the University ofChinese Academy of Sciences, Zhejiang Cancer Hospital, Hangzhou 310022,China
Wang et al. BMC Cancer (2021) 21:778 https://doi.org/10.1186/s12885-021-08502-3

IntroductionAppendiceal cancer is a rare and highly heterogeneousmalignancy and its incidence is on the rise [1]. This cancerincludes a wide spectrum of histological types including:mucinous adenocarcinoma (MAC), non-mucinous adeno-carcinoma (NMAC), signet-ring cell adenocarcinomas(SRCC), mixed neuroendocrine non-neuroendocrine neo-plasms (MiNENs), goblet cell carcinoid (GCC) neuroen-docrine tumors (NETs), neuroendocrine carcinomas(NECs), and others [2]. These histological types displaydramatically different biological phenotypes and indicatedifferent prognoses [2, 3].Though surgery is the first option in the treatment of
appendiceal cancer, chemotherapy has been appliedusing a protocol similar to that used to treat colorectalcancer [3, 4]. The rarity and high heterogeneity make itdifficult to examine the effect of chemotherapy in treat-ment of appendiceal cancer in systematic studies [5, 6].Most previous studies had a limited sample size from asingle institution, and only included certain histologicaltypes [7–10]. The effect of chemotherapy in some histo-logical types is not well understood. In addition, it is un-known whether chemotherapy has had an improvedeffect in recent years.Using the Surveillance, Epidemiology, and End Results
(SEER) database, this study sought to determine the statusof chemotherapy as a treatment of the different histo-logical types of appendiceal cancer. Based on cancer-specific and overall survival outcomes, we will further de-termine which histological types were responsive tochemotherapy. As there are currently no standard guide-lines for chemotherapy in the treatment of appendicealcancer, the findings of this study may aid in improving themanagement and survival of appendiceal cancer patients.
Patients and methodsAppendiceal cancer patients diagnosed between1998 and2016 were selected from the Surveillance Epidemiologyand End Results (SEER) database using the SEERStatsoftware 8.3.8 [11]. Histology codes were obtained fromthe Third Edition of the International Classification ofDiseases for Oncology (ICD-O-3). Patients with the fol-lowing histological types were included: non-mucinousadenocarcinoma (NMAC) 8140, 8144, 8211, 8255, 8262,8310, 8440 and 8460; mucinous adenocarcinoma (MAC)8470, 8471, 8480 and 8481; goblet cell carcinoid (GCC)8243 and 8245; signet ring cell carcinoma (SRCC) 8490;mixed neuroendocrine non-neuroendocrine neoplasms(MiNENs) 8244; neuroendocrine tumors (NETs) 8240and 8241; neuroendocrine carcinomas (NECs) 8013 and8246 [2]. Patients were excluded if their age at diagnosiswas less than 18 years, or if their survival time or T, N,M stage information was unknown, or if they had had atumor at Tis or T0 stage.
The following clinicopathological variables were ex-tracted from the database: age at diagnosis, year of diag-nosis, gender, race, region, status of serum CEA, tumorsize, histology, tumor grade, tumor deposit, T, N and Mstages, number of lymph node harvested, surgery,chemotherapy, survival time, cancer-specific death, andoverall death. Race was grouped into four categories:white, black, other and unknown. Tumor size was cate-gorized into three groups: ≤ 5 cm, > 5 cm and unknown.Number of lymph nodes harvested were divided intothree groups: ≤ 12, > 12 and unknown. The extent ofsurgery was categorized into three groups: less thanhemicolectomy, hemicolectomy or more, and unknown.The Human Subjects Committee of Institutional Re-
view Board in our hospital exempted this study from re-view since preexisting data with no personal identifierswas used.
Statistical analysisContinuous data were presented as mean ± standard de-viation (SD), or median (range). Differences were ana-lyzed using T test or One-Way ANOVA after a squareroot transformation, if necessary. Categorical data wereanalyzed using the Chi-square test. The survival curveswere constructed using the Kaplan-Meier method andLog-rank test was applied to interrogate significant dif-ferences. Univariate and multivariate Cox proportionalhazard models were used to compare the impact ofchemotherapy and other variables on both cancer-specific and overall survival in appendiceal cancer pa-tients. A backward stepwise selection was used to selectvariables to build multivariate models, in which chemo-therapy was always included. Briefly, all variables werefirst included in a model. During the backward selection,a variable with the highest P value was removed fromeach step until P values for each variable in the finalmodel were less than 0.05. A two-sided p ≤ 0.05 wasconsidered statistically significant. All statistical analyseswere completed using SAS software V9.3 (SAS Institute,Cary, NC).
ResultsA total of 8733 appendiceal cancer patients at a medianage of 57 (range 18–99) years were identified from thedatabase. The most common histological type was MAC(32.4%), followed by NMAC (20.2%), NETs (19.1%) andGCC (12.5%), whereas SRCC, NECs and MiNENsaccounted for 6.6, 4.8 and 4.5%, respectively. During thestudy period, 1709 (19.6%) patients died of the diseaseand 2733 (31.3%) died from all causes (Table 1). Afterstratification by demographics and by whether patientshad received chemotherapy, the data revealed thatchemotherapy was administered at highly variable ratesamong different histological types. As high as 64.0%
Wang et al. BMC Cancer (2021) 21:778 Page 2 of 21

Table 1 Characteristics of appendiceal cancer patients treated with or without chemotherapy in 1998–2016
Variable All ptients Chemotherapy status P value
(n = 8733) No (n = 5957) Yes (n = 2776)
Age
Mean ± SD 56.3 ± 16.4 56.2 ± 18 56.6 ± 12.3 < 0.0001
Median (range) 57 (18–99) 57 (18–99) 57 (19–89)
≤ 56 5075 (58.1) 2885 (48.4) 1351 (48.7) 0.4273
> 56 3658 (41.9) 3072 (51.6) 1425 (51.3)
Gender
Male 3947 (45.2) 3276 (68.5) 1510 (31.6) 0.0603
Female 4786 (54.8) 2681 (67.9) 1266 (32.1)
Marital status
Marrieda 5067 (58) 3215 (63.5) 1852 (36.6) < 0.0001
Unmarried 3262 (37.4) 2423 (74.3) 839 (25.7)
Unknown 404 (4.6) 319 (79) 85 (21)
Race
African American 854 (9.8) 576 (67.5) 278 (32.6) 0.0001
White 7299 (83.6) 4994 (68.4) 2305 (31.6)
Other 515 (5.9) 328 (63.7) 187 (36.3)
Unknown 65 (0.7) 59 (90.8) 6 (9.2)
Region
West 4185 (47.9) 2899 (69.3) 1286 (30.7) 0.0803
South 2078 (23.8) 1410 (67.9) 668 (32.2)
Midwest 824 (9.4) 535 (64.9) 289 (35.1)
Northwest 1646 (18.9) 1113 (67.6) 533 (32.4)
CEA
Negative 1126 (12.9) 513 (45.6) 613 (54.4) < 0.0001
Positive 1097 (12.6) 430 (39.2) 667 (60.8)
Unknown 6510 (74.5) 5014 (77) 1496 (23)
Tumor deposit
Negative 2222 (25.4) 1391 (62.6) 831 (37.4) < 0.0001
Positive 438 (5) 128 (29.2) 310 (70.8)
Unknown 6073 (69.5) 4438 (73.1) 1635 (26.9)
Tumor size
< 2 cm 2742 (31.4) 2467 (90) 275 (10) < 0.0001
≥ 2 cm 3668 (42) 2086 (56.9) 1582 (43.1)
Unknown 2323 (26.6) 1404 (60.4) 919 (39.6)
Harvested lymph nodes
≤ 12 5098 (58.4) 3804 (74.6) 1294 (25.4) < 0.0001
> 12 3527 (40.4) 2093 (59.3) 1434 (40.7)
Unknown 108 (1.2) 60 (55.6) 48 (44.4)
Histology
GCC 1087 (12.5) 927 (85.3) 160 (14.7) < 0.0001
MAC 2831 (32.4) 1518 (53.6) 1313 (46.4)
NMAC 1762 (20.2) 1046 (59.4) 716 (40.6)
SRCC 575 (6.6) 207 (36) 368 (64)
Wang et al. BMC Cancer (2021) 21:778 Page 3 of 21

SRCC, 46.4% MAC, 43.9% MiNENs, and 40.6% NMACpatients received chemotherapy, while only 14.7% GCC,5% NECs and 1.6% NETs patients were treated withchemotherapy. Furthermore, a significantly higher pro-portions of patients that received chemotherapy died ofthe disease (P < 0.0001) or from all causes (P < 0.0001)(Table 1).We then compared the demographic and clinicopatho-
logical characteristics among patients with differenthistological types (Table 2). Patients diagnosed withNETs or NECs were significantly younger at the time ofdiagnosis than patients with other histological types.
None of NETs and only 0.5% of NECs patients hadserum CEA levels measured or tumor deposit examined.It was notable that over 90% of NECs were diagnosed atthe T1 or T2 stages. In contrast, much lower percent-ages of patients with other histological types were atthese earlier stages. Significantly higher proportions ofSRCC (61.4%) and MAC (57.8%) were diagnosed at T4stage. The data also found that both NETs and NECshad significantly smaller tumor sizes, with 65.8 and84.0%, respectively, of tumors less than 2 cm. It is notedthat 72.1% NETs patients had well differentiated cancer.Both NETs and NECs had the smallest percentage of
Table 1 Characteristics of appendiceal cancer patients treated with or without chemotherapy in 1998–2016 (Continued)
Variable All ptients Chemotherapy status P value
(n = 8733) No (n = 5957) Yes (n = 2776)
NECs 421 (4.8) 400 (95) 21 (5)
NETs 1667 (19.1) 1640 (98.4) 27 (1.6)
MiNENs 390 (4.5) 219 (56.2) 171 (43.9)
T stage
T1 2224 (25.5) 2122 (35.6) 102 (3.7) < 0.0001
T2 748 (8.6) 682 (11.5) 66 (2.4)
T3 2680 (30.7) 1904 (32) 776 (28)
T4 3081 (35.3) 1249 (21) 1832 (66)
N stage
N0 6984 (80) 5293 (88.9) 1691 (60.9) < 0.0001
N1 1096 (12.6) 454 (7.6) 642 (23.1)
N2 653 (7.5) 210 (3.5) 443 (16)
M stage
M0 6604 (75.6) 5267 (79.8) 1337 (20.3) < 0.0001
M1 2129 (24.4) 690 (32.4) 1439 (67.6)
Grade
Well differentiated 3015 (34.5) 2475 (82.1) 540 (17.9) < 0.0001
Moderately differentiated 2320 (26.6) 1411 (60.8) 909 (39.2)
Poorly or un-differentiated 1403 (16.1) 576 (41.1) 827 (59)
Unknown 1995 (22.8) 1495 (74.9) 500 (25.1)
Surgery
Less than hemicolectomy 3847 (44.1) 3075 (79.9) 772 (20.1) < 0.0001
Hemicolectomy or more 4406 (50.5) 2600 (59) 1806 (41)
Other 480 (5.5) 282 (58.8) 198 (41.3)
Cancer specific death
No 7024 (80.4) 5232 (74.5) 1792 (25.5) < 0.0001
Yes 1709 (19.6) 725 (42.4) 984 (57.6)
Overall death
No 6000 (68.7) 4456 (74.3) 1544 (25.7) < 0.0001
Yes 2733 (31.3) 1501 (54.9) 1232 (45.1)aUnmarried status, including divorced, separated, widowed and unmarried. SRCC signet ring cell carcinoma; MAC, mucinous adenocarcinomas; NMAC, non-mucinous adenocarcinoma; MiNENs mixed neuroendocrine non-neuroendocrine neoplasms; GCC goblet cell carcinoma; NETs neuroendocrine tumors; NECsneuroendocrine carcinomas
Wang et al. BMC Cancer (2021) 21:778 Page 4 of 21

Table 2 Characteristics of patients with different histological types of appendiceal cancer
Variable Histological Types P value
GCC(n = 1087)
MAC(n = 2831)
SRCC(n = 575)
NECs(n = 421)
NETs(n = 1667)
NMAC(n = 1762)
MiNENs(n = 390)
Age
Mean ± SD 56.5 ± 13.6 59.6 ± 14.2 59.8 ± 12.7 45.7 ± 17.3 44.9 ± 17.8 62.8 ± 14.8 58.4 ± 12. < 0.0001
Median (range) 56 (18–99) 60 (19–98) 59 (27–94) 46 (18–94) 44 (18–95) 63 (19–97) 58 (20–89)
≤ 56 552 (50.8) 1181 (41.7) 243 (42.3) 300 (71.3) 1199 (71.9) 591 (33.5) 170 (43.6) < 0.0001
> 56 535 (49.2) 1650 (58.3) 332 (57.7) 121 (28.7) 468 (28.1) 1171 (66.5) 220 (56.4)
Gender
Male 529 (48.7) 1272 (44.9) 238 (41.4) 156 (37.1) 642 (38.5) 912 (51.8) 198 (50.8) < 0.0001
Female 558 (51.3) 1559 (55.1) 337 (58.6) 265 (63) 1025 (61.5) 850 (48.2) 192 (49.2)
Marital status
Married 650 (59.8) 1787 (63.1) 357 (62.1) 197 (46.8) 792 (47.5) 1041 (59.1) 243 (62.3) < 0.0001
Unmarrieda 386 (35.5) 946 (33.4) 194 (33.7) 182 (43.2) 769 (46.1) 655 (37.2) 130 (33.3)
Unknown 51 (4.7) 98 (3.5) 24 (4.2) 42 (10) 106 (6.4) 66 (3.8) 17 (4.4)
Race
African American 103 (9.5) 256 (9) 55 (9.6) 34 (8.1) 135 (8.1) 236 (13.4) 35 (9) < 0.0001
White 938 (86.3) 2341 (82.7) 478 (83.1) 359 (85.3) 1447 (86.8) 1395 (79.2) 341 (87.4)
Other 40 (3.7) 223 (7.9) 41 (7.1) 17 (4) 60 (3.6) 122 (6.9) 12 (3.1)
Unknown 6 (0.6) 11 (0.4) 1 (0.2) 11 (2.6) 25 (1.5) 9 (0.5) 2 (0.5)
Region
West 467 (43) 1506 (53.2) 275 (47.8) 171 (40.6) 782 (46.9) 820 (46.5) 164 (42.1) < 0.0001
South 271 (24.9) 585 (20.7) 132 (23) 110 (26.1) 417 (25) 467 (26.5) 96 (24.6)
Midwest 120 (11) 252 (8.9) 45 (7.8) 52 (12.4) 140 (8.4) 153 (8.7) 62 (15.9)
Northwest 229 (21.1) 488 (17.2) 123 (21.4) 88 (20.9) 328 (19.7) 322 (18.3) 68 (17.4)
CEA
Negative 121 (11.1) 430 (15.2) 145 (25.2) 2 (0.5) 0 (0) 348 (19.8) 80 (20.5) < 0.0001
Positive 40 (3.7) 671 (23.7) 100 (17.4) 2 (0.5) 0 (0) 254 (14.4) 30 (7.7)
Unknown 926 (85.2) 1730 (61.1) 330 (57.4) 417 (99.1) 1667 (100) 1160 (65.8) 280 (71.8)
Deposit
Negative 470 (43.2) 866 (30.6) 158 (27.5) 2 (0.5) 0 (0) 564 (32) 162 (41.5) < 0.0001
Positive 21 (1.9) 176 (6.2) 82 (14.3) 2 (0.5) 0 (0) 123 (7) 34 (8.7)
Unknown 596 (54.8) 1789 (63.2) 335 (58.3) 417 (99.1) 1667 (100) 1075 (61) 194 (49.7)
Tumor size
< 2 cm 383 (35.2) 260 (9.2) 44 (7.7) 277 (65.8) 1400 (84) 312 (17.7) 66 (16.9) < 0.0001
≥ 2 cm 392 (36.1) 1456 (51.4) 334 (58.1) 119 (28.3) 240 (14.4) 927 (52.6) 200 (51.3)
Unknown 312 (28.7) 1115 (39.4) 197 (34.3) 25 (5.9) 27 (1.6) 523 (29.7) 124 (31.8)
Harvested lymph nodes
≤ 12 624 (57.4) 1589 (56.1) 282 (49) 284 (67.5) 1288 (77.3) 880 (49.9) 151 (38.7) < 0.0001
> 12 457 (42) 1199 (42.4) 286 (49.7) 130 (30.9) 364 (21.8) 855 (48.5) 236 (60.5)
Unknown 6 (0.6) 43 (1.5) 7 (1.2) 7 (1.7) 15 (0.9) 27 (1.5) 3 (0.8)
T stage
T1 108 (9.9) 233 (8.2) 20 (3.5) 293 (69.6) 1416 (84.9) 143 (8.1) 11 (2.8) < 0.0001
T2 137 (12.6) 180 (6.4) 14 (2.4) 48 (11.4) 152 (9.1) 204 (11.6) 13 (3.3)
T3 649 (59.7) 783 (27.7) 188 (32.7) 48 (11.4) 80 (4.8) 723 (41) 209 (53.6)
Wang et al. BMC Cancer (2021) 21:778 Page 5 of 21

patients died of the disease or from all causes during thestudy period (Table 2).Univariate survival analysis showed that chemotherapy
was significantly associated with worse cancer-specificsurvival (Hazard ration (HR) =3.54, 95% confidence inter-val (CI) =3.14–3.99, P < 0.0001) (Table 3 and Fig. 1A). Inaddition, histology of SRCC, MAC and NMAC (vs GCC),older age, unmarried status, African American race, Southor Midwest region, positive serum CEA, tumor deposit,tumor size ≥2 cm, advanced T, N, M stages, ≤12 lymphnode harvested, higher grade and extent of surgical inter-vention less than hemicolectomy were associated with re-duced cancer-specific survival (Fig. 1B-H). Multivariateanalysis revealed that chemotherapy was not associatedwith cancer-specific survival (HR = 0.93, 95% CI =0.81–1.07, P = 0.2983). Compared with patients with GCC,
patients with NMAC (HR = 2.26, 95% CI = 1.71–42.99,P < 0.0001), SRCC (HR = 1.89, 95% CI = 1.42–2.55, P <0.0001) and MiNENs (HR = 1.72, 95% CI = 1.23–2.41, P <0.0001) had significantly lower cancer-specific survival,NETs (HR = 0.32, 95% CI =0.16–0.65, P < 0.0001) had sig-nificantly improved cancer-specific survival, and MAC(HR = 1.31, 95% CI =0.99–1.74, P = 0.0609) and NECs(HR = 0.76, 95% CI =0.42–1.4, P = 0.3766) showed no sig-nificant difference. Increased age, unmarried status,African American race, positive serum CEA, tumor de-posit, ≤ 12 lymph node harvested, advanced T stage,lymph node metastasis, distant metastasis, and highergrade, were significantly associated with lower cancer-specific survival (Table 3).Our data showed that chemotherapy was significantly
associated with worse overall survival (HR = 2.11, 95%
Table 2 Characteristics of patients with different histological types of appendiceal cancer (Continued)
Variable Histological Types P value
GCC(n = 1087)
MAC(n = 2831)
SRCC(n = 575)
NECs(n = 421)
NETs(n = 1667)
NMAC(n = 1762)
MiNENs(n = 390)
T4 193 (17.8) 1635 (57.8) 353 (61.4) 32 (7.6) 19 (1.1) 692 (39.3) 157 (40.3)
N stage
N0 950 (87.4) 2387 (84.3) 289 (50.3) 337 (80.1) 1534 (92) 1236 (70.2) 251 (64.4) < 0.0001
N1 91 (8.4) 291 (10.3) 136 (23.7) 72 (17.1) 128 (7.7) 312 (17.7) 66 (16.9)
N2 46 (4.2) 153 (5.4) 150 (26.1) 12 (2.9) 5 (0.3) 214 (12.2) 73 (18.7)
M stage
M0 1003 (92.3) 1608 (56.8) 285 (49.6) 397 (94.3) 1646 (98.7) 1377 (78.2) 288 (73.9) < 0.0001
M1 84 (7.7) 1223 (43.2) 290 (50.4) 24 (5.7) 21 (1.3) 385 (21.9) 102 (26.2)
Grade
Well differentiated 165 (15.2) 1054 (37.2) 11 (1.9) 304 (72.2) 1201 (72.1) 244 (13.9) 36 (9.2) < 0.0001
Moderately differentiated 142 (13.1) 973 (34.4) 35 (6.1) 50 (11.9) 136 (8.2) 928 (52.7) 56 (14.4)
Poorly or un-differentiated 88 (8.1) 296 (10.5) 381 (66.3) 31 (7.4) 9 (0.5) 441 (25) 157 (40.3)
Unknown 692 (63.7) 508 (17.9) 148 (25.7) 36 (8.6) 321 (19.3) 149 (8.5) 141 (36.2)
Surgery
Less than hemicolectomy 489 (45) 983 (34.7) 167 (29) 246 (58.4) 1216 (73) 619 (35.1) 127 (32.6) < 0.0001
Hemicolectomy or more 561 (51.6) 1631 (57.6) 366 (63.7) 151 (35.9) 380 (22.8) 1064 (60.4) 253 (64.9)
Other 37 (3.4) 217 (7.7) 42 (7.3) 24 (5.7) 71 (4.3) 79 (4.5) 10 (2.6)
Chemotherapy
No 927 (85.3) 1518 (53.6) 207 (36) 400 (95) 1640 (98.4) 1046 (59.4) 219 (56.2) < 0.0001
Yes 160 (14.7) 1313 (46.4) 368 (64) 21 (5) 27 (1.6) 716 (40.6) 171 (43.9)
Cancer specific death
No 968 (89.1) 2135 (75.4) 313 (54.4) 403 (95.7) 1656 (99.3) 1259 (71.5) 290 (74.4) < 0.0001
Yes 119 (11) 696 (24.6) 262 (45.6) 18 (4.3) 11 (0.7) 503 (28.6) 100 (25.6)
Overall death
No 837 (77) 1779 (62.8) 221 (38.4) 372 (88.4) 1605 (96.3) 930 (52.8) 256 (65.6) < 0.0001
Yes 250 (23) 1052 (37.2) 354 (61.6) 49 (11.6) 62 (3.7) 832 (47.2) 134 (34.4)aUnmarried status including, divorced, separated, widowed and unmarried. CI confidence interval; HR hazard ratio; SRCC signet ring cell carcinoma; MAC mucinousadenocarcinomas; NMAC non-mucinous adenocarcinoma; MiNENs mixed neuroendocrine non-neuroendocrine neoplasms; GCC goblet cell carcinoma; NETsneuroendocrine tumors; NECs, neuroendocrine carcinomas
Wang et al. BMC Cancer (2021) 21:778 Page 6 of 21

Table 3 Risk factors correlated with cancer-specific survival in all appendiceal cancer patients
Variable Cancer-specific Survival Overall survival
Univariate P value Multivariate P value Univariate P value Multivariate P value
HR (95% CI) HR (95% CI) HR (95% CI) HR (95% CI)
Age
≤ 56 1 1 1 1
> 56 1.46 (1.3–1.64) <.0001 1.19 (1.05–1.34) 0.0054 1.99 (1.8–2.19) <.0001 1.61 (1.45–1.78) <.0001
Gender
Male 1 1 1
Female 1.06 (0.94–1.19) 0.3459 0.92 (0.84–1.01) 0.0715 0.82 (0.74–0.9) <.0001
Marital status
Married 1 1 1 1
Unmarrieda 1.04 (0.92–1.18) 0.507 1.24 (1.09–1.4) 0.0008 1.17 (1.07–1.29) 0.0011 1.35 (1.22–1.49) <.0001
Unknown 0.78 (0.58–1.06) 0.1106 1.3 (0.96–1.77) 0.092 0.84 (0.66–1.07) 0.1632 1.28 (1–1.63) 0.0501
Race
African American 1 1 1 1
White 0.72 (0.6–0.85) 0.0002 0.75 (0.62–0.9) 0.0017 0.75 (0.65–0.86) <.0001 0.82 (0.71–0.95) 0.0068
Other 0.9 (0.69–1.18) 0.447 0.77 (0.58–1.02) 0.0728 0.82 (0.65–1.02) 0.0744 0.8 (0.63–1.02) 0.0657
Unknown 0.16 (0.04–0.64) 0.0098 0.39 (0.1–1.6) 0.1928 0.16 (0.05–0.49) 0.0014 0.33 (0.11–1.04) 0.0592
Region
West 1 1 1 1
South 1.16 (1.01–1.34) 0.0397 1.22 (1.05–1.42) 0.01 1.16 (1.03–1.3) 0.0124 1.2 (1.06–1.35) 0.0034
Midwest 1.38 (1.14–1.67) 0.0008 1.22 (1–1.49) 0.0478 1.29 (1.1–1.51) 0.0014 1.18 (1–1.39) 0.0475
Northwest 0.93 (0.79–1.1) 0.3925 1.03 (0.87–1.21) 0.7785 0.98 (0.86–1.12) 0.7558 1.06 (0.93–1.21) 0.3898
CEA
Negative 1 1 1 1
Positive 1.82 (1.54–2.15) <.0001 1.4 (1.17–1.67) 0.0006 1.67 (1.45–1.93) <.0001 1.33 (1.14–1.54) 0.0002
Unknown 0.53 (0.45–0.61) <.0001 0.97 (0.83–1.14) 0.7777 0.63 (0.55–0.71) <.0001 0.99 (0.87–1.13) 0.909
Deposit
Negative 1 1 1 1
Positive 4.21 (3.49–5.07) <.0001 1.31 (1.07–1.6) 0.008 3.36 (2.88–3.92) <.0001 1.36 (1.15–1.61) 0.0003
Unknown 1.15 (1–1.32) 0.0431 1.37 (1.19–1.58) <.0001 1.04 (0.93–1.16) 0.4885 1.22 (1.09–1.37) 0.0007
Tumor size
< 2 cm 1 1 1 1
2–2.9 cm 3.45 (2.64–4.5) <.0001 1.23 (0.93–1.62) 0.1461 2.18 (1.8–2.65) <.0001 1.12 (0.91–1.38) 0.2898
≤ 3 cm 5.2 (4.2–6.42) <.0001 1.33 (1.06–1.67) 0.0143 3.19 (2.76–3.69) <.0001 1.25 (1.06–1.47) 0.0085
Unknown 4.53 (3.64–5.65) <.0001 1.33 (1.06–1.69) 0.0163 2.87 (2.46–3.34) <.0001 1.24 (1.05–1.47) 0.0132
Harvested lymph nodes
≤ 12 1 1 1 1
> 12 0.88 (0.78–0.99) 0.0318 0.58 (0.51–0.66) <.0001 0.82 (0.75–0.91) <.0001 0.61 (0.55–0.68) <.0001
Unknown 1.76 (1.14–2.72) 0.0108 0.85 (0.55–1.32) 0.5551 1.46 (1–2.12) 0.0501 0.82 (0.56–1.2) 0.2969
Histology
GCC 1 1 1 1
MAC 2.39 (1.85–3.09) <.0001 1.31 (0.99–1.74) 0.0609 1.81 (1.5–2.19) <.0001 1.16 (0.94–1.43) 0.1765
NMAC 3.59 (2.77–4.67) <.0001 2.26 (1.71–2.99) <.0001 2.91 (2.4–3.53) <.0001 2.05 (1.66–2.53) <.0001
SRCC 6.81 (5.16–8.99) <.0001 1.89 (1.4–2.55) <.0001 4.63 (3.75–5.71) <.0001 1.78 (1.41–2.24) <.0001
Wang et al. BMC Cancer (2021) 21:778 Page 7 of 21

CI =1.93–2.32, P < 0.0001) in a univariate analysis (Table3 and Fig. 2A). Similarly, histology of SRCC, MAC andNMAC, increased age, male, unmarried status, AfricanAmerican race, South or Midwest region, positive serumCEA, tumor deposit, ≤12 lymph node harvested, T3 orT4 stage, lymph node metastasis, distant metastasis,higher grade and less than hemicolectomy were signifi-cantly associated with worse overall survival (Fig. 2B-H).Multivariate analysis showed chemotherapy was signifi-cantly associated with improved overall survival (HR =0.73, 95% CI =0.65–0.82, P < 0.0001). Patients withMiNENs, NMAC and SRCC had significantly worseoverall survival than patients with GCC, whereas
patients with MAC, NECs and NETs had no significantdifference in overall survival compared to patients withGCC. Patients with increased age, unmarried status,African American race, positive serum CEA, ≤12 har-vested lymph nodes, T4 stage, lymph node metastasis,distant metastasis and higher grade were all significantlyassociated with worse overall survival in both univariateand multivariate analysis (Table 3).Univariate analysis indicated that chemotherapy was
significantly associated with worse cancer specific andoverall survival during 1998–2011 (Supplemental dataFig. S1A-B) and 2012–2016 (Supplemental data Fig.S1C-D). Multivariate analysis showed that chemotherapy
Table 3 Risk factors correlated with cancer-specific survival in all appendiceal cancer patients (Continued)
Variable Cancer-specific Survival Overall survival
Univariate P value Multivariate P value Univariate P value Multivariate P value
HR (95% CI) HR (95% CI) HR (95% CI) HR (95% CI)
Age
NECs 0.42 (0.23–0.74) 0.0027 0.76 (0.42–1.4) 0.3776 0.63 (0.44–0.89) 0.0093 0.95 (0.65–1.39) 0.7755
NETs 0.12 (0.06–0.23) <.0001 0.32 (0.16–0.65) 0.0017 0.35 (0.26–0.48) <.0001 0.64 (0.45–0.92) 0.0171
MiNENs 3.03 (2.18–4.2) <.0001 1.72 (1.23–2.41) 0.0016 2.08 (1.61–2.7) <.0001 1.4 (1.07–1.83) 0.0137
T stage
T1 1 1 1 1
T2 1.54 (0.96–2.46) 0.0741 0.77 (0.47–1.24) 0.2788 1.34 (1.03–1.76) 0.0327 0.79 (0.59–1.05) 0.1077
T3 4.51 (3.32–6.13) <.0001 1.51 (1.08–2.12) 0.0165 2.38 (1.99–2.85) <.0001 1.15 (0.93–1.43) 0.1923
T4 12.72 (9.5–17.02) <.0001 2.38 (1.71–3.32) <.0001 5.2 (4.4–6.15) <.0001 1.69 (1.37–2.09) <.0001
N stage
N0 1 1 1 1
N1 3.14 (2.72–3.62) <.0001 2.26 (1.93–2.65) <.0001 2.32 (2.06–2.61) <.0001 2 (1.75–2.28) <.0001
N2 8.15 (7.05–9.42) <.0001 3.03 (2.53–3.62) <.0001 5.8 (5.14–6.56) <.0001 2.89 (2.48–3.37) <.0001
M stage
M0 1 1 1 1
M1 5.46 (4.85–6.16) <.0001 2.45 (2.1–2.86) <.0001 3.47 (3.16–3.81) <.0001 2.04 (1.8–2.31) <.0001
Grade
Well differentiated 1 1 1 1
Moderately differentiated 2.83 (2.33–3.44) <.0001 1.62 (1.32–1.99) <.0001 2.32 (2.01–2.67) <.0001 1.49 (1.28–1.73) <.0001
Poorly or un-differentiated 8.52 (7.08–10.26) <.0001 2.73 (2.2–3.39) <.0001 5.44 (4.73–6.25) <.0001 2.21 (1.87–2.62) <.0001
Unknown 2.53 (2.05–3.11) <.0001 2.16 (1.73–2.69) <.0001 2.08 (1.78–2.42) <.0001 1.71 (1.45–2.02) <.0001
Surgery
Less than hemicolectomy 1 1 1
Hemicolectomy or more 1.43 (1.26–1.63) <.0001 1.22 (1.11–1.35) <.0001 0.89 (0.8–0.98) 0.024
Other 2.88 (2.36–3.52) <.0001 2.16 (1.82–2.56) <.0001 1.51 (1.26–1.81) <.0001
Chemotherapy
No 1 1 1 1
Yes 3.54 (3.14–3.99) <.0001 0.93 (0.8–1.07) 0.2983 2.11 (1.93–2.32) <.0001 0.73 (0.65–0.82) <.0001aUnmarried status including divorced, separated, widowed and unmarried. CI confidence interval; HR hazard ratio; SRCC signet ring cell carcinoma; MAC mucinousadenocarcinomas; NMAC non-mucinous adenocarcinoma; MiNENs mixed neuroendocrine non-neuroendocrine neoplasms; GCC goblet cell carcinoma; NETsneuroendocrine tumors; NECs neuroendocrine carcinomas
Wang et al. BMC Cancer (2021) 21:778 Page 8 of 21

Fig. 1 Cancer specific curves for patients with appendiceal cancer. A Chemotherapy. B Histological types. C Serum CEA. D Tumor size. E Numberof lymph node harvested. LN, lymph node. F Grade. G T stage. H Surgery
Wang et al. BMC Cancer (2021) 21:778 Page 9 of 21

Fig. 2 Overall survival for patients with appendiceal cancer. A Chemotherapy. B Histological types. C Serum CEA. D Tumor size. E Number oflymph node harvested. LN, lymph node. F Grade. G T stage. H Surgery
Wang et al. BMC Cancer (2021) 21:778 Page 10 of 21

was not significantly associated with cancer-specific sur-vival (HR = 1.1, 95% CI =0.92–1.33, P = 0.2937), but wassignificantly associated with improved overall survival(HR = 0.86, 95% CI =0.74–0.99, P = 0.0385) in all pa-tients diagnosed during 1998–2011 (Supplemental dataTable S1). In contrast, chemotherapy significantly im-proved both cancer-specific survival (HR = 0.72, 95% CI=0.58–0.91, P < 0.0001) and overall survival (HR = 0.59,95% CI =0.49–0.71, P < 0.0001) in all patients diagnosedduring 2012–2016 (Table 4).We then determined the effect of chemotherapy in the
treatment of individual histological types. Survival ratesat 5 and 10 years were compared for patients that didand did not undergo chemotherapy (Table 5). Our re-sults revealed that chemotherapy was significantly asso-ciated with lower cancer-specific survival in allhistological types (Fig. 3A-G), and overall survival in allhistologically types except MAC (Fig. 4A-G). Very fewpatients with NETs or NECs received chemotherapy anddied from the disease.Multivariate analysis showed that chemotherapy was
significantly associated with cancer specific in patientswith NMAC only during 2012–2016 (HR = 0.66, 95% CI =0.44–0.99, P = 0.0449), MAC (HR = 0.49, 95% CI =0.31–0.77, P = 0.0021) only during 2009–2016 and SRCC (HR =0.23, 95% CI =0.11–0.50, P = 0.0002) only during 2013–2016. In contrast, there was no significant association be-tween chemotherapy and cancer specific survival in pa-tients with GCC or MiNENs (Table 6) and in patient withNETs or NECs (Supplemental data Table S2). Number (>12) of sampled lymph nodes was significantly associatedwith improved cancer specific survival in patients withNMAC, MAC, and SRCC. Other prognostic factors werealso identified to be associated with cancer specific sur-vival in patients with individual histological type.Multivariate survival analysis revealed that chemotherapy
was significantly associated with overall survival in patientswith MAC (HR= 0.72, 95% CI =0.61–0.86, P < 0.0001),NMAC (HR= 0.72, 95% CI =0.61–0.86, P= 0.0003) andSRCC (HR= 0.62, 95% CI =0.46–0.84, P = 0.0002) during thewhole study period. In contrast, there was no significant as-sociation between chemotherapy and overall survival in pa-tients with GCC, MiNENs (Table 7), NETs and NECs(Supplemental data Table S2). Number (> 12) of harvestedlymph nodes was one of the prognostic factors associatedwith better overall survival in patients with GCC, NMAC,MAC, SRCC and MiNENs. Other prognostic factors associ-ated with overall survival were identified in patients with dif-ferent histological type.
DiscussionThis study examined the use of chemotherapy and itspotential association with survival in patients with differ-ent histological types of appendiceal cancer using the
SEER database. The results revealed that chemotherapywas administrated at highly varied rates among differenthistological types. Chemotherapy significantly improvedcancer-specific survival in all patients diagnosed during2012–2016, and in patients with NMAC during 2012–2016, MAC during 2009–2016 and SRCC during 2013–2016, though chemotherapy was significantly associatedwith overall survival in the entire study period. Thisfinding suggests that chemotherapy provides survivalbenefits in the treatment of appendiceal cancer on thewhole, and particularly for certain histological types. Theefficacy of chemotherapy in the treatment of these can-cers appears to have improved in recent years.This study found that MAC and NMAC were the
most common histological types in all cases examined inthis study. Our results revealed that chemotherapy wassignificantly associated with both improved cancer-specific survival in recent years or overall survival in pa-tients with MAC and NMAC appendiceal cancer. Thebeneficial effect of chemotherapy in treatment of appen-diceal adenocarcinoma has been reported in previousstudies. Using the National Cancer Data Base (NCDB), aretrospective study that included a total of 11,871appendiceal cancer patients diagnosed during 1985 and2006 was carried out. Only the overall survival informa-tion was available in the database. Multivariate analysisshowed that chemotherapy improved overall survival forboth MAC and NMAC in stage I to III disease. Forpatients with stage IV disease, chemotherapy signifi-cantly improved overall survival for those with NMAC,but not MAC [5]. Another study reported on 109 meta-static NMAC appendiceal cancer patients treated withchemotherapy. Patients who received combinationchemotherapy (either oxaliplatin or irinotecan-based)had significantly improved overall survival compared tothose receiving fluoropyrimidine monotherapy, and pa-tients with moderately and poorly differentiated tumorshad similar outcomes [9]. Kolla et al. recently reportedthat in a study of 103 patients with appendiceal adeno-carcinoma, adjuvant chemotherapy following completecytoreduction significantly improved overall survivalcompared to cytoreduction alone [12]. In contrast, otherstudies reported no beneficial effect of chemotherapy inthe treatment of appendiceal adenocarcinoma [6, 13,14].Although SRCC cases only accounted for 6.6% of all
examined appendiceal cancers in this study, these pa-tients were among the highest proportion diagnosed atT4 stage (61.4%) and treated with chemotherapy (60%).Patients with SRCC had significantly lower survival thanother histological types. Multivariate analysis showedthat chemotherapy was significantly associated improvedcancer-specific survival in SRCC patients diagnosed dur-ing 2013–2016 and overall survival in patients in the
Wang et al. BMC Cancer (2021) 21:778 Page 11 of 21

Table 4 Risk factors correlated with cancer-specific and overall survival in all appendiceal cancer patients diagnosed during 2012–2016
Variable Cancer-specific survival Overall survival
HR (95% CI) P value HR (95% CI) P value
Age
≤ 56 1
> 56 1.63 (1.39–1.92) <.0001
Sex
Male 1
Female 0.83 (0.71–0.96) 0.015
Marital status
Married 1 1
Unmarrieda 1.24 (1.02–1.5) 0.03 1.24 (1.06–1.45) 0.0065
Unknown 1.09 (0.66–1.8) 0.7293 1.18 (0.82–1.71) 0.3771
Region
West 1
South 1.37 (1.14–1.64) 0.0006
Midwest 1.25 (0.97–1.61) 0.0847
Northwest 1.19 (0.96–1.47) 0.1055
CEA
Negative 1 1
Positive 1.49 (1.13–1.96) 0.0052 1.3 (1.02–1.64) 0.0316
Unknown 0.91 (0.71–1.19) 0.4996 0.95 (0.77–1.18) 0.6546
Deposit
Negative 1 1
Positive 1.45 (1.11–1.9) 0.0064 1.53 (1.22–1.91) 0.0002
Unknown 1.44 (1.15–1.8) 0.0013 1.23 (1.02–1.48) 0.027
Harvested lymph nodes 1
≤ 12 0.56 (0.46–0.69) <.0001
> 12 1.12 (0.49–2.57) 0.7879
Unknown
Histology
GCC 1 1
MAC 1.8 (1.17–2.78) 0.0075 1.6 (1.16–2.22) 0.0046
NMAC 2.76 (1.81–4.21) <.0001 2.56 (1.86–3.5) <.0001
SRCC 2.21 (1.39–3.52) 0.0009 2.18 (1.53–3.12) <.0001
MiNENs 2.19 (1.32–3.66) 0.0026 1.67 (1.11–2.52) 0.0136
NECs 0.54 (0.19–1.5) 0.235 0.99 (0.54–1.81) 0.9704
NETs 0.3 (0.12–0.73) 0.0086 0.89 (0.54–1.46) 0.6515
T stage
T1 1 1
T2 0.73 (0.34–1.57) 0.4247 0.95 (0.6–1.49) 0.8078
T3 1.14 (0.65–1.99) 0.642 1.21 (0.83–1.77) 0.322
T4 1.71 (1–2.94) 0.0516 1.73 (1.19–2.51) 0.0042
N stage
N0 1 1
Wang et al. BMC Cancer (2021) 21:778 Page 12 of 21

Table 4 Risk factors correlated with cancer-specific and overall survival in all appendiceal cancer patients diagnosed during 2012–2016 (Continued)
Variable Cancer-specific survival Overall survival
HR (95% CI) P value HR (95% CI) P value
N1 2.46 (1.91–3.17) <.0001 0.56 (0.48–0.66) <.0001
N2 3.73 (2.84–4.9) <.0001 1.18 (0.62–2.24) 0.6124
M stage
M0 1 1
M1 2.54 (1.98–3.26) <.0001 2.15 (1.76–2.62) <.0001
Grade
Well differentiated 1 1
Moderately differentiated 2.38 (1.66–3.42) <.0001 1.84 (1.44–2.36) <.0001
Poorly or un-differentiated 3.4 (2.32–4.97) <.0001 2.46 (1.88–3.23) <.0001
Unknown 3.2 (2.18–4.71) <.0001 2.42 (1.85–3.15) <.0001
Chemotherapy
No 1 1
Yes 0.72 (0.58–0.91) 0.0051 0.59 (0.49–0.71) <.0001aUnmarried status, including divorced, separated, widowed and unmarried. CI confidence interval; HR hazard ratio; SRCC signet ring cell carcinoma; MAC, mucinousadenocarcinomas; NMAC non-mucinous adenocarcinoma; MiNENs mixed neuroendocrine non-neuroendocrine neoplasms; GCC goblet cell carcinoma; NETsneuroendocrine tumors; NECs neuroendocrine carcinomas
Table 5 Comparison of survival rates between patients treated with or without chemotherapy in appendiceal cancer of differenthistological types
Cancer-specific death Overall death
Case (%) Deaths 5 years 10 years P value Case (%) Deaths 5 years 10 years P value
GCC
No chemotherapy 927 (85.3) 68 0.9364 0.8669 <.0001 927 (85.3) 183 0.8255 0.6896 <.0001
Chemotherapy 160 (14.7) 51 0.5455 0.4994 160 (14.7) 67 0.4678 0.3588
MAC
No chemotherapy 1518 (53.6) 313 0.7876 0.6911 <.0001 1518 (53.6) 582 0.6584 0.4944 0.281
Chemotherapy 1313 (46.4) 383 0.6599 0.5438 1313 (46.4) 470 0.6078 0.4714
NMAC
No chemotherapy 1046 (59.4) 217 0.7531 0.6998 <.0001 1046 (59.4) 461 0.5621 0.4454 <.0001
Chemotherapy 716 (40.6) 286 0.5231 0.4072 716 (40.6) 371 0.4375 0.318
SRCC
No chemotherapy 207 (36) 68 0.6508 0.4773 <.0001 207 (36) 119 0.4819 0.2768 <.0001
Chemotherapy 368 (64) 194 0.3274 0.2215 368 (64) 235 0.2574 0.166
NECs
No chemotherapy 400 (95) 12 0.9662 0.9304 <.0001 400 (95) 40 0.8896 0.7974 <.0001
Chemotherapy 21 (5) 6 0.5071 0.5071 21 (5) 9 0.4031 0.4031
NETs
No chemotherapy 1640 (98.4) 8 0.8013 <.0001 1640 (98.4) 57 0.9401 0.9177 <.0001
Chemotherapy 27 (1.6) 3 0.8013 27 (1.6) 5 0.7017
MiNENs
No chemotherapy 219 (56.2) 39 0.8021 0.6821 <.0001 219 (56.2) 69 0.7125 0.5378 <.0001
Chemotherapy 171 (43.9) 61 0.4726 0.2989 171 (43.9) 75 0.4092 0.202
Wang et al. BMC Cancer (2021) 21:778 Page 13 of 21
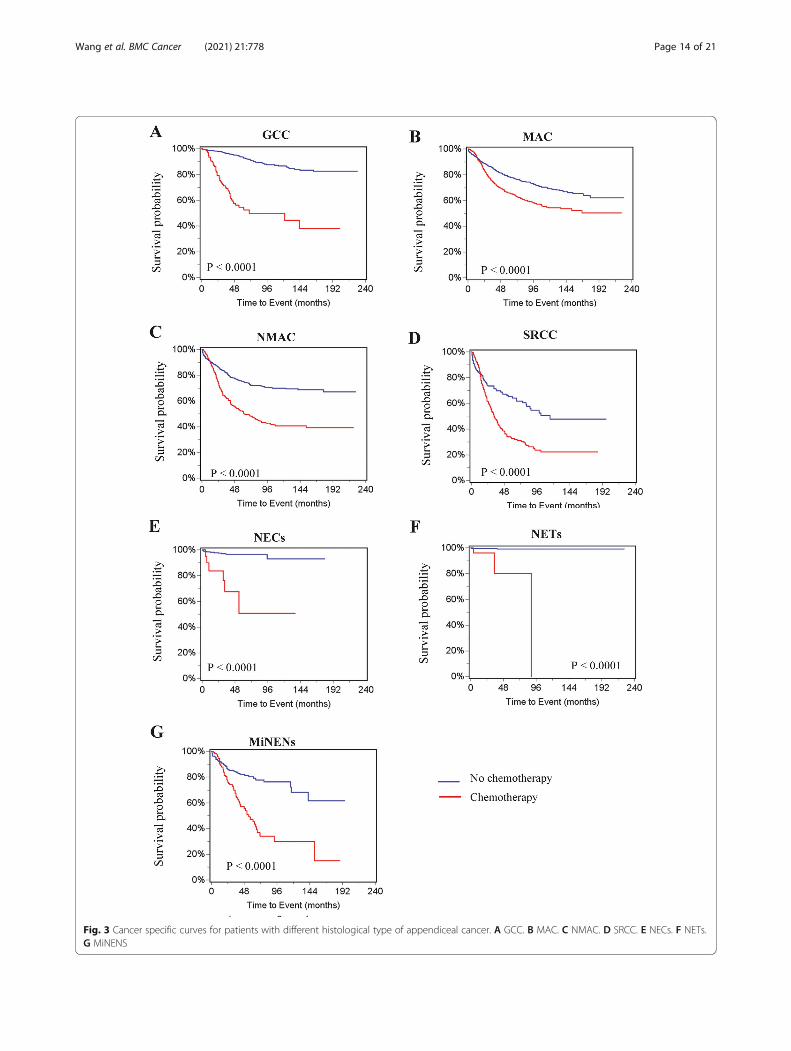
Fig. 3 Cancer specific curves for patients with different histological type of appendiceal cancer. A GCC. B MAC. C NMAC. D SRCC. E NECs. F NETs.G MiNENS
Wang et al. BMC Cancer (2021) 21:778 Page 14 of 21

Fig. 4 Overall survival for patients with different histological type of appendiceal cancer. A GCC. B MAC. C NMAC. D SRCC. E NECs. F NETs.G MiNENS
Wang et al. BMC Cancer (2021) 21:778 Page 15 of 21

Table 6 Risk factors correlated with cancer specific in patients with individual histological type of appendiceal cancerVariable
Study period 2012–1016 2009–2016 2013–2016 2009–2016 1998–2016
Histological type NMAC MAC SRCC GCC MiNENs
HR (95% CI) P value HR (95% CI) P value HR (95% CI) P value HR (95% CI) P value HR(95% CI)
P value
Marital status
Marrieda 1
Unmarried 1.49 (1.18–1.87) 0.0006
Unknown 1.06 (0.57–1.97) 0.8627
Race
African American 1
White 0.22 (0.12–0.41) <.0001
Other 0.09 (0.02–0.49) 0.0053
Unknown 0 0.9866
Region
West 1
South 1.22 (0.92–1.62) 0.1647
Midwest 1.47 (1.01–2.14) 0.0428
Northwest 1.01 (0.72–1.4) 0.9737
CEA
Negative 1 1
Positive 1.86 (1.15–3) 0.0113 2.51 (1.4–4.49) 0.002
Unknown 1.22 (0.77–1.93) 0.3881 1.5 (0.91–2.45) 0.1092
Deposit
Negative 1 1 1
Positive 1.75 (1.09–2.82) 0.0209 1.99 (1.41–2.82) <.0001 2.57 (1.07–6.17) 0.0346
Unknown 1.55 (1.04–2.3) 0.0296 1.4 (1.09–1.81) 0.0095 2.04 (1.16–3.57) 0.0133
Tumor size
< 2 cm 1
2–2.9 cm 2.28 (0.75–6.97) 0.1468
≤ 3 cm 3.14 (1.16–8.51) 0.0242
Unknown 2.82 (1–7.96) 0.0502
Harvested lymph nodes
≤ 12 1 1 1
> 12 0.62 (0.42–0.91) 0.0143 0.66 (0.52–0.84) 0.0006 0.59 (0.39–0.89) 0.0116
Unknown 1.1 (0.33–3.71) 0.8738 0.54 (0.22–1.33) 0.1788 0 0.9885
T stage
T1 1 0.64 (0.08–4.85) 0.6656
T2 0.94 (0.33–2.72) 0.9087 0.8 (0.11–6.07) 0.8308
T3 1.67 (0.86–3.25) 0.1277 1
T4 2.57 (1.39–4.76) 0.0027 2.59 (1.43–4.66) 0.0016
N stage
N0 1 1 1 1
N1 2.01 (1.31–3.08) 0.0015 2.4 (1.76–3.28) <.0001 2.48 (1.46–4.22) 0.0008 2.67 (1.28–5.57) 0.0088
N2 2.69 (1.66–4.38) <.0001 3.81 (2.61–5.55) <.0001 3.23 (1.94–5.39) <.0001 5.65 (2.38–13.41) <.0001
M stage
M0 1 1 1 1 1 1
M1 3.02 (1.97–4.63) <.0001 0.55 (0.42–0.72) <.0001 2.68 (1.65–4.35) <.0001 6.89 (3.2–14.82) <.0001 3.59 (2.05–6.3) <.0001
Grade
Wang et al. BMC Cancer (2021) 21:778 Page 16 of 21

entire study period. Our studies indicate that lymphnode or distant metastasis, advanced stage and positiveserum CEA were associated with significantly reducedcancer-specific survival, whereas patients that had > 12harvested lymph nodes harvested showed improved can-cer specific survival. Based upon this finding, chemo-therapy and harvesting of more than 12 lymph nodes arestrongly recommended in the treatment of these pa-tients. A retrospective study reported systemic chemo-therapy had a survival benefit in patients who weresuboptimal candidates for cytoreductive surgery [7]. An-other retrospective study reported that poorly differenti-ated or SRCC appendiceal cancer patients whoresponded to chemotherapy had improved progression-free survival [8]. However, Barrak et al. reported no sur-vival effect of chemotherapy in the treatment of patientswith stage IV appendiceal cancers including SRCC [10].In this study, 1667 (19.2%) NETs and 421 (4.3%) NECs
were identified from the SEER database. Most of thesecancers were diagnosed at younger ages and at earlystages with smaller tumor sizes. Consistent with previ-ous studies, patients with neuroendocrine appendicealcancers were diagnosed at a much younger age than pa-tients with other primary appendiceal cancers [15, 16].Serum CEA is a commonly examined serum marker inthe diagnosis of gastrointestinal cancer patients. How-ever, this marker was examined in very few patients withNETs and NECs. This study found that a high propor-tion of patients had tumors that were less than 2 cm insize. As a result, these patients had the lowest percent-ages of distant metastasis or lymph node metastasis. Amuch lower proportion of these patients were treatedwith chemotherapy. Taken together, these results imply
that most of these cancers were detected incidentally,during histopathological examination of the appendix[17]. Multivariate analysis indicated that these cancerswere associated with higher rates of survival, comparedto appendiceal cancers of other histological types.Chemotherapy was not significantly associated withcancer-specific or overall survival. Because few patientswere treated with chemotherapy and few deaths oc-curred in these patients, studies with larger sample sizesare needed to study the effect of chemotherapy on thetreatment of these histological types of appendicealcancer.Appendiceal goblet cell carcinoid (GCC) is a histo-
logical type with characteristic goblet cells mixed withneuroendocrine tumors [18, 19]. In this study, a totalnumber of 1087 (12.5%) of GCC patients were identified.Among this group, 119 (11%) patients died of this cancerand 250 (23%) died from all causes. Univariate analysisshowed that chemotherapy was associated with lowercancer-specific and overall survival. Multivariate analysisrevealed that GCC patients had worse prognoses thanclassic NECs and NETs patients [20], but a better sur-vival rate than some other histological types. Multivari-ate analysis of survival rates showed chemotherapy wasnot significantly associated with cancer-specific survivalin patients with GCC during 2009–2016, or overall sur-vival in patients with GCC during 1998–2016. Sporadicstudies previously reported that chemotherapy didn’t sig-nificantly improve survival in patients with GCC appen-diceal cancer [18, 21–23]. Both North AmericanNeuroendocrine Tumor Society (NANETS) and theEuropean Neuroendocrine Tumor Society (ENETS) rec-ommend hemicolectomy as the primary therapy for
Table 6 Risk factors correlated with cancer specific in patients with individual histological type of appendiceal cancer (Continued)Variable
Study period 2012–1016 2009–2016 2013–2016 2009–2016 1998–2016
Histological type NMAC MAC SRCC GCC MiNENs
HR (95% CI) P value HR (95% CI) P value HR (95% CI) P value HR (95% CI) P value HR(95% CI)
P value
Well differentiated 1 1
Moderately differentiated 3.41 (1.43–8.09) 0.0055 1.81 (1.35–2.43) <.0001
Poorly or un-differentiated 4.81 (1.97–11.74) 0.0006 3.05 (2.12–4.39) <.0001
Unknown 2.87 (1.1–7.5) 0.0315 2.41 (1.69–3.43) <.0001
Surgery
Less than hemicolectomy 1
Hemicolectomy or more 0.75 (0.51–1.11) 0.1493
Other 2.72 (1.39–5.35) 0.0036
Chemotherapy
No 1 1 1 1 1
Yes 0.67 (0.45–1) 0.0493 0.78 (0.6–0.997) 0.0477 0.54 (0.33–0.89) 0.0151 2.0 (0.94–4.28) 0.0734 0.78 (0.43–1.4) 0.4029aUnmarried status, including divorced, separated, widowed and unmarried. CI confidence interval; HR hazard ratio; SRCC signet ring cell carcinoma; MAC mucinousadenocarcinomas; NMAC non-mucinous adenocarcinoma; MiNENs mixed neuroendocrine non-neuroendocrine neoplasms; GCC goblet cell carcinoma; NETsneuroendocrine tumors; NECs neuroendocrine carcinomas
Wang et al. BMC Cancer (2021) 21:778 Page 17 of 21

Table 7 Risk factors correlated with overall survival in patients with specific histological types of appendiceal cancerVariable MAC NMAC SRCC GCC MiNENs
HR (95% CI) P value HR (95% CI) P value HR (95% CI) P value HR (95% CI) P value HR (95% CI) P value
Age
≤ 56 1 1 1 1 1
> 56 1.44 (1.22–1.69) <.0001 1.45 (1.2–1.76) 0.0001 1.32 (1.02–1.71) 0.0381 1.6 (1.1–2.31) 0.0128 1.78 (1.14–2.79) 0.0116
Gender
Male 1
Female 0.71 (0.6–0.83) <.0001
Marital status
Married 1 1 1
Unmarrieda 1.41 (1.19–1.66) <.0001 1.51 (1.26–1.8) <.0001 2.12 (1.33–3.37) 0.0015
Unknown 1.18 (0.75–1.85) 0.4711 1.42 (0.93–2.17) 0.1067 1.15 (0.44–3.02) 0.7828
Race
African American 1
White 0.44 (0.27–0.71) 0.0008
Other 0.15 (0.03–0.65) 0.0114
Unknown 0! 0.9752
Region
West 1 1
South 1.25 (1.03–1.52) 0.0224 1.39 (1.13–1.71) 0.0021
Midwest 1.49 (1.15–1.93) 0.0027 1.14 (0.83–1.57) 0.4065
Northwest 1.02 (0.81–1.28) 0.886 1.08 (0.84–1.38) 0.5372
CEA
Negative 1 1 1
Positive 1.36 (1.06–1.75) 0.0168 1.49 (1.14–1.95) 0.0035 1.62 (1.13–2.32) 0.009
Unknown 0.89 (0.7–1.12) 0.3117 1.27 (1–1.6) 0.046 1.12 (0.83–1.52) 0.4668
Deposit
Negative 1 1 1
Positive 1.75 (1.31–2.33) 0.0001 1.38 (1.02–1.86) 0.0365 2.59 (1.29–5.19) 0.0074
Unknown 1.15 (0.95–1.38) 0.1512 1.32 (1.08–1.61) 0.0059 1.25 (0.86–1.82) 0.2347
Harvested lymph nodes
≤ 12 1 1 1 1 1
> 12 0.64 (0.54–0.75) <.0001 0.6 (0.49–0.73) <.0001 0.65 (0.49–0.85) 0.0016 0.51 (0.34–0.77) 0.0015 0.31 (0.19–0.49) <.0001
Unknown 0.59 (0.32–1.08) 0.0866 1.27 (0.66–2.42) 0.4734 1.25 (0.3–5.22) 0.761 4.46 (0.56–35.46) 0.1572 1.97 (0.44–8.92) 0.3789
T stage
T1 1 1 1 1.74 (0.76–3.96) 0.189 0.65 (0.32–1.33) 0.2409 0.74 (0.17–3.15) 0.6795
T2 1.21 (0.72–2.03) 0.4692 0.97 (0.67–1.41) 0.8767 1.42 (0.5–4.04) 0.5097 0.32 (0.12–0.88) 0.0267 0.77 (0.1–6.08) 0.7997
T3 1.47 (1.03–2.1) 0.0363 0.58 (0.4–0.83) 0.0027 1 1 1
T4 1.78 (1.27–2.49) 0.0009 1.45 (1.18–1.79) 0.0005 2.53 (1.74–3.69) <.0001 1.08 (0.67–1.74) 0.7398 2.1 (1.26–3.51) 0.0046
N stage
N0 1 1 1 1 1
N1 2.09 (1.66–2.61) <.0001 1.97 (1.57–2.47) <.0001 1.74 (1.23–2.46) 0.0016 2.28 (1.28–4.05) 0.0052 2.38 (1.26–4.49) 0.0075
N2 3.3 (2.47–4.4) <.0001 2.66 (2.03–3.47) <.0001 2.3 (1.65–3.2) <.0001 4.39 (2.26–8.53) <.0001 5.66 (2.98–10.73) <.0001
M stage
M0 1 1 1 1 1
M1 0.63 (0.52–0.76) <.0001 2.56 (2.02–3.26) <.0001 0.46 (0.33–0.63) <.0001 0.31 (0.17–0.58) 0.0002 0.32 (0.19–0.52) <.0001
Grade
Well differentiated 1 1 0.65 (0.13–3.23) 0.593 1
Moderately differentiated 1.58 (1.3–1.92) <.0001 1.48 (1.06–2.07) 0.0205 1 2.21 (0.61–7.93) 0.2253
Wang et al. BMC Cancer (2021) 21:778 Page 18 of 21

resectable appendiceal GCC [24]. This study found thathemicolectomy or more extensive surgery was signifi-cantly associated with improved survival in patients withGCC. Recent studies reported that adjuvant chemother-apy significantly improved overall survival in a specificgroup of patients, such as including those with lymphnode-positive GCC [25] or stage III GCC after hemico-lectomy [26].MiNEN, previously also referred to as mixed adeno-
neuroendocrine carcinoma (MANEC), is another rarehistological subtype of appendiceal cancer. It is a hybridtumor comprised of both neuroendocrine and non-neuroendocrine adenocarcinoma components. In thisstudy, only 390 (4.5%) patients were given a diagnosis ofMiNENs, but 100 (25.6%) died of this cancer and 134(34.4%) died from all causes. Consistent with findings inprevious studies [2, 27], this study found that patientswith MiNENs had a significantly lower survival rate thanGCC patients. Multivariate analyses demonstrated thatT4 stage and distant metastasis were significantly associ-ated with cancer-specific survival, while increased age,unmarried status, T4 stage, lymph node, distant metasta-sis and higher grade were significantly associated withworse overall survival in patients with MiNENs appendi-ceal cancer. However, chemotherapy was not signifi-cantly associated with cancer-specific or overall survival.This study showed that lymph node metastasis was an
independent prognostic biomarker associated with lowercancer-specific survival in all histological types exceptMiNENS and NETs. and overall survival in all histo-logical types except NETs. Lymph node metastasis hasnot been associated with lower survival in patients withMAC [28]. Interestingly, this study found that cleaning> 12 lymph nodes was associated with improved cancer-specific survival and overall survival in all patients com-bined, or in NMAC, MAC, SRCC and GCC, but only
with improved overall survival in patients with MiNENs.In colorectal cancer, cleaning at least 12 lymph nodesfor adequate staging is recommended by National Com-prehensive Cancer Network (NCCN) guidelines [29],and has been associated with better prognosis [30, 31].Our results suggest that adequate lymph node cleaningmay improve survival in some appendiceal cancerpatients.There are several limitations in this study. It was a
retrospective study, and there may have been a bias inpatient selection that was not controlled for. Due to thecomplex histological types of the disease, misclassifica-tion of certain histological types was likely, particularlyfor NETs and NECs. Detailed information was missingfrom the database, such as drugs, dose and durationused in chemotherapy. The intents (palliative or cura-tive) of chemotherapy were not described in the data-base. It was unknown whether chemotherapy wasprovided before or after the surgery, or both. The data-base lacked important data related to prognosis, such aspatients’ performance, nutritional status, side effects ofchemotherapy and post-operative complications. Cancermarkers and other clinical outcomes, such as the radio-graphic response and recurrence, which were useful inthe evaluation of the efficacy of chemotherapy, were alsonot available in the database.
ConclusionsThe rates at which chemotherapy is used to treat the dif-ferent types of appendiceal cancer are highly variable.Chemotherapy treatments appear to show improved effi-cacy in recent years. Chemotherapy is associated withimproved survival for patients with NMAC, MAC andSRCC types of appendiceal cancer. Adequate lymphnode sampling results in a survival benefit for appendi-ceal cancer patients.
Table 7 Risk factors correlated with overall survival in patients with specific histological types of appendiceal cancer (Continued)Variable MAC NMAC SRCC GCC MiNENs
HR (95% CI) P value HR (95% CI) P value HR (95% CI) P value HR (95% CI) P value HR (95% CI) P value
Poorly or un-differentiated 2.28 (1.75–2.96) <.0001 1.96 (1.38–2.79) 0.0002 2.67 (1.17–6.09) 0.0192 4.26 (1.41–12.88) 0.0102
Unknown 1.65 (1.3–2.09) <.0001 1.93 (1.27–2.92) 0.0021 3.25 (1.39–7.59) 0.0065 2.99 (0.97–9.21) 0.0569
Surgery
Less than hemicolectomy 1 1
Hemicolectomy or more 0.71 (0.59–0.86) 0.0004 0.65 (0.44–0.96) 0.0292
Other 1.7 (1.19–2.41) 0.0034 1.95 (0.97–3.96) 0.0628
Chemotherapy
No 1 1 1 1 1
Yes 0.72 (0.61–0.86) 0.0003 0.61 (0.49–0.76) <.0001 0.62 (0.46–0.84) 0.002 1.29 (0.76–2.19) 0.352 1.07 (0.63–1.8) 0.8081aUnmarried status, including divorced, separated, widowed and unmarried. CI confidence interval; HR hazard ratio; SRCC signet ring cell carcinoma; MAC mucinousadenocarcinomas; NMAC non-mucinous adenocarcinoma; MiNENs mixed neuroendocrine non-neuroendocrine neoplasms; GCC goblet cell carcinoma; NETsneuroendocrine tumors; NECs neuroendocrine carcinomas
Wang et al. BMC Cancer (2021) 21:778 Page 19 of 21

Supplementary InformationThe online version contains supplementary material available at https://doi.org/10.1186/s12885-021-08502-3.
Additional file 1: Table S1. Risk factors associated with cancer-specificand overall survival for all appendiceal patients diagnosed during 1998–2011. Table S2. Risk factors correlated with overall survival in patientswith NECs or NETs appendiceal cancer. Fig. S1. Effect of chemotherapyon cancer specific and overall survival curves in all patients with appendi-ceal cancer during different period. (A) Cancer specific survival (1998–2011). (B) Overall survival (1998–2011). (c) Cancer specific survival (2012–2016). (B) Overall survival (2012–2016).
AcknowledgmentsThis study was funded by the Zhejiang Medical and Health Science andTechnology Project (Grant No. 2021KY575 and No. 2021KY588) and theZhejiang Traditional Chinese Medicine Science and Technology Project(Grant No. 2021ZB030 and No. 2021ZA019).
Conflict of interestThere are no conflicts of interest.
Authors’ contributionsW.C. and G.W. designed the study. W.C., Q. L and G. W researched andanalyzed the data. W. C and G.W. drafted the manuscript. The author(s) readand approved the final manuscript.
Availability of data and materialsAll data can be drawn from the dataset of the Surveillance, Epidemiology,and End Results (SEER) database (http://www.seer.cancer.gov).
Declarations
Ethics approval and consent to participateNot applicable. As the SEER dataset is publicly available and de-identified,therefore, the ethical approval was waived by the ethics committee of ourhospital.
Consent for publicationNot applicable.
Competing interestsThe author(s) declare no competing interests.
Received: 30 March 2021 Accepted: 9 June 2021
References1. Marmor S, Portschy PR, Tuttle TM, Virnig BA. The rise in appendiceal cancer
incidence: 2000-2009. J Gastrointest Surg. 2015;19(4):743–50. https://doi.org/10.1007/s11605-014-2726-7.
2. Zheng M, Li T, Li Y, Zhang T, Zhang L, Ma W, et al. Survival profile andprognostic factors for Appendiceal mixed neuroendocrine non-neuroendocrine neoplasms: a SEER population-based study. Front Oncol.2020;10:1660. https://doi.org/10.3389/fonc.2020.01660.
3. Kelly KJ. Management of Appendix Cancer. Clin Colon Rectal Surg. 2015;28(4):247–55. https://doi.org/10.1055/s-0035-1564433.
4. Tejani MA, ter Veer A, Milne D, Ottesen R, Bekaii-Saab T, Benson AB 3rd,et al. Systemic therapy for advanced appendiceal adenocarcinoma: ananalysis from the NCCN oncology outcomes database for colorectal cancer.J Natl Compr Cancer Netw. 2014;12(8):1123–30. https://doi.org/10.6004/jnccn.2014.0109.
5. Asare EA, Compton CC, Hanna NN, Kosinski LA, Washington MK, Kakar S,et al. The impact of stage, grade, and mucinous histology on the efficacy ofsystemic chemotherapy in adenocarcinomas of the appendix: analysis ofthe National Cancer Data Base. Cancer. 2016;122(2):213–21. https://doi.org/10.1002/cncr.29744.
6. Lu P, Fields AC, Meyerhardt JA, Davids JS, Shabat G, Bleday R, et al. Systemicchemotherapy and survival in patients with metastatic low-grade
appendiceal mucinous adenocarcinoma. J Surg Oncol. 2019;120(3):446–51.https://doi.org/10.1002/jso.25599.
7. Shapiro JF, Chase JL, Wolff RA, Lambert LA, Mansfield PF, Overman MJ, et al.Modern systemic chemotherapy in surgically unresectable neoplasms ofappendiceal origin: a single-institution experience. Cancer. 2010;116(2):316–22. https://doi.org/10.1002/cncr.24715.
8. Lieu CH, Lambert LA, Wolff RA, Eng C, Zhang N, Wen S, et al. Systemicchemotherapy and surgical cytoreduction for poorly differentiated andsignet ring cell adenocarcinomas of the appendix. Ann Oncol. 2012;23(3):652–8. https://doi.org/10.1093/annonc/mdr279.
9. Uemura M, Qiao W, Fournier K, Morris J, Mansfield P, Eng C, et al.Retrospective study of nonmucinous appendiceal adenocarcinomas: role ofsystemic chemotherapy and cytoreductive surgery. BMC Cancer. 2017;17(1):331. https://doi.org/10.1186/s12885-017-3327-0.
10. Barrak D, Desale S, Yoon JJ, Dugan MM, Kodavanti PP, Sampah ME, et al.Appendiceal tumors with glandular and neuroendocrine features exhibitingperitoneal metastases - Critical evaluation of outcome following cytoreductivesurgery with perioperative chemotherapy. Eur J Surg Oncol. 2021;47(6):1278-85.https://doi.org/10.1016/j.ejso.2021.01.010.
11. Surveillance, Epidemiology, and End Results (SEER) Program (www.seer.cancer.gov) SEER*Stat Database: Incidence - SEER Research Data, 9 Registries,Nov 2019 Sub (1975–2017) - Linked To County Attributes - Time Dependent(1990–2017) Income/Rurality, 1969–2017 Counties, National Cancer Institute,DCCPS, Surveillance Research Program, released April 2020, based on theNovember 2019 submission.
12. Kolla BC, Petersen A, Chengappa M, Gummadi T, Ganesan C, Gaertner WB,et al. Impact of adjuvant chemotherapy on outcomes in appendicealcancer. Cancer Med. 2020;9(10):3400–6. https://doi.org/10.1002/cam4.3009.
13. Munoz-Zuluaga CA, King MC, Ledakis P, Gushchin V, Sittig M, Nieroda C,et al. Systemic chemotherapy before cytoreductive surgery andhyperthermic intraperitoneal chemotherapy (CRS/HIPEC) in patients withhigh-grade mucinous carcinoma peritonei of appendiceal origin. Eur J SurgOncol. 2019;45(9):1598–606. https://doi.org/10.1016/j.ejso.2019.05.008.
14. Akce M, Zakka K, Penley M, Jiang R, Khalil L, Alese OB, et al. Impact of high-risk features for stage II adenocarcinoma of the appendix. Cancer Treat ResCommun. 2021;27:100329. https://doi.org/10.1016/j.ctarc.2021.100329.
15. Benedix F, Reimer A, Gastinger I, Mroczkowski P, Lippert H, Kube R. Studygroup Colon/rectum carcinoma primary T: primary appendiceal carcinoma--epidemiology, surgery and survival: results of a German multi-center study. EurJ Surg Oncol. 2010;36(8):763–71. https://doi.org/10.1016/j.ejso.2010.05.025.
16. Pawa N, Clift AK, Osmani H, Drymousis P, Cichocki A, Flora R, et al. SurgicalManagement of Patients with neuroendocrine neoplasms of the appendix:appendectomy or more. Neuroendocrinology. 2018;106(3):242–51. https://doi.org/10.1159/000478742.
17. Emre A, Akbulut S, Bozdag Z, Yilmaz M, Kanlioz M, Emre R, et al. Routinehistopathologic examination of appendectomy specimens: retrospectiveanalysis of 1255 patients. Int Surg. 2013;98(4):354–62. https://doi.org/10.9738/INTSURG-D-13-00098.1.
18. Pape UF, Perren A, Niederle B, Gross D, Gress T, Costa F, et al. ENETSconsensus guidelines for the management of patients with neuroendocrineneoplasms from the jejuno-ileum and the appendix including goblet cellcarcinomas. Neuroendocrinology. 2012;95(2):135–56. https://doi.org/10.1159/000335629.
19. Sinno SAJ, Jurdi NMH. Goblet cell tumors of the appendix: a review. Ann DiagnPathol. 2019;43:151401. https://doi.org/10.1016/j.anndiagpath.2019.151401.
20. Wen KW, Hale G, Shafizadeh N, Hosseini M, Huang A, Kakar S. Appendicealgoblet cell carcinoid: common errors in staging and clinical interpretationwith a proposal for an improved terminology. Hum Pathol. 2017;65:187–93.https://doi.org/10.1016/j.humpath.2017.05.012.
21. Pham TH, Wolff B, Abraham SC, Drelichman E. Surgical and chemotherapytreatment outcomes of goblet cell carcinoid: a tertiary cancer centerexperience. Ann Surg Oncol. 2006;13(3):370–6. https://doi.org/10.1245/ASO.2006.02.016.
22. Lamarca A, Nonaka D, Lopez Escola C, Hubner RA, O'Dwyer S, ChakrabartyB, et al. Appendiceal goblet cell carcinoids: management considerationsfrom a reference peritoneal tumour service Centre and ENETS Centre ofexcellence. Neuroendocrinology. 2016;103(5):500–17. https://doi.org/10.1159/000440725.
23. Shenoy S. Goblet cell carcinoids of the appendix: tumor biology, mutationsand management strategies. World J Gastrointest Surg. 2016;8(10):660–9.https://doi.org/10.4240/wjgs.v8.i10.660.
Wang et al. BMC Cancer (2021) 21:778 Page 20 of 21

24. Boudreaux JP, Klimstra DS, Hassan MM, Woltering EA, Jensen RT, GoldsmithSJ, et al. The NANETS consensus guideline for the diagnosis andmanagement of neuroendocrine tumors: well-differentiated neuroendocrinetumors of the jejunum, ileum, appendix, and cecum. Pancreas. 2010;39(6):753–66. https://doi.org/10.1097/MPA.0b013e3181ebb2a5.
25. AlMasri S, Nassour I, Kowalsky SJ, Hrebinko K, Singhi AD, Lee KK, et al. Therole of adjuvant chemotherapy in non-metastatic goblet cell carcinoid ofthe appendix: an 11-year experience from the National Cancer Database.Ann Surg Oncol. 2020.
26. Zakka K, Williamson S, Jiang R, Reid MD, Alese OB, Shaib WL, et al. Isadjuvant chemotherapy beneficial for stage II-III goblet cell carcinoid/gobletcell adenocarcinoma of the appendix? Surg Oncol. 2021;36:120–9. https://doi.org/10.1016/j.suronc.2020.12.003.
27. Brathwaite S, Rock J, Yearsley MM, Bekaii-Saab T, Wei L, Frankel WL, et al.Mixed Adeno-neuroendocrine Carcinoma: An Aggressive Clinical Entity. AnnSurg Oncol. 2016;23(7):2281–6. https://doi.org/10.1245/s10434-016-5179-2.
28. Shannon AB, Goldberg D, Song Y, Paulson EC, Roses RE, Fraker DL, et al.Predictors of lymph node metastases in patients with mucinousappendiceal adenocarcinoma. J Surg Oncol. 2020;122(3):399–406. https://doi.org/10.1002/jso.25963.
29. Compton CC, Fielding LP, Burgart LJ, Conley B, Cooper HS, Hamilton SR,et al. Prognostic factors in colorectal cancer. College of AmericanPathologists Consensus Statement 1999. Arch Pathol Lab Med. 2000;124(7):979–94.
30. Sarli L, Bader G, Iusco D, Salvemini C, Mauro DD, Mazzeo A, et al. Number oflymph nodes examined and prognosis of TNM stage II colorectal cancer.Eur J Cancer. 2005;41(2):272–9. https://doi.org/10.1016/j.ejca.2004.10.010.
31. Chang GJ, Rodriguez-Bigas MA, Skibber JM, Moyer VA. Lymph node evaluationand survival after curative resection of colon cancer: systematic review. J NatlCancer Inst. 2007;99(6):433–41. https://doi.org/10.1093/jnci/djk092.
Publisher’s NoteSpringer Nature remains neutral with regard to jurisdictional claims inpublished maps and institutional affiliations.
Wang et al. BMC Cancer (2021) 21:778 Page 21 of 21